
Clean Beauty Market By Product Type(Skin Care, Hair Care, Face Products, Oral Care, Makeup), By Product Form(Powder, Liquid, Gel, Cream), By Age Group(Millennials, Gen Z, Gen X , Baby Boomers), By Gender(Women, Men, Kids), By Distribution Channel(Speciality Stores, Online, Retail, Others), By Region And Companies - Industry Segment Outlook, Market Assessment, Competition Scenario, Trends, And Forecast 2024-2033
-
42942
-
Jan 2024
-
179
-


-
This report was compiled by Research Team Research team of over 50 passionate professionals leverages advanced research methodologies and analytical expertise to deliver insightful, data-driven market intelligence that empowers businesses across diverse industries to make strategic, well-informed Correspondence Research Team Linkedin | Detailed Market research Methodology Our methodology involves a mix of primary research, including interviews with leading mental health experts, and secondary research from reputable medical journals and databases. View Detailed Methodology Page
-
Quick Navigation
- Clean Beauty Market Size, Share, Trends Analysis
- Clean Beauty Market Dynamics
- Clean Beauty Market Segmentation Analysis
- Clean Beauty Industry Segments
- Clean Beauty Market Growth Opportunity
- Clean Beauty Market Regional Analysis
- Clean Beauty Industry By Region
- Clean Beauty Market Share Analysis
- Clean Beauty Industry Key Players
- Clean Beauty Market Recent Development
- Report Scope
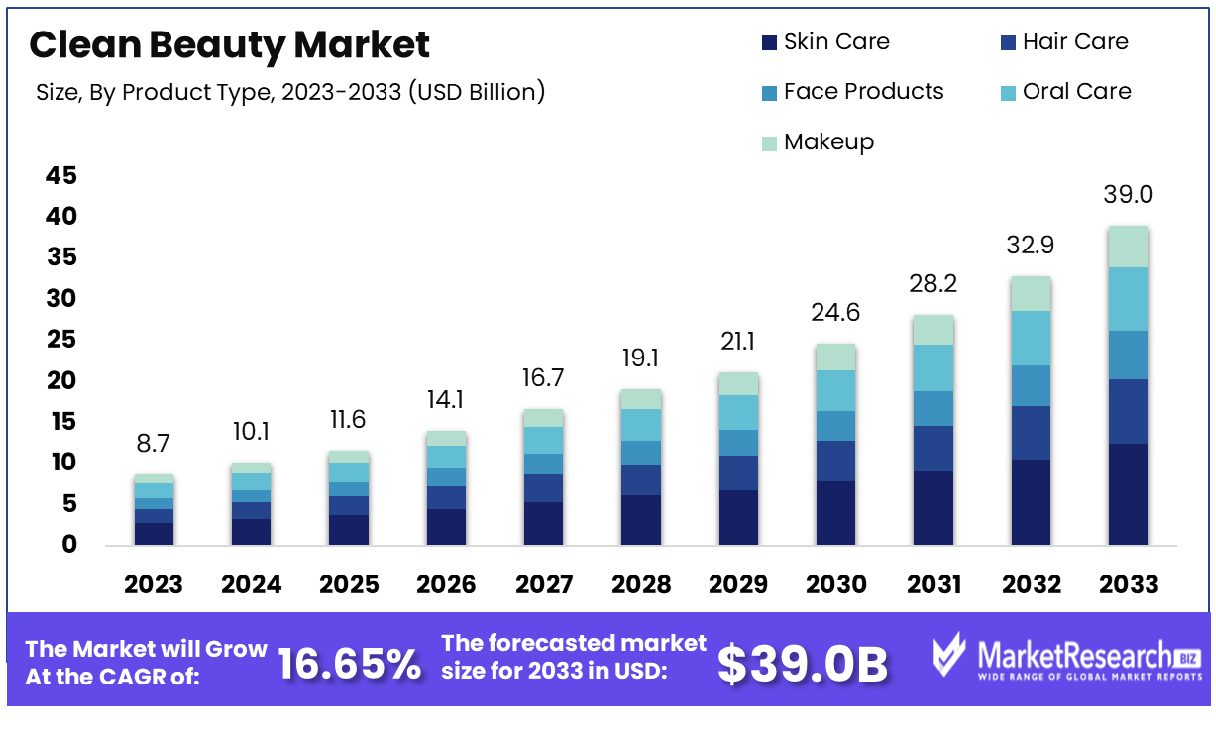
The clean beauty market was valued at USD 8.7 billion in 2023. It is expected to reach USD 39.0 billion by 2033, with a CAGR of 16.65% during the forecast period from 2024 to 2033.
The surge in women population and demand for refined and clean beauty products are some of the main key driving factors for the clean beauty market. Clean beauty refers to cosmetics, skincare, and some of the personal care products that are extracted from clean ingredients and free of harmful elements. These are generally non-toxic, safe, and environmentally friendly components.
The clean beauty transformation is a refusal of conventional beauty brands and their usage, which comprises toxic ingredients like parabens, talc, butylated hydroxyanisole, commonly known as BHA, aluminum elements, artificial colors, phthalates, synthetic fragrances, and many more.
According to an article published by The Conscious Insider, there are more than 50,000 products from 500 firms; 83% of the tested products include titanium dioxide, which is known as a human carcinogen. Most women use 12 types of products in an average day, which comprise 168 different chemicals. For men, it’s an average of six personal care products that contain 85 varied chemicals. Nearly 1 out of 3 beauty products are currently named "clean" in the US. In 2023, Clean Beauty had 5.7 million hashtag views on the social media platform Instagram and 1.3 billion on TikTok. In 2024, it will be 6.3 million on Instagram.
Moreover, presently, the European Union counts 1694 ingredients that are banned from use in cosmetics. Only 11 ingredients are banned from use in cosmetics in the US. Many customers are becoming aware of different skin care problems that are caused by harmful and toxic chemical ingredients in cosmetics. The majority of consumers are opting for pure cosmetics that are safe for their skin and health. There are several advantages to using clean beauty products, such as that they are healthy and safe, as they are formulated to reduce exposure to harmful chemicals and promote a healthy lifestyle.
It is environmentally friendly as it does not use any microplastics or synthetic fragrances. They practice sustainably to eliminate any harmful impact on the environment. Clean beauty products are transparent about the ingredients used in the cosmetic products, as they want customers to use chemical-free products and choose the produce wisely before they buy. The demand for pure beauty products will quickly increase because of the growing awareness of natural and eco-friendly products for the skin, which will assist in expanding the market over the next few years.
Clean Beauty Market Dynamics
Consumer Demand for Natural Ingredients Catalyzes Clean Beauty Market
The clean beauty market is burgeoning, significantly propelled by heightened consumer demand for natural, organic, and sustainably sourced ingredients. This shift is driven by growing awareness of the potential health risks associated with synthetic chemicals in cosmetics. Statistics reveal that, since 2009, 595 cosmetics manufacturers have reported using 88 chemicals linked to health issues in over 73,000 products. This awareness has led to over 65% of consumers seeking clean ingredients, with more than 50% of Gen Z closely scrutinizing product compositions. Brands like Beautycounter have successfully tapped into this market by emphasizing clean products, highlighting a paradigm shift towards safer, more transparent beauty and personal care products.
Social Media and Influencers Amplify Clean Beauty Movement
Social media and influencers play a pivotal role in driving the clean beauty market's growth. Platforms like Instagram and TikTok have become instrumental in raising awareness, with millions of hashtag views dedicated to clean beauty. Brands effectively engage with niche communities, including clean beauty advocates, through campaigns and partnerships with influencers. This digital amplification educates consumers about the benefits of chemical-free products, fostering a more informed and health-conscious audience. The influence of social media in shaping consumer preferences is evident, as it empowers users to make informed decisions and drives the demand for cleaner, safer beauty products.
Regulatory Changes Prompt Clean Beauty Innovation
The increasing regulatory scrutiny of cosmetic ingredients is another significant driver of the clean beauty market. Bans and restrictions on harmful chemicals by entities like the EU and individual states like Washington have compelled brands to reformulate their products. The Toxic-Free Cosmetics Act, enacted in Washington in 2023, which prohibits certain chemicals, exemplifies this trend. This regulatory landscape not only ensures safer products for consumers but also stimulates innovation within the industry. Brands are now incentivized to develop and market products that comply with these stringent standards, leading to an expanded market of clean, non-toxic beauty products.
Higher Price Points Limit Mass Market Adoption of Clean Beauty Products
The higher price points of natural and organic clean beauty products pose a significant barrier to mass market adoption. Smaller indie brands often struggle to achieve economies of scale, leading to higher prices for their products. For example, prices can range significantly, such as $48 for a cleanser or $110 for a moisturizer, with brands like KYPRIS offering products starting at $49.00. This pricing disparity makes it challenging for consumers, especially those with budget constraints, to switch to clean beauty products. The premium pricing of these products limits their accessibility to a broader consumer base, thereby restraining market growth.
Skepticism Over Efficacy and Safety of Natural Ingredients Hinders Clean Beauty Market Growth
Limited clinical testing on the safety and efficacy of some natural ingredients and new botanical extracts in clean beauty products leads to consumer skepticism. This skepticism is compounded by a lack of trust in the industry's sustainability claims. According to a Forbes report, 79% of beauty consumers have doubts about trusting these claims, and less than half believe that beauty brands are transparent about their sustainability practices. This uncertainty about product performance and the authenticity of sustainability claims can deter consumers from choosing clean beauty products, impeding the market's growth. Establishing credibility through rigorous testing and transparent marketing practices is crucial for overcoming these challenges.
Clean Beauty Market Segmentation Analysis
By Product Type Analysis
Skin Care is the dominant segment in the clean beauty market. This prominence is driven by the growing consumer awareness and preference for skincare products made with organic cosmetics, and non-toxic, and sustainable ingredients. The demand for clean skincare products stems from a growing understanding of the impact of synthetic chemicals and preservatives on skin health and the environment. Clean skincare products, which often include cleansers, moisturizers, serums, and treatments, appeal to consumers seeking effective and safe alternatives to the conventional skincare segment. The emphasis on transparency, ethical sourcing, and cruelty-free practices further enhances the appeal of clean skincare products.
Other segments such as Hair Care, Face Products, Oral Care, and Makeup also significantly contribute to the clean beauty market. Hair care products in the field of healthy beauty are gaining popularity due to their absence of harmful chemicals like parabens and sulfates. Face Products, including foundations and concealers, are evolving with clean formulations that promise safety without compromising on performance.
By Product Foam Analysis
Powder is the dominant product form in the clean beauty market. Powder formulations are highly valued for their long shelf life, ease of use, and minimal need for preservatives. This form is particularly popular in products like setting powders, blushes, and eyeshadows, where the absence of liquid reduces the risk of bacterial growth, making them a safer option for consumers looking for clean beauty products. Additionally, powder products often require fewer synthetic additives, aligning well with the clean beauty ethos of using minimal and natural ingredients.
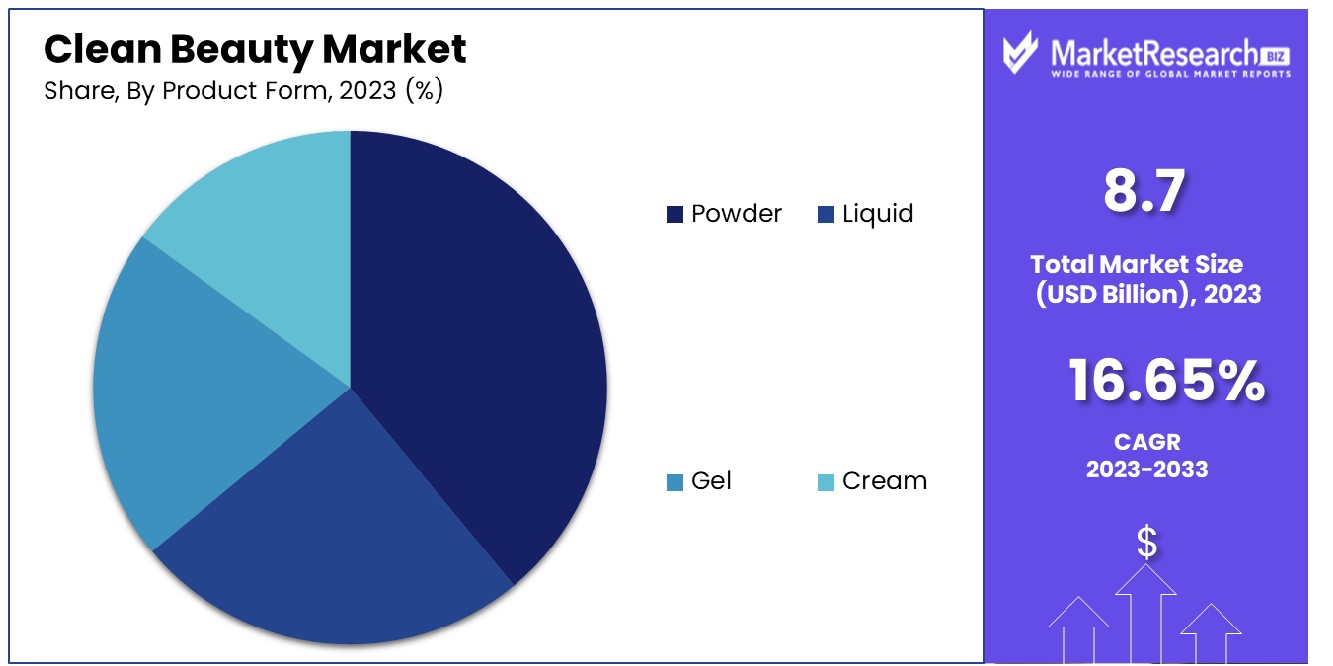
Liquid, Gel, and Cream forms also play significant roles in the clean beauty market. Liquid products, including cleansers and toners, are popular for their ease of application and ability to deliver active ingredients effectively. Gels are favored in skincare for their lightweight texture and hydrating properties, suitable for various skin types. Creams are essential, especially in moisturizers and heavier makeup products, offering rich texture and deep nourishment.
By Age Analysis
Millennials represent the dominant age group in the clean beauty market. This segment's leadership is driven by the millennial generation's heightened awareness and interest in environmental issues, sustainability, and health and wellness. Millennials, typically those born between 1981 and 1996, have shown a strong preference for products that are ethically sourced, environmentally friendly, and free from harmful chemicals. This demographic is more informed and conscious about the ingredients in their beauty products and their impact on health and the environment. They are also willing to invest in higher-quality products that align with these values.
While Millennials lead, other age groups like Gen Z, Gen X, and Baby Boomers also contribute to the market. Gen Z, the digitally native and socially conscious demographic, is increasingly influencing clean beauty trends with their demand for transparency and authenticity. Gen X and Baby Boomers are gradually adopting clean beauty products, focusing more on anti-aging products and those with health benefits. However, Millennials' blend of purchasing power, influence, and alignment with the core principles of clean beauty solidifies their position as the most significant consumer group in this market.
By Gender Analysis
Women are the dominant gender segment in the clean beauty market. Traditionally, women have been the primary consumers of beauty products, and this trend continues in the realm of clean beauty. Women are increasingly seeking beauty products that are safe, non-toxic, and ethically produced. The shift towards clean beauty is largely driven by concerns over harmful chemicals in skincare and makeup products and their potential effects on health, particularly reproductive health.
Men and Kids segments are also emerging in the clean beauty market. The men's skincare segment is growing with an increased interest in grooming and self-care products that are free from harmful chemicals. The kids' segment is gradually gaining traction as parents look for safer and gentler products for their children. Despite these growing segments, women's historical and ongoing role as the primary consumers of beauty products, coupled with their growing environmental and health consciousness, makes them the most influential segment in the clean beauty market.
By Distribution Channel Analysis
Specialty Stores are the dominant distribution channel in the clean beauty market. These stores specialize in health and beauty products and often offer a curated selection of clean beauty brands. Specialty stores are preferred by consumers seeking expert advice, a wide range of products, and the ability to physically evaluate products before purchase. They provide a personalized shopping experience with knowledgeable staff who can assist customers in choosing products that align with their specific needs and values.
Online and Retail channels also play crucial roles in the clean beauty market. Online shopping offers convenience, a wide range of options, and often more competitive pricing. However, the lack of physical product interaction is a limiting factor. Retail channels, including supermarkets and drugstores, are expanding their clean beauty offerings to meet growing demand. Despite the growth in online and retail channels, the personalized service, expert advice, and tactile shopping experience offered by specialty stores keep them at the forefront of clean beauty distribution channels.
Clean Beauty Industry Segments
By Product Type
- Skin Care
- Hair Care
- Face Products
- Oral Care
- Makeup
By Product Form
- Powder
- Liquid
- Gel
- Cream
By Age Group
- Millennials
- Gen Z
- Gen X
- Baby Boomers
By Gender
- Women
- Men
- Kids
By Distribution Channel
- Speciality Stores
- Online
- Retail
- Others
Clean Beauty Market Growth Opportunity
Education on Ingredients and Toxins: A Pathway to Growth in the Clean Beauty Market
The opportunity to educate consumers about the usage of harmful ingredients and chemicals in cosmetics is a key factor in the growth of the market for natural beauty products. Many consumers are unaware of the concerns associated with chemicals like parabens, creating a space for brands to inform and guide them. Content marketing and influencer partnerships can be effective tools for this purpose. For instance, Credo Beauty's "Dirty List" educates consumers about banned ingredients, enhancing brand trust and loyalty. This educational approach not only helps in building an informed customer base but also positions brands as leaders in clean beauty, fostering market growth.
Sustainable Packaging: A Crucial Lever for Expansion in Clean Beauty
The move towards sustainable packaging represents a huge potential growth area in the clean beauty industry. Consumers are increasingly concerned about beauty waste and environmental impact, making eco-friendly packaging a crucial factor in their purchasing decisions. Brands that adopt recycled materials, implement refill systems, and reduce excess packaging are more likely to attract environmentally conscious consumers. For example, Love Beauty and Planet's commitment to using 100% recycled materials resonates with the growing consumer preference for sustainability. By embracing eco-friendly packaging, beauty brands can differentiate themselves in a crowded market and cater to the rising demand for sustainable products.
Clean Beauty Market Regional Analysis
North America Dominates with 38.50% Market Share in the Clean Beauty Market
North America's significant 38.50% market share in the clean beauty industry is driven by heightened consumer awareness and a growing preference for natural and organic personal care products. The region, particularly the United States and Canada, has seen a surge in demand for beauty products that are free from harmful chemicals and are environmentally sustainable. This trend is fueled by a well-informed consumer base that is increasingly concerned about health, wellness, and the environmental impact of their consumption choices. The presence of a large number of innovative clean beauty brands, many of which are pioneering the movement towards green cosmetics, also contributes to the market's growth.
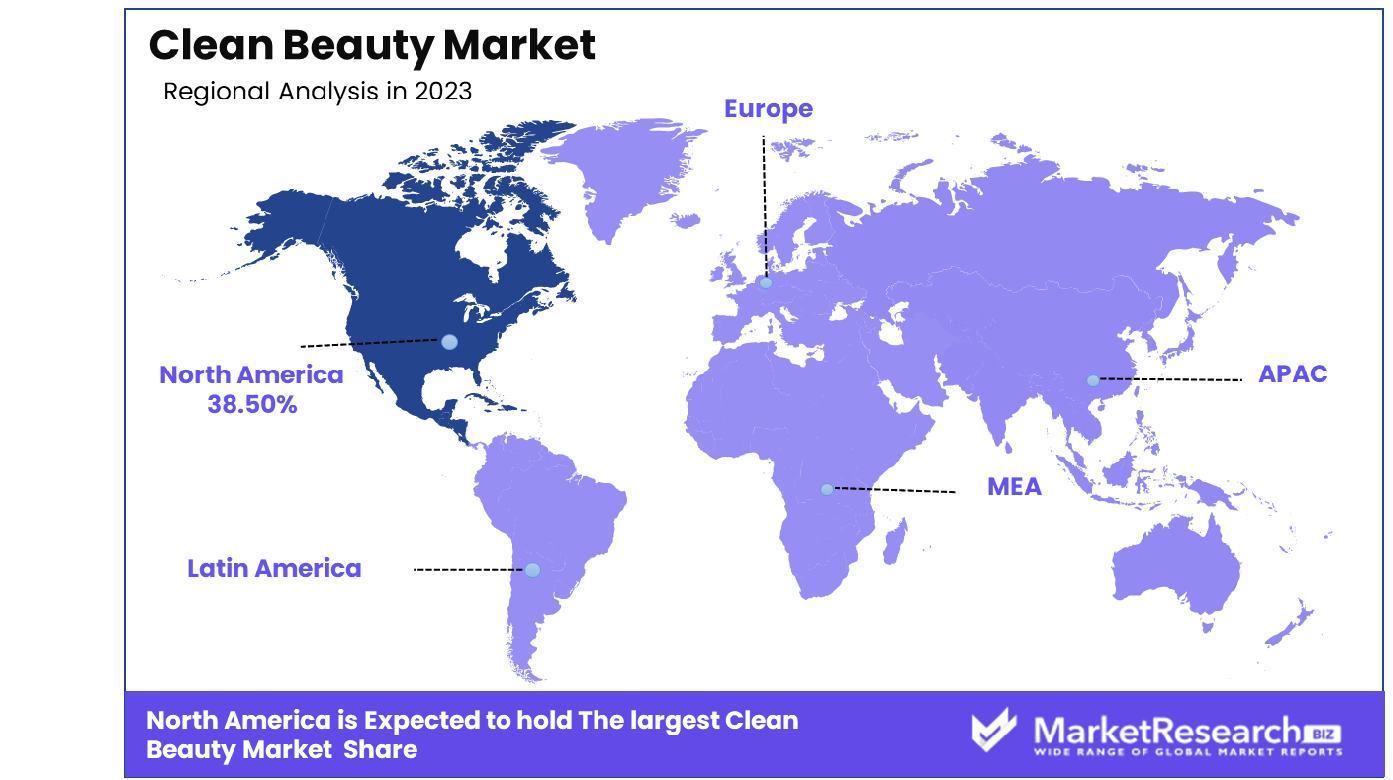
The clean beauty market in North America is characterized by the evolving consumer perception of beauty and wellness. There is a growing emphasis on transparent labeling, ethical sourcing, and cruelty-free practices in the beauty industry. The market is further bolstered by robust digital marketing strategies and a strong online retail presence, making clean beauty products more accessible to a wider audience. Additionally, the influence of celebrities and beauty influencers advocating for clean beauty has significantly impacted consumer choices, further propelling the market.
Europe: Progressive Regulations and Sustainable Practices
Europe’s clean beauty market is driven by progressive regulations and a focus on sustainable practices. Stringent EU regulations on cosmetic ingredients and a high consumer preference for ethically produced, environmentally friendly products fuel market growth. Brands in Europe are increasingly focusing on sustainability, from product formulation to packaging.
Asia-Pacific: Growing Awareness and Changing Consumer Preferences
In Asia-Pacific, the market for natural beauty is growing rapidly, fueled by increased awareness among consumers and shifting preferences towards more natural and safe products for beauty. Countries like South Korea and Japan are leading the way with innovative, clean beauty formulations. The increasing middle-class population and rising disposable incomes in the region are also contributing to the market's growth. The market is expected to benefit from the growing trend of natural and organic ingredients and a rising focus on personal well-being.
Clean Beauty Industry By Region
North America
- The US
- Canada
- Rest of North America
Europe
- Germany
- France
- The UK
- Spain
- Italy
- Russia
- Netherlands
- Rest of Europe
Asia-Pacific
- China
- Japan
- South Korea
- India
- New Zealand
- Singapore
- Thailand
- Vietnam
- Rest of Asia Pacific
Latin America
- Brazil
- Mexico
- Rest of Latin America
Middle East & Africa
- South Africa
- Saudi Arabia
- UAE
- Rest of Middle East & Africa
There is the Clean Beauty Market, a quickly growing industry driven by increasing demand from consumers seeking non-toxic and natural products. The companies included have a major role to play in the development of trends and consumer preferences. Burt's Bees and bareMinerals are prominent players, recognized for their commitment to using natural ingredients and sustainable practices. Their strategic positioning emphasizes purity, ethical sourcing, and eco-friendly packaging, significantly influencing consumer perceptions of clean beauty.
Ere Perez Natural Cosmetics and Juice Beauty, Inc. specialize in organic and plant-based formulations, catering to consumers seeking high-performance beauty products that are also environmentally responsible. Their focus on combining nature with science reflects the industry's shift towards innovative and effective clean beauty solutions.
Honest Beauty LLC, founded by Jessica Alba, has gained notable attention for its transparent approach to ingredient sourcing and product formulation, showcasing the market's potential for brand trust and consumer loyalty. Kjaer Weis and RMS Beauty, with their luxury positioning and high-quality organic ingredients, play crucial roles in elevating the clean beauty market to a premium level.
Clean Beauty Industry Key Players
- Burt's Bees
- bareMinerals
- Ere Perez Natural Cosmetics
- Avon
- Juice Beauty, Inc.
- Honest Beauty LLC
- Kjaer Weis
- Inika
- rms beauty
- Vapour Beauty
- Mineral Fusion Natural Brands
- BITE Beauty
Clean Beauty Market Recent Development
- In January 2024, Glossier introduces the highly anticipated Full Orbit Eye Cream, featuring hydrating ingredients like polyglutamic and hyaluronic acid, niacinamide, arctic microalgae, white hawthorn, and jasmine flower extract. Available online, in stores, and at select Sephora locations, it addresses eye area concerns with 24-hour hydration, depuffing, and dark circle reduction. The launch aligns with industry trends emphasizing hydration, clean beauty, and targeted skincare.
- In January 2024, Amika launches "Stylist Collective," enlisting influencers like Eric Vaughn and Sal Salcedo to shape education initiatives for salons. Following Amika's acquisition, the expected 100% revenue growth signals a commitment to professional hair care, constituting 40% of overall revenue. The brand aims to foster loyalty and industry investment with this program.
- In December 2023, Lumson, a leader in skincare and makeup packaging, expanded into hair care with three comprehensive collections: Slim, Verona, and Round. These turnkey solutions cater to various hair care products, aligning with the holistic trend and addressing the fusion of hair care and skincare.
- In December 2023, Northern California-based clean beauty brand Iris&Romeo expands its retail presence into Sephora with a Series A partnership backed by True Beauty Ventures. The brand emphasizes minimalist, multi-functional products, and plans to enhance retail readiness and expand its team with the new investment.
Report Scope
Report Features Description Market Value (2023) USD 8.7 Billion Forecast Revenue (2033) USD 39.0 Billion CAGR (2024-2032) 16.65% Base Year for Estimation 2023 Historic Period 2016-2023 Forecast Period 2024-2033 Report Coverage Revenue Forecast, Market Dynamics, COVID-19 Impact, Competitive Landscape, Recent Developments Segments Covered By Product Type(Skin Care, Hair Care, Face Products, Oral Care, Makeup), By Product Form(Powder, Liquid, Gel, Cream), By Age Group(Millennials, Gen Z, Gen X , Baby Boomers), By Gender(Women, Men, Kids), By Distribution Channel(Speciality Stores, Online, Retail, Others) Regional Analysis North America - The US, Canada, Rest of North America, Europe - Germany, France, The UK, Spain, Italy, Russia, Netherlands, Rest of Europe, Asia-Pacific - China, Japan, South Korea, India, New Zealand, Singapore, Thailand, Vietnam, Rest of Asia Pacific, Latin America - Brazil, Mexico, Rest of Latin America, Middle East & Africa - South Africa, Saudi Arabia, UAE, Rest of Middle East & Africa Competitive Landscape Burt's Bees, bareMinerals, Ere Perez Natural Cosmetics, Avon, Juice Beauty, Inc., Honest Beauty LLC, Kjaer Weis, Inika, rms beauty, Vapour Beauty, Mineral Fusion Natural Brands, BITE Beauty Customization Scope Customization for segments, region/country-level will be provided. Moreover, additional customization can be done based on the requirements. Purchase Options We have three licenses to opt for Single User License, Multi-User License (Up to 5 Users), Corporate Use License (Unlimited User and Printable PDF) -
- 1. Executive Summary
- 1.1. Definition
- 1.2. Taxonomy
- 1.3. Research Scope
- 1.4. Key Analysis
- 1.5. Key Findings by Major Segments
- 1.6. Top strategies by Major Players
- 2. Global Clean Beauty Market Overview
- 2.1. Clean Beauty Market Dynamics
- 2.1.1. Drivers
- 2.1.2. Opportunities
- 2.1.3. Restraints
- 2.1.4. Challenges
- 2.2. Macro-economic Factors
- 2.3. Regulatory Framework
- 2.4. Market Investment Feasibility Index
- 2.5. PEST Analysis
- 2.6. PORTER’S Five Force Analysis
- 2.7. Drivers & Restraints Impact Analysis
- 2.8. Industry Chain Analysis
- 2.9. Cost Structure Analysis
- 2.10. Marketing Strategy
- 2.11. Russia-Ukraine War Impact Analysis
- 2.12. Opportunity Map Analysis
- 2.13. Market Competition Scenario Analysis
- 2.14. Product Life Cycle Analysis
- 2.15. Opportunity Orbits
- 2.16. Manufacturer Intensity Map
- 2.17. Major Companies sales by Value & Volume
- 2.1. Clean Beauty Market Dynamics
- 3. Global Clean Beauty Market Analysis, Opportunity and Forecast, 2016-2032
- 3.1. Global Clean Beauty Market Analysis, 2016-2021
- 3.2. Global Clean Beauty Market Opportunity and Forecast, 2023-2032
- 3.3. Global Clean Beauty Market Analysis, Opportunity and Forecast, By By Product Type, 2016-2032
- 3.3.1. Global Clean Beauty Market Analysis by By Product Type: Introduction
- 3.3.2. Market Size Absolute $ Opportunity Analysis and Forecast, By By Product Type, 2016-2032
- 3.3.3. Skin Care
- 3.3.4. Hair Care
- 3.3.5. Face Products
- 3.3.6. Oral Care
- 3.3.7. Makeup
- 3.4. Global Clean Beauty Market Analysis, Opportunity and Forecast, By By Product Form, 2016-2032
- 3.4.1. Global Clean Beauty Market Analysis by By Product Form: Introduction
- 3.4.2. Market Size Absolute $ Opportunity Analysis and Forecast, By By Product Form, 2016-2032
- 3.4.3. Powder
- 3.4.4. Liquid
- 3.4.5. Gel
- 3.4.6. Cream
- 3.5. Global Clean Beauty Market Analysis, Opportunity and Forecast, By By Age Group, 2016-2032
- 3.5.1. Global Clean Beauty Market Analysis by By Age Group: Introduction
- 3.5.2. Market Size Absolute $ Opportunity Analysis and Forecast, By By Age Group, 2016-2032
- 3.5.3. Millennials
- 3.5.4. Gen Z
- 3.5.5. Gen X
- 3.5.6. Baby Boomers
- 3.6. Global Clean Beauty Market Analysis, Opportunity and Forecast, By By Gender, 2016-2032
- 3.6.1. Global Clean Beauty Market Analysis by By Gender: Introduction
- 3.6.2. Market Size Absolute $ Opportunity Analysis and Forecast, By By Gender, 2016-2032
- 3.6.3. Women
- 3.6.4. Men
- 3.6.5. Kids
- 3.7. Global Clean Beauty Market Analysis, Opportunity and Forecast, By By Distribution Channel, 2016-2032
- 3.7.1. Global Clean Beauty Market Analysis by By Distribution Channel: Introduction
- 3.7.2. Market Size Absolute $ Opportunity Analysis and Forecast, By By Distribution Channel, 2016-2032
- 3.7.3. Speciality Stores
- 3.7.4. Online
- 3.7.5. Retail
- 3.7.6. Others
- 4. North America Clean Beauty Market Analysis, Opportunity and Forecast, 2016-2032
- 4.1. North America Clean Beauty Market Analysis, 2016-2021
- 4.2. North America Clean Beauty Market Opportunity and Forecast, 2023-2032
- 4.3. North America Clean Beauty Market Analysis, Opportunity and Forecast, By By Product Type, 2016-2032
- 4.3.1. North America Clean Beauty Market Analysis by By Product Type: Introduction
- 4.3.2. Market Size Absolute $ Opportunity Analysis and Forecast, By By Product Type, 2016-2032
- 4.3.3. Skin Care
- 4.3.4. Hair Care
- 4.3.5. Face Products
- 4.3.6. Oral Care
- 4.3.7. Makeup
- 4.4. North America Clean Beauty Market Analysis, Opportunity and Forecast, By By Product Form, 2016-2032
- 4.4.1. North America Clean Beauty Market Analysis by By Product Form: Introduction
- 4.4.2. Market Size Absolute $ Opportunity Analysis and Forecast, By By Product Form, 2016-2032
- 4.4.3. Powder
- 4.4.4. Liquid
- 4.4.5. Gel
- 4.4.6. Cream
- 4.5. North America Clean Beauty Market Analysis, Opportunity and Forecast, By By Age Group, 2016-2032
- 4.5.1. North America Clean Beauty Market Analysis by By Age Group: Introduction
- 4.5.2. Market Size Absolute $ Opportunity Analysis and Forecast, By By Age Group, 2016-2032
- 4.5.3. Millennials
- 4.5.4. Gen Z
- 4.5.5. Gen X
- 4.5.6. Baby Boomers
- 4.6. North America Clean Beauty Market Analysis, Opportunity and Forecast, By By Gender, 2016-2032
- 4.6.1. North America Clean Beauty Market Analysis by By Gender: Introduction
- 4.6.2. Market Size Absolute $ Opportunity Analysis and Forecast, By By Gender, 2016-2032
- 4.6.3. Women
- 4.6.4. Men
- 4.6.5. Kids
- 4.7. North America Clean Beauty Market Analysis, Opportunity and Forecast, By By Distribution Channel, 2016-2032
- 4.7.1. North America Clean Beauty Market Analysis by By Distribution Channel: Introduction
- 4.7.2. Market Size Absolute $ Opportunity Analysis and Forecast, By By Distribution Channel, 2016-2032
- 4.7.3. Speciality Stores
- 4.7.4. Online
- 4.7.5. Retail
- 4.7.6. Others
- 4.8. North America Clean Beauty Market Analysis, Opportunity and Forecast, By Country , 2016-2032
- 4.8.1. North America Clean Beauty Market Analysis by Country : Introduction
- 4.8.2. Market Size Absolute $ Opportunity Analysis and Forecast, Country , 2016-2032
- 4.8.2.1. The US
- 4.8.2.2. Canada
- 4.8.2.3. Mexico
- 5. Western Europe Clean Beauty Market Analysis, Opportunity and Forecast, 2016-2032
- 5.1. Western Europe Clean Beauty Market Analysis, 2016-2021
- 5.2. Western Europe Clean Beauty Market Opportunity and Forecast, 2023-2032
- 5.3. Western Europe Clean Beauty Market Analysis, Opportunity and Forecast, By By Product Type, 2016-2032
- 5.3.1. Western Europe Clean Beauty Market Analysis by By Product Type: Introduction
- 5.3.2. Market Size Absolute $ Opportunity Analysis and Forecast, By By Product Type, 2016-2032
- 5.3.3. Skin Care
- 5.3.4. Hair Care
- 5.3.5. Face Products
- 5.3.6. Oral Care
- 5.3.7. Makeup
- 5.4. Western Europe Clean Beauty Market Analysis, Opportunity and Forecast, By By Product Form, 2016-2032
- 5.4.1. Western Europe Clean Beauty Market Analysis by By Product Form: Introduction
- 5.4.2. Market Size Absolute $ Opportunity Analysis and Forecast, By By Product Form, 2016-2032
- 5.4.3. Powder
- 5.4.4. Liquid
- 5.4.5. Gel
- 5.4.6. Cream
- 5.5. Western Europe Clean Beauty Market Analysis, Opportunity and Forecast, By By Age Group, 2016-2032
- 5.5.1. Western Europe Clean Beauty Market Analysis by By Age Group: Introduction
- 5.5.2. Market Size Absolute $ Opportunity Analysis and Forecast, By By Age Group, 2016-2032
- 5.5.3. Millennials
- 5.5.4. Gen Z
- 5.5.5. Gen X
- 5.5.6. Baby Boomers
- 5.6. Western Europe Clean Beauty Market Analysis, Opportunity and Forecast, By By Gender, 2016-2032
- 5.6.1. Western Europe Clean Beauty Market Analysis by By Gender: Introduction
- 5.6.2. Market Size Absolute $ Opportunity Analysis and Forecast, By By Gender, 2016-2032
- 5.6.3. Women
- 5.6.4. Men
- 5.6.5. Kids
- 5.7. Western Europe Clean Beauty Market Analysis, Opportunity and Forecast, By By Distribution Channel, 2016-2032
- 5.7.1. Western Europe Clean Beauty Market Analysis by By Distribution Channel: Introduction
- 5.7.2. Market Size Absolute $ Opportunity Analysis and Forecast, By By Distribution Channel, 2016-2032
- 5.7.3. Speciality Stores
- 5.7.4. Online
- 5.7.5. Retail
- 5.7.6. Others
- 5.8. Western Europe Clean Beauty Market Analysis, Opportunity and Forecast, By Country , 2016-2032
- 5.8.1. Western Europe Clean Beauty Market Analysis by Country : Introduction
- 5.8.2. Market Size Absolute $ Opportunity Analysis and Forecast, Country , 2016-2032
- 5.8.2.1. Germany
- 5.8.2.2. France
- 5.8.2.3. The UK
- 5.8.2.4. Spain
- 5.8.2.5. Italy
- 5.8.2.6. Portugal
- 5.8.2.7. Ireland
- 5.8.2.8. Austria
- 5.8.2.9. Switzerland
- 5.8.2.10. Benelux
- 5.8.2.11. Nordic
- 5.8.2.12. Rest of Western Europe
- 6. Eastern Europe Clean Beauty Market Analysis, Opportunity and Forecast, 2016-2032
- 6.1. Eastern Europe Clean Beauty Market Analysis, 2016-2021
- 6.2. Eastern Europe Clean Beauty Market Opportunity and Forecast, 2023-2032
- 6.3. Eastern Europe Clean Beauty Market Analysis, Opportunity and Forecast, By By Product Type, 2016-2032
- 6.3.1. Eastern Europe Clean Beauty Market Analysis by By Product Type: Introduction
- 6.3.2. Market Size Absolute $ Opportunity Analysis and Forecast, By By Product Type, 2016-2032
- 6.3.3. Skin Care
- 6.3.4. Hair Care
- 6.3.5. Face Products
- 6.3.6. Oral Care
- 6.3.7. Makeup
- 6.4. Eastern Europe Clean Beauty Market Analysis, Opportunity and Forecast, By By Product Form, 2016-2032
- 6.4.1. Eastern Europe Clean Beauty Market Analysis by By Product Form: Introduction
- 6.4.2. Market Size Absolute $ Opportunity Analysis and Forecast, By By Product Form, 2016-2032
- 6.4.3. Powder
- 6.4.4. Liquid
- 6.4.5. Gel
- 6.4.6. Cream
- 6.5. Eastern Europe Clean Beauty Market Analysis, Opportunity and Forecast, By By Age Group, 2016-2032
- 6.5.1. Eastern Europe Clean Beauty Market Analysis by By Age Group: Introduction
- 6.5.2. Market Size Absolute $ Opportunity Analysis and Forecast, By By Age Group, 2016-2032
- 6.5.3. Millennials
- 6.5.4. Gen Z
- 6.5.5. Gen X
- 6.5.6. Baby Boomers
- 6.6. Eastern Europe Clean Beauty Market Analysis, Opportunity and Forecast, By By Gender, 2016-2032
- 6.6.1. Eastern Europe Clean Beauty Market Analysis by By Gender: Introduction
- 6.6.2. Market Size Absolute $ Opportunity Analysis and Forecast, By By Gender, 2016-2032
- 6.6.3. Women
- 6.6.4. Men
- 6.6.5. Kids
- 6.7. Eastern Europe Clean Beauty Market Analysis, Opportunity and Forecast, By By Distribution Channel, 2016-2032
- 6.7.1. Eastern Europe Clean Beauty Market Analysis by By Distribution Channel: Introduction
- 6.7.2. Market Size Absolute $ Opportunity Analysis and Forecast, By By Distribution Channel, 2016-2032
- 6.7.3. Speciality Stores
- 6.7.4. Online
- 6.7.5. Retail
- 6.7.6. Others
- 6.8. Eastern Europe Clean Beauty Market Analysis, Opportunity and Forecast, By Country , 2016-2032
- 6.8.1. Eastern Europe Clean Beauty Market Analysis by Country : Introduction
- 6.8.2. Market Size Absolute $ Opportunity Analysis and Forecast, Country , 2016-2032
- 6.8.2.1. Russia
- 6.8.2.2. Poland
- 6.8.2.3. The Czech Republic
- 6.8.2.4. Greece
- 6.8.2.5. Rest of Eastern Europe
- 7. APAC Clean Beauty Market Analysis, Opportunity and Forecast, 2016-2032
- 7.1. APAC Clean Beauty Market Analysis, 2016-2021
- 7.2. APAC Clean Beauty Market Opportunity and Forecast, 2023-2032
- 7.3. APAC Clean Beauty Market Analysis, Opportunity and Forecast, By By Product Type, 2016-2032
- 7.3.1. APAC Clean Beauty Market Analysis by By Product Type: Introduction
- 7.3.2. Market Size Absolute $ Opportunity Analysis and Forecast, By By Product Type, 2016-2032
- 7.3.3. Skin Care
- 7.3.4. Hair Care
- 7.3.5. Face Products
- 7.3.6. Oral Care
- 7.3.7. Makeup
- 7.4. APAC Clean Beauty Market Analysis, Opportunity and Forecast, By By Product Form, 2016-2032
- 7.4.1. APAC Clean Beauty Market Analysis by By Product Form: Introduction
- 7.4.2. Market Size Absolute $ Opportunity Analysis and Forecast, By By Product Form, 2016-2032
- 7.4.3. Powder
- 7.4.4. Liquid
- 7.4.5. Gel
- 7.4.6. Cream
- 7.5. APAC Clean Beauty Market Analysis, Opportunity and Forecast, By By Age Group, 2016-2032
- 7.5.1. APAC Clean Beauty Market Analysis by By Age Group: Introduction
- 7.5.2. Market Size Absolute $ Opportunity Analysis and Forecast, By By Age Group, 2016-2032
- 7.5.3. Millennials
- 7.5.4. Gen Z
- 7.5.5. Gen X
- 7.5.6. Baby Boomers
- 7.6. APAC Clean Beauty Market Analysis, Opportunity and Forecast, By By Gender, 2016-2032
- 7.6.1. APAC Clean Beauty Market Analysis by By Gender: Introduction
- 7.6.2. Market Size Absolute $ Opportunity Analysis and Forecast, By By Gender, 2016-2032
- 7.6.3. Women
- 7.6.4. Men
- 7.6.5. Kids
- 7.7. APAC Clean Beauty Market Analysis, Opportunity and Forecast, By By Distribution Channel, 2016-2032
- 7.7.1. APAC Clean Beauty Market Analysis by By Distribution Channel: Introduction
- 7.7.2. Market Size Absolute $ Opportunity Analysis and Forecast, By By Distribution Channel, 2016-2032
- 7.7.3. Speciality Stores
- 7.7.4. Online
- 7.7.5. Retail
- 7.7.6. Others
- 7.8. APAC Clean Beauty Market Analysis, Opportunity and Forecast, By Country , 2016-2032
- 7.8.1. APAC Clean Beauty Market Analysis by Country : Introduction
- 7.8.2. Market Size Absolute $ Opportunity Analysis and Forecast, Country , 2016-2032
- 7.8.2.1. China
- 7.8.2.2. Japan
- 7.8.2.3. South Korea
- 7.8.2.4. India
- 7.8.2.5. Australia & New Zeland
- 7.8.2.6. Indonesia
- 7.8.2.7. Malaysia
- 7.8.2.8. Philippines
- 7.8.2.9. Singapore
- 7.8.2.10. Thailand
- 7.8.2.11. Vietnam
- 7.8.2.12. Rest of APAC
- 8. Latin America Clean Beauty Market Analysis, Opportunity and Forecast, 2016-2032
- 8.1. Latin America Clean Beauty Market Analysis, 2016-2021
- 8.2. Latin America Clean Beauty Market Opportunity and Forecast, 2023-2032
- 8.3. Latin America Clean Beauty Market Analysis, Opportunity and Forecast, By By Product Type, 2016-2032
- 8.3.1. Latin America Clean Beauty Market Analysis by By Product Type: Introduction
- 8.3.2. Market Size Absolute $ Opportunity Analysis and Forecast, By By Product Type, 2016-2032
- 8.3.3. Skin Care
- 8.3.4. Hair Care
- 8.3.5. Face Products
- 8.3.6. Oral Care
- 8.3.7. Makeup
- 8.4. Latin America Clean Beauty Market Analysis, Opportunity and Forecast, By By Product Form, 2016-2032
- 8.4.1. Latin America Clean Beauty Market Analysis by By Product Form: Introduction
- 8.4.2. Market Size Absolute $ Opportunity Analysis and Forecast, By By Product Form, 2016-2032
- 8.4.3. Powder
- 8.4.4. Liquid
- 8.4.5. Gel
- 8.4.6. Cream
- 8.5. Latin America Clean Beauty Market Analysis, Opportunity and Forecast, By By Age Group, 2016-2032
- 8.5.1. Latin America Clean Beauty Market Analysis by By Age Group: Introduction
- 8.5.2. Market Size Absolute $ Opportunity Analysis and Forecast, By By Age Group, 2016-2032
- 8.5.3. Millennials
- 8.5.4. Gen Z
- 8.5.5. Gen X
- 8.5.6. Baby Boomers
- 8.6. Latin America Clean Beauty Market Analysis, Opportunity and Forecast, By By Gender, 2016-2032
- 8.6.1. Latin America Clean Beauty Market Analysis by By Gender: Introduction
- 8.6.2. Market Size Absolute $ Opportunity Analysis and Forecast, By By Gender, 2016-2032
- 8.6.3. Women
- 8.6.4. Men
- 8.6.5. Kids
- 8.7. Latin America Clean Beauty Market Analysis, Opportunity and Forecast, By By Distribution Channel, 2016-2032
- 8.7.1. Latin America Clean Beauty Market Analysis by By Distribution Channel: Introduction
- 8.7.2. Market Size Absolute $ Opportunity Analysis and Forecast, By By Distribution Channel, 2016-2032
- 8.7.3. Speciality Stores
- 8.7.4. Online
- 8.7.5. Retail
- 8.7.6. Others
- 8.8. Latin America Clean Beauty Market Analysis, Opportunity and Forecast, By Country , 2016-2032
- 8.8.1. Latin America Clean Beauty Market Analysis by Country : Introduction
- 8.8.2. Market Size Absolute $ Opportunity Analysis and Forecast, Country , 2016-2032
- 8.8.2.1. Brazil
- 8.8.2.2. Colombia
- 8.8.2.3. Chile
- 8.8.2.4. Argentina
- 8.8.2.5. Costa Rica
- 8.8.2.6. Rest of Latin America
- 9. Middle East & Africa Clean Beauty Market Analysis, Opportunity and Forecast, 2016-2032
- 9.1. Middle East & Africa Clean Beauty Market Analysis, 2016-2021
- 9.2. Middle East & Africa Clean Beauty Market Opportunity and Forecast, 2023-2032
- 9.3. Middle East & Africa Clean Beauty Market Analysis, Opportunity and Forecast, By By Product Type, 2016-2032
- 9.3.1. Middle East & Africa Clean Beauty Market Analysis by By Product Type: Introduction
- 9.3.2. Market Size Absolute $ Opportunity Analysis and Forecast, By By Product Type, 2016-2032
- 9.3.3. Skin Care
- 9.3.4. Hair Care
- 9.3.5. Face Products
- 9.3.6. Oral Care
- 9.3.7. Makeup
- 9.4. Middle East & Africa Clean Beauty Market Analysis, Opportunity and Forecast, By By Product Form, 2016-2032
- 9.4.1. Middle East & Africa Clean Beauty Market Analysis by By Product Form: Introduction
- 9.4.2. Market Size Absolute $ Opportunity Analysis and Forecast, By By Product Form, 2016-2032
- 9.4.3. Powder
- 9.4.4. Liquid
- 9.4.5. Gel
- 9.4.6. Cream
- 9.5. Middle East & Africa Clean Beauty Market Analysis, Opportunity and Forecast, By By Age Group, 2016-2032
- 9.5.1. Middle East & Africa Clean Beauty Market Analysis by By Age Group: Introduction
- 9.5.2. Market Size Absolute $ Opportunity Analysis and Forecast, By By Age Group, 2016-2032
- 9.5.3. Millennials
- 9.5.4. Gen Z
- 9.5.5. Gen X
- 9.5.6. Baby Boomers
- 9.6. Middle East & Africa Clean Beauty Market Analysis, Opportunity and Forecast, By By Gender, 2016-2032
- 9.6.1. Middle East & Africa Clean Beauty Market Analysis by By Gender: Introduction
- 9.6.2. Market Size Absolute $ Opportunity Analysis and Forecast, By By Gender, 2016-2032
- 9.6.3. Women
- 9.6.4. Men
- 9.6.5. Kids
- 9.7. Middle East & Africa Clean Beauty Market Analysis, Opportunity and Forecast, By By Distribution Channel, 2016-2032
- 9.7.1. Middle East & Africa Clean Beauty Market Analysis by By Distribution Channel: Introduction
- 9.7.2. Market Size Absolute $ Opportunity Analysis and Forecast, By By Distribution Channel, 2016-2032
- 9.7.3. Speciality Stores
- 9.7.4. Online
- 9.7.5. Retail
- 9.7.6. Others
- 9.8. Middle East & Africa Clean Beauty Market Analysis, Opportunity and Forecast, By Country , 2016-2032
- 9.8.1. Middle East & Africa Clean Beauty Market Analysis by Country : Introduction
- 9.8.2. Market Size Absolute $ Opportunity Analysis and Forecast, Country , 2016-2032
- 9.8.2.1. Algeria
- 9.8.2.2. Egypt
- 9.8.2.3. Israel
- 9.8.2.4. Kuwait
- 9.8.2.5. Nigeria
- 9.8.2.6. Saudi Arabia
- 9.8.2.7. South Africa
- 9.8.2.8. Turkey
- 9.8.2.9. The UAE
- 9.8.2.10. Rest of MEA
- 10. Global Clean Beauty Market Analysis, Opportunity and Forecast, By Region , 2016-2032
- 10.1. Global Clean Beauty Market Analysis by Region : Introduction
- 10.2. Market Size Absolute $ Opportunity Analysis and Forecast, By Region , 2016-2032
- 10.2.1. North America
- 10.2.2. Western Europe
- 10.2.3. Eastern Europe
- 10.2.4. APAC
- 10.2.5. Latin America
- 10.2.6. Middle East & Africa
- 11. Global Clean Beauty Market Competitive Landscape, Market Share Analysis, and Company Profiles
- 11.1. Market Share Analysis
- 11.2. Company Profiles
- 11.3. Burt's Bees
- 11.3.1. Company Overview
- 11.3.2. Financial Highlights
- 11.3.3. Product Portfolio
- 11.3.4. SWOT Analysis
- 11.3.5. Key Strategies and Developments
- 11.4. bareMinerals
- 11.4.1. Company Overview
- 11.4.2. Financial Highlights
- 11.4.3. Product Portfolio
- 11.4.4. SWOT Analysis
- 11.4.5. Key Strategies and Developments
- 11.5. Ere Perez Natural Cosmetics
- 11.5.1. Company Overview
- 11.5.2. Financial Highlights
- 11.5.3. Product Portfolio
- 11.5.4. SWOT Analysis
- 11.5.5. Key Strategies and Developments
- 11.6. Avon
- 11.6.1. Company Overview
- 11.6.2. Financial Highlights
- 11.6.3. Product Portfolio
- 11.6.4. SWOT Analysis
- 11.6.5. Key Strategies and Developments
- 11.7. Juice Beauty, Inc.
- 11.7.1. Company Overview
- 11.7.2. Financial Highlights
- 11.7.3. Product Portfolio
- 11.7.4. SWOT Analysis
- 11.7.5. Key Strategies and Developments
- 11.8. Honest Beauty LLC
- 11.8.1. Company Overview
- 11.8.2. Financial Highlights
- 11.8.3. Product Portfolio
- 11.8.4. SWOT Analysis
- 11.8.5. Key Strategies and Developments
- 11.9. Kjaer Weis
- 11.9.1. Company Overview
- 11.9.2. Financial Highlights
- 11.9.3. Product Portfolio
- 11.9.4. SWOT Analysis
- 11.9.5. Key Strategies and Developments
- 11.10. Inika
- 11.10.1. Company Overview
- 11.10.2. Financial Highlights
- 11.10.3. Product Portfolio
- 11.10.4. SWOT Analysis
- 11.10.5. Key Strategies and Developments
- 11.11. rms beauty
- 11.11.1. Company Overview
- 11.11.2. Financial Highlights
- 11.11.3. Product Portfolio
- 11.11.4. SWOT Analysis
- 11.11.5. Key Strategies and Developments
- 11.12. Vapour Beauty
- 11.12.1. Company Overview
- 11.12.2. Financial Highlights
- 11.12.3. Product Portfolio
- 11.12.4. SWOT Analysis
- 11.12.5. Key Strategies and Developments
- 11.13.1. Company Overview
- 11.13.2. Financial Highlights
- 11.13.3. Product Portfolio
- 11.13.4. SWOT Analysis
- 11.13.5. Key Strategies and Developments
- 11.14. Mineral Fusion Natural Brands
- 11.14.1. Company Overview
- 11.14.2. Financial Highlights
- 11.14.3. Product Portfolio
- 11.14.4. SWOT Analysis
- 11.14.5. Key Strategies and Developments
- 12. Assumptions and Acronyms
- 13. Research Methodology
- 14. Contact
"
- List of Figures
- "
- Figure 1: Global Clean Beauty Market Revenue (US$ Mn) Market Share by By Product Type in 2022
- Figure 2: Global Clean Beauty Market Market Attractiveness Analysis by By Product Type, 2016-2032
- Figure 3: Global Clean Beauty Market Revenue (US$ Mn) Market Share by By Product Formin 2022
- Figure 4: Global Clean Beauty Market Market Attractiveness Analysis by By Product Form, 2016-2032
- Figure 5: Global Clean Beauty Market Revenue (US$ Mn) Market Share by By Age Groupin 2022
- Figure 6: Global Clean Beauty Market Market Attractiveness Analysis by By Age Group, 2016-2032
- Figure 7: Global Clean Beauty Market Revenue (US$ Mn) Market Share by By Genderin 2022
- Figure 8: Global Clean Beauty Market Market Attractiveness Analysis by By Gender, 2016-2032
- Figure 9: Global Clean Beauty Market Revenue (US$ Mn) Market Share by By Distribution Channelin 2022
- Figure 10: Global Clean Beauty Market Market Attractiveness Analysis by By Distribution Channel, 2016-2032
- Figure 11: Global Clean Beauty Market Revenue (US$ Mn) Market Share by Region in 2022
- Figure 12: Global Clean Beauty Market Market Attractiveness Analysis by Region, 2016-2032
- Figure 13: Global Clean Beauty Market Market Revenue (US$ Mn) (2016-2032)
- Figure 14: Global Clean Beauty Market Market Revenue (US$ Mn) Comparison by Region (2016-2032)
- Figure 15: Global Clean Beauty Market Market Revenue (US$ Mn) Comparison by By Product Type (2016-2032)
- Figure 16: Global Clean Beauty Market Market Revenue (US$ Mn) Comparison by By Product Form (2016-2032)
- Figure 17: Global Clean Beauty Market Market Revenue (US$ Mn) Comparison by By Age Group (2016-2032)
- Figure 18: Global Clean Beauty Market Market Revenue (US$ Mn) Comparison by By Gender (2016-2032)
- Figure 19: Global Clean Beauty Market Market Revenue (US$ Mn) Comparison by By Distribution Channel (2016-2032)
- Figure 20: Global Clean Beauty Market Market Y-o-Y Growth Rate Comparison by Region (2016-2032)
- Figure 21: Global Clean Beauty Market Market Y-o-Y Growth Rate Comparison by By Product Type (2016-2032)
- Figure 22: Global Clean Beauty Market Market Y-o-Y Growth Rate Comparison by By Product Form (2016-2032)
- Figure 23: Global Clean Beauty Market Market Y-o-Y Growth Rate Comparison by By Age Group (2016-2032)
- Figure 24: Global Clean Beauty Market Market Y-o-Y Growth Rate Comparison by By Gender (2016-2032)
- Figure 25: Global Clean Beauty Market Market Y-o-Y Growth Rate Comparison by By Distribution Channel (2016-2032)
- Figure 26: Global Clean Beauty Market Market Share Comparison by Region (2016-2032)
- Figure 27: Global Clean Beauty Market Market Share Comparison by By Product Type (2016-2032)
- Figure 28: Global Clean Beauty Market Market Share Comparison by By Product Form (2016-2032)
- Figure 29: Global Clean Beauty Market Market Share Comparison by By Age Group (2016-2032)
- Figure 30: Global Clean Beauty Market Market Share Comparison by By Gender (2016-2032)
- Figure 31: Global Clean Beauty Market Market Share Comparison by By Distribution Channel (2016-2032)
- Figure 32: North America Clean Beauty Market Revenue (US$ Mn) Market Share by By Product Typein 2022
- Figure 33: North America Clean Beauty Market Market Attractiveness Analysis by By Product Type, 2016-2032
- Figure 34: North America Clean Beauty Market Revenue (US$ Mn) Market Share by By Product Formin 2022
- Figure 35: North America Clean Beauty Market Market Attractiveness Analysis by By Product Form, 2016-2032
- Figure 36: North America Clean Beauty Market Revenue (US$ Mn) Market Share by By Age Groupin 2022
- Figure 37: North America Clean Beauty Market Market Attractiveness Analysis by By Age Group, 2016-2032
- Figure 38: North America Clean Beauty Market Revenue (US$ Mn) Market Share by By Genderin 2022
- Figure 39: North America Clean Beauty Market Market Attractiveness Analysis by By Gender, 2016-2032
- Figure 40: North America Clean Beauty Market Revenue (US$ Mn) Market Share by By Distribution Channelin 2022
- Figure 41: North America Clean Beauty Market Market Attractiveness Analysis by By Distribution Channel, 2016-2032
- Figure 42: North America Clean Beauty Market Revenue (US$ Mn) Market Share by Country in 2022
- Figure 43: North America Clean Beauty Market Market Attractiveness Analysis by Country, 2016-2032
- Figure 44: North America Clean Beauty Market Market Revenue (US$ Mn) (2016-2032)
- Figure 45: North America Clean Beauty Market Market Revenue (US$ Mn) Comparison by Country (2016-2032)
- Figure 46: North America Clean Beauty Market Market Revenue (US$ Mn) Comparison by By Product Type (2016-2032)
- Figure 47: North America Clean Beauty Market Market Revenue (US$ Mn) Comparison by By Product Form (2016-2032)
- Figure 48: North America Clean Beauty Market Market Revenue (US$ Mn) Comparison by By Age Group (2016-2032)
- Figure 49: North America Clean Beauty Market Market Revenue (US$ Mn) Comparison by By Gender (2016-2032)
- Figure 50: North America Clean Beauty Market Market Revenue (US$ Mn) Comparison by By Distribution Channel (2016-2032)
- Figure 51: North America Clean Beauty Market Market Y-o-Y Growth Rate Comparison by Country (2016-2032)
- Figure 52: North America Clean Beauty Market Market Y-o-Y Growth Rate Comparison by By Product Type (2016-2032)
- Figure 53: North America Clean Beauty Market Market Y-o-Y Growth Rate Comparison by By Product Form (2016-2032)
- Figure 54: North America Clean Beauty Market Market Y-o-Y Growth Rate Comparison by By Age Group (2016-2032)
- Figure 55: North America Clean Beauty Market Market Y-o-Y Growth Rate Comparison by By Gender (2016-2032)
- Figure 56: North America Clean Beauty Market Market Y-o-Y Growth Rate Comparison by By Distribution Channel (2016-2032)
- Figure 57: North America Clean Beauty Market Market Share Comparison by Country (2016-2032)
- Figure 58: North America Clean Beauty Market Market Share Comparison by By Product Type (2016-2032)
- Figure 59: North America Clean Beauty Market Market Share Comparison by By Product Form (2016-2032)
- Figure 60: North America Clean Beauty Market Market Share Comparison by By Age Group (2016-2032)
- Figure 61: North America Clean Beauty Market Market Share Comparison by By Gender (2016-2032)
- Figure 62: North America Clean Beauty Market Market Share Comparison by By Distribution Channel (2016-2032)
- Figure 63: Western Europe Clean Beauty Market Revenue (US$ Mn) Market Share by By Product Typein 2022
- Figure 64: Western Europe Clean Beauty Market Market Attractiveness Analysis by By Product Type, 2016-2032
- Figure 65: Western Europe Clean Beauty Market Revenue (US$ Mn) Market Share by By Product Formin 2022
- Figure 66: Western Europe Clean Beauty Market Market Attractiveness Analysis by By Product Form, 2016-2032
- Figure 67: Western Europe Clean Beauty Market Revenue (US$ Mn) Market Share by By Age Groupin 2022
- Figure 68: Western Europe Clean Beauty Market Market Attractiveness Analysis by By Age Group, 2016-2032
- Figure 69: Western Europe Clean Beauty Market Revenue (US$ Mn) Market Share by By Genderin 2022
- Figure 70: Western Europe Clean Beauty Market Market Attractiveness Analysis by By Gender, 2016-2032
- Figure 71: Western Europe Clean Beauty Market Revenue (US$ Mn) Market Share by By Distribution Channelin 2022
- Figure 72: Western Europe Clean Beauty Market Market Attractiveness Analysis by By Distribution Channel, 2016-2032
- Figure 73: Western Europe Clean Beauty Market Revenue (US$ Mn) Market Share by Country in 2022
- Figure 74: Western Europe Clean Beauty Market Market Attractiveness Analysis by Country, 2016-2032
- Figure 75: Western Europe Clean Beauty Market Market Revenue (US$ Mn) (2016-2032)
- Figure 76: Western Europe Clean Beauty Market Market Revenue (US$ Mn) Comparison by Country (2016-2032)
- Figure 77: Western Europe Clean Beauty Market Market Revenue (US$ Mn) Comparison by By Product Type (2016-2032)
- Figure 78: Western Europe Clean Beauty Market Market Revenue (US$ Mn) Comparison by By Product Form (2016-2032)
- Figure 79: Western Europe Clean Beauty Market Market Revenue (US$ Mn) Comparison by By Age Group (2016-2032)
- Figure 80: Western Europe Clean Beauty Market Market Revenue (US$ Mn) Comparison by By Gender (2016-2032)
- Figure 81: Western Europe Clean Beauty Market Market Revenue (US$ Mn) Comparison by By Distribution Channel (2016-2032)
- Figure 82: Western Europe Clean Beauty Market Market Y-o-Y Growth Rate Comparison by Country (2016-2032)
- Figure 83: Western Europe Clean Beauty Market Market Y-o-Y Growth Rate Comparison by By Product Type (2016-2032)
- Figure 84: Western Europe Clean Beauty Market Market Y-o-Y Growth Rate Comparison by By Product Form (2016-2032)
- Figure 85: Western Europe Clean Beauty Market Market Y-o-Y Growth Rate Comparison by By Age Group (2016-2032)
- Figure 86: Western Europe Clean Beauty Market Market Y-o-Y Growth Rate Comparison by By Gender (2016-2032)
- Figure 87: Western Europe Clean Beauty Market Market Y-o-Y Growth Rate Comparison by By Distribution Channel (2016-2032)
- Figure 88: Western Europe Clean Beauty Market Market Share Comparison by Country (2016-2032)
- Figure 89: Western Europe Clean Beauty Market Market Share Comparison by By Product Type (2016-2032)
- Figure 90: Western Europe Clean Beauty Market Market Share Comparison by By Product Form (2016-2032)
- Figure 91: Western Europe Clean Beauty Market Market Share Comparison by By Age Group (2016-2032)
- Figure 92: Western Europe Clean Beauty Market Market Share Comparison by By Gender (2016-2032)
- Figure 93: Western Europe Clean Beauty Market Market Share Comparison by By Distribution Channel (2016-2032)
- Figure 94: Eastern Europe Clean Beauty Market Revenue (US$ Mn) Market Share by By Product Typein 2022
- Figure 95: Eastern Europe Clean Beauty Market Market Attractiveness Analysis by By Product Type, 2016-2032
- Figure 96: Eastern Europe Clean Beauty Market Revenue (US$ Mn) Market Share by By Product Formin 2022
- Figure 97: Eastern Europe Clean Beauty Market Market Attractiveness Analysis by By Product Form, 2016-2032
- Figure 98: Eastern Europe Clean Beauty Market Revenue (US$ Mn) Market Share by By Age Groupin 2022
- Figure 99: Eastern Europe Clean Beauty Market Market Attractiveness Analysis by By Age Group, 2016-2032
- Figure 100: Eastern Europe Clean Beauty Market Revenue (US$ Mn) Market Share by By Genderin 2022
- Figure 101: Eastern Europe Clean Beauty Market Market Attractiveness Analysis by By Gender, 2016-2032
- Figure 102: Eastern Europe Clean Beauty Market Revenue (US$ Mn) Market Share by By Distribution Channelin 2022
- Figure 103: Eastern Europe Clean Beauty Market Market Attractiveness Analysis by By Distribution Channel, 2016-2032
- Figure 104: Eastern Europe Clean Beauty Market Revenue (US$ Mn) Market Share by Country in 2022
- Figure 105: Eastern Europe Clean Beauty Market Market Attractiveness Analysis by Country, 2016-2032
- Figure 106: Eastern Europe Clean Beauty Market Market Revenue (US$ Mn) (2016-2032)
- Figure 107: Eastern Europe Clean Beauty Market Market Revenue (US$ Mn) Comparison by Country (2016-2032)
- Figure 108: Eastern Europe Clean Beauty Market Market Revenue (US$ Mn) Comparison by By Product Type (2016-2032)
- Figure 109: Eastern Europe Clean Beauty Market Market Revenue (US$ Mn) Comparison by By Product Form (2016-2032)
- Figure 110: Eastern Europe Clean Beauty Market Market Revenue (US$ Mn) Comparison by By Age Group (2016-2032)
- Figure 111: Eastern Europe Clean Beauty Market Market Revenue (US$ Mn) Comparison by By Gender (2016-2032)
- Figure 112: Eastern Europe Clean Beauty Market Market Revenue (US$ Mn) Comparison by By Distribution Channel (2016-2032)
- Figure 113: Eastern Europe Clean Beauty Market Market Y-o-Y Growth Rate Comparison by Country (2016-2032)
- Figure 114: Eastern Europe Clean Beauty Market Market Y-o-Y Growth Rate Comparison by By Product Type (2016-2032)
- Figure 115: Eastern Europe Clean Beauty Market Market Y-o-Y Growth Rate Comparison by By Product Form (2016-2032)
- Figure 116: Eastern Europe Clean Beauty Market Market Y-o-Y Growth Rate Comparison by By Age Group (2016-2032)
- Figure 117: Eastern Europe Clean Beauty Market Market Y-o-Y Growth Rate Comparison by By Gender (2016-2032)
- Figure 118: Eastern Europe Clean Beauty Market Market Y-o-Y Growth Rate Comparison by By Distribution Channel (2016-2032)
- Figure 119: Eastern Europe Clean Beauty Market Market Share Comparison by Country (2016-2032)
- Figure 120: Eastern Europe Clean Beauty Market Market Share Comparison by By Product Type (2016-2032)
- Figure 121: Eastern Europe Clean Beauty Market Market Share Comparison by By Product Form (2016-2032)
- Figure 122: Eastern Europe Clean Beauty Market Market Share Comparison by By Age Group (2016-2032)
- Figure 123: Eastern Europe Clean Beauty Market Market Share Comparison by By Gender (2016-2032)
- Figure 124: Eastern Europe Clean Beauty Market Market Share Comparison by By Distribution Channel (2016-2032)
- Figure 125: APAC Clean Beauty Market Revenue (US$ Mn) Market Share by By Product Typein 2022
- Figure 126: APAC Clean Beauty Market Market Attractiveness Analysis by By Product Type, 2016-2032
- Figure 127: APAC Clean Beauty Market Revenue (US$ Mn) Market Share by By Product Formin 2022
- Figure 128: APAC Clean Beauty Market Market Attractiveness Analysis by By Product Form, 2016-2032
- Figure 129: APAC Clean Beauty Market Revenue (US$ Mn) Market Share by By Age Groupin 2022
- Figure 130: APAC Clean Beauty Market Market Attractiveness Analysis by By Age Group, 2016-2032
- Figure 131: APAC Clean Beauty Market Revenue (US$ Mn) Market Share by By Genderin 2022
- Figure 132: APAC Clean Beauty Market Market Attractiveness Analysis by By Gender, 2016-2032
- Figure 133: APAC Clean Beauty Market Revenue (US$ Mn) Market Share by By Distribution Channelin 2022
- Figure 134: APAC Clean Beauty Market Market Attractiveness Analysis by By Distribution Channel, 2016-2032
- Figure 135: APAC Clean Beauty Market Revenue (US$ Mn) Market Share by Country in 2022
- Figure 136: APAC Clean Beauty Market Market Attractiveness Analysis by Country, 2016-2032
- Figure 137: APAC Clean Beauty Market Market Revenue (US$ Mn) (2016-2032)
- Figure 138: APAC Clean Beauty Market Market Revenue (US$ Mn) Comparison by Country (2016-2032)
- Figure 139: APAC Clean Beauty Market Market Revenue (US$ Mn) Comparison by By Product Type (2016-2032)
- Figure 140: APAC Clean Beauty Market Market Revenue (US$ Mn) Comparison by By Product Form (2016-2032)
- Figure 141: APAC Clean Beauty Market Market Revenue (US$ Mn) Comparison by By Age Group (2016-2032)
- Figure 142: APAC Clean Beauty Market Market Revenue (US$ Mn) Comparison by By Gender (2016-2032)
- Figure 143: APAC Clean Beauty Market Market Revenue (US$ Mn) Comparison by By Distribution Channel (2016-2032)
- Figure 144: APAC Clean Beauty Market Market Y-o-Y Growth Rate Comparison by Country (2016-2032)
- Figure 145: APAC Clean Beauty Market Market Y-o-Y Growth Rate Comparison by By Product Type (2016-2032)
- Figure 146: APAC Clean Beauty Market Market Y-o-Y Growth Rate Comparison by By Product Form (2016-2032)
- Figure 147: APAC Clean Beauty Market Market Y-o-Y Growth Rate Comparison by By Age Group (2016-2032)
- Figure 148: APAC Clean Beauty Market Market Y-o-Y Growth Rate Comparison by By Gender (2016-2032)
- Figure 149: APAC Clean Beauty Market Market Y-o-Y Growth Rate Comparison by By Distribution Channel (2016-2032)
- Figure 150: APAC Clean Beauty Market Market Share Comparison by Country (2016-2032)
- Figure 151: APAC Clean Beauty Market Market Share Comparison by By Product Type (2016-2032)
- Figure 152: APAC Clean Beauty Market Market Share Comparison by By Product Form (2016-2032)
- Figure 153: APAC Clean Beauty Market Market Share Comparison by By Age Group (2016-2032)
- Figure 154: APAC Clean Beauty Market Market Share Comparison by By Gender (2016-2032)
- Figure 155: APAC Clean Beauty Market Market Share Comparison by By Distribution Channel (2016-2032)
- Figure 156: Latin America Clean Beauty Market Revenue (US$ Mn) Market Share by By Product Typein 2022
- Figure 157: Latin America Clean Beauty Market Market Attractiveness Analysis by By Product Type, 2016-2032
- Figure 158: Latin America Clean Beauty Market Revenue (US$ Mn) Market Share by By Product Formin 2022
- Figure 159: Latin America Clean Beauty Market Market Attractiveness Analysis by By Product Form, 2016-2032
- Figure 160: Latin America Clean Beauty Market Revenue (US$ Mn) Market Share by By Age Groupin 2022
- Figure 161: Latin America Clean Beauty Market Market Attractiveness Analysis by By Age Group, 2016-2032
- Figure 162: Latin America Clean Beauty Market Revenue (US$ Mn) Market Share by By Genderin 2022
- Figure 163: Latin America Clean Beauty Market Market Attractiveness Analysis by By Gender, 2016-2032
- Figure 164: Latin America Clean Beauty Market Revenue (US$ Mn) Market Share by By Distribution Channelin 2022
- Figure 165: Latin America Clean Beauty Market Market Attractiveness Analysis by By Distribution Channel, 2016-2032
- Figure 166: Latin America Clean Beauty Market Revenue (US$ Mn) Market Share by Country in 2022
- Figure 167: Latin America Clean Beauty Market Market Attractiveness Analysis by Country, 2016-2032
- Figure 168: Latin America Clean Beauty Market Market Revenue (US$ Mn) (2016-2032)
- Figure 169: Latin America Clean Beauty Market Market Revenue (US$ Mn) Comparison by Country (2016-2032)
- Figure 170: Latin America Clean Beauty Market Market Revenue (US$ Mn) Comparison by By Product Type (2016-2032)
- Figure 171: Latin America Clean Beauty Market Market Revenue (US$ Mn) Comparison by By Product Form (2016-2032)
- Figure 172: Latin America Clean Beauty Market Market Revenue (US$ Mn) Comparison by By Age Group (2016-2032)
- Figure 173: Latin America Clean Beauty Market Market Revenue (US$ Mn) Comparison by By Gender (2016-2032)
- Figure 174: Latin America Clean Beauty Market Market Revenue (US$ Mn) Comparison by By Distribution Channel (2016-2032)
- Figure 175: Latin America Clean Beauty Market Market Y-o-Y Growth Rate Comparison by Country (2016-2032)
- Figure 176: Latin America Clean Beauty Market Market Y-o-Y Growth Rate Comparison by By Product Type (2016-2032)
- Figure 177: Latin America Clean Beauty Market Market Y-o-Y Growth Rate Comparison by By Product Form (2016-2032)
- Figure 178: Latin America Clean Beauty Market Market Y-o-Y Growth Rate Comparison by By Age Group (2016-2032)
- Figure 179: Latin America Clean Beauty Market Market Y-o-Y Growth Rate Comparison by By Gender (2016-2032)
- Figure 180: Latin America Clean Beauty Market Market Y-o-Y Growth Rate Comparison by By Distribution Channel (2016-2032)
- Figure 181: Latin America Clean Beauty Market Market Share Comparison by Country (2016-2032)
- Figure 182: Latin America Clean Beauty Market Market Share Comparison by By Product Type (2016-2032)
- Figure 183: Latin America Clean Beauty Market Market Share Comparison by By Product Form (2016-2032)
- Figure 184: Latin America Clean Beauty Market Market Share Comparison by By Age Group (2016-2032)
- Figure 185: Latin America Clean Beauty Market Market Share Comparison by By Gender (2016-2032)
- Figure 186: Latin America Clean Beauty Market Market Share Comparison by By Distribution Channel (2016-2032)
- Figure 187: Middle East & Africa Clean Beauty Market Revenue (US$ Mn) Market Share by By Product Typein 2022
- Figure 188: Middle East & Africa Clean Beauty Market Market Attractiveness Analysis by By Product Type, 2016-2032
- Figure 189: Middle East & Africa Clean Beauty Market Revenue (US$ Mn) Market Share by By Product Formin 2022
- Figure 190: Middle East & Africa Clean Beauty Market Market Attractiveness Analysis by By Product Form, 2016-2032
- Figure 191: Middle East & Africa Clean Beauty Market Revenue (US$ Mn) Market Share by By Age Groupin 2022
- Figure 192: Middle East & Africa Clean Beauty Market Market Attractiveness Analysis by By Age Group, 2016-2032
- Figure 193: Middle East & Africa Clean Beauty Market Revenue (US$ Mn) Market Share by By Genderin 2022
- Figure 194: Middle East & Africa Clean Beauty Market Market Attractiveness Analysis by By Gender, 2016-2032
- Figure 195: Middle East & Africa Clean Beauty Market Revenue (US$ Mn) Market Share by By Distribution Channelin 2022
- Figure 196: Middle East & Africa Clean Beauty Market Market Attractiveness Analysis by By Distribution Channel, 2016-2032
- Figure 197: Middle East & Africa Clean Beauty Market Revenue (US$ Mn) Market Share by Country in 2022
- Figure 198: Middle East & Africa Clean Beauty Market Market Attractiveness Analysis by Country, 2016-2032
- Figure 199: Middle East & Africa Clean Beauty Market Market Revenue (US$ Mn) (2016-2032)
- Figure 200: Middle East & Africa Clean Beauty Market Market Revenue (US$ Mn) Comparison by Country (2016-2032)
- Figure 201: Middle East & Africa Clean Beauty Market Market Revenue (US$ Mn) Comparison by By Product Type (2016-2032)
- Figure 202: Middle East & Africa Clean Beauty Market Market Revenue (US$ Mn) Comparison by By Product Form (2016-2032)
- Figure 203: Middle East & Africa Clean Beauty Market Market Revenue (US$ Mn) Comparison by By Age Group (2016-2032)
- Figure 204: Middle East & Africa Clean Beauty Market Market Revenue (US$ Mn) Comparison by By Gender (2016-2032)
- Figure 205: Middle East & Africa Clean Beauty Market Market Revenue (US$ Mn) Comparison by By Distribution Channel (2016-2032)
- Figure 206: Middle East & Africa Clean Beauty Market Market Y-o-Y Growth Rate Comparison by Country (2016-2032)
- Figure 207: Middle East & Africa Clean Beauty Market Market Y-o-Y Growth Rate Comparison by By Product Type (2016-2032)
- Figure 208: Middle East & Africa Clean Beauty Market Market Y-o-Y Growth Rate Comparison by By Product Form (2016-2032)
- Figure 209: Middle East & Africa Clean Beauty Market Market Y-o-Y Growth Rate Comparison by By Age Group (2016-2032)
- Figure 210: Middle East & Africa Clean Beauty Market Market Y-o-Y Growth Rate Comparison by By Gender (2016-2032)
- Figure 211: Middle East & Africa Clean Beauty Market Market Y-o-Y Growth Rate Comparison by By Distribution Channel (2016-2032)
- Figure 212: Middle East & Africa Clean Beauty Market Market Share Comparison by Country (2016-2032)
- Figure 213: Middle East & Africa Clean Beauty Market Market Share Comparison by By Product Type (2016-2032)
- Figure 214: Middle East & Africa Clean Beauty Market Market Share Comparison by By Product Form (2016-2032)
- Figure 215: Middle East & Africa Clean Beauty Market Market Share Comparison by By Age Group (2016-2032)
- Figure 216: Middle East & Africa Clean Beauty Market Market Share Comparison by By Gender (2016-2032)
- Figure 217: Middle East & Africa Clean Beauty Market Market Share Comparison by By Distribution Channel (2016-2032)
"
- List of Tables
- "
- Table 1: Global Clean Beauty Market Market Comparison by By Product Type (2016-2032)
- Table 2: Global Clean Beauty Market Market Comparison by By Product Form (2016-2032)
- Table 3: Global Clean Beauty Market Market Comparison by By Age Group (2016-2032)
- Table 4: Global Clean Beauty Market Market Comparison by By Gender (2016-2032)
- Table 5: Global Clean Beauty Market Market Comparison by By Distribution Channel (2016-2032)
- Table 6: Global Clean Beauty Market Revenue (US$ Mn) Comparison by Region (2016-2032)
- Table 7: Global Clean Beauty Market Market Revenue (US$ Mn) (2016-2032)
- Table 8: Global Clean Beauty Market Market Revenue (US$ Mn) Comparison by Region (2016-2032)
- Table 9: Global Clean Beauty Market Market Revenue (US$ Mn) Comparison by By Product Type (2016-2032)
- Table 10: Global Clean Beauty Market Market Revenue (US$ Mn) Comparison by By Product Form (2016-2032)
- Table 11: Global Clean Beauty Market Market Revenue (US$ Mn) Comparison by By Age Group (2016-2032)
- Table 12: Global Clean Beauty Market Market Revenue (US$ Mn) Comparison by By Gender (2016-2032)
- Table 13: Global Clean Beauty Market Market Revenue (US$ Mn) Comparison by By Distribution Channel (2016-2032)
- Table 14: Global Clean Beauty Market Market Y-o-Y Growth Rate Comparison by Region (2016-2032)
- Table 15: Global Clean Beauty Market Market Y-o-Y Growth Rate Comparison by By Product Type (2016-2032)
- Table 16: Global Clean Beauty Market Market Y-o-Y Growth Rate Comparison by By Product Form (2016-2032)
- Table 17: Global Clean Beauty Market Market Y-o-Y Growth Rate Comparison by By Age Group (2016-2032)
- Table 18: Global Clean Beauty Market Market Y-o-Y Growth Rate Comparison by By Gender (2016-2032)
- Table 19: Global Clean Beauty Market Market Y-o-Y Growth Rate Comparison by By Distribution Channel (2016-2032)
- Table 20: Global Clean Beauty Market Market Share Comparison by Region (2016-2032)
- Table 21: Global Clean Beauty Market Market Share Comparison by By Product Type (2016-2032)
- Table 22: Global Clean Beauty Market Market Share Comparison by By Product Form (2016-2032)
- Table 23: Global Clean Beauty Market Market Share Comparison by By Age Group (2016-2032)
- Table 24: Global Clean Beauty Market Market Share Comparison by By Gender (2016-2032)
- Table 25: Global Clean Beauty Market Market Share Comparison by By Distribution Channel (2016-2032)
- Table 26: North America Clean Beauty Market Market Comparison by By Product Form (2016-2032)
- Table 27: North America Clean Beauty Market Market Comparison by By Age Group (2016-2032)
- Table 28: North America Clean Beauty Market Market Comparison by By Gender (2016-2032)
- Table 29: North America Clean Beauty Market Market Comparison by By Distribution Channel (2016-2032)
- Table 30: North America Clean Beauty Market Revenue (US$ Mn) Comparison by Country (2016-2032)
- Table 31: North America Clean Beauty Market Market Revenue (US$ Mn) (2016-2032)
- Table 32: North America Clean Beauty Market Market Revenue (US$ Mn) Comparison by Country (2016-2032)
- Table 33: North America Clean Beauty Market Market Revenue (US$ Mn) Comparison by By Product Type (2016-2032)
- Table 34: North America Clean Beauty Market Market Revenue (US$ Mn) Comparison by By Product Form (2016-2032)
- Table 35: North America Clean Beauty Market Market Revenue (US$ Mn) Comparison by By Age Group (2016-2032)
- Table 36: North America Clean Beauty Market Market Revenue (US$ Mn) Comparison by By Gender (2016-2032)
- Table 37: North America Clean Beauty Market Market Revenue (US$ Mn) Comparison by By Distribution Channel (2016-2032)
- Table 38: North America Clean Beauty Market Market Y-o-Y Growth Rate Comparison by Country (2016-2032)
- Table 39: North America Clean Beauty Market Market Y-o-Y Growth Rate Comparison by By Product Type (2016-2032)
- Table 40: North America Clean Beauty Market Market Y-o-Y Growth Rate Comparison by By Product Form (2016-2032)
- Table 41: North America Clean Beauty Market Market Y-o-Y Growth Rate Comparison by By Age Group (2016-2032)
- Table 42: North America Clean Beauty Market Market Y-o-Y Growth Rate Comparison by By Gender (2016-2032)
- Table 43: North America Clean Beauty Market Market Y-o-Y Growth Rate Comparison by By Distribution Channel (2016-2032)
- Table 44: North America Clean Beauty Market Market Share Comparison by Country (2016-2032)
- Table 45: North America Clean Beauty Market Market Share Comparison by By Product Type (2016-2032)
- Table 46: North America Clean Beauty Market Market Share Comparison by By Product Form (2016-2032)
- Table 47: North America Clean Beauty Market Market Share Comparison by By Age Group (2016-2032)
- Table 48: North America Clean Beauty Market Market Share Comparison by By Gender (2016-2032)
- Table 49: North America Clean Beauty Market Market Share Comparison by By Distribution Channel (2016-2032)
- Table 50: Western Europe Clean Beauty Market Market Comparison by By Product Type (2016-2032)
- Table 51: Western Europe Clean Beauty Market Market Comparison by By Product Form (2016-2032)
- Table 52: Western Europe Clean Beauty Market Market Comparison by By Age Group (2016-2032)
- Table 53: Western Europe Clean Beauty Market Market Comparison by By Gender (2016-2032)
- Table 54: Western Europe Clean Beauty Market Market Comparison by By Distribution Channel (2016-2032)
- Table 55: Western Europe Clean Beauty Market Revenue (US$ Mn) Comparison by Country (2016-2032)
- Table 56: Western Europe Clean Beauty Market Market Revenue (US$ Mn) (2016-2032)
- Table 57: Western Europe Clean Beauty Market Market Revenue (US$ Mn) Comparison by Country (2016-2032)
- Table 58: Western Europe Clean Beauty Market Market Revenue (US$ Mn) Comparison by By Product Type (2016-2032)
- Table 59: Western Europe Clean Beauty Market Market Revenue (US$ Mn) Comparison by By Product Form (2016-2032)
- Table 60: Western Europe Clean Beauty Market Market Revenue (US$ Mn) Comparison by By Age Group (2016-2032)
- Table 61: Western Europe Clean Beauty Market Market Revenue (US$ Mn) Comparison by By Gender (2016-2032)
- Table 62: Western Europe Clean Beauty Market Market Revenue (US$ Mn) Comparison by By Distribution Channel (2016-2032)
- Table 63: Western Europe Clean Beauty Market Market Y-o-Y Growth Rate Comparison by Country (2016-2032)
- Table 64: Western Europe Clean Beauty Market Market Y-o-Y Growth Rate Comparison by By Product Type (2016-2032)
- Table 65: Western Europe Clean Beauty Market Market Y-o-Y Growth Rate Comparison by By Product Form (2016-2032)
- Table 66: Western Europe Clean Beauty Market Market Y-o-Y Growth Rate Comparison by By Age Group (2016-2032)
- Table 67: Western Europe Clean Beauty Market Market Y-o-Y Growth Rate Comparison by By Gender (2016-2032)
- Table 68: Western Europe Clean Beauty Market Market Y-o-Y Growth Rate Comparison by By Distribution Channel (2016-2032)
- Table 69: Western Europe Clean Beauty Market Market Share Comparison by Country (2016-2032)
- Table 70: Western Europe Clean Beauty Market Market Share Comparison by By Product Type (2016-2032)
- Table 71: Western Europe Clean Beauty Market Market Share Comparison by By Product Form (2016-2032)
- Table 72: Western Europe Clean Beauty Market Market Share Comparison by By Age Group (2016-2032)
- Table 73: Western Europe Clean Beauty Market Market Share Comparison by By Gender (2016-2032)
- Table 74: Western Europe Clean Beauty Market Market Share Comparison by By Distribution Channel (2016-2032)
- Table 75: Eastern Europe Clean Beauty Market Market Comparison by By Product Type (2016-2032)
- Table 76: Eastern Europe Clean Beauty Market Market Comparison by By Product Form (2016-2032)
- Table 77: Eastern Europe Clean Beauty Market Market Comparison by By Age Group (2016-2032)
- Table 78: Eastern Europe Clean Beauty Market Market Comparison by By Gender (2016-2032)
- Table 79: Eastern Europe Clean Beauty Market Market Comparison by By Distribution Channel (2016-2032)
- Table 80: Eastern Europe Clean Beauty Market Revenue (US$ Mn) Comparison by Country (2016-2032)
- Table 81: Eastern Europe Clean Beauty Market Market Revenue (US$ Mn) (2016-2032)
- Table 82: Eastern Europe Clean Beauty Market Market Revenue (US$ Mn) Comparison by Country (2016-2032)
- Table 83: Eastern Europe Clean Beauty Market Market Revenue (US$ Mn) Comparison by By Product Type (2016-2032)
- Table 84: Eastern Europe Clean Beauty Market Market Revenue (US$ Mn) Comparison by By Product Form (2016-2032)
- Table 85: Eastern Europe Clean Beauty Market Market Revenue (US$ Mn) Comparison by By Age Group (2016-2032)
- Table 86: Eastern Europe Clean Beauty Market Market Revenue (US$ Mn) Comparison by By Gender (2016-2032)
- Table 87: Eastern Europe Clean Beauty Market Market Revenue (US$ Mn) Comparison by By Distribution Channel (2016-2032)
- Table 88: Eastern Europe Clean Beauty Market Market Y-o-Y Growth Rate Comparison by Country (2016-2032)
- Table 89: Eastern Europe Clean Beauty Market Market Y-o-Y Growth Rate Comparison by By Product Type (2016-2032)
- Table 90: Eastern Europe Clean Beauty Market Market Y-o-Y Growth Rate Comparison by By Product Form (2016-2032)
- Table 91: Eastern Europe Clean Beauty Market Market Y-o-Y Growth Rate Comparison by By Age Group (2016-2032)
- Table 92: Eastern Europe Clean Beauty Market Market Y-o-Y Growth Rate Comparison by By Gender (2016-2032)
- Table 93: Eastern Europe Clean Beauty Market Market Y-o-Y Growth Rate Comparison by By Distribution Channel (2016-2032)
- Table 94: Eastern Europe Clean Beauty Market Market Share Comparison by Country (2016-2032)
- Table 95: Eastern Europe Clean Beauty Market Market Share Comparison by By Product Type (2016-2032)
- Table 96: Eastern Europe Clean Beauty Market Market Share Comparison by By Product Form (2016-2032)
- Table 97: Eastern Europe Clean Beauty Market Market Share Comparison by By Age Group (2016-2032)
- Table 98: Eastern Europe Clean Beauty Market Market Share Comparison by By Gender (2016-2032)
- Table 99: Eastern Europe Clean Beauty Market Market Share Comparison by By Distribution Channel (2016-2032)
- Table 100: APAC Clean Beauty Market Market Comparison by By Product Type (2016-2032)
- Table 101: APAC Clean Beauty Market Market Comparison by By Product Form (2016-2032)
- Table 102: APAC Clean Beauty Market Market Comparison by By Age Group (2016-2032)
- Table 103: APAC Clean Beauty Market Market Comparison by By Gender (2016-2032)
- Table 104: APAC Clean Beauty Market Market Comparison by By Distribution Channel (2016-2032)
- Table 105: APAC Clean Beauty Market Revenue (US$ Mn) Comparison by Country (2016-2032)
- Table 106: APAC Clean Beauty Market Market Revenue (US$ Mn) (2016-2032)
- Table 107: APAC Clean Beauty Market Market Revenue (US$ Mn) Comparison by Country (2016-2032)
- Table 108: APAC Clean Beauty Market Market Revenue (US$ Mn) Comparison by By Product Type (2016-2032)
- Table 109: APAC Clean Beauty Market Market Revenue (US$ Mn) Comparison by By Product Form (2016-2032)
- Table 110: APAC Clean Beauty Market Market Revenue (US$ Mn) Comparison by By Age Group (2016-2032)
- Table 111: APAC Clean Beauty Market Market Revenue (US$ Mn) Comparison by By Gender (2016-2032)
- Table 112: APAC Clean Beauty Market Market Revenue (US$ Mn) Comparison by By Distribution Channel (2016-2032)
- Table 113: APAC Clean Beauty Market Market Y-o-Y Growth Rate Comparison by Country (2016-2032)
- Table 114: APAC Clean Beauty Market Market Y-o-Y Growth Rate Comparison by By Product Type (2016-2032)
- Table 115: APAC Clean Beauty Market Market Y-o-Y Growth Rate Comparison by By Product Form (2016-2032)
- Table 116: APAC Clean Beauty Market Market Y-o-Y Growth Rate Comparison by By Age Group (2016-2032)
- Table 117: APAC Clean Beauty Market Market Y-o-Y Growth Rate Comparison by By Gender (2016-2032)
- Table 118: APAC Clean Beauty Market Market Y-o-Y Growth Rate Comparison by By Distribution Channel (2016-2032)
- Table 119: APAC Clean Beauty Market Market Share Comparison by Country (2016-2032)
- Table 120: APAC Clean Beauty Market Market Share Comparison by By Product Type (2016-2032)
- Table 121: APAC Clean Beauty Market Market Share Comparison by By Product Form (2016-2032)
- Table 122: APAC Clean Beauty Market Market Share Comparison by By Age Group (2016-2032)
- Table 123: APAC Clean Beauty Market Market Share Comparison by By Gender (2016-2032)
- Table 124: APAC Clean Beauty Market Market Share Comparison by By Distribution Channel (2016-2032)
- Table 125: Latin America Clean Beauty Market Market Comparison by By Product Type (2016-2032)
- Table 126: Latin America Clean Beauty Market Market Comparison by By Product Form (2016-2032)
- Table 127: Latin America Clean Beauty Market Market Comparison by By Age Group (2016-2032)
- Table 128: Latin America Clean Beauty Market Market Comparison by By Gender (2016-2032)
- Table 129: Latin America Clean Beauty Market Market Comparison by By Distribution Channel (2016-2032)
- Table 130: Latin America Clean Beauty Market Revenue (US$ Mn) Comparison by Country (2016-2032)
- Table 131: Latin America Clean Beauty Market Market Revenue (US$ Mn) (2016-2032)
- Table 132: Latin America Clean Beauty Market Market Revenue (US$ Mn) Comparison by Country (2016-2032)
- Table 133: Latin America Clean Beauty Market Market Revenue (US$ Mn) Comparison by By Product Type (2016-2032)
- Table 134: Latin America Clean Beauty Market Market Revenue (US$ Mn) Comparison by By Product Form (2016-2032)
- Table 135: Latin America Clean Beauty Market Market Revenue (US$ Mn) Comparison by By Age Group (2016-2032)
- Table 136: Latin America Clean Beauty Market Market Revenue (US$ Mn) Comparison by By Gender (2016-2032)
- Table 137: Latin America Clean Beauty Market Market Revenue (US$ Mn) Comparison by By Distribution Channel (2016-2032)
- Table 138: Latin America Clean Beauty Market Market Y-o-Y Growth Rate Comparison by Country (2016-2032)
- Table 139: Latin America Clean Beauty Market Market Y-o-Y Growth Rate Comparison by By Product Type (2016-2032)
- Table 140: Latin America Clean Beauty Market Market Y-o-Y Growth Rate Comparison by By Product Form (2016-2032)
- Table 141: Latin America Clean Beauty Market Market Y-o-Y Growth Rate Comparison by By Age Group (2016-2032)
- Table 142: Latin America Clean Beauty Market Market Y-o-Y Growth Rate Comparison by By Gender (2016-2032)
- Table 143: Latin America Clean Beauty Market Market Y-o-Y Growth Rate Comparison by By Distribution Channel (2016-2032)
- Table 144: Latin America Clean Beauty Market Market Share Comparison by Country (2016-2032)
- Table 145: Latin America Clean Beauty Market Market Share Comparison by By Product Type (2016-2032)
- Table 146: Latin America Clean Beauty Market Market Share Comparison by By Product Form (2016-2032)
- Table 147: Latin America Clean Beauty Market Market Share Comparison by By Age Group (2016-2032)
- Table 148: Latin America Clean Beauty Market Market Share Comparison by By Gender (2016-2032)
- Table 149: Latin America Clean Beauty Market Market Share Comparison by By Distribution Channel (2016-2032)
- Table 150: Middle East & Africa Clean Beauty Market Market Comparison by By Product Type (2016-2032)
- Table 151: Middle East & Africa Clean Beauty Market Market Comparison by By Product Form (2016-2032)
- Table 152: Middle East & Africa Clean Beauty Market Market Comparison by By Age Group (2016-2032)
- Table 153: Middle East & Africa Clean Beauty Market Market Comparison by By Gender (2016-2032)
- Table 154: Middle East & Africa Clean Beauty Market Market Comparison by By Distribution Channel (2016-2032)
- Table 155: Middle East & Africa Clean Beauty Market Revenue (US$ Mn) Comparison by Country (2016-2032)
- Table 156: Middle East & Africa Clean Beauty Market Market Revenue (US$ Mn) (2016-2032)
- Table 157: Middle East & Africa Clean Beauty Market Market Revenue (US$ Mn) Comparison by Country (2016-2032)
- Table 158: Middle East & Africa Clean Beauty Market Market Revenue (US$ Mn) Comparison by By Product Type (2016-2032)
- Table 159: Middle East & Africa Clean Beauty Market Market Revenue (US$ Mn) Comparison by By Product Form (2016-2032)
- Table 160: Middle East & Africa Clean Beauty Market Market Revenue (US$ Mn) Comparison by By Age Group (2016-2032)
- Table 161: Middle East & Africa Clean Beauty Market Market Revenue (US$ Mn) Comparison by By Gender (2016-2032)
- Table 162: Middle East & Africa Clean Beauty Market Market Revenue (US$ Mn) Comparison by By Distribution Channel (2016-2032)
- Table 163: Middle East & Africa Clean Beauty Market Market Y-o-Y Growth Rate Comparison by Country (2016-2032)
- Table 164: Middle East & Africa Clean Beauty Market Market Y-o-Y Growth Rate Comparison by By Product Type (2016-2032)
- Table 165: Middle East & Africa Clean Beauty Market Market Y-o-Y Growth Rate Comparison by By Product Form (2016-2032)
- Table 166: Middle East & Africa Clean Beauty Market Market Y-o-Y Growth Rate Comparison by By Age Group (2016-2032)
- Table 167: Middle East & Africa Clean Beauty Market Market Y-o-Y Growth Rate Comparison by By Gender (2016-2032)
- Table 168: Middle East & Africa Clean Beauty Market Market Y-o-Y Growth Rate Comparison by By Distribution Channel (2016-2032)
- Table 169: Middle East & Africa Clean Beauty Market Market Share Comparison by Country (2016-2032)
- Table 170: Middle East & Africa Clean Beauty Market Market Share Comparison by By Product Type (2016-2032)
- Table 171: Middle East & Africa Clean Beauty Market Market Share Comparison by By Product Form (2016-2032)
- Table 172: Middle East & Africa Clean Beauty Market Market Share Comparison by By Age Group (2016-2032)
- Table 173: Middle East & Africa Clean Beauty Market Market Share Comparison by By Gender (2016-2032)
- Table 174: Middle East & Africa Clean Beauty Market Market Share Comparison by By Distribution Channel (2016-2032)
- 1. Executive Summary
-
- Burt's Bees
- bareMinerals
- Ere Perez Natural Cosmetics
- Avon
- Juice Beauty, Inc.
- Honest Beauty LLC
- Kjaer Weis
- Inika
- rms beauty
- Vapour Beauty
- Mineral Fusion Natural Brands
- BITE Beauty
Our Clients


View Our Licence Options
