Autonomous Vehicles Market By Type(Passenger Vehicle, Commercial Vehicle), By Mobility Type (Shared Mobility, Personal Mobility), By Level of Autonomy (L1, L2, L3, L4, L5), By Propulsion Type (Semi-autonomous, Fully Autonomous), By Region And Companies - Industry Segment Outlook, Market Assessment, Competition Scenario, Trends, And Forecast Period 2024-2033
-
51085
-
Sept 2024
-
210
-


-
This report was compiled by Kalyani Khudsange Kalyani Khudsange is a Research Analyst at Prudour Pvt. Ltd. with 2.5 years of experience in market research and a strong technical background in Chemical Engineering and manufacturing. Correspondence Sr. Research Analyst Linkedin | Detailed Market research Methodology Our methodology involves a mix of primary research, including interviews with leading mental health experts, and secondary research from reputable medical journals and databases. View Detailed Methodology Page
-
Quick Navigation
Report Overview
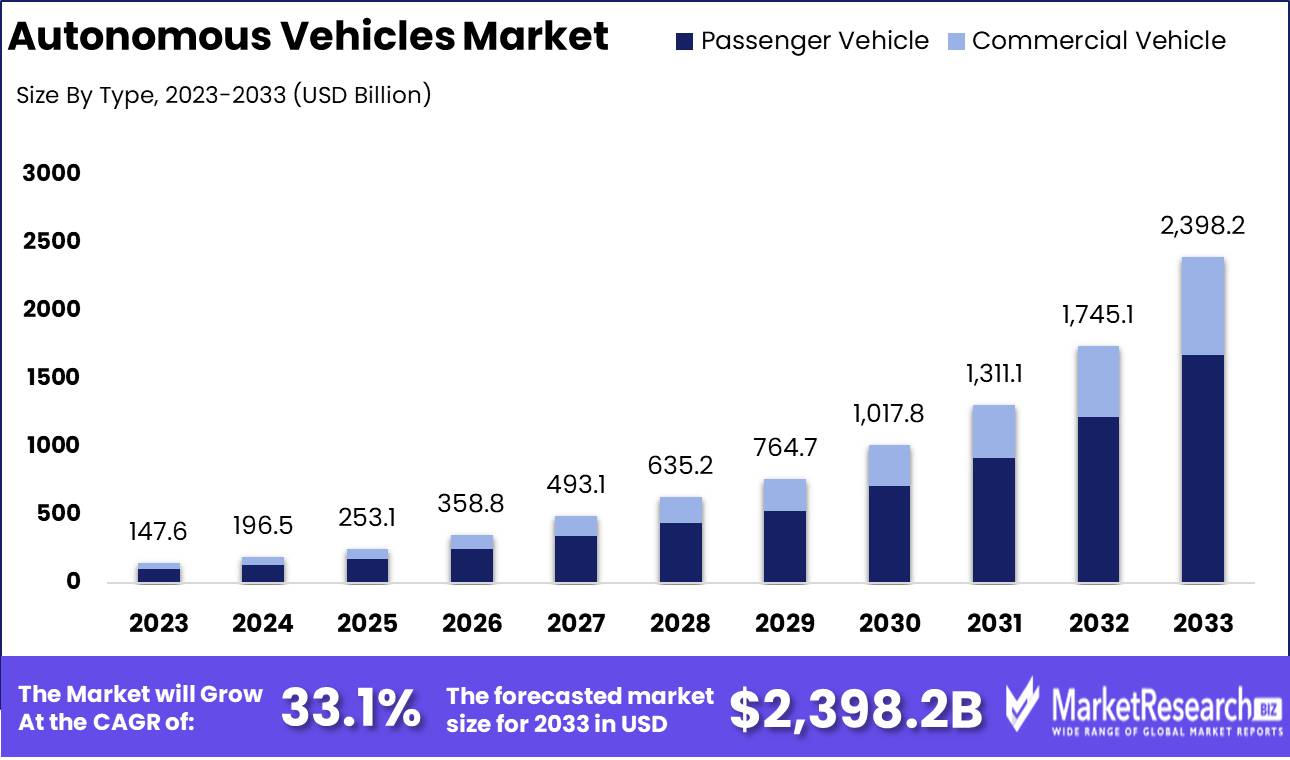
The Global Autonomous Vehicles Market was valued at USD 147.6 Billion in 2023. It is expected to reach USD 2,398.2 Billion by 2033, with a Compound annual growth rate (CAGR) of 33.1% during the forecast period from 2024 to 2033.
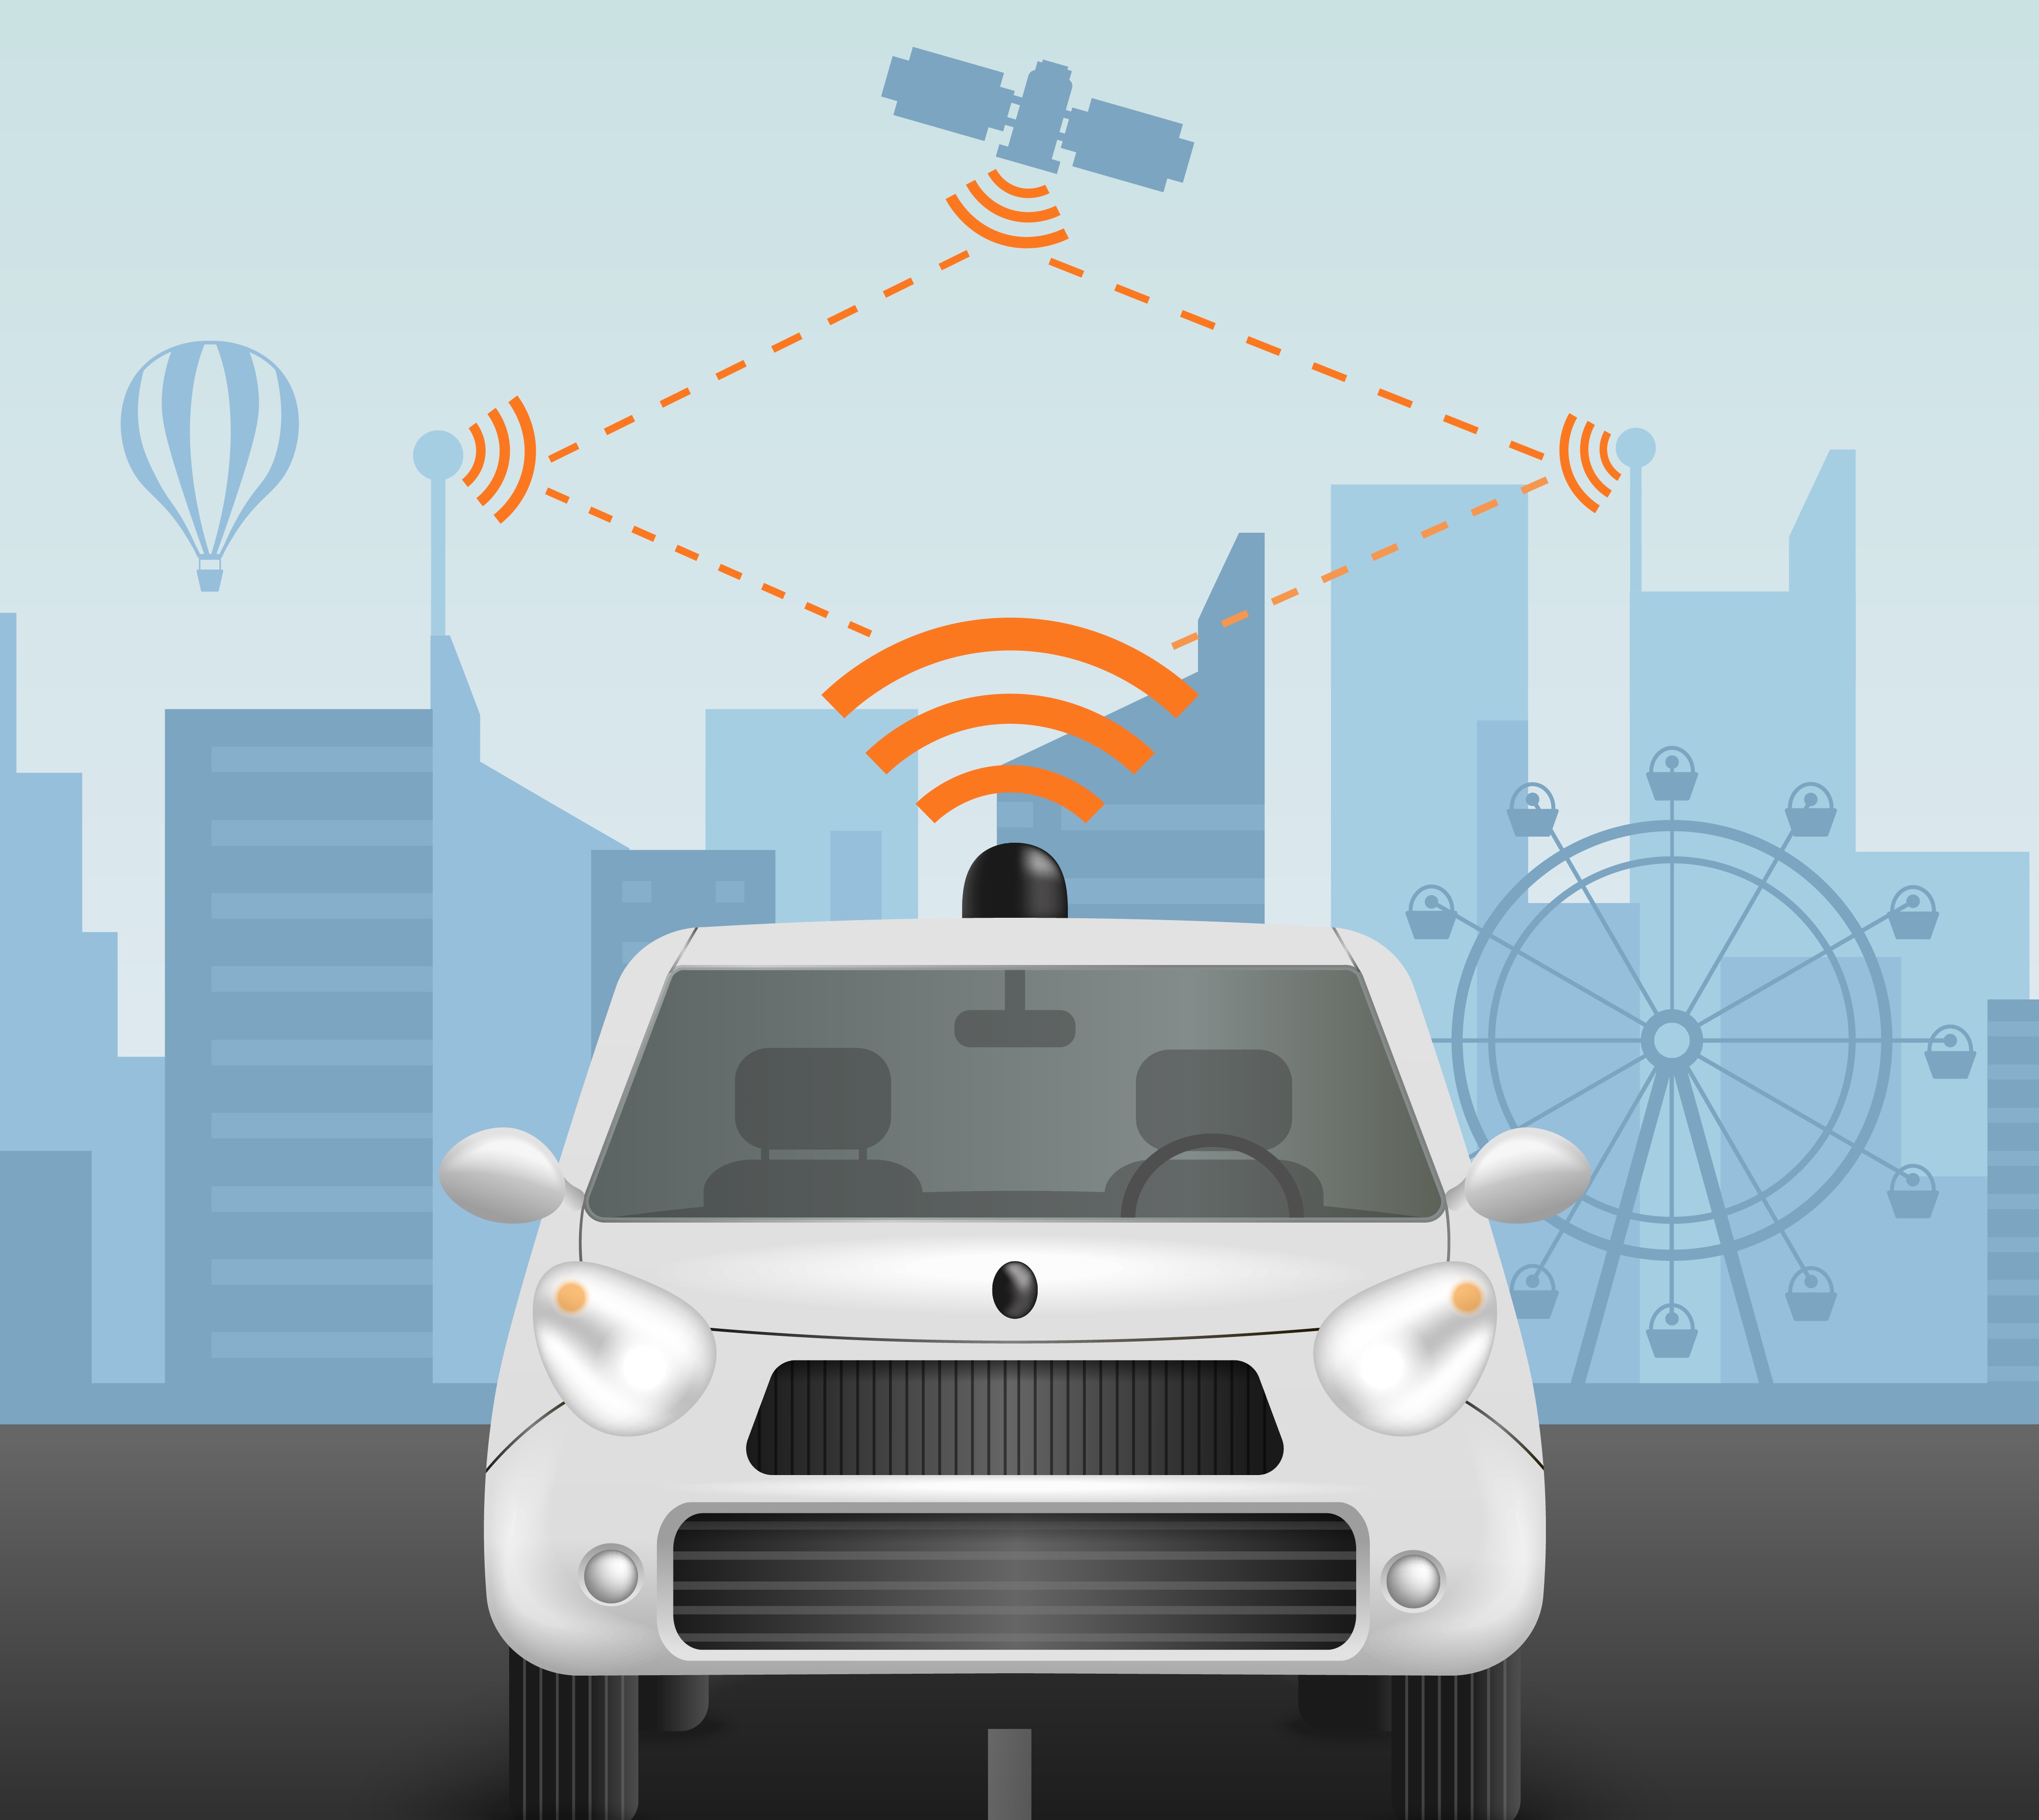
The Autonomous Vehicles market refers to the sector within the automotive industry focused on the development, production, and deployment of self-driving cars, also known as driverless vehicles. These vehicles utilize advanced technologies such as AI, machine learning, and sensor fusion to operate and navigate without human intervention. This market spans various sectors, including passenger vehicles, logistics, and public transportation. Key players are advancing innovations in both hardware and software, as well as shaping regulatory frameworks. As the demand for safer and more efficient transportation solutions rises, autonomous vehicles are expected to transform traditional automotive models, redefine urban mobility, and deliver significant benefits such as reduced accidents, lower operational costs, and enhanced convenience.
The Autonomous Vehicles market is evolving at a rapid pace, driven by significant advancements in AI, machine learning, and sensor technology. As companies like Waymo, Tesla, and Aurora continue to invest in AI-powered driving systems and sensor innovations, AVs are becoming more adept at handling complex driving environments. These advancements not only improve safety and efficiency but also present significant commercial opportunities, particularly in logistics and urban transportation. For instance, autonomous freight solutions have the potential to transform long-haul trucking by reducing labor costs, while ride-hailing platforms utilizing AVs can scale more effectively, offering cost-efficient and accessible mobility services.
Recent investment activity underscores the growing momentum in the AV space. In May 2024, UK-based Wayve secured $1.05 billion in Series C funding, led by SoftBank and supported by NVIDIA and Microsoft, to accelerate the development of camera- and GPS-based autonomous systems. This funding highlights the increasing interest in making AV technology more scalable and accessible. Similarly, Nuro’s $2.1 billion Series D round supports its mission of automating last-mile delivery, partnering with major brands like Walmart and Domino’s. Aurora Innovation, a leader in autonomous trucking, raised $820 million in 2023, signaling strong confidence in the future of self-driving freight technology.
The surge in capital inflow is not limited to Western markets. Indian EV startup Euler Motors raised $24 million in Series C funding in 2024, focusing on electric three-wheelers for urban logistics. Meanwhile, U.S.-based May Mobility secured $105 million in Series D, bolstering its autonomous shuttle services that have delivered over 320,000 public rides since 2019. These developments emphasize a broadening global market for AV technology, with substantial commercial applications in logistics, ride-hailing, and last-mile delivery, making it a pivotal area for investment and technological innovation.
Key Takeaways
- Growth Analysis: Autonomous Vehicles Market Size, valued at USD 147.6 billion in 2023, is projected to grow to USD 2,398.2 billion by 2033, reflecting a robust CAGR of 33.1% from 2024 to 2033.
- By Type: Passenger Vehicles held 70% of the market share in 2023, driven by demand for ADAS and autonomous features.
- By Mobility Type: Shared Mobility led with 60% market share due to increasing urbanization and demand for flexible transport.
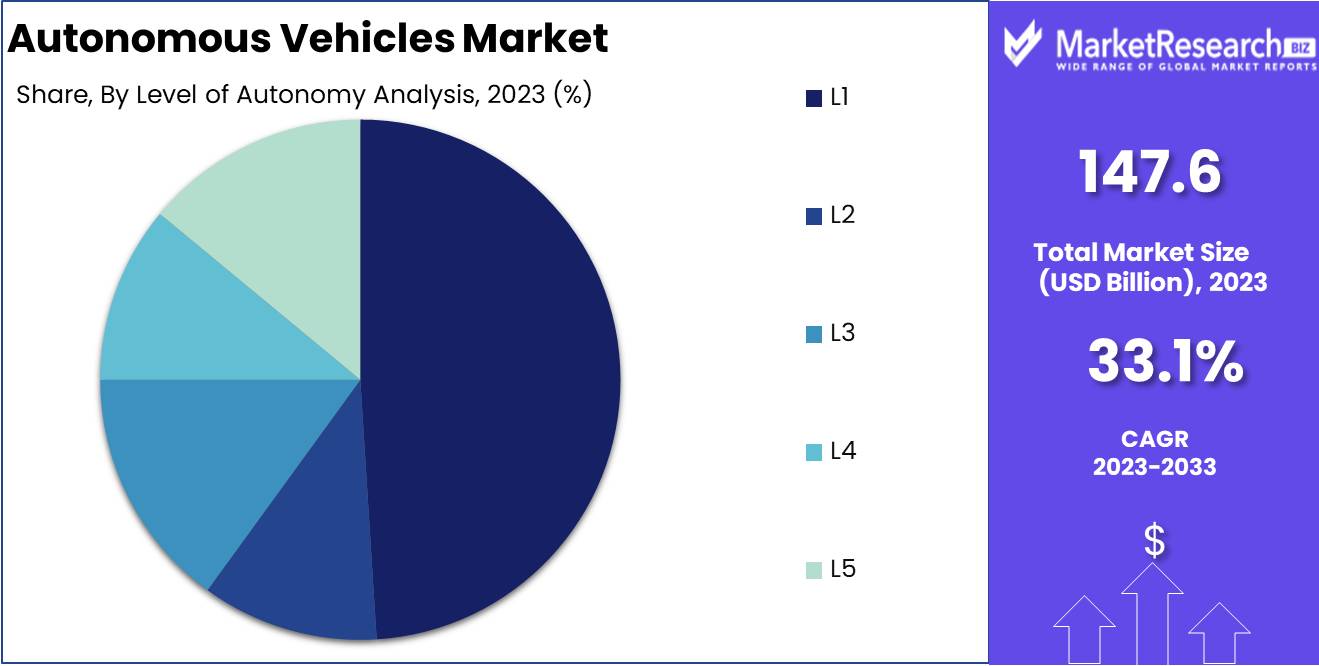
- By Level of Autonomy: L1 Automation dominated with 49% share, attributed to consumer preference for incremental automation.
- By Propulsion Type: Semi-Autonomous Vehicles captured 45% of the market, supported by advanced driver-assistance technologies.
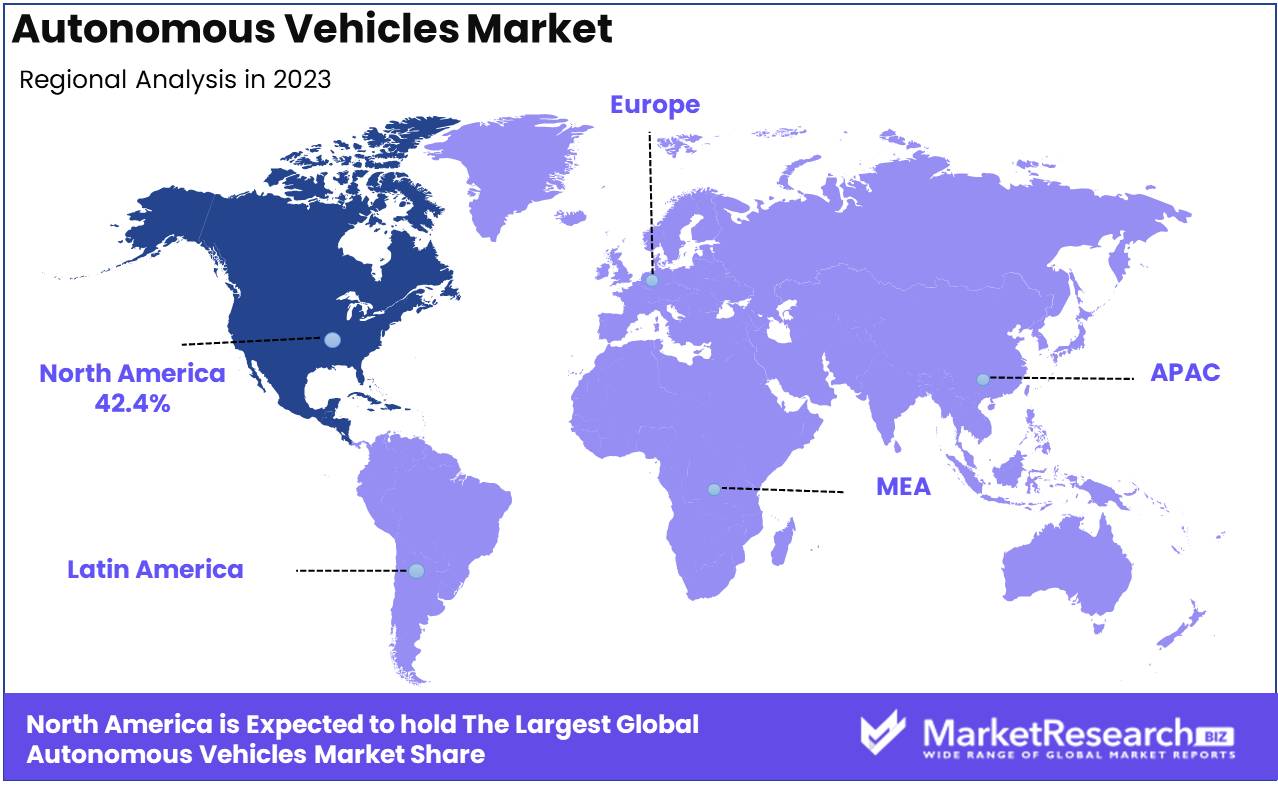
- Regional Growth: North America, led by the U.S., accounted for 42.4% of the market, driven by strong investments and early adoption of AV technology. Asia Pacific is expected to see rapid growth, particularly in China and Japan.
- Driving Factors: Advancements in AI and sensor technologies are enhancing AV navigation and safety, fueling market growth in logistics and ride-hailing.
- Restraining Factors: High development costs and regulatory ambiguity, especially around liability and insurance, pose barriers to wider adoption of AV technologies.
- Global Investment Surge: Major funding rounds, like Wayve’s $1.05 billion and Nuro’s $2.1 billion, underscore growing confidence in AV technologies.
- AI and Sensor Innovation: AI, machine learning, and sensor technologies are crucial drivers for enhancing AV capabilities.
Driving factors
Technological Advancements in AI and Sensors
The rapid development of artificial intelligence (AI), machine learning (ML), and sensor technologies is a cornerstone of growth in the autonomous vehicle (AV) market. These advancements drive the ability of AVs to navigate complex environments, process vast streams of real-time data, and make precise decisions—functions critical for ensuring both safety and operational efficiency. AI and ML algorithms are integral to the continuous improvement of AV systems, enabling them to learn from real-world driving conditions and adapt to varied environments. This translates directly into enhanced vehicle performance and reliability, contributing to the overall viability of autonomous solutions for both private and commercial use.
Innovations in sensor technologies—such as LiDAR, radar, and camera systems—are equally transformative. These sensors allow AVs to accurately map their surroundings and detect obstacles, pedestrians, and other vehicles. The combined improvements in AI and sensor technologies significantly reduce the risks associated with autonomous driving, increasing consumer and regulatory confidence in these systems. Companies like Waymo and Tesla are spearheading investments in these areas, with some reports indicating that over $50 billion in venture capital has been funneled into autonomous vehicle startups globally by 2023. This surge in funding underscores the industry's commitment to developing safe, scalable AV systems that can meet both current and future demands.
Commercial Opportunities in Transportation and Logistics
The autonomous vehicle market is also poised for accelerated growth due to its transformative potential in the transportation and logistics sectors. Autonomous freight and delivery systems present a compelling opportunity to reduce labor costs and increase efficiency, particularly in long-haul trucking and last-mile delivery—two areas where driver shortages and high operational costs have long posed challenges. With AV technology, logistics companies can streamline operations, optimize routes, and minimize human error, translating to faster, more reliable service delivery and reduced fuel consumption. As an example, the autonomous trucking company TuSimple has already demonstrated fuel savings of up to 10% in long-haul operations.
Ride-hailing services are another commercial area where AV technology is expected to disrupt the status quo. Autonomous ride-hailing platforms like Waymo One and Cruise offer scalable, on-demand transportation solutions that reduce the need for human drivers, thus lowering operational costs and increasing accessibility. The cost efficiencies realized through autonomous systems—combined with consumer demand for more accessible and flexible transportation options—are likely to drive further investments in this space.
Restraining Factors
High Development Costs: A Barrier to Entry but a Catalyst for Technological Excellence
The development of autonomous vehicles (AVs) requires substantial investment in R&D, sophisticated technology, and rigorous testing. Costs associated with LiDAR, radar, cameras, and advanced AI software can range into the billions for some manufacturers, creating high entry barriers for new players. For instance, Waymo, one of the market leaders, reportedly spends upwards of $1 billion annually on autonomous technology development. This level of capital outlay is beyond the reach of many potential entrants, resulting in market consolidation around a few dominant players with the resources to advance the technology.
While this high cost can deter competition and slow market expansion, it also drives innovation. Larger manufacturers, such as Tesla, Google, and traditional automakers like General Motors and Ford, are incentivized to push the boundaries of AV technology to justify their investments. The fierce competition among these major players can lead to breakthrough innovations that improve the safety, reliability, and affordability of AV systems over time.
However, high development costs also limit consumer adoption by driving up the price of AVs, particularly in the early stages of market development. This dynamic is expected to persist until economies of scale, technological maturity, and increased competition bring costs down, broadening the market's appeal.
Liability and Insurance Issues: Regulatory Ambiguity Slowing Adoption
The complexities surrounding liability and insurance represent a significant challenge in the autonomous vehicles market. In the event of an accident involving an AV, determining whether the responsibility lies with the manufacturer, software developer, or even the passenger is a contentious issue. This ambiguity has led to a cautious approach from insurers and legal bodies, creating uncertainty that hampers consumer confidence and limits the speed of market growth.
In the U.S. alone, more than 90% of accidents are currently attributed to human error, and AVs are designed to drastically reduce this number. However, the legal framework surrounding fault in AV-related incidents remains underdeveloped. This complicates insurance models, which are traditionally based on human responsibility, and could lead to costly premiums or prolonged legal battles over fault determination. Without clear regulatory guidelines, automakers and consumers alike may hesitate to fully embrace AVs, concerned about potential liabilities.
Additionally, the high-profile nature of AV accidents—such as the fatal Uber test vehicle crash in 2018—can lead to public skepticism and regulatory delays, further slowing market expansion. Manufacturers and policymakers must work together to develop a comprehensive legal framework that addresses these concerns, promoting both innovation and consumer confidence in AV technologies.
By Type Analysis
Passenger Vehicle Segment Dominated the Market with a 70.0% Largest Share in 2023
In 2023, Passenger Vehicle held a dominant market position in the By Type segment of the Autonomous Vehicles Market, capturing more than 70.0% of the total market share. This dominance can be attributed to several factors, including heightened consumer demand for advanced driver-assistance systems (ADAS) and autonomous driving features, particularly in urban and suburban environments. The rapid adoption of these technologies by automotive manufacturers, coupled with increasing government regulations aimed at improving road safety, has accelerated the integration of autonomous features in passenger vehicles. Furthermore, the development of electric and hybrid vehicles has synergized with autonomous technologies, bolstering passenger vehicles' market presence.
On the other hand, Commercial Vehicles also demonstrated significant potential within the autonomous vehicle market, albeit with a smaller share compared to passenger vehicles. The commercial vehicle segment is witnessing increasing investments, particularly in sectors like logistics, public transportation, and delivery services, where autonomous solutions can drive efficiency and reduce operational costs. However, the commercial vehicle sector faces longer development cycles and more stringent regulatory hurdles, which has contributed to its relatively lower market share when compared to passenger vehicles in 2023.
By Mobility Type Analysis
Shared Mobility Segment Dominated the Market with a 60.0% Revenue Share in 2023
In 2023, Shared Mobility held a dominant market position in the By Mobility Type segment of the Autonomous Vehicles Market, capturing more than 60.0% of the total market share. The significant growth in shared mobility services, including ride-hailing, car-sharing, and autonomous shuttle services, has been a major driver of this trend. Increasing urbanization, growing environmental concerns, and shifting consumer preferences toward cost-efficient and flexible transportation solutions have accelerated the adoption of shared autonomous vehicles. Furthermore, the rise of smart city initiatives and advancements in fleet management technologies have contributed to the dominance of shared mobility within this segment.Conversely, the Personal Mobility segment accounted for a smaller portion of the market in 2023. While personal autonomous vehicles continue to gain traction, especially among premium consumers seeking private, autonomous transport options, the higher upfront costs and slower adoption rate of fully autonomous vehicles for individual use have limited the segment’s overall market share. Despite this, personal mobility is expected to witness steady growth as technology becomes more accessible and consumer trust in autonomous vehicles increases.
By Level of Autonomy Analysis
L1 Segment Dominated the Market with a 49.0% Largest Share in 2023
In 2023, L1 held a dominant market position in the By Level of Autonomy segment of the Autonomous Vehicles Market, capturing more than 49.0% of the total market share. L1, which includes vehicles with driver assistance systems such as adaptive cruise control and lane-keeping assistance, has seen widespread adoption due to its affordability and ease of integration into existing vehicle models. The demand for enhanced safety features, along with consumer preference for incremental automation rather than fully autonomous systems, has contributed to the L1 segment’s leadership in the market.L2 and L3 levels of autonomy, which offer higher degrees of automated driving but still require driver intervention, captured smaller market shares. These levels are gaining traction, particularly in luxury and high-performance vehicle segments, as technological advancements enable greater levels of automation. However, the higher costs and regulatory challenges have slowed their broader market penetration.
Further up the spectrum, L4 and L5—which represent fully autonomous systems—accounted for minimal market shares in 2023. Despite significant technological advancements, mass adoption of fully autonomous vehicles remains hindered by regulatory, infrastructural, and safety challenges. Nevertheless, these levels hold strong growth potential in future years as technology and regulatory frameworks evolve.
By Propulsion Type Analysis
Semi-autonomous Segment Dominated the Market with a 45.0% Revenue Share in 2023
In 2023, Semi-autonomous vehicles held a dominant market position in the By Propulsion Type segment of the Autonomous Vehicles Market, capturing more than 45.0% of the total market share. This dominance is driven by the increasing integration of advanced driver-assistance systems (ADAS) in conventional vehicles, offering features such as automated braking, lane-keeping assistance, and adaptive cruise control. Semi-autonomous vehicles provide a balance between advanced technology and affordability, allowing consumers to experience partial automation while still maintaining control of the vehicle. This has led to a strong preference for semi-autonomous vehicles, especially in regions with a high focus on safety and regulatory compliance.Fully Autonomous vehicles, while gaining attention and undergoing significant development, accounted for a smaller market share in 2023. The deployment of fully autonomous vehicles faces challenges related to regulatory approval, high development costs, and public trust in driverless technology. However, ongoing advancements and investments in AI, sensors, and infrastructure suggest strong future growth potential for fully autonomous vehicles, especially in sectors like shared mobility and logistics.
Key Market Segments
By Type
- Passenger Vehicle
- Commercial Vehicle
By Mobility Type
- Shared Mobility
- Personal Mobility
By Level of Autonomy
- L1
- L2
- L3
- L4
- L5
By Propulsion Type
- Semi-autonomous
- Fully Autonomous
Growth Opportunity
Ride-Hailing and Shared Mobility
Autonomous vehicles (AVs) present immense growth potential in the ride-hailing and shared mobility sectors, offering efficiency and cost-effectiveness by eliminating the need for human drivers. This reduction in labor costs can greatly benefit ride-hailing platforms, allowing them to operate more profitably. Furthermore, AVs can provide increased accessibility, particularly for underserved communities and individuals unable to drive, thereby expanding the user base for these services. Another critical benefit is reduced congestion—autonomous vehicles can optimize routes, minimize idle time, and drive more efficiently, which is essential for urban areas struggling with traffic congestion. As cities look for sustainable solutions, AVs in shared mobility will be a critical growth driver.
Autonomous Shuttles and Public Transportation
Autonomous shuttles and other public transportation applications offer an equally significant growth opportunity. By deploying autonomous shuttles in regions with limited public transportation, AVs can enhance accessibility, connecting underserved areas to vital services. The improved efficiency of AVs in public transport stems from their ability to optimize routes and schedules in real-time, leading to faster, more reliable services. Moreover, autonomous shuttles can contribute to reduced congestion by lowering the number of personal vehicles on the road, which complements urban sustainability goals.
Latest Trends
Enhanced Sensor Technology Driving Safety and Precision
In 2024, advancements in sensor technology are at the forefront of the global autonomous vehicles market. LiDAR systems are evolving with higher resolution and extended range capabilities, significantly improving a vehicle’s ability to perceive its surroundings, even in challenging low-light or adverse weather conditions. This is complemented by progress in camera systems, where high-resolution sensors and advanced image processing algorithms allow for more accurate object detection and recognition, enhancing overall safety. Radar systems are also becoming increasingly sophisticated, offering precise measurements of an object's distance, speed, and trajectory, which are crucial for collision avoidance and navigation in complex environments. These developments collectively enhance situational awareness, contributing to safer and more reliable autonomous driving.
Advancements in Artificial Intelligence Powering Autonomous Decision-Making
Artificial Intelligence (AI) continues to be a pivotal driver in autonomous vehicle technology in 2024. Deep learning algorithms are playing a crucial role by enabling vehicles to recognize patterns and make decisions in real time, allowing them to adapt to dynamic road conditions. This technology is essential for complex decision-making processes, such as navigating through unpredictable traffic patterns. Additionally, Natural Language Processing (NLP) is being integrated into autonomous systems, allowing vehicles to understand and respond to human commands, improving user interaction and creating a more intuitive experience. These AI advancements are critical for pushing the boundaries of vehicle autonomy and ensuring a smoother, safer ride.
Regional Analysis
North America Leads Regional Market for Autonomous Vehicle Development, Accounting for 42.4% of Global Revenue
North America leads the regional market for autonomous vehicle development, capturing 42.4% of global revenue. The United States is a key contributor to this dominance, supported by government initiatives and significant private-sector investments in autonomous vehicle technologies. Companies like Waymo, Tesla, and GM's Cruise are at the forefront, benefiting from favorable regulations, a robust tech ecosystem, and advancements in vehicle safety. Canada also plays a critical role, focusing on integrating autonomous solutions into public transportation systems. The region’s leadership is further reinforced by high consumer awareness and adoption of advanced sensors and mobility solutions.
Europe is another influential player in autonomous vehicle development, with Germany, France, and the UK leading the charge. Germany, home to major automotive companies like BMW and Volkswagen, invests heavily in research and development for autonomous driving technologies. Similarly, the UK and France are advancing through government initiatives that promote testing on public roads and smart city infrastructure. Nations like the Netherlands and Spain are concentrating on infrastructure upgrades to support autonomous mobility.
The Asia Pacific region is poised to be the fastest-growing market for autonomous vehicles, driven by China and Japan. China’s aggressive government-backed policies aim to establish the country as a global leader in electric and autonomous vehicle development. Key players like Baidu and AutoX are making notable advancements. In Japan, automakers such as Toyota and Honda are focusing on autonomous vehicle technologies, addressing future needs like supporting an aging population.
Latin America represents an emerging market, with Mexico and Brazil leading autonomous vehicle efforts. In Mexico, the automotive manufacturing sector is increasingly embracing automation, and the government is evaluating autonomous public transportation. Brazil is showing potential despite regulatory and infrastructure challenges, driven by interest from tech and automotive companies.
The Middle East & Africa is in the nascent stage of autonomous vehicle development but holds promise, particularly in the UAE and Saudi Arabia. The UAE’s smart city initiatives position it as a future hub for autonomous mobility, with pilot projects for autonomous taxis and public transportation already underway. Saudi Arabia is investing significantly in advanced transportation technologies under its Vision 2030 initiative.
While North America currently dominates the autonomous vehicle market, Asia Pacific is expected to challenge this position as China and Japan rapidly advance their capabilities in autonomous vehicle development, particularly with innovations in vehicle safety and advanced sensors.
Key Regions and Countries
North America
- The US
- Canada
- Rest of North America
Europe
- Germany
- France
- The UK
- Spain
- Netherlands
- Russia
- Italy
- Rest of Europe
Asia-Pacific
- China
- Japan
- Singapore
- Thailand
- South Korea
- Vietnam
- India
- New Zealand
- Rest of Asia Pacific
Latin America
- Mexico
- Brazil
- Rest of Latin America
Middle East & Africa
- Saudi Arabia
- South Africa
- UAE
- Rest of Middle East & Africa
Key Players Analysis
The autonomous vehicles market in 2024 is defined by the rapid advancements made by several key players, each with distinct strategies and technological innovations shaping the industry's future. Tesla, Inc. remains a dominant force, leveraging its extensive electric vehicle (EV) ecosystem and advanced Full Self-Driving (FSD) capabilities, continuously improving through over-the-air updates. Cruise, backed by General Motors, is also at the forefront, particularly in deploying autonomous ride-hailing services, gaining momentum in U.S. cities.
Ford Motor Company and Nuro are emphasizing diverse applications of autonomy, with Ford focusing on logistics and commercial delivery through its partnership with Argo AI, and Nuro leading in the autonomous delivery space, especially for retail. Zoox, an Amazon subsidiary, is making headway with its purpose-built autonomous vehicle, signaling a shift toward next-generation urban mobility solutions.
European automakers such as Renault SA, Volkswagen Group, BMW, and Mercedes-Benz AG are enhancing their autonomous platforms, integrating advanced AI and sensor technologies. Toyota Motor Corporation and Hyundai Motor Group, major players from Asia, are aggressively pursuing self-driving technologies in tandem with EV development, focusing on creating scalable, mass-market autonomous solutions.
Aurora Innovation and AB Volvo stand out for their focus on commercial fleets and logistics, targeting long-haul autonomous driving and smart freight systems. Nissan continues to build on its ProPILOT system, aiming to make semi-autonomous features more accessible in consumer vehicles.
Market Key Players
- Tesla, Inc
- Cruise
- Ford Motor Company
- Nuro
- Zoox
- Renault SA
- Aurora Innovation
- Hyundai Motor Group
- Toyota Motor Corporation
- Volkswagen AG
- BMW
- Mercedes-Benz AG
- Nissan
- General Motors
- AB Volvo
Recent Developments
- In May 2024, Wayve, a UK-based autonomous vehicle startup, raised $1.05 billion in Series C funding. The round was led by SoftBank, with additional investment from NVIDIA and Microsoft. Wayve is developing self-driving technology using cameras and GPS data to make autonomous driving more accessible and affordable.
- In May 2024,Euler Motors, Indian electric vehicle startup Euler Motors raised $24 million in Series C funding. The company designs and produces electric powertrains, batteries, and charging infrastructure for electric vehicles, including three-wheelers and vans for urban logistics.
- In 2024, May Mobility, a company offering autonomous shuttle services in cities, raised $105 million in Series D funding. Since launching its services in 2019, the company has provided over 320,000 rides globally.
- In 2024, Nuro, a startup specializing in autonomous delivery vehicles, raised $2.1 billion in Series D funding. The company partners with brands like Domino's Pizza, Chipotle, Kroger, and Walmart to provide robotic delivery services.
- In July 2023, Aurora, a leader in self-driving truck technology, raised $820 million. The company, valued at $10.6 billion, has partnerships with Volvo and PACCAR, focusing on scaling autonomous trucking.
Report Scope
Report Features Description Market Value (2023) USD 147.6 Bn Forecast Revenue (2033) USD 2,398.2 Bn CAGR (2024-2032) 33.1% Base Year for Estimation 2023 Historic Period 2016-2023 Forecast Period 2024-2033 Report Coverage Revenue Forecast, Market Dynamics, COVID-19 Impact, Competitive Landscape, Recent Developments Segments Covered By Type(Passenger Vehicle, Commercial Vehicle), By Mobility Type (Shared Mobility, Personal Mobility), By Level of Autonomy (L1, L2, L3, L4, L5), By Propulsion Type (Semi-autonomous, Fully Autonomous) Regional Analysis North America - The US, Canada, Rest of North America, Europe - Germany, France, The UK, Spain, Italy, Russia, Netherlands, Rest of Europe, Asia-Pacific - China, Japan, South Korea, India, New Zealand, Singapore, Thailand, Vietnam, Rest of Asia Pacific, Latin America - Brazil, Mexico, Rest of Latin America, Middle East & Africa - South Africa, Saudi Arabia, UAE, Rest of Middle East & Africa Competitive Landscape Tesla, Inc, Cruise, Ford Motor Company, Nuro, Zoox , Renault SA, Aurora Innovation, Hyundai Motor Group, Toyota Motor Corporation, Volkswagen Group, BMW, Mercedes-Benz AG, Nissan, General Motors, AB Volvo Customization Scope Customization for segments, region/country-level will be provided. Moreover, additional customization can be done based on the requirements. Purchase Options We have three licenses to opt for Single User License, Multi-User License (Up to 5 Users), Corporate Use License (Unlimited User and Printable PDF) -
1. Executive Summary
-
- 1.1. Definition
- 1.2. Taxonomy
- 1.3. Research Scope
- 1.4. Key Analysis
- 1.5. Key Findings by Major Segments
- 1.6. Top strategies by Major Players
- 2. Global Autonomous Vehicles Market Overview
- 2.1. Autonomous Vehicles Market Dynamics
- 2.1.1. Drivers
- 2.1.2. Opportunities
- 2.1.3. Restraints
- 2.1.4. Challenges
- 2.2. Macro-economic Factors
- 2.3. Regulatory Framework
- 2.4. Market Investment Feasibility Index
- 2.5. PEST Analysis
- 2.6. PORTER’S Five Force Analysis
- 2.7. Drivers & Restraints Impact Analysis
- 2.8. Industry Chain Analysis
- 2.9. Cost Structure Analysis
- 2.10. Marketing Strategy
- 2.11. Russia-Ukraine War Impact Analysis
- 2.12. Opportunity Map Analysis
- 2.13. Market Competition Scenario Analysis
- 2.14. Product Life Cycle Analysis
- 2.15. Opportunity Orbits
- 2.16. Manufacturer Intensity Map
- 2.17. Major Companies sales by Value & Volume
- 2.1. Autonomous Vehicles Market Dynamics
- 3. Global Autonomous Vehicles Market Analysis, Opportunity and Forecast, 2016-2032
- 3.1. Global Autonomous Vehicles Market Analysis, 2016-2021
- 3.2. Global Autonomous Vehicles Market Opportunity and Forecast, 2023-2032
- 3.3. Global Autonomous Vehicles Market Analysis, Opportunity and Forecast, By By Type, 2016-2032
- 3.3.1. Global Autonomous Vehicles Market Analysis by By Type: Introduction
- 3.3.2. Market Size Absolute $ Opportunity Analysis and Forecast, By By Type, 2016-2032
- 3.3.3. Passenger Vehicle
- 3.3.4. Commercial Vehicle
- 3.4. Global Autonomous Vehicles Market Analysis, Opportunity and Forecast, By By Mobility Type, 2016-2032
- 3.4.1. Global Autonomous Vehicles Market Analysis by By Mobility Type: Introduction
- 3.4.2. Market Size Absolute $ Opportunity Analysis and Forecast, By By Mobility Type, 2016-2032
- 3.4.3. Shared Mobility
- 3.4.4. Personal Mobility
- 3.5. Global Autonomous Vehicles Market Analysis, Opportunity and Forecast, By By Level of Autonomy, 2016-2032
- 3.5.1. Global Autonomous Vehicles Market Analysis by By Level of Autonomy: Introduction
- 3.5.2. Market Size Absolute $ Opportunity Analysis and Forecast, By By Level of Autonomy, 2016-2032
- 3.5.3. L1
- 3.5.4. L2
- 3.5.5. L3
- 3.5.6. L4
- 3.5.7. L5
- 3.6. Global Autonomous Vehicles Market Analysis, Opportunity and Forecast, By By Propulsion Type, 2016-2032
- 3.6.1. Global Autonomous Vehicles Market Analysis by By Propulsion Type: Introduction
- 3.6.2. Market Size Absolute $ Opportunity Analysis and Forecast, By By Propulsion Type, 2016-2032
- 3.6.3. Semi-autonomous
- 3.6.4. Fully Autonomous
- 4. North America Autonomous Vehicles Market Analysis, Opportunity and Forecast, 2016-2032
- 4.1. North America Autonomous Vehicles Market Analysis, 2016-2021
- 4.2. North America Autonomous Vehicles Market Opportunity and Forecast, 2023-2032
- 4.3. North America Autonomous Vehicles Market Analysis, Opportunity and Forecast, By By Type, 2016-2032
- 4.3.1. North America Autonomous Vehicles Market Analysis by By Type: Introduction
- 4.3.2. Market Size Absolute $ Opportunity Analysis and Forecast, By By Type, 2016-2032
- 4.3.3. Passenger Vehicle
- 4.3.4. Commercial Vehicle
- 4.4. North America Autonomous Vehicles Market Analysis, Opportunity and Forecast, By By Mobility Type, 2016-2032
- 4.4.1. North America Autonomous Vehicles Market Analysis by By Mobility Type: Introduction
- 4.4.2. Market Size Absolute $ Opportunity Analysis and Forecast, By By Mobility Type, 2016-2032
- 4.4.3. Shared Mobility
- 4.4.4. Personal Mobility
- 4.5. North America Autonomous Vehicles Market Analysis, Opportunity and Forecast, By By Level of Autonomy, 2016-2032
- 4.5.1. North America Autonomous Vehicles Market Analysis by By Level of Autonomy: Introduction
- 4.5.2. Market Size Absolute $ Opportunity Analysis and Forecast, By By Level of Autonomy, 2016-2032
- 4.5.3. L1
- 4.5.4. L2
- 4.5.5. L3
- 4.5.6. L4
- 4.5.7. L5
- 4.6. North America Autonomous Vehicles Market Analysis, Opportunity and Forecast, By By Propulsion Type, 2016-2032
- 4.6.1. North America Autonomous Vehicles Market Analysis by By Propulsion Type: Introduction
- 4.6.2. Market Size Absolute $ Opportunity Analysis and Forecast, By By Propulsion Type, 2016-2032
- 4.6.3. Semi-autonomous
- 4.6.4. Fully Autonomous
- 4.7. North America Autonomous Vehicles Market Analysis, Opportunity and Forecast, By Country , 2016-2032
- 4.7.1. North America Autonomous Vehicles Market Analysis by Country : Introduction
- 4.7.2. Market Size Absolute $ Opportunity Analysis and Forecast, Country , 2016-2032
- 4.7.2.1. The US
- 4.7.2.2. Canada
- 4.7.2.3. Mexico
- 5. Western Europe Autonomous Vehicles Market Analysis, Opportunity and Forecast, 2016-2032
- 5.1. Western Europe Autonomous Vehicles Market Analysis, 2016-2021
- 5.2. Western Europe Autonomous Vehicles Market Opportunity and Forecast, 2023-2032
- 5.3. Western Europe Autonomous Vehicles Market Analysis, Opportunity and Forecast, By By Type, 2016-2032
- 5.3.1. Western Europe Autonomous Vehicles Market Analysis by By Type: Introduction
- 5.3.2. Market Size Absolute $ Opportunity Analysis and Forecast, By By Type, 2016-2032
- 5.3.3. Passenger Vehicle
- 5.3.4. Commercial Vehicle
- 5.4. Western Europe Autonomous Vehicles Market Analysis, Opportunity and Forecast, By By Mobility Type, 2016-2032
- 5.4.1. Western Europe Autonomous Vehicles Market Analysis by By Mobility Type: Introduction
- 5.4.2. Market Size Absolute $ Opportunity Analysis and Forecast, By By Mobility Type, 2016-2032
- 5.4.3. Shared Mobility
- 5.4.4. Personal Mobility
- 5.5. Western Europe Autonomous Vehicles Market Analysis, Opportunity and Forecast, By By Level of Autonomy, 2016-2032
- 5.5.1. Western Europe Autonomous Vehicles Market Analysis by By Level of Autonomy: Introduction
- 5.5.2. Market Size Absolute $ Opportunity Analysis and Forecast, By By Level of Autonomy, 2016-2032
- 5.5.3. L1
- 5.5.4. L2
- 5.5.5. L3
- 5.5.6. L4
- 5.5.7. L5
- 5.6. Western Europe Autonomous Vehicles Market Analysis, Opportunity and Forecast, By By Propulsion Type, 2016-2032
- 5.6.1. Western Europe Autonomous Vehicles Market Analysis by By Propulsion Type: Introduction
- 5.6.2. Market Size Absolute $ Opportunity Analysis and Forecast, By By Propulsion Type, 2016-2032
- 5.6.3. Semi-autonomous
- 5.6.4. Fully Autonomous
- 5.7. Western Europe Autonomous Vehicles Market Analysis, Opportunity and Forecast, By Country , 2016-2032
- 5.7.1. Western Europe Autonomous Vehicles Market Analysis by Country : Introduction
- 5.7.2. Market Size Absolute $ Opportunity Analysis and Forecast, Country , 2016-2032
- 5.7.2.1. Germany
- 5.7.2.2. France
- 5.7.2.3. The UK
- 5.7.2.4. Spain
- 5.7.2.5. Italy
- 5.7.2.6. Portugal
- 5.7.2.7. Ireland
- 5.7.2.8. Austria
- 5.7.2.9. Switzerland
- 5.7.2.10. Benelux
- 5.7.2.11. Nordic
- 5.7.2.12. Rest of Western Europe
- 6. Eastern Europe Autonomous Vehicles Market Analysis, Opportunity and Forecast, 2016-2032
- 6.1. Eastern Europe Autonomous Vehicles Market Analysis, 2016-2021
- 6.2. Eastern Europe Autonomous Vehicles Market Opportunity and Forecast, 2023-2032
- 6.3. Eastern Europe Autonomous Vehicles Market Analysis, Opportunity and Forecast, By By Type, 2016-2032
- 6.3.1. Eastern Europe Autonomous Vehicles Market Analysis by By Type: Introduction
- 6.3.2. Market Size Absolute $ Opportunity Analysis and Forecast, By By Type, 2016-2032
- 6.3.3. Passenger Vehicle
- 6.3.4. Commercial Vehicle
- 6.4. Eastern Europe Autonomous Vehicles Market Analysis, Opportunity and Forecast, By By Mobility Type, 2016-2032
- 6.4.1. Eastern Europe Autonomous Vehicles Market Analysis by By Mobility Type: Introduction
- 6.4.2. Market Size Absolute $ Opportunity Analysis and Forecast, By By Mobility Type, 2016-2032
- 6.4.3. Shared Mobility
- 6.4.4. Personal Mobility
- 6.5. Eastern Europe Autonomous Vehicles Market Analysis, Opportunity and Forecast, By By Level of Autonomy, 2016-2032
- 6.5.1. Eastern Europe Autonomous Vehicles Market Analysis by By Level of Autonomy: Introduction
- 6.5.2. Market Size Absolute $ Opportunity Analysis and Forecast, By By Level of Autonomy, 2016-2032
- 6.5.3. L1
- 6.5.4. L2
- 6.5.5. L3
- 6.5.6. L4
- 6.5.7. L5
- 6.6. Eastern Europe Autonomous Vehicles Market Analysis, Opportunity and Forecast, By By Propulsion Type, 2016-2032
- 6.6.1. Eastern Europe Autonomous Vehicles Market Analysis by By Propulsion Type: Introduction
- 6.6.2. Market Size Absolute $ Opportunity Analysis and Forecast, By By Propulsion Type, 2016-2032
- 6.6.3. Semi-autonomous
- 6.6.4. Fully Autonomous
- 6.7. Eastern Europe Autonomous Vehicles Market Analysis, Opportunity and Forecast, By Country , 2016-2032
- 6.7.1. Eastern Europe Autonomous Vehicles Market Analysis by Country : Introduction
- 6.7.2. Market Size Absolute $ Opportunity Analysis and Forecast, Country , 2016-2032
- 6.7.2.1. Russia
- 6.7.2.2. Poland
- 6.7.2.3. The Czech Republic
- 6.7.2.4. Greece
- 6.7.2.5. Rest of Eastern Europe
- 7. APAC Autonomous Vehicles Market Analysis, Opportunity and Forecast, 2016-2032
- 7.1. APAC Autonomous Vehicles Market Analysis, 2016-2021
- 7.2. APAC Autonomous Vehicles Market Opportunity and Forecast, 2023-2032
- 7.3. APAC Autonomous Vehicles Market Analysis, Opportunity and Forecast, By By Type, 2016-2032
- 7.3.1. APAC Autonomous Vehicles Market Analysis by By Type: Introduction
- 7.3.2. Market Size Absolute $ Opportunity Analysis and Forecast, By By Type, 2016-2032
- 7.3.3. Passenger Vehicle
- 7.3.4. Commercial Vehicle
- 7.4. APAC Autonomous Vehicles Market Analysis, Opportunity and Forecast, By By Mobility Type, 2016-2032
- 7.4.1. APAC Autonomous Vehicles Market Analysis by By Mobility Type: Introduction
- 7.4.2. Market Size Absolute $ Opportunity Analysis and Forecast, By By Mobility Type, 2016-2032
- 7.4.3. Shared Mobility
- 7.4.4. Personal Mobility
- 7.5. APAC Autonomous Vehicles Market Analysis, Opportunity and Forecast, By By Level of Autonomy, 2016-2032
- 7.5.1. APAC Autonomous Vehicles Market Analysis by By Level of Autonomy: Introduction
- 7.5.2. Market Size Absolute $ Opportunity Analysis and Forecast, By By Level of Autonomy, 2016-2032
- 7.5.3. L1
- 7.5.4. L2
- 7.5.5. L3
- 7.5.6. L4
- 7.5.7. L5
- 7.6. APAC Autonomous Vehicles Market Analysis, Opportunity and Forecast, By By Propulsion Type, 2016-2032
- 7.6.1. APAC Autonomous Vehicles Market Analysis by By Propulsion Type: Introduction
- 7.6.2. Market Size Absolute $ Opportunity Analysis and Forecast, By By Propulsion Type, 2016-2032
- 7.6.3. Semi-autonomous
- 7.6.4. Fully Autonomous
- 7.7. APAC Autonomous Vehicles Market Analysis, Opportunity and Forecast, By Country , 2016-2032
- 7.7.1. APAC Autonomous Vehicles Market Analysis by Country : Introduction
- 7.7.2. Market Size Absolute $ Opportunity Analysis and Forecast, Country , 2016-2032
- 7.7.2.1. China
- 7.7.2.2. Japan
- 7.7.2.3. South Korea
- 7.7.2.4. India
- 7.7.2.5. Australia & New Zeland
- 7.7.2.6. Indonesia
- 7.7.2.7. Malaysia
- 7.7.2.8. Philippines
- 7.7.2.9. Singapore
- 7.7.2.10. Thailand
- 7.7.2.11. Vietnam
- 7.7.2.12. Rest of APAC
- 8. Latin America Autonomous Vehicles Market Analysis, Opportunity and Forecast, 2016-2032
- 8.1. Latin America Autonomous Vehicles Market Analysis, 2016-2021
- 8.2. Latin America Autonomous Vehicles Market Opportunity and Forecast, 2023-2032
- 8.3. Latin America Autonomous Vehicles Market Analysis, Opportunity and Forecast, By By Type, 2016-2032
- 8.3.1. Latin America Autonomous Vehicles Market Analysis by By Type: Introduction
- 8.3.2. Market Size Absolute $ Opportunity Analysis and Forecast, By By Type, 2016-2032
- 8.3.3. Passenger Vehicle
- 8.3.4. Commercial Vehicle
- 8.4. Latin America Autonomous Vehicles Market Analysis, Opportunity and Forecast, By By Mobility Type, 2016-2032
- 8.4.1. Latin America Autonomous Vehicles Market Analysis by By Mobility Type: Introduction
- 8.4.2. Market Size Absolute $ Opportunity Analysis and Forecast, By By Mobility Type, 2016-2032
- 8.4.3. Shared Mobility
- 8.4.4. Personal Mobility
- 8.5. Latin America Autonomous Vehicles Market Analysis, Opportunity and Forecast, By By Level of Autonomy, 2016-2032
- 8.5.1. Latin America Autonomous Vehicles Market Analysis by By Level of Autonomy: Introduction
- 8.5.2. Market Size Absolute $ Opportunity Analysis and Forecast, By By Level of Autonomy, 2016-2032
- 8.5.3. L1
- 8.5.4. L2
- 8.5.5. L3
- 8.5.6. L4
- 8.5.7. L5
- 8.6. Latin America Autonomous Vehicles Market Analysis, Opportunity and Forecast, By By Propulsion Type, 2016-2032
- 8.6.1. Latin America Autonomous Vehicles Market Analysis by By Propulsion Type: Introduction
- 8.6.2. Market Size Absolute $ Opportunity Analysis and Forecast, By By Propulsion Type, 2016-2032
- 8.6.3. Semi-autonomous
- 8.6.4. Fully Autonomous
- 8.7. Latin America Autonomous Vehicles Market Analysis, Opportunity and Forecast, By Country , 2016-2032
- 8.7.1. Latin America Autonomous Vehicles Market Analysis by Country : Introduction
- 8.7.2. Market Size Absolute $ Opportunity Analysis and Forecast, Country , 2016-2032
- 8.7.2.1. Brazil
- 8.7.2.2. Colombia
- 8.7.2.3. Chile
- 8.7.2.4. Argentina
- 8.7.2.5. Costa Rica
- 8.7.2.6. Rest of Latin America
- 9. Middle East & Africa Autonomous Vehicles Market Analysis, Opportunity and Forecast, 2016-2032
- 9.1. Middle East & Africa Autonomous Vehicles Market Analysis, 2016-2021
- 9.2. Middle East & Africa Autonomous Vehicles Market Opportunity and Forecast, 2023-2032
- 9.3. Middle East & Africa Autonomous Vehicles Market Analysis, Opportunity and Forecast, By By Type, 2016-2032
- 9.3.1. Middle East & Africa Autonomous Vehicles Market Analysis by By Type: Introduction
- 9.3.2. Market Size Absolute $ Opportunity Analysis and Forecast, By By Type, 2016-2032
- 9.3.3. Passenger Vehicle
- 9.3.4. Commercial Vehicle
- 9.4. Middle East & Africa Autonomous Vehicles Market Analysis, Opportunity and Forecast, By By Mobility Type, 2016-2032
- 9.4.1. Middle East & Africa Autonomous Vehicles Market Analysis by By Mobility Type: Introduction
- 9.4.2. Market Size Absolute $ Opportunity Analysis and Forecast, By By Mobility Type, 2016-2032
- 9.4.3. Shared Mobility
- 9.4.4. Personal Mobility
- 9.5. Middle East & Africa Autonomous Vehicles Market Analysis, Opportunity and Forecast, By By Level of Autonomy, 2016-2032
- 9.5.1. Middle East & Africa Autonomous Vehicles Market Analysis by By Level of Autonomy: Introduction
- 9.5.2. Market Size Absolute $ Opportunity Analysis and Forecast, By By Level of Autonomy, 2016-2032
- 9.5.3. L1
- 9.5.4. L2
- 9.5.5. L3
- 9.5.6. L4
- 9.5.7. L5
- 9.6. Middle East & Africa Autonomous Vehicles Market Analysis, Opportunity and Forecast, By By Propulsion Type, 2016-2032
- 9.6.1. Middle East & Africa Autonomous Vehicles Market Analysis by By Propulsion Type: Introduction
- 9.6.2. Market Size Absolute $ Opportunity Analysis and Forecast, By By Propulsion Type, 2016-2032
- 9.6.3. Semi-autonomous
- 9.6.4. Fully Autonomous
- 9.7. Middle East & Africa Autonomous Vehicles Market Analysis, Opportunity and Forecast, By Country , 2016-2032
- 9.7.1. Middle East & Africa Autonomous Vehicles Market Analysis by Country : Introduction
- 9.7.2. Market Size Absolute $ Opportunity Analysis and Forecast, Country , 2016-2032
- 9.7.2.1. Algeria
- 9.7.2.2. Egypt
- 9.7.2.3. Israel
- 9.7.2.4. Kuwait
- 9.7.2.5. Nigeria
- 9.7.2.6. Saudi Arabia
- 9.7.2.7. South Africa
- 9.7.2.8. Turkey
- 9.7.2.9. The UAE
- 9.7.2.10. Rest of MEA
- 10. Global Autonomous Vehicles Market Analysis, Opportunity and Forecast, By Region , 2016-2032
- 10.1. Global Autonomous Vehicles Market Analysis by Region : Introduction
- 10.2. Market Size Absolute $ Opportunity Analysis and Forecast, By Region , 2016-2032
- 10.2.1. North America
- 10.2.2. Western Europe
- 10.2.3. Eastern Europe
- 10.2.4. APAC
- 10.2.5. Latin America
- 10.2.6. Middle East & Africa
- 11. Global Autonomous Vehicles Market Competitive Landscape, Market Share Analysis, and Company Profiles
- 11.1. Market Share Analysis
- 11.2. Company Profiles
- 11.3. Tesla, Inc
- 11.3.1. Company Overview
- 11.3.2. Financial Highlights
- 11.3.3. Product Portfolio
- 11.3.4. SWOT Analysis
- 11.3.5. Key Strategies and Developments
- 11.4. Cruise
- 11.4.1. Company Overview
- 11.4.2. Financial Highlights
- 11.4.3. Product Portfolio
- 11.4.4. SWOT Analysis
- 11.4.5. Key Strategies and Developments
- 11.5. Ford Motor Company
- 11.5.1. Company Overview
- 11.5.2. Financial Highlights
- 11.5.3. Product Portfolio
- 11.5.4. SWOT Analysis
- 11.5.5. Key Strategies and Developments
- 11.6. Nuro
- 11.6.1. Company Overview
- 11.6.2. Financial Highlights
- 11.6.3. Product Portfolio
- 11.6.4. SWOT Analysis
- 11.6.5. Key Strategies and Developments
- 11.7. Zoox
- 11.7.1. Company Overview
- 11.7.2. Financial Highlights
- 11.7.3. Product Portfolio
- 11.7.4. SWOT Analysis
- 11.7.5. Key Strategies and Developments
- 11.8. Renault SA
- 11.8.1. Company Overview
- 11.8.2. Financial Highlights
- 11.8.3. Product Portfolio
- 11.8.4. SWOT Analysis
- 11.8.5. Key Strategies and Developments
- 11.9. Aurora Innovation
- 11.9.1. Company Overview
- 11.9.2. Financial Highlights
- 11.9.3. Product Portfolio
- 11.9.4. SWOT Analysis
- 11.9.5. Key Strategies and Developments
- 11.10. Hyundai Motor Group
- 11.10.1. Company Overview
- 11.10.2. Financial Highlights
- 11.10.3. Product Portfolio
- 11.10.4. SWOT Analysis
- 11.10.5. Key Strategies and Developments
- 11.11. Toyota Motor Corporation
- 11.11.1. Company Overview
- 11.11.2. Financial Highlights
- 11.11.3. Product Portfolio
- 11.11.4. SWOT Analysis
- 11.11.5. Key Strategies and Developments
- 11.12. Volkswagen AG
- 11.12.1. Company Overview
- 11.12.2. Financial Highlights
- 11.12.3. Product Portfolio
- 11.12.4. SWOT Analysis
- 11.12.5. Key Strategies and Developments
- 11.13.1. Company Overview
- 11.13.2. Financial Highlights
- 11.13.3. Product Portfolio
- 11.13.4. SWOT Analysis
- 11.13.5. Key Strategies and Developments
- 11.14. BMW
- 11.14.1. Company Overview
- 11.14.2. Financial Highlights
- 11.14.3. Product Portfolio
- 11.14.4. SWOT Analysis
- 11.14.5. Key Strategies and Developments
- 11.15. Nissan
- 11.15.1. Company Overview
- 11.15.2. Financial Highlights
- 11.15.3. Product Portfolio
- 11.15.4. SWOT Analysis
- 11.15.5. Key Strategies and Developments
- 11.16. General Motors
- 11.16.1. Company Overview
- 11.16.2. Financial Highlights
- 11.16.3. Product Portfolio
- 11.16.4. SWOT Analysis
- 11.16.5. Key Strategies and Developments
- 11.17. AB Volvo
- 11.17.1. Company Overview
- 11.17.2. Financial Highlights
- 11.17.3. Product Portfolio
- 11.17.4. SWOT Analysis
- 11.17.5. Key Strategies and Developments
- 12. Assumptions and Acronyms
- 13. Research Methodology
- 14. Contact
- List of Figures
- Figure 1: Global Autonomous Vehicles Market Revenue (US$ Mn) Market Share by By Type in 2022
- Figure 2: Global Autonomous Vehicles Market Market Attractiveness Analysis by By Type, 2016-2032
- Figure 3: Global Autonomous Vehicles Market Revenue (US$ Mn) Market Share by By Mobility Typein 2022
- Figure 4: Global Autonomous Vehicles Market Market Attractiveness Analysis by By Mobility Type, 2016-2032
- Figure 5: Global Autonomous Vehicles Market Revenue (US$ Mn) Market Share by By Level of Autonomyin 2022
- Figure 6: Global Autonomous Vehicles Market Market Attractiveness Analysis by By Level of Autonomy, 2016-2032
- Figure 7: Global Autonomous Vehicles Market Revenue (US$ Mn) Market Share by By Propulsion Typein 2022
- Figure 8: Global Autonomous Vehicles Market Market Attractiveness Analysis by By Propulsion Type, 2016-2032
- Figure 9: Global Autonomous Vehicles Market Revenue (US$ Mn) Market Share by Region in 2022
- Figure 10: Global Autonomous Vehicles Market Market Attractiveness Analysis by Region, 2016-2032
- Figure 11: Global Autonomous Vehicles Market Market Revenue (US$ Mn) (2016-2032)
- Figure 12: Global Autonomous Vehicles Market Market Revenue (US$ Mn) Comparison by Region (2016-2032)
- Figure 13: Global Autonomous Vehicles Market Market Revenue (US$ Mn) Comparison by By Type (2016-2032)
- Figure 14: Global Autonomous Vehicles Market Market Revenue (US$ Mn) Comparison by By Mobility Type (2016-2032)
- Figure 15: Global Autonomous Vehicles Market Market Revenue (US$ Mn) Comparison by By Level of Autonomy (2016-2032)
- Figure 16: Global Autonomous Vehicles Market Market Revenue (US$ Mn) Comparison by By Propulsion Type (2016-2032)
- Figure 17: Global Autonomous Vehicles Market Market Y-o-Y Growth Rate Comparison by Region (2016-2032)
- Figure 18: Global Autonomous Vehicles Market Market Y-o-Y Growth Rate Comparison by By Type (2016-2032)
- Figure 19: Global Autonomous Vehicles Market Market Y-o-Y Growth Rate Comparison by By Mobility Type (2016-2032)
- Figure 20: Global Autonomous Vehicles Market Market Y-o-Y Growth Rate Comparison by By Level of Autonomy (2016-2032)
- Figure 21: Global Autonomous Vehicles Market Market Y-o-Y Growth Rate Comparison by By Propulsion Type (2016-2032)
- Figure 22: Global Autonomous Vehicles Market Market Share Comparison by Region (2016-2032)
- Figure 23: Global Autonomous Vehicles Market Market Share Comparison by By Type (2016-2032)
- Figure 24: Global Autonomous Vehicles Market Market Share Comparison by By Mobility Type (2016-2032)
- Figure 25: Global Autonomous Vehicles Market Market Share Comparison by By Level of Autonomy (2016-2032)
- Figure 26: Global Autonomous Vehicles Market Market Share Comparison by By Propulsion Type (2016-2032)
- Figure 27: North America Autonomous Vehicles Market Revenue (US$ Mn) Market Share by By Typein 2022
- Figure 28: North America Autonomous Vehicles Market Market Attractiveness Analysis by By Type, 2016-2032
- Figure 29: North America Autonomous Vehicles Market Revenue (US$ Mn) Market Share by By Mobility Typein 2022
- Figure 30: North America Autonomous Vehicles Market Market Attractiveness Analysis by By Mobility Type, 2016-2032
- Figure 31: North America Autonomous Vehicles Market Revenue (US$ Mn) Market Share by By Level of Autonomyin 2022
- Figure 32: North America Autonomous Vehicles Market Market Attractiveness Analysis by By Level of Autonomy, 2016-2032
- Figure 33: North America Autonomous Vehicles Market Revenue (US$ Mn) Market Share by By Propulsion Typein 2022
- Figure 34: North America Autonomous Vehicles Market Market Attractiveness Analysis by By Propulsion Type, 2016-2032
- Figure 35: North America Autonomous Vehicles Market Revenue (US$ Mn) Market Share by Country in 2022
- Figure 36: North America Autonomous Vehicles Market Market Attractiveness Analysis by Country, 2016-2032
- Figure 37: North America Autonomous Vehicles Market Market Revenue (US$ Mn) (2016-2032)
- Figure 38: North America Autonomous Vehicles Market Market Revenue (US$ Mn) Comparison by Country (2016-2032)
- Figure 39: North America Autonomous Vehicles Market Market Revenue (US$ Mn) Comparison by By Type (2016-2032)
- Figure 40: North America Autonomous Vehicles Market Market Revenue (US$ Mn) Comparison by By Mobility Type (2016-2032)
- Figure 41: North America Autonomous Vehicles Market Market Revenue (US$ Mn) Comparison by By Level of Autonomy (2016-2032)
- Figure 42: North America Autonomous Vehicles Market Market Revenue (US$ Mn) Comparison by By Propulsion Type (2016-2032)
- Figure 43: North America Autonomous Vehicles Market Market Y-o-Y Growth Rate Comparison by Country (2016-2032)
- Figure 44: North America Autonomous Vehicles Market Market Y-o-Y Growth Rate Comparison by By Type (2016-2032)
- Figure 45: North America Autonomous Vehicles Market Market Y-o-Y Growth Rate Comparison by By Mobility Type (2016-2032)
- Figure 46: North America Autonomous Vehicles Market Market Y-o-Y Growth Rate Comparison by By Level of Autonomy (2016-2032)
- Figure 47: North America Autonomous Vehicles Market Market Y-o-Y Growth Rate Comparison by By Propulsion Type (2016-2032)
- Figure 48: North America Autonomous Vehicles Market Market Share Comparison by Country (2016-2032)
- Figure 49: North America Autonomous Vehicles Market Market Share Comparison by By Type (2016-2032)
- Figure 50: North America Autonomous Vehicles Market Market Share Comparison by By Mobility Type (2016-2032)
- Figure 51: North America Autonomous Vehicles Market Market Share Comparison by By Level of Autonomy (2016-2032)
- Figure 52: North America Autonomous Vehicles Market Market Share Comparison by By Propulsion Type (2016-2032)
- Figure 53: Western Europe Autonomous Vehicles Market Revenue (US$ Mn) Market Share by By Typein 2022
- Figure 54: Western Europe Autonomous Vehicles Market Market Attractiveness Analysis by By Type, 2016-2032
- Figure 55: Western Europe Autonomous Vehicles Market Revenue (US$ Mn) Market Share by By Mobility Typein 2022
- Figure 56: Western Europe Autonomous Vehicles Market Market Attractiveness Analysis by By Mobility Type, 2016-2032
- Figure 57: Western Europe Autonomous Vehicles Market Revenue (US$ Mn) Market Share by By Level of Autonomyin 2022
- Figure 58: Western Europe Autonomous Vehicles Market Market Attractiveness Analysis by By Level of Autonomy, 2016-2032
- Figure 59: Western Europe Autonomous Vehicles Market Revenue (US$ Mn) Market Share by By Propulsion Typein 2022
- Figure 60: Western Europe Autonomous Vehicles Market Market Attractiveness Analysis by By Propulsion Type, 2016-2032
- Figure 61: Western Europe Autonomous Vehicles Market Revenue (US$ Mn) Market Share by Country in 2022
- Figure 62: Western Europe Autonomous Vehicles Market Market Attractiveness Analysis by Country, 2016-2032
- Figure 63: Western Europe Autonomous Vehicles Market Market Revenue (US$ Mn) (2016-2032)
- Figure 64: Western Europe Autonomous Vehicles Market Market Revenue (US$ Mn) Comparison by Country (2016-2032)
- Figure 65: Western Europe Autonomous Vehicles Market Market Revenue (US$ Mn) Comparison by By Type (2016-2032)
- Figure 66: Western Europe Autonomous Vehicles Market Market Revenue (US$ Mn) Comparison by By Mobility Type (2016-2032)
- Figure 67: Western Europe Autonomous Vehicles Market Market Revenue (US$ Mn) Comparison by By Level of Autonomy (2016-2032)
- Figure 68: Western Europe Autonomous Vehicles Market Market Revenue (US$ Mn) Comparison by By Propulsion Type (2016-2032)
- Figure 69: Western Europe Autonomous Vehicles Market Market Y-o-Y Growth Rate Comparison by Country (2016-2032)
- Figure 70: Western Europe Autonomous Vehicles Market Market Y-o-Y Growth Rate Comparison by By Type (2016-2032)
- Figure 71: Western Europe Autonomous Vehicles Market Market Y-o-Y Growth Rate Comparison by By Mobility Type (2016-2032)
- Figure 72: Western Europe Autonomous Vehicles Market Market Y-o-Y Growth Rate Comparison by By Level of Autonomy (2016-2032)
- Figure 73: Western Europe Autonomous Vehicles Market Market Y-o-Y Growth Rate Comparison by By Propulsion Type (2016-2032)
- Figure 74: Western Europe Autonomous Vehicles Market Market Share Comparison by Country (2016-2032)
- Figure 75: Western Europe Autonomous Vehicles Market Market Share Comparison by By Type (2016-2032)
- Figure 76: Western Europe Autonomous Vehicles Market Market Share Comparison by By Mobility Type (2016-2032)
- Figure 77: Western Europe Autonomous Vehicles Market Market Share Comparison by By Level of Autonomy (2016-2032)
- Figure 78: Western Europe Autonomous Vehicles Market Market Share Comparison by By Propulsion Type (2016-2032)
- Figure 79: Eastern Europe Autonomous Vehicles Market Revenue (US$ Mn) Market Share by By Typein 2022
- Figure 80: Eastern Europe Autonomous Vehicles Market Market Attractiveness Analysis by By Type, 2016-2032
- Figure 81: Eastern Europe Autonomous Vehicles Market Revenue (US$ Mn) Market Share by By Mobility Typein 2022
- Figure 82: Eastern Europe Autonomous Vehicles Market Market Attractiveness Analysis by By Mobility Type, 2016-2032
- Figure 83: Eastern Europe Autonomous Vehicles Market Revenue (US$ Mn) Market Share by By Level of Autonomyin 2022
- Figure 84: Eastern Europe Autonomous Vehicles Market Market Attractiveness Analysis by By Level of Autonomy, 2016-2032
- Figure 85: Eastern Europe Autonomous Vehicles Market Revenue (US$ Mn) Market Share by By Propulsion Typein 2022
- Figure 86: Eastern Europe Autonomous Vehicles Market Market Attractiveness Analysis by By Propulsion Type, 2016-2032
- Figure 87: Eastern Europe Autonomous Vehicles Market Revenue (US$ Mn) Market Share by Country in 2022
- Figure 88: Eastern Europe Autonomous Vehicles Market Market Attractiveness Analysis by Country, 2016-2032
- Figure 89: Eastern Europe Autonomous Vehicles Market Market Revenue (US$ Mn) (2016-2032)
- Figure 90: Eastern Europe Autonomous Vehicles Market Market Revenue (US$ Mn) Comparison by Country (2016-2032)
- Figure 91: Eastern Europe Autonomous Vehicles Market Market Revenue (US$ Mn) Comparison by By Type (2016-2032)
- Figure 92: Eastern Europe Autonomous Vehicles Market Market Revenue (US$ Mn) Comparison by By Mobility Type (2016-2032)
- Figure 93: Eastern Europe Autonomous Vehicles Market Market Revenue (US$ Mn) Comparison by By Level of Autonomy (2016-2032)
- Figure 94: Eastern Europe Autonomous Vehicles Market Market Revenue (US$ Mn) Comparison by By Propulsion Type (2016-2032)
- Figure 95: Eastern Europe Autonomous Vehicles Market Market Y-o-Y Growth Rate Comparison by Country (2016-2032)
- Figure 96: Eastern Europe Autonomous Vehicles Market Market Y-o-Y Growth Rate Comparison by By Type (2016-2032)
- Figure 97: Eastern Europe Autonomous Vehicles Market Market Y-o-Y Growth Rate Comparison by By Mobility Type (2016-2032)
- Figure 98: Eastern Europe Autonomous Vehicles Market Market Y-o-Y Growth Rate Comparison by By Level of Autonomy (2016-2032)
- Figure 99: Eastern Europe Autonomous Vehicles Market Market Y-o-Y Growth Rate Comparison by By Propulsion Type (2016-2032)
- Figure 100: Eastern Europe Autonomous Vehicles Market Market Share Comparison by Country (2016-2032)
- Figure 101: Eastern Europe Autonomous Vehicles Market Market Share Comparison by By Type (2016-2032)
- Figure 102: Eastern Europe Autonomous Vehicles Market Market Share Comparison by By Mobility Type (2016-2032)
- Figure 103: Eastern Europe Autonomous Vehicles Market Market Share Comparison by By Level of Autonomy (2016-2032)
- Figure 104: Eastern Europe Autonomous Vehicles Market Market Share Comparison by By Propulsion Type (2016-2032)
- Figure 105: APAC Autonomous Vehicles Market Revenue (US$ Mn) Market Share by By Typein 2022
- Figure 106: APAC Autonomous Vehicles Market Market Attractiveness Analysis by By Type, 2016-2032
- Figure 107: APAC Autonomous Vehicles Market Revenue (US$ Mn) Market Share by By Mobility Typein 2022
- Figure 108: APAC Autonomous Vehicles Market Market Attractiveness Analysis by By Mobility Type, 2016-2032
- Figure 109: APAC Autonomous Vehicles Market Revenue (US$ Mn) Market Share by By Level of Autonomyin 2022
- Figure 110: APAC Autonomous Vehicles Market Market Attractiveness Analysis by By Level of Autonomy, 2016-2032
- Figure 111: APAC Autonomous Vehicles Market Revenue (US$ Mn) Market Share by By Propulsion Typein 2022
- Figure 112: APAC Autonomous Vehicles Market Market Attractiveness Analysis by By Propulsion Type, 2016-2032
- Figure 113: APAC Autonomous Vehicles Market Revenue (US$ Mn) Market Share by Country in 2022
- Figure 114: APAC Autonomous Vehicles Market Market Attractiveness Analysis by Country, 2016-2032
- Figure 115: APAC Autonomous Vehicles Market Market Revenue (US$ Mn) (2016-2032)
- Figure 116: APAC Autonomous Vehicles Market Market Revenue (US$ Mn) Comparison by Country (2016-2032)
- Figure 117: APAC Autonomous Vehicles Market Market Revenue (US$ Mn) Comparison by By Type (2016-2032)
- Figure 118: APAC Autonomous Vehicles Market Market Revenue (US$ Mn) Comparison by By Mobility Type (2016-2032)
- Figure 119: APAC Autonomous Vehicles Market Market Revenue (US$ Mn) Comparison by By Level of Autonomy (2016-2032)
- Figure 120: APAC Autonomous Vehicles Market Market Revenue (US$ Mn) Comparison by By Propulsion Type (2016-2032)
- Figure 121: APAC Autonomous Vehicles Market Market Y-o-Y Growth Rate Comparison by Country (2016-2032)
- Figure 122: APAC Autonomous Vehicles Market Market Y-o-Y Growth Rate Comparison by By Type (2016-2032)
- Figure 123: APAC Autonomous Vehicles Market Market Y-o-Y Growth Rate Comparison by By Mobility Type (2016-2032)
- Figure 124: APAC Autonomous Vehicles Market Market Y-o-Y Growth Rate Comparison by By Level of Autonomy (2016-2032)
- Figure 125: APAC Autonomous Vehicles Market Market Y-o-Y Growth Rate Comparison by By Propulsion Type (2016-2032)
- Figure 126: APAC Autonomous Vehicles Market Market Share Comparison by Country (2016-2032)
- Figure 127: APAC Autonomous Vehicles Market Market Share Comparison by By Type (2016-2032)
- Figure 128: APAC Autonomous Vehicles Market Market Share Comparison by By Mobility Type (2016-2032)
- Figure 129: APAC Autonomous Vehicles Market Market Share Comparison by By Level of Autonomy (2016-2032)
- Figure 130: APAC Autonomous Vehicles Market Market Share Comparison by By Propulsion Type (2016-2032)
- Figure 131: Latin America Autonomous Vehicles Market Revenue (US$ Mn) Market Share by By Typein 2022
- Figure 132: Latin America Autonomous Vehicles Market Market Attractiveness Analysis by By Type, 2016-2032
- Figure 133: Latin America Autonomous Vehicles Market Revenue (US$ Mn) Market Share by By Mobility Typein 2022
- Figure 134: Latin America Autonomous Vehicles Market Market Attractiveness Analysis by By Mobility Type, 2016-2032
- Figure 135: Latin America Autonomous Vehicles Market Revenue (US$ Mn) Market Share by By Level of Autonomyin 2022
- Figure 136: Latin America Autonomous Vehicles Market Market Attractiveness Analysis by By Level of Autonomy, 2016-2032
- Figure 137: Latin America Autonomous Vehicles Market Revenue (US$ Mn) Market Share by By Propulsion Typein 2022
- Figure 138: Latin America Autonomous Vehicles Market Market Attractiveness Analysis by By Propulsion Type, 2016-2032
- Figure 139: Latin America Autonomous Vehicles Market Revenue (US$ Mn) Market Share by Country in 2022
- Figure 140: Latin America Autonomous Vehicles Market Market Attractiveness Analysis by Country, 2016-2032
- Figure 141: Latin America Autonomous Vehicles Market Market Revenue (US$ Mn) (2016-2032)
- Figure 142: Latin America Autonomous Vehicles Market Market Revenue (US$ Mn) Comparison by Country (2016-2032)
- Figure 143: Latin America Autonomous Vehicles Market Market Revenue (US$ Mn) Comparison by By Type (2016-2032)
- Figure 144: Latin America Autonomous Vehicles Market Market Revenue (US$ Mn) Comparison by By Mobility Type (2016-2032)
- Figure 145: Latin America Autonomous Vehicles Market Market Revenue (US$ Mn) Comparison by By Level of Autonomy (2016-2032)
- Figure 146: Latin America Autonomous Vehicles Market Market Revenue (US$ Mn) Comparison by By Propulsion Type (2016-2032)
- Figure 147: Latin America Autonomous Vehicles Market Market Y-o-Y Growth Rate Comparison by Country (2016-2032)
- Figure 148: Latin America Autonomous Vehicles Market Market Y-o-Y Growth Rate Comparison by By Type (2016-2032)
- Figure 149: Latin America Autonomous Vehicles Market Market Y-o-Y Growth Rate Comparison by By Mobility Type (2016-2032)
- Figure 150: Latin America Autonomous Vehicles Market Market Y-o-Y Growth Rate Comparison by By Level of Autonomy (2016-2032)
- Figure 151: Latin America Autonomous Vehicles Market Market Y-o-Y Growth Rate Comparison by By Propulsion Type (2016-2032)
- Figure 152: Latin America Autonomous Vehicles Market Market Share Comparison by Country (2016-2032)
- Figure 153: Latin America Autonomous Vehicles Market Market Share Comparison by By Type (2016-2032)
- Figure 154: Latin America Autonomous Vehicles Market Market Share Comparison by By Mobility Type (2016-2032)
- Figure 155: Latin America Autonomous Vehicles Market Market Share Comparison by By Level of Autonomy (2016-2032)
- Figure 156: Latin America Autonomous Vehicles Market Market Share Comparison by By Propulsion Type (2016-2032)
- Figure 157: Middle East & Africa Autonomous Vehicles Market Revenue (US$ Mn) Market Share by By Typein 2022
- Figure 158: Middle East & Africa Autonomous Vehicles Market Market Attractiveness Analysis by By Type, 2016-2032
- Figure 159: Middle East & Africa Autonomous Vehicles Market Revenue (US$ Mn) Market Share by By Mobility Typein 2022
- Figure 160: Middle East & Africa Autonomous Vehicles Market Market Attractiveness Analysis by By Mobility Type, 2016-2032
- Figure 161: Middle East & Africa Autonomous Vehicles Market Revenue (US$ Mn) Market Share by By Level of Autonomyin 2022
- Figure 162: Middle East & Africa Autonomous Vehicles Market Market Attractiveness Analysis by By Level of Autonomy, 2016-2032
- Figure 163: Middle East & Africa Autonomous Vehicles Market Revenue (US$ Mn) Market Share by By Propulsion Typein 2022
- Figure 164: Middle East & Africa Autonomous Vehicles Market Market Attractiveness Analysis by By Propulsion Type, 2016-2032
- Figure 165: Middle East & Africa Autonomous Vehicles Market Revenue (US$ Mn) Market Share by Country in 2022
- Figure 166: Middle East & Africa Autonomous Vehicles Market Market Attractiveness Analysis by Country, 2016-2032
- Figure 167: Middle East & Africa Autonomous Vehicles Market Market Revenue (US$ Mn) (2016-2032)
- Figure 168: Middle East & Africa Autonomous Vehicles Market Market Revenue (US$ Mn) Comparison by Country (2016-2032)
- Figure 169: Middle East & Africa Autonomous Vehicles Market Market Revenue (US$ Mn) Comparison by By Type (2016-2032)
- Figure 170: Middle East & Africa Autonomous Vehicles Market Market Revenue (US$ Mn) Comparison by By Mobility Type (2016-2032)
- Figure 171: Middle East & Africa Autonomous Vehicles Market Market Revenue (US$ Mn) Comparison by By Level of Autonomy (2016-2032)
- Figure 172: Middle East & Africa Autonomous Vehicles Market Market Revenue (US$ Mn) Comparison by By Propulsion Type (2016-2032)
- Figure 173: Middle East & Africa Autonomous Vehicles Market Market Y-o-Y Growth Rate Comparison by Country (2016-2032)
- Figure 174: Middle East & Africa Autonomous Vehicles Market Market Y-o-Y Growth Rate Comparison by By Type (2016-2032)
- Figure 175: Middle East & Africa Autonomous Vehicles Market Market Y-o-Y Growth Rate Comparison by By Mobility Type (2016-2032)
- Figure 176: Middle East & Africa Autonomous Vehicles Market Market Y-o-Y Growth Rate Comparison by By Level of Autonomy (2016-2032)
- Figure 177: Middle East & Africa Autonomous Vehicles Market Market Y-o-Y Growth Rate Comparison by By Propulsion Type (2016-2032)
- Figure 178: Middle East & Africa Autonomous Vehicles Market Market Share Comparison by Country (2016-2032)
- Figure 179: Middle East & Africa Autonomous Vehicles Market Market Share Comparison by By Type (2016-2032)
- Figure 180: Middle East & Africa Autonomous Vehicles Market Market Share Comparison by By Mobility Type (2016-2032)
- Figure 181: Middle East & Africa Autonomous Vehicles Market Market Share Comparison by By Level of Autonomy (2016-2032)
- Figure 182: Middle East & Africa Autonomous Vehicles Market Market Share Comparison by By Propulsion Type (2016-2032)
List of Tables
- Table 1: Global Autonomous Vehicles Market Market Comparison by By Type (2016-2032)
- Table 2: Global Autonomous Vehicles Market Market Comparison by By Mobility Type (2016-2032)
- Table 3: Global Autonomous Vehicles Market Market Comparison by By Level of Autonomy (2016-2032)
- Table 4: Global Autonomous Vehicles Market Market Comparison by By Propulsion Type (2016-2032)
- Table 5: Global Autonomous Vehicles Market Revenue (US$ Mn) Comparison by Region (2016-2032)
- Table 6: Global Autonomous Vehicles Market Market Revenue (US$ Mn) (2016-2032)
- Table 7: Global Autonomous Vehicles Market Market Revenue (US$ Mn) Comparison by Region (2016-2032)
- Table 8: Global Autonomous Vehicles Market Market Revenue (US$ Mn) Comparison by By Type (2016-2032)
- Table 9: Global Autonomous Vehicles Market Market Revenue (US$ Mn) Comparison by By Mobility Type (2016-2032)
- Table 10: Global Autonomous Vehicles Market Market Revenue (US$ Mn) Comparison by By Level of Autonomy (2016-2032)
- Table 11: Global Autonomous Vehicles Market Market Revenue (US$ Mn) Comparison by By Propulsion Type (2016-2032)
- Table 12: Global Autonomous Vehicles Market Market Y-o-Y Growth Rate Comparison by Region (2016-2032)
- Table 13: Global Autonomous Vehicles Market Market Y-o-Y Growth Rate Comparison by By Type (2016-2032)
- Table 14: Global Autonomous Vehicles Market Market Y-o-Y Growth Rate Comparison by By Mobility Type (2016-2032)
- Table 15: Global Autonomous Vehicles Market Market Y-o-Y Growth Rate Comparison by By Level of Autonomy (2016-2032)
- Table 16: Global Autonomous Vehicles Market Market Y-o-Y Growth Rate Comparison by By Propulsion Type (2016-2032)
- Table 17: Global Autonomous Vehicles Market Market Share Comparison by Region (2016-2032)
- Table 18: Global Autonomous Vehicles Market Market Share Comparison by By Type (2016-2032)
- Table 19: Global Autonomous Vehicles Market Market Share Comparison by By Mobility Type (2016-2032)
- Table 20: Global Autonomous Vehicles Market Market Share Comparison by By Level of Autonomy (2016-2032)
- Table 21: Global Autonomous Vehicles Market Market Share Comparison by By Propulsion Type (2016-2032)
- Table 22: North America Autonomous Vehicles Market Market Comparison by By Mobility Type (2016-2032)
- Table 23: North America Autonomous Vehicles Market Market Comparison by By Level of Autonomy (2016-2032)
- Table 24: North America Autonomous Vehicles Market Market Comparison by By Propulsion Type (2016-2032)
- Table 25: North America Autonomous Vehicles Market Revenue (US$ Mn) Comparison by Country (2016-2032)
- Table 26: North America Autonomous Vehicles Market Market Revenue (US$ Mn) (2016-2032)
- Table 27: North America Autonomous Vehicles Market Market Revenue (US$ Mn) Comparison by Country (2016-2032)
- Table 28: North America Autonomous Vehicles Market Market Revenue (US$ Mn) Comparison by By Type (2016-2032)
- Table 29: North America Autonomous Vehicles Market Market Revenue (US$ Mn) Comparison by By Mobility Type (2016-2032)
- Table 30: North America Autonomous Vehicles Market Market Revenue (US$ Mn) Comparison by By Level of Autonomy (2016-2032)
- Table 31: North America Autonomous Vehicles Market Market Revenue (US$ Mn) Comparison by By Propulsion Type (2016-2032)
- Table 32: North America Autonomous Vehicles Market Market Y-o-Y Growth Rate Comparison by Country (2016-2032)
- Table 33: North America Autonomous Vehicles Market Market Y-o-Y Growth Rate Comparison by By Type (2016-2032)
- Table 34: North America Autonomous Vehicles Market Market Y-o-Y Growth Rate Comparison by By Mobility Type (2016-2032)
- Table 35: North America Autonomous Vehicles Market Market Y-o-Y Growth Rate Comparison by By Level of Autonomy (2016-2032)
- Table 36: North America Autonomous Vehicles Market Market Y-o-Y Growth Rate Comparison by By Propulsion Type (2016-2032)
- Table 37: North America Autonomous Vehicles Market Market Share Comparison by Country (2016-2032)
- Table 38: North America Autonomous Vehicles Market Market Share Comparison by By Type (2016-2032)
- Table 39: North America Autonomous Vehicles Market Market Share Comparison by By Mobility Type (2016-2032)
- Table 40: North America Autonomous Vehicles Market Market Share Comparison by By Level of Autonomy (2016-2032)
- Table 41: North America Autonomous Vehicles Market Market Share Comparison by By Propulsion Type (2016-2032)
- Table 42: Western Europe Autonomous Vehicles Market Market Comparison by By Type (2016-2032)
- Table 43: Western Europe Autonomous Vehicles Market Market Comparison by By Mobility Type (2016-2032)
- Table 44: Western Europe Autonomous Vehicles Market Market Comparison by By Level of Autonomy (2016-2032)
- Table 45: Western Europe Autonomous Vehicles Market Market Comparison by By Propulsion Type (2016-2032)
- Table 46: Western Europe Autonomous Vehicles Market Revenue (US$ Mn) Comparison by Country (2016-2032)
- Table 47: Western Europe Autonomous Vehicles Market Market Revenue (US$ Mn) (2016-2032)
- Table 48: Western Europe Autonomous Vehicles Market Market Revenue (US$ Mn) Comparison by Country (2016-2032)
- Table 49: Western Europe Autonomous Vehicles Market Market Revenue (US$ Mn) Comparison by By Type (2016-2032)
- Table 50: Western Europe Autonomous Vehicles Market Market Revenue (US$ Mn) Comparison by By Mobility Type (2016-2032)
- Table 51: Western Europe Autonomous Vehicles Market Market Revenue (US$ Mn) Comparison by By Level of Autonomy (2016-2032)
- Table 52: Western Europe Autonomous Vehicles Market Market Revenue (US$ Mn) Comparison by By Propulsion Type (2016-2032)
- Table 53: Western Europe Autonomous Vehicles Market Market Y-o-Y Growth Rate Comparison by Country (2016-2032)
- Table 54: Western Europe Autonomous Vehicles Market Market Y-o-Y Growth Rate Comparison by By Type (2016-2032)
- Table 55: Western Europe Autonomous Vehicles Market Market Y-o-Y Growth Rate Comparison by By Mobility Type (2016-2032)
- Table 56: Western Europe Autonomous Vehicles Market Market Y-o-Y Growth Rate Comparison by By Level of Autonomy (2016-2032)
- Table 57: Western Europe Autonomous Vehicles Market Market Y-o-Y Growth Rate Comparison by By Propulsion Type (2016-2032)
- Table 58: Western Europe Autonomous Vehicles Market Market Share Comparison by Country (2016-2032)
- Table 59: Western Europe Autonomous Vehicles Market Market Share Comparison by By Type (2016-2032)
- Table 60: Western Europe Autonomous Vehicles Market Market Share Comparison by By Mobility Type (2016-2032)
- Table 61: Western Europe Autonomous Vehicles Market Market Share Comparison by By Level of Autonomy (2016-2032)
- Table 62: Western Europe Autonomous Vehicles Market Market Share Comparison by By Propulsion Type (2016-2032)
- Table 63: Eastern Europe Autonomous Vehicles Market Market Comparison by By Type (2016-2032)
- Table 64: Eastern Europe Autonomous Vehicles Market Market Comparison by By Mobility Type (2016-2032)
- Table 65: Eastern Europe Autonomous Vehicles Market Market Comparison by By Level of Autonomy (2016-2032)
- Table 66: Eastern Europe Autonomous Vehicles Market Market Comparison by By Propulsion Type (2016-2032)
- Table 67: Eastern Europe Autonomous Vehicles Market Revenue (US$ Mn) Comparison by Country (2016-2032)
- Table 68: Eastern Europe Autonomous Vehicles Market Market Revenue (US$ Mn) (2016-2032)
- Table 69: Eastern Europe Autonomous Vehicles Market Market Revenue (US$ Mn) Comparison by Country (2016-2032)
- Table 70: Eastern Europe Autonomous Vehicles Market Market Revenue (US$ Mn) Comparison by By Type (2016-2032)
- Table 71: Eastern Europe Autonomous Vehicles Market Market Revenue (US$ Mn) Comparison by By Mobility Type (2016-2032)
- Table 72: Eastern Europe Autonomous Vehicles Market Market Revenue (US$ Mn) Comparison by By Level of Autonomy (2016-2032)
- Table 73: Eastern Europe Autonomous Vehicles Market Market Revenue (US$ Mn) Comparison by By Propulsion Type (2016-2032)
- Table 74: Eastern Europe Autonomous Vehicles Market Market Y-o-Y Growth Rate Comparison by Country (2016-2032)
- Table 75: Eastern Europe Autonomous Vehicles Market Market Y-o-Y Growth Rate Comparison by By Type (2016-2032)
- Table 76: Eastern Europe Autonomous Vehicles Market Market Y-o-Y Growth Rate Comparison by By Mobility Type (2016-2032)
- Table 77: Eastern Europe Autonomous Vehicles Market Market Y-o-Y Growth Rate Comparison by By Level of Autonomy (2016-2032)
- Table 78: Eastern Europe Autonomous Vehicles Market Market Y-o-Y Growth Rate Comparison by By Propulsion Type (2016-2032)
- Table 79: Eastern Europe Autonomous Vehicles Market Market Share Comparison by Country (2016-2032)
- Table 80: Eastern Europe Autonomous Vehicles Market Market Share Comparison by By Type (2016-2032)
- Table 81: Eastern Europe Autonomous Vehicles Market Market Share Comparison by By Mobility Type (2016-2032)
- Table 82: Eastern Europe Autonomous Vehicles Market Market Share Comparison by By Level of Autonomy (2016-2032)
- Table 83: Eastern Europe Autonomous Vehicles Market Market Share Comparison by By Propulsion Type (2016-2032)
- Table 84: APAC Autonomous Vehicles Market Market Comparison by By Type (2016-2032)
- Table 85: APAC Autonomous Vehicles Market Market Comparison by By Mobility Type (2016-2032)
- Table 86: APAC Autonomous Vehicles Market Market Comparison by By Level of Autonomy (2016-2032)
- Table 87: APAC Autonomous Vehicles Market Market Comparison by By Propulsion Type (2016-2032)
- Table 88: APAC Autonomous Vehicles Market Revenue (US$ Mn) Comparison by Country (2016-2032)
- Table 89: APAC Autonomous Vehicles Market Market Revenue (US$ Mn) (2016-2032)
- Table 90: APAC Autonomous Vehicles Market Market Revenue (US$ Mn) Comparison by Country (2016-2032)
- Table 91: APAC Autonomous Vehicles Market Market Revenue (US$ Mn) Comparison by By Type (2016-2032)
- Table 92: APAC Autonomous Vehicles Market Market Revenue (US$ Mn) Comparison by By Mobility Type (2016-2032)
- Table 93: APAC Autonomous Vehicles Market Market Revenue (US$ Mn) Comparison by By Level of Autonomy (2016-2032)
- Table 94: APAC Autonomous Vehicles Market Market Revenue (US$ Mn) Comparison by By Propulsion Type (2016-2032)
- Table 95: APAC Autonomous Vehicles Market Market Y-o-Y Growth Rate Comparison by Country (2016-2032)
- Table 96: APAC Autonomous Vehicles Market Market Y-o-Y Growth Rate Comparison by By Type (2016-2032)
- Table 97: APAC Autonomous Vehicles Market Market Y-o-Y Growth Rate Comparison by By Mobility Type (2016-2032)
- Table 98: APAC Autonomous Vehicles Market Market Y-o-Y Growth Rate Comparison by By Level of Autonomy (2016-2032)
- Table 99: APAC Autonomous Vehicles Market Market Y-o-Y Growth Rate Comparison by By Propulsion Type (2016-2032)
- Table 100: APAC Autonomous Vehicles Market Market Share Comparison by Country (2016-2032)
- Table 101: APAC Autonomous Vehicles Market Market Share Comparison by By Type (2016-2032)
- Table 102: APAC Autonomous Vehicles Market Market Share Comparison by By Mobility Type (2016-2032)
- Table 103: APAC Autonomous Vehicles Market Market Share Comparison by By Level of Autonomy (2016-2032)
- Table 104: APAC Autonomous Vehicles Market Market Share Comparison by By Propulsion Type (2016-2032)
- Table 105: Latin America Autonomous Vehicles Market Market Comparison by By Type (2016-2032)
- Table 106: Latin America Autonomous Vehicles Market Market Comparison by By Mobility Type (2016-2032)
- Table 107: Latin America Autonomous Vehicles Market Market Comparison by By Level of Autonomy (2016-2032)
- Table 108: Latin America Autonomous Vehicles Market Market Comparison by By Propulsion Type (2016-2032)
- Table 109: Latin America Autonomous Vehicles Market Revenue (US$ Mn) Comparison by Country (2016-2032)
- Table 110: Latin America Autonomous Vehicles Market Market Revenue (US$ Mn) (2016-2032)
- Table 111: Latin America Autonomous Vehicles Market Market Revenue (US$ Mn) Comparison by Country (2016-2032)
- Table 112: Latin America Autonomous Vehicles Market Market Revenue (US$ Mn) Comparison by By Type (2016-2032)
- Table 113: Latin America Autonomous Vehicles Market Market Revenue (US$ Mn) Comparison by By Mobility Type (2016-2032)
- Table 114: Latin America Autonomous Vehicles Market Market Revenue (US$ Mn) Comparison by By Level of Autonomy (2016-2032)
- Table 115: Latin America Autonomous Vehicles Market Market Revenue (US$ Mn) Comparison by By Propulsion Type (2016-2032)
- Table 116: Latin America Autonomous Vehicles Market Market Y-o-Y Growth Rate Comparison by Country (2016-2032)
- Table 117: Latin America Autonomous Vehicles Market Market Y-o-Y Growth Rate Comparison by By Type (2016-2032)
- Table 118: Latin America Autonomous Vehicles Market Market Y-o-Y Growth Rate Comparison by By Mobility Type (2016-2032)
- Table 119: Latin America Autonomous Vehicles Market Market Y-o-Y Growth Rate Comparison by By Level of Autonomy (2016-2032)
- Table 120: Latin America Autonomous Vehicles Market Market Y-o-Y Growth Rate Comparison by By Propulsion Type (2016-2032)
- Table 121: Latin America Autonomous Vehicles Market Market Share Comparison by Country (2016-2032)
- Table 122: Latin America Autonomous Vehicles Market Market Share Comparison by By Type (2016-2032)
- Table 123: Latin America Autonomous Vehicles Market Market Share Comparison by By Mobility Type (2016-2032)
- Table 124: Latin America Autonomous Vehicles Market Market Share Comparison by By Level of Autonomy (2016-2032)
- Table 125: Latin America Autonomous Vehicles Market Market Share Comparison by By Propulsion Type (2016-2032)
- Table 126: Middle East & Africa Autonomous Vehicles Market Market Comparison by By Type (2016-2032)
- Table 127: Middle East & Africa Autonomous Vehicles Market Market Comparison by By Mobility Type (2016-2032)
- Table 128: Middle East & Africa Autonomous Vehicles Market Market Comparison by By Level of Autonomy (2016-2032)
- Table 129: Middle East & Africa Autonomous Vehicles Market Market Comparison by By Propulsion Type (2016-2032)
- Table 130: Middle East & Africa Autonomous Vehicles Market Revenue (US$ Mn) Comparison by Country (2016-2032)
- Table 131: Middle East & Africa Autonomous Vehicles Market Market Revenue (US$ Mn) (2016-2032)
- Table 132: Middle East & Africa Autonomous Vehicles Market Market Revenue (US$ Mn) Comparison by Country (2016-2032)
- Table 133: Middle East & Africa Autonomous Vehicles Market Market Revenue (US$ Mn) Comparison by By Type (2016-2032)
- Table 134: Middle East & Africa Autonomous Vehicles Market Market Revenue (US$ Mn) Comparison by By Mobility Type (2016-2032)
- Table 135: Middle East & Africa Autonomous Vehicles Market Market Revenue (US$ Mn) Comparison by By Level of Autonomy (2016-2032)
- Table 136: Middle East & Africa Autonomous Vehicles Market Market Revenue (US$ Mn) Comparison by By Propulsion Type (2016-2032)
- Table 137: Middle East & Africa Autonomous Vehicles Market Market Y-o-Y Growth Rate Comparison by Country (2016-2032)
- Table 138: Middle East & Africa Autonomous Vehicles Market Market Y-o-Y Growth Rate Comparison by By Type (2016-2032)
- Table 139: Middle East & Africa Autonomous Vehicles Market Market Y-o-Y Growth Rate Comparison by By Mobility Type (2016-2032)
- Table 140: Middle East & Africa Autonomous Vehicles Market Market Y-o-Y Growth Rate Comparison by By Level of Autonomy (2016-2032)
- Table 141: Middle East & Africa Autonomous Vehicles Market Market Y-o-Y Growth Rate Comparison by By Propulsion Type (2016-2032)
- Table 142: Middle East & Africa Autonomous Vehicles Market Market Share Comparison by Country (2016-2032)
- Table 143: Middle East & Africa Autonomous Vehicles Market Market Share Comparison by By Type (2016-2032)
- Table 144: Middle East & Africa Autonomous Vehicles Market Market Share Comparison by By Mobility Type (2016-2032)
- Table 145: Middle East & Africa Autonomous Vehicles Market Market Share Comparison by By Level of Autonomy (2016-2032)
- Table 146: Middle East & Africa Autonomous Vehicles Market Market Share Comparison by By Propulsion Type (2016-2032)
-
-
- Tesla, Inc
- Cruise
- Ford Motor Company
- Nuro
- Zoox
- Renault SA
- Aurora Innovation
- Hyundai Motor Group
- Toyota Motor Corporation
- Volkswagen AG
- BMW
- Mercedes-Benz AG
- Nissan
- General Motors
- AB Volvo
Our Clients


View Our Licence Options
