
Anti Obesity Drugs Market Report By Drug Type (Prescription Drugs, Over-the-Counter (OTC) Drugs), By Mechanism of Action (Appetite Suppressants, Fat Absorption Inhibitors, Serotonin-Norepinephrine Reuptake Inhibitors (SNRIs), GLP-1 Receptor Agonists, Combination Drugs, Others), By Formulation (Tablets, Capsules, Injections, Oral Liquids, Others), By End User (Hospitals, Clinics, Homecare Settings, Weight Loss Centers, Others), By Region and Companies - Industry Segment Outlook, Market Assessment, Competition Scenario, Trends and Forecast 2024-2033
-
47873
-
June 2024
-
291
-


-
This report was compiled by Trishita Deb Trishita Deb is an experienced market research and consulting professional with over 7 years of expertise across healthcare, consumer goods, and materials, contributing to over 400 healthcare-related reports. Correspondence Team Lead- Healthcare Linkedin | Detailed Market research Methodology Our methodology involves a mix of primary research, including interviews with leading mental health experts, and secondary research from reputable medical journals and databases. View Detailed Methodology Page
-
Quick Navigation
Report Overview
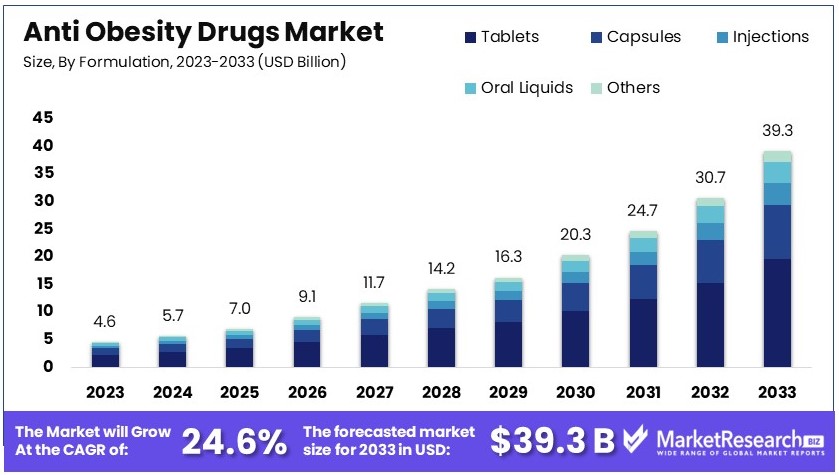
The Global Anti Obesity Drugs Market size is expected to be worth around USD 39.3 Billion by 2033, from USD 4.6 Billion in 2023, growing at a CAGR of 24.6% during the forecast period from 2024 to 2033.
The Anti-Obesity Drugs Market encompasses pharmaceutical treatments designed to manage and reduce obesity. These medications target various physiological mechanisms to curb appetite, enhance metabolism, or decrease fat absorption. As obesity rates continue to rise globally, the demand for effective anti-obesity drugs escalates, offering significant growth opportunities for pharmaceutical companies.
The market caters to healthcare providers, patients seeking medical interventions for weight loss, and insurance companies covering such treatments. Strategic developments in this sector include innovative drug formulations and combination therapies that aim to improve patient outcomes and minimize side effects.
The Anti-Obesity Drugs Market is poised for significant growth, driven by the escalating global prevalence of obesity. In 2022, the world saw over one billion people, encompassing both adults and children, grappling with obesity.
This includes approximately 880 million adults and 159 million children and adolescents aged 5-19 years. Notably, the incidence of overweight and obesity among this younger demographic has surged from 4% in 1975 to nearly 20% in 2022, underscoring a growing market need for effective therapeutic solutions.
In the United States alone, the situation reflects a substantial market segment. Nearly one in three adults is overweight, with the prevalence slightly higher among men (34.1%) than women (27.5%). This data not only highlights the extensive potential customer base for anti-obesity drugs but also signals an urgent public health issue.
The expanding demographic of individuals affected by obesity translates into a robust demand for innovative and effective pharmaceutical interventions. Pharmaceutical companies are therefore increasingly motivated to invest in R&D to develop new drugs that offer improved efficacy and reduced side effects. Additionally, the market is seeing a trend towards the development of personalized medicine approaches, aimed at enhancing patient outcomes based on genetic and metabolic profiles.
Key Takeaways
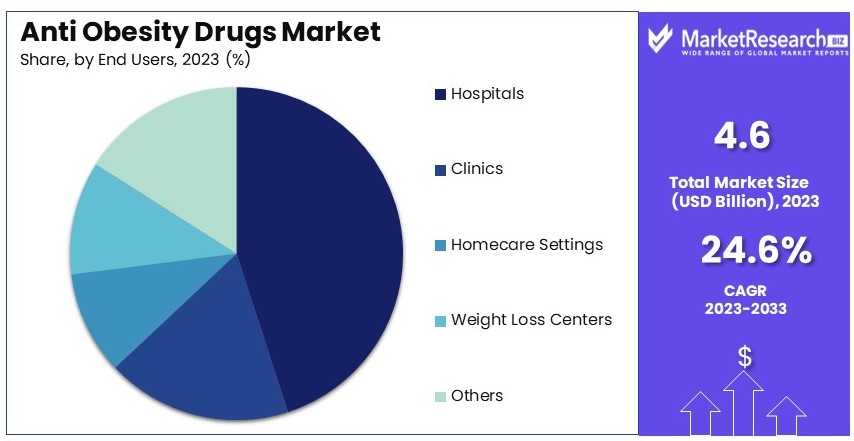
- Market Value: The Global Anti-Obesity Drugs Market was valued at USD 4.6 billion in 2023 and is projected to reach USD 39.3 billion by 2033, growing at a CAGR of 24.6%.
- Drug Type Analysis: Prescription drugs dominate with 65%; their clinical efficacy and mandatory medical supervision underscore their market superiority.
- Mechanism of Action Analysis: GLP-1 receptor agonists lead with 40%; their dual role in weight loss and glucose management marks their prominence.
- Formulation Analysis: Tablets hold a 50% market share; their ease of use and manufacturing contribute significantly to their dominance.
- End User Analysis: Hospitals lead with 45%; their comprehensive care capabilities underscore their primary role in obesity treatment.
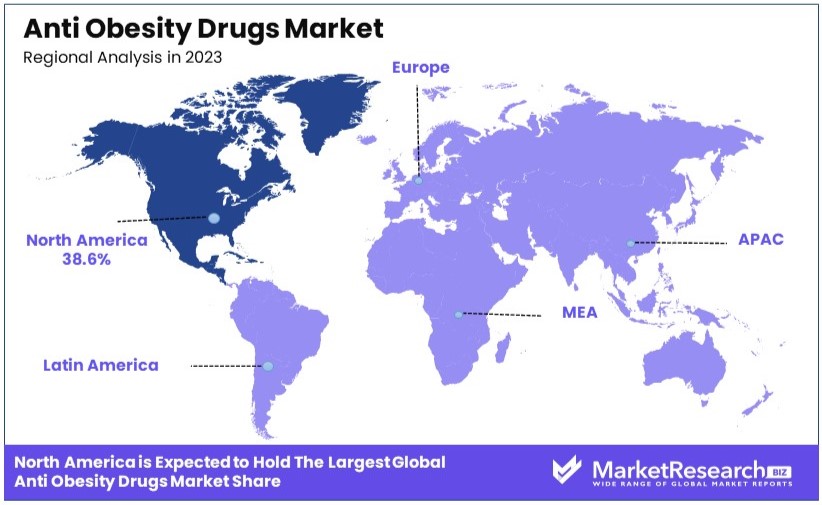
- Dominant Region: North America dominates the market with a 38.6% share; its robust healthcare infrastructure significantly influences this dominance.
- High Growth Region: Europe holds a 27.5% market share; its increasing health awareness and healthcare spending underline its growth potential.
- Analyst Viewpoint: The market is increasingly competitive and still expanding, with significant growth potential despite current penetrations. Innovations in drug development and broader regulatory approvals are anticipated.
- Growth Opportunities: Key players can leverage advancements in personalized medicine and expand into emerging markets to distinguish themselves in the competitive landscape.
Driving Factors
Rising Obesity Rates Drive Market Growth
The increasing prevalence of obesity worldwide significantly drives the growth of the anti-obesity drugs market. According to the World Health Organization (WHO), the number of obese individuals has nearly tripled since 1975, with over 650 million adults classified as obese in 2016. This surge in obesity rates has heightened awareness of the associated health risks, including type 2 diabetes, cardiovascular diseases, and certain types of cancer. As a result, there is a growing demand for effective weight management solutions, such as anti-obesity drugs. These drugs offer a necessary intervention for individuals who find it challenging to manage their weight through diet and exercise alone.
The rise in obesity is not just a health concern but also a catalyst for market growth. The increasing number of obese individuals creates a larger customer base for pharmaceutical companies specializing in anti-obesity treatments. Furthermore, the awareness of obesity-related health risks motivates individuals to seek medical help, thus driving the demand for anti-obesity medications. This trend is expected to continue, contributing to the expansion of the market as more people seek effective ways to manage their weight and improve their health.
Changing Lifestyles and Dietary Habits Drive Market Growth
The shift towards sedentary lifestyles and unhealthy dietary habits has substantially contributed to the rising obesity rates, thereby driving the growth of the anti-obesity drugs market. Modern lifestyles often involve long hours of sitting, minimal physical activity, and increased consumption of convenience foods high in calories and low in nutrients. These factors have led to an increase in obesity, creating a significant need for weight management solutions. Anti-obesity drugs provide a practical option for those who struggle to achieve weight loss through lifestyle changes alone.
As more people face challenges in managing their weight due to busy schedules and poor dietary choices, the demand for pharmaceutical interventions has grown. Anti-obesity drugs help address the gap between lifestyle changes and effective weight loss, offering individuals a medically supported method to combat obesity. This demand is likely to increase as sedentary lifestyles and unhealthy eating habits continue to prevail, further driving the market growth for anti-obesity drugs. The convergence of these lifestyle factors with the need for effective weight management solutions underscores the market's expansion prospects.
Increasing Acceptance and Awareness Drive Market Growth
Growing acceptance and awareness of anti-obesity drugs as a legitimate treatment option significantly propel the market's growth. As obesity is increasingly recognized as a complex, multifactorial disease, there is a rising openness among healthcare professionals and patients to explore pharmacological interventions alongside lifestyle changes. This shift in perception is crucial in driving the demand for anti-obesity medications.
Healthcare professionals are now more likely to recommend anti-obesity drugs as part of a comprehensive weight management plan, acknowledging their role in effectively addressing obesity when lifestyle modifications alone are insufficient. Patients, in turn, are becoming more informed about the benefits and availability of these medications, leading to increased adoption rates. This growing acceptance is supported by ongoing research and positive outcomes associated with anti-obesity drugs, further validating their use. As awareness and acceptance continue to rise, the market for anti-obesity drugs is expected to expand, driven by the integration of these medications into broader weight loss and diet control strategies.
Restraining Factors
Safety Concerns and Side Effects Restrain Market Growth
Despite advancements in drug development, safety concerns and side effects limit the growth of the anti-obesity drugs market. Some anti-obesity drugs have been linked to cardiovascular risks, psychiatric disorders, and gastrointestinal issues. These potential side effects create hesitancy among healthcare professionals and patients.
For instance, the FDA has withdrawn or restricted the use of certain drugs due to safety concerns, reducing available treatment options. This withdrawal impacts market confidence and slows adoption rates of new drugs. As a result, the perception of risk associated with these medications continues to hinder market expansion.
Stringent Regulatory Environment Restrains Market Growth
The stringent regulatory environment significantly restrains the growth of the anti-obesity drugs market. The development and approval of these drugs are subject to rigorous scrutiny by authorities like the U.S. Food and Drug Administration (FDA) and the European Medicines Agency (EMA).
These regulatory bodies enforce strict requirements, which can delay or even prevent the entry of new drugs into the market. This lengthy and complex approval process not only increases the time and cost involved in bringing new drugs to market but also discourages innovation. Consequently, fewer new drugs are available to meet the growing demand, limiting market expansion.
Drug Type Analysis
Prescription drugs dominate with 65% due to efficacy and tailored medical supervision.
The Anti Obesity Drugs Market can be segmented based on drug type into prescription drugs and over-the-counter (OTC) drugs. Prescription drugs hold the dominant position in the anti-obesity drugs market. These drugs are prescribed by healthcare professionals and are typically used for patients who have not succeeded with diet and exercise alone.
The effectiveness of prescription drugs, such as Orlistat, Liraglutide, and Phentermine-Topiramate, contributes significantly to their dominance. These medications undergo rigorous clinical trials to ensure their efficacy and safety, gaining the trust of healthcare providers and patients alike. For example, Liraglutide, a GLP-1 receptor agonist, has shown considerable weight loss results, making it a preferred option among healthcare providers. The rigorous regulatory approvals for prescription drugs further ensure their quality, making them a reliable choice for obesity management.
In contrast, over-the-counter (OTC) drugs represent a smaller market share but are still essential. These drugs, such as Alli (a lower dose of Orlistat), are available without a prescription and appeal to individuals seeking weight management solutions without consulting a healthcare provider. OTC drugs are accessible and convenient, making them popular among consumers. However, the efficacy of OTC drugs may be lower than that of prescription drugs, which limits their market dominance. Despite this, the growing awareness and increasing number of obesity cases support the growth of the OTC segment, albeit at a slower rate compared to prescription drugs.
Mechanism of Action Analysis
GLP-1 receptor agonists dominate with 40% due to their efficacy and dual benefits in weight and glucose management.
The market for anti-obesity drugs can also be segmented based on their mechanism of action. GLP-1 receptor agonists are the dominant sub-segment in this category. These drugs, such as Liraglutide and Semaglutide, mimic the action of the GLP-1 hormone, which regulates appetite and insulin secretion. Their ability to promote significant weight loss and improve glycemic control in diabetic patients makes them highly effective. Clinical studies have shown that GLP-1 receptor agonists can lead to a 5-10% reduction in body weight, which is substantial compared to other anti-obesity drugs. This dual benefit of managing weight and blood glucose levels has increased their adoption among both patients and healthcare providers.
Appetite suppressants are another significant sub-segment. These drugs, including Phentermine and Lorcaserin, work by decreasing appetite and increasing feelings of fullness, helping reduce calorie intake. Fat absorption inhibitors, like Orlistat, prevent the absorption of fats from the diet, thus reducing caloric intake. Serotonin-norepinephrine reuptake inhibitors (SNRIs) and combination drugs, which combine different mechanisms, offer additional options for patients who may not respond to a single mechanism. While these other sub-segments contribute to market growth, GLP-1 receptor agonists' comprehensive benefits ensure their leading position.
Formulation Analysis
Tablets dominate with 50% due to convenience and widespread acceptance.
The anti-obesity drugs market can also be segmented by formulation. Tablets are the most dominant sub-segment within this category. They are easy to manufacture, store, and distribute, making them the most common form of medication. Patients also prefer tablets due to their convenience and ease of use. Popular anti-obesity drugs, such as Orlistat and Phentermine, are widely available in tablet form. The consistency and reliability of tablets contribute to their dominant market position, making them the preferred choice for both healthcare providers and patients.
Capsules, injections, and oral liquids also play significant roles in the market. Capsules offer a similar level of convenience as tablets but can be easier to swallow for some patients. Injections, such as those for GLP-1 receptor agonists, provide an effective alternative for patients who may not achieve desired results with oral medications. Oral liquids are useful for patients who have difficulty swallowing pills or capsules. These formulations ensure that a wide range of patient preferences and needs are met, supporting overall market growth.
End User Analysis
Hospitals dominate with 45% due to comprehensive care and monitoring.
The market for anti-obesity drugs can further be segmented based on end users. Hospitals are the leading end-user segment in the anti-obesity drugs market. They provide comprehensive care, including diagnosis, prescription, and monitoring of patients using anti-obesity drugs. Hospitals have access to a wide range of resources, including specialized healthcare professionals and advanced medical equipment, which ensures effective obesity management. The ability to provide personalized care plans and monitor patients closely enhances treatment outcomes, making hospitals the primary choice for obesity treatment.
Clinics, homecare settings, weight loss centers, and other settings also contribute to the market. Clinics offer convenient access to healthcare services and personalized care, making them popular among patients who prefer outpatient treatment. Homecare settings provide flexibility and comfort for patients managing their condition at home. Weight loss centers specialize in weight management and offer a variety of programs, including the use of anti-obesity drugs. These various end-user segments ensure that patients have multiple options for receiving treatment, supporting overall market growth.
Key Market Segments
By Drug Type
- Prescription Drugs
- Over-the-Counter (OTC) Drugs
By Mechanism of Action
- Appetite Suppressants
- Fat Absorption Inhibitors
- Serotonin-Norepinephrine Reuptake Inhibitors (SNRIs)
- GLP-1 Receptor Agonists
- Combination Drugs
- Others
By Formulation
- Tablets
- Capsules
- Injections
- Oral Liquids
- Others
By End User
- Hospitals
- Clinics
- Homecare Settings
- Weight Loss Centers
- Others
Growth Opportunities
Combination Therapies Offer Growth Opportunity
Combination therapies present a significant growth opportunity for the anti-obesity drugs market. This approach targets multiple pathways involved in weight regulation, enhancing the efficacy of treatments. By combining drugs with different mechanisms of action, researchers aim to achieve better results and reduce side effects.
This method addresses the complex nature of obesity, which often requires multifaceted solutions. As clinical trials continue to show promising results, the adoption of combination therapies is expected to rise. This trend could lead to the development of more effective and safer anti-obesity treatments, expanding market potential.
Personalized and Precision Medicine Offers Growth Opportunity
Personalized and precision medicine is gaining traction in obesity management, offering significant growth opportunities. This approach leverages genetic testing, biomarkers, and individualized treatment plans to tailor anti-obesity drugs to specific patient profiles. By doing so, the effectiveness of treatments improves while minimizing adverse effects.
Personalized medicine addresses the unique needs of each patient, making obesity management more efficient. As technological advancements in genetic testing and biomarker identification progress, the market for personalized anti-obesity treatments is expected to grow, driving innovation and market expansion.
Trending Factors
Expanding Indications Are Trending Factors
Expanding indications for anti-obesity drugs are trending factors in the market. Some drugs show benefits beyond weight management, such as improving glycemic control in type 2 diabetes patients and reducing cardiovascular risks. Exploring these additional benefits and obtaining regulatory approvals can significantly expand the market.
For instance, drugs like GLP-1 receptor agonists are being studied for their dual benefits in weight and glucose management. As research confirms these additional indications, the demand for multi-purpose anti-obesity drugs will increase, driving market growth and opening new avenues for development.
Adoption in Emerging Markets Are Trending Factors
Adoption of anti-obesity drugs in emerging markets is a trending factor contributing to market expansion. Countries like China, India, and those in Latin America are experiencing rising obesity rates due to increasing urbanization, changing lifestyles, and rising incomes. These factors drive the demand for effective weight management solutions.
As awareness and healthcare access improve in these regions, the adoption of anti-obesity drugs is expected to rise. This expansion into emerging markets represents a significant opportunity for growth, as pharmaceutical companies tap into these large, underserved populations.
Regional Analysis
North America Dominates with 38.6% Market Share
North America holds the dominant position in the anti-obesity drugs market, accounting for 38.6% of the global market share.
Several factors drive North America's high market share in the anti-obesity drugs market. High obesity rates are a primary factor, with the CDC reporting that 42.4% of American adults were obese in 2017-2018. The region has strong healthcare infrastructure and access to advanced medical treatments. Additionally, there is significant investment in research and development, leading to the availability of innovative anti-obesity drugs. Public awareness campaigns about the health risks of obesity also contribute to the growing demand for these medications.
Regional characteristics significantly impact the industry's performance in North America. The presence of major pharmaceutical companies and extensive healthcare facilities ensures easy access to anti-obesity treatments. High disposable incomes and robust health insurance coverage further facilitate the adoption of these drugs. Additionally, the FDA's stringent regulatory framework ensures the safety and efficacy of marketed drugs, enhancing consumer confidence and driving market growth.
Europe Market Share - 27.5%
Europe holds a 27.5% market share in the anti-obesity drugs market. Factors such as high obesity rates, a strong healthcare system, and significant investment in healthcare research contribute to this substantial share. Countries like the UK, Germany, and France are key players in the region's market dynamics, driving growth through advanced healthcare facilities and supportive government policies.
Asia Pacific Market Share - 18.2%
Asia Pacific accounts for 18.2% of the anti-obesity drugs market. Rapid urbanization, changing dietary habits, and rising obesity rates are driving the market in this region. Countries like China, India, and Japan are experiencing increased demand for anti-obesity drugs due to improved healthcare infrastructure and growing public awareness about obesity-related health risks.
Middle East & Africa Market Share - 8.4%
The Middle East & Africa region holds an 8.4% market share. Rising obesity rates, increasing healthcare spending, and growing awareness of obesity's health impacts are key factors driving market growth. Countries like Saudi Arabia and South Africa are leading the region's market expansion through initiatives to combat obesity and improve public health.
Latin America Market Share - 7.3%
Latin America accounts for 7.3% of the global anti-obesity drugs market. Factors such as increasing urbanization, changing lifestyles, and rising healthcare expenditure contribute to the market growth. Brazil and Mexico are significant players in this region, with efforts to address obesity through public health campaigns and improved access to medical treatments.
Key Regions and Countries
- North America
- The US
- Canada
- Mexico
- Western Europe
- Germany
- France
- The UK
- Spain
- Italy
- Portugal
- Ireland
- Austria
- Switzerland
- Benelux
- Nordic
- Rest of Western Europe
- Eastern Europe
- Russia
- Poland
- The Czech Republic
- Greece
- Rest of Eastern Europe
- APAC
- China
- Japan
- South Korea
- India
- Australia & New Zealand
- Indonesia
- Malaysia
- Philippines
- Singapore
- Thailand
- Vietnam
- Rest of APAC
- Latin America
- Brazil
- Colombia
- Chile
- Argentina
- Costa Rica
- Rest of Latin America
- Middle East & Africa
- Algeria
- Egypt
- Israel
- Kuwait
- Nigeria
- Saudi Arabia
- South Africa
- Turkey
- United Arab Emirates
- Rest of MEA
Key Players Analysis
The anti-obesity drugs market is led by several key players. Novo Nordisk A/S and F. Hoffmann-La Roche Ltd are market leaders with strong product portfolios and significant market shares. Their advanced R&D capabilities and effective marketing strategies ensure their top positions.
GlaxoSmithKline plc and AstraZeneca also hold significant shares due to their extensive pharmaceutical expertise and global distribution networks. These companies benefit from well-established brands and strong market presence.
Boehringer Ingelheim International GmbH and Pfizer Inc. are notable for their innovative drug development. Their focus on new therapies and strategic partnerships enhances their market influence.
Merck & Co., Inc. and Johnson & Johnson Services, Inc. leverage their broad healthcare portfolios to maintain a competitive edge. Their diverse product lines and robust sales networks contribute to their strong market positions.
Takeda Pharmaceutical Company Limited and Eisai Co., Ltd. are recognized for their effective anti-obesity treatments and strong market penetration, particularly in Asia. Their strategic regional focus boosts their market impact.
Emerging companies like Orexigen Therapeutics, Inc., Rhythm Pharmaceuticals, Inc., and Zafgen, Inc. focus on novel treatments and specific patient needs. Their innovative approaches and potential for growth are noteworthy.
Vivus, Inc. and Norgine B.V. are smaller players that contribute through niche products and targeted marketing strategies. Their specialized solutions address specific market segments effectively.
Overall, these key players shape the anti-obesity drugs market with their strong R&D, effective marketing, and strategic positioning. Their combined efforts drive market growth and innovation.
Market Key Players
- Novo Nordisk A/S
- F. Hoffmann-La Roche Ltd
- GlaxoSmithKline plc
- AstraZeneca
- Boehringer Ingelheim International GmbH
- Pfizer Inc.
- Merck & Co., Inc.
- Johnson & Johnson Services, Inc.
- Takeda Pharmaceutical Company Limited
- Eisai Co., Ltd.
- Orexigen Therapeutics, Inc.
- Rhythm Pharmaceuticals, Inc.
- Zafgen, Inc.
- Vivus, Inc.
- Norgine B.V.
- Other Key Players
Recent Developments
- June 2024: New research presented at ENDO 2024 shows that the anti-obesity medication Zepbound (tirzepatide) is effective for weight loss in individuals with multiple obesity-related medical conditions, contradicting the belief that those with more issues lose less weight.
- June 2024: The FDA recently approved the GLP-1 medication Zepbound (tirzepatide) for chronic weight management in adults with obesity or overweight and at least one weight-related condition. Zepbound is more effective than previous treatments and can lead to weight loss comparable to surgery.
Report Scope
Report Features Description Market Value (2023) USD 4.6 Billion Forecast Revenue (2033) USD 39.3 Billion CAGR (2024-2033) 24.6% Base Year for Estimation 2023 Historic Period 2018-2023 Forecast Period 2024-2033 Report Coverage Revenue Forecast, Market Dynamics, Competitive Landscape, Recent Developments Segments Covered By Drug Type (Prescription Drugs, Over-the-Counter (OTC) Drugs), By Mechanism of Action (Appetite Suppressants, Fat Absorption Inhibitors, Serotonin-Norepinephrine Reuptake Inhibitors (SNRIs), GLP-1 Receptor Agonists, Combination Drugs, Others), By Formulation (Tablets, Capsules, Injections, Oral Liquids, Others), By End User (Hospitals, Clinics, Homecare Settings, Weight Loss Centers, Others) Regional Analysis North America - The US, Canada, & Mexico; Western Europe - Germany, France, The UK, Spain, Italy, Portugal, Ireland, Austria, Switzerland, Benelux, Nordic, & Rest of Western Europe; Eastern Europe - Russia, Poland, The Czech Republic, Greece, & Rest of Eastern Europe; APAC - China, Japan, South Korea, India, Australia & New Zealand, Indonesia, Malaysia, Philippines, Singapore, Thailand, Vietnam, & Rest of APAC; Latin America - Brazil, Colombia, Chile, Argentina, Costa Rica, & Rest of Latin America; Middle East & Africa - Algeria, Egypt, Israel, Kuwait, Nigeria, Saudi Arabia, South Africa, Turkey, United Arab Emirates, & Rest of MEA Competitive Landscape Novo Nordisk A/S, F. Hoffmann-La Roche Ltd, GlaxoSmithKline plc, AstraZeneca, Boehringer Ingelheim International GmbH, Pfizer Inc., Merck & Co., Inc., Johnson & Johnson Services, Inc., Takeda Pharmaceutical Company Limited, Eisai Co., Ltd., Orexigen Therapeutics, Inc., Rhythm Pharmaceuticals, Inc., Zafgen, Inc., Vivus, Inc., Norgine B.V., Other Key Players Customization Scope Customization for segments, region/country-level will be provided. Moreover, additional customization can be done based on the requirements. Purchase Options We have three licenses to opt for: Single User License, Multi-User License (Up to 5 Users), Corporate Use License (Unlimited User and Printable PDF) -
- 1. Executive Summary
- 1.1. Definition
- 1.2. Taxonomy
- 1.3. Research Scope
- 1.4. Key Analysis
- 1.5. Key Findings by Major Segments
- 1.6. Top strategies by Major Players
- 2. Global Anti Obesity Drugs Market Overview
- 2.1. Anti Obesity Drugs Market Dynamics
- 2.1.1. Drivers
- 2.1.2. Opportunities
- 2.1.3. Restraints
- 2.1.4. Challenges
- 2.2. Macro-economic Factors
- 2.3. Regulatory Framework
- 2.4. Market Investment Feasibility Index
- 2.5. PEST Analysis
- 2.6. PORTER’S Five Force Analysis
- 2.7. Drivers & Restraints Impact Analysis
- 2.8. Industry Chain Analysis
- 2.9. Cost Structure Analysis
- 2.10. Marketing Strategy
- 2.11. Russia-Ukraine War Impact Analysis
- 2.12. Opportunity Map Analysis
- 2.13. Market Competition Scenario Analysis
- 2.14. Product Life Cycle Analysis
- 2.15. Opportunity Orbits
- 2.16. Manufacturer Intensity Map
- 2.17. Major Companies sales by Value & Volume
- 2.1. Anti Obesity Drugs Market Dynamics
- 3. Global Anti Obesity Drugs Market Analysis, Opportunity and Forecast, 2016-2032
- 3.1. Global Anti Obesity Drugs Market Analysis, 2016-2021
- 3.2. Global Anti Obesity Drugs Market Opportunity and Forecast, 2023-2032
- 3.3. Global Anti Obesity Drugs Market Analysis, Opportunity and Forecast, By By Drug Type, 2016-2032
- 3.3.1. Global Anti Obesity Drugs Market Analysis by By Drug Type: Introduction
- 3.3.2. Market Size Absolute $ Opportunity Analysis and Forecast, By By Drug Type, 2016-2032
- 3.3.3. Prescription Drugs
- 3.3.4. Over-the-Counter (OTC) Drugs
- 3.4. Global Anti Obesity Drugs Market Analysis, Opportunity and Forecast, By By Mechanism of Action, 2016-2032
- 3.4.1. Global Anti Obesity Drugs Market Analysis by By Mechanism of Action: Introduction
- 3.4.2. Market Size Absolute $ Opportunity Analysis and Forecast, By By Mechanism of Action, 2016-2032
- 3.4.3. Appetite Suppressants
- 3.4.4. Fat Absorption Inhibitors
- 3.4.5. Serotonin-Norepinephrine Reuptake Inhibitors (SNRIs)
- 3.4.6. GLP-1 Receptor Agonists
- 3.4.7. Combination Drugs
- 3.4.8. Others
- 3.5. Global Anti Obesity Drugs Market Analysis, Opportunity and Forecast, By By Formulation, 2016-2032
- 3.5.1. Global Anti Obesity Drugs Market Analysis by By Formulation: Introduction
- 3.5.2. Market Size Absolute $ Opportunity Analysis and Forecast, By By Formulation, 2016-2032
- 3.5.3. Tablets
- 3.5.4. Capsules
- 3.5.5. Injections
- 3.5.6. Oral Liquids
- 3.5.7. Others
- 3.6. Global Anti Obesity Drugs Market Analysis, Opportunity and Forecast, By By End User, 2016-2032
- 3.6.1. Global Anti Obesity Drugs Market Analysis by By End User: Introduction
- 3.6.2. Market Size Absolute $ Opportunity Analysis and Forecast, By By End User, 2016-2032
- 3.6.3. Hospitals
- 3.6.4. Clinics
- 3.6.5. Homecare Settings
- 3.6.6. Weight Loss Centers
- 3.6.7. Others
- 4. North America Anti Obesity Drugs Market Analysis, Opportunity and Forecast, 2016-2032
- 4.1. North America Anti Obesity Drugs Market Analysis, 2016-2021
- 4.2. North America Anti Obesity Drugs Market Opportunity and Forecast, 2023-2032
- 4.3. North America Anti Obesity Drugs Market Analysis, Opportunity and Forecast, By By Drug Type, 2016-2032
- 4.3.1. North America Anti Obesity Drugs Market Analysis by By Drug Type: Introduction
- 4.3.2. Market Size Absolute $ Opportunity Analysis and Forecast, By By Drug Type, 2016-2032
- 4.3.3. Prescription Drugs
- 4.3.4. Over-the-Counter (OTC) Drugs
- 4.4. North America Anti Obesity Drugs Market Analysis, Opportunity and Forecast, By By Mechanism of Action, 2016-2032
- 4.4.1. North America Anti Obesity Drugs Market Analysis by By Mechanism of Action: Introduction
- 4.4.2. Market Size Absolute $ Opportunity Analysis and Forecast, By By Mechanism of Action, 2016-2032
- 4.4.3. Appetite Suppressants
- 4.4.4. Fat Absorption Inhibitors
- 4.4.5. Serotonin-Norepinephrine Reuptake Inhibitors (SNRIs)
- 4.4.6. GLP-1 Receptor Agonists
- 4.4.7. Combination Drugs
- 4.4.8. Others
- 4.5. North America Anti Obesity Drugs Market Analysis, Opportunity and Forecast, By By Formulation, 2016-2032
- 4.5.1. North America Anti Obesity Drugs Market Analysis by By Formulation: Introduction
- 4.5.2. Market Size Absolute $ Opportunity Analysis and Forecast, By By Formulation, 2016-2032
- 4.5.3. Tablets
- 4.5.4. Capsules
- 4.5.5. Injections
- 4.5.6. Oral Liquids
- 4.5.7. Others
- 4.6. North America Anti Obesity Drugs Market Analysis, Opportunity and Forecast, By By End User, 2016-2032
- 4.6.1. North America Anti Obesity Drugs Market Analysis by By End User: Introduction
- 4.6.2. Market Size Absolute $ Opportunity Analysis and Forecast, By By End User, 2016-2032
- 4.6.3. Hospitals
- 4.6.4. Clinics
- 4.6.5. Homecare Settings
- 4.6.6. Weight Loss Centers
- 4.6.7. Others
- 4.7. North America Anti Obesity Drugs Market Analysis, Opportunity and Forecast, By Country , 2016-2032
- 4.7.1. North America Anti Obesity Drugs Market Analysis by Country : Introduction
- 4.7.2. Market Size Absolute $ Opportunity Analysis and Forecast, Country , 2016-2032
- 4.7.2.1. The US
- 4.7.2.2. Canada
- 4.7.2.3. Mexico
- 5. Western Europe Anti Obesity Drugs Market Analysis, Opportunity and Forecast, 2016-2032
- 5.1. Western Europe Anti Obesity Drugs Market Analysis, 2016-2021
- 5.2. Western Europe Anti Obesity Drugs Market Opportunity and Forecast, 2023-2032
- 5.3. Western Europe Anti Obesity Drugs Market Analysis, Opportunity and Forecast, By By Drug Type, 2016-2032
- 5.3.1. Western Europe Anti Obesity Drugs Market Analysis by By Drug Type: Introduction
- 5.3.2. Market Size Absolute $ Opportunity Analysis and Forecast, By By Drug Type, 2016-2032
- 5.3.3. Prescription Drugs
- 5.3.4. Over-the-Counter (OTC) Drugs
- 5.4. Western Europe Anti Obesity Drugs Market Analysis, Opportunity and Forecast, By By Mechanism of Action, 2016-2032
- 5.4.1. Western Europe Anti Obesity Drugs Market Analysis by By Mechanism of Action: Introduction
- 5.4.2. Market Size Absolute $ Opportunity Analysis and Forecast, By By Mechanism of Action, 2016-2032
- 5.4.3. Appetite Suppressants
- 5.4.4. Fat Absorption Inhibitors
- 5.4.5. Serotonin-Norepinephrine Reuptake Inhibitors (SNRIs)
- 5.4.6. GLP-1 Receptor Agonists
- 5.4.7. Combination Drugs
- 5.4.8. Others
- 5.5. Western Europe Anti Obesity Drugs Market Analysis, Opportunity and Forecast, By By Formulation, 2016-2032
- 5.5.1. Western Europe Anti Obesity Drugs Market Analysis by By Formulation: Introduction
- 5.5.2. Market Size Absolute $ Opportunity Analysis and Forecast, By By Formulation, 2016-2032
- 5.5.3. Tablets
- 5.5.4. Capsules
- 5.5.5. Injections
- 5.5.6. Oral Liquids
- 5.5.7. Others
- 5.6. Western Europe Anti Obesity Drugs Market Analysis, Opportunity and Forecast, By By End User, 2016-2032
- 5.6.1. Western Europe Anti Obesity Drugs Market Analysis by By End User: Introduction
- 5.6.2. Market Size Absolute $ Opportunity Analysis and Forecast, By By End User, 2016-2032
- 5.6.3. Hospitals
- 5.6.4. Clinics
- 5.6.5. Homecare Settings
- 5.6.6. Weight Loss Centers
- 5.6.7. Others
- 5.7. Western Europe Anti Obesity Drugs Market Analysis, Opportunity and Forecast, By Country , 2016-2032
- 5.7.1. Western Europe Anti Obesity Drugs Market Analysis by Country : Introduction
- 5.7.2. Market Size Absolute $ Opportunity Analysis and Forecast, Country , 2016-2032
- 5.7.2.1. Germany
- 5.7.2.2. France
- 5.7.2.3. The UK
- 5.7.2.4. Spain
- 5.7.2.5. Italy
- 5.7.2.6. Portugal
- 5.7.2.7. Ireland
- 5.7.2.8. Austria
- 5.7.2.9. Switzerland
- 5.7.2.10. Benelux
- 5.7.2.11. Nordic
- 5.7.2.12. Rest of Western Europe
- 6. Eastern Europe Anti Obesity Drugs Market Analysis, Opportunity and Forecast, 2016-2032
- 6.1. Eastern Europe Anti Obesity Drugs Market Analysis, 2016-2021
- 6.2. Eastern Europe Anti Obesity Drugs Market Opportunity and Forecast, 2023-2032
- 6.3. Eastern Europe Anti Obesity Drugs Market Analysis, Opportunity and Forecast, By By Drug Type, 2016-2032
- 6.3.1. Eastern Europe Anti Obesity Drugs Market Analysis by By Drug Type: Introduction
- 6.3.2. Market Size Absolute $ Opportunity Analysis and Forecast, By By Drug Type, 2016-2032
- 6.3.3. Prescription Drugs
- 6.3.4. Over-the-Counter (OTC) Drugs
- 6.4. Eastern Europe Anti Obesity Drugs Market Analysis, Opportunity and Forecast, By By Mechanism of Action, 2016-2032
- 6.4.1. Eastern Europe Anti Obesity Drugs Market Analysis by By Mechanism of Action: Introduction
- 6.4.2. Market Size Absolute $ Opportunity Analysis and Forecast, By By Mechanism of Action, 2016-2032
- 6.4.3. Appetite Suppressants
- 6.4.4. Fat Absorption Inhibitors
- 6.4.5. Serotonin-Norepinephrine Reuptake Inhibitors (SNRIs)
- 6.4.6. GLP-1 Receptor Agonists
- 6.4.7. Combination Drugs
- 6.4.8. Others
- 6.5. Eastern Europe Anti Obesity Drugs Market Analysis, Opportunity and Forecast, By By Formulation, 2016-2032
- 6.5.1. Eastern Europe Anti Obesity Drugs Market Analysis by By Formulation: Introduction
- 6.5.2. Market Size Absolute $ Opportunity Analysis and Forecast, By By Formulation, 2016-2032
- 6.5.3. Tablets
- 6.5.4. Capsules
- 6.5.5. Injections
- 6.5.6. Oral Liquids
- 6.5.7. Others
- 6.6. Eastern Europe Anti Obesity Drugs Market Analysis, Opportunity and Forecast, By By End User, 2016-2032
- 6.6.1. Eastern Europe Anti Obesity Drugs Market Analysis by By End User: Introduction
- 6.6.2. Market Size Absolute $ Opportunity Analysis and Forecast, By By End User, 2016-2032
- 6.6.3. Hospitals
- 6.6.4. Clinics
- 6.6.5. Homecare Settings
- 6.6.6. Weight Loss Centers
- 6.6.7. Others
- 6.7. Eastern Europe Anti Obesity Drugs Market Analysis, Opportunity and Forecast, By Country , 2016-2032
- 6.7.1. Eastern Europe Anti Obesity Drugs Market Analysis by Country : Introduction
- 6.7.2. Market Size Absolute $ Opportunity Analysis and Forecast, Country , 2016-2032
- 6.7.2.1. Russia
- 6.7.2.2. Poland
- 6.7.2.3. The Czech Republic
- 6.7.2.4. Greece
- 6.7.2.5. Rest of Eastern Europe
- 7. APAC Anti Obesity Drugs Market Analysis, Opportunity and Forecast, 2016-2032
- 7.1. APAC Anti Obesity Drugs Market Analysis, 2016-2021
- 7.2. APAC Anti Obesity Drugs Market Opportunity and Forecast, 2023-2032
- 7.3. APAC Anti Obesity Drugs Market Analysis, Opportunity and Forecast, By By Drug Type, 2016-2032
- 7.3.1. APAC Anti Obesity Drugs Market Analysis by By Drug Type: Introduction
- 7.3.2. Market Size Absolute $ Opportunity Analysis and Forecast, By By Drug Type, 2016-2032
- 7.3.3. Prescription Drugs
- 7.3.4. Over-the-Counter (OTC) Drugs
- 7.4. APAC Anti Obesity Drugs Market Analysis, Opportunity and Forecast, By By Mechanism of Action, 2016-2032
- 7.4.1. APAC Anti Obesity Drugs Market Analysis by By Mechanism of Action: Introduction
- 7.4.2. Market Size Absolute $ Opportunity Analysis and Forecast, By By Mechanism of Action, 2016-2032
- 7.4.3. Appetite Suppressants
- 7.4.4. Fat Absorption Inhibitors
- 7.4.5. Serotonin-Norepinephrine Reuptake Inhibitors (SNRIs)
- 7.4.6. GLP-1 Receptor Agonists
- 7.4.7. Combination Drugs
- 7.4.8. Others
- 7.5. APAC Anti Obesity Drugs Market Analysis, Opportunity and Forecast, By By Formulation, 2016-2032
- 7.5.1. APAC Anti Obesity Drugs Market Analysis by By Formulation: Introduction
- 7.5.2. Market Size Absolute $ Opportunity Analysis and Forecast, By By Formulation, 2016-2032
- 7.5.3. Tablets
- 7.5.4. Capsules
- 7.5.5. Injections
- 7.5.6. Oral Liquids
- 7.5.7. Others
- 7.6. APAC Anti Obesity Drugs Market Analysis, Opportunity and Forecast, By By End User, 2016-2032
- 7.6.1. APAC Anti Obesity Drugs Market Analysis by By End User: Introduction
- 7.6.2. Market Size Absolute $ Opportunity Analysis and Forecast, By By End User, 2016-2032
- 7.6.3. Hospitals
- 7.6.4. Clinics
- 7.6.5. Homecare Settings
- 7.6.6. Weight Loss Centers
- 7.6.7. Others
- 7.7. APAC Anti Obesity Drugs Market Analysis, Opportunity and Forecast, By Country , 2016-2032
- 7.7.1. APAC Anti Obesity Drugs Market Analysis by Country : Introduction
- 7.7.2. Market Size Absolute $ Opportunity Analysis and Forecast, Country , 2016-2032
- 7.7.2.1. China
- 7.7.2.2. Japan
- 7.7.2.3. South Korea
- 7.7.2.4. India
- 7.7.2.5. Australia & New Zeland
- 7.7.2.6. Indonesia
- 7.7.2.7. Malaysia
- 7.7.2.8. Philippines
- 7.7.2.9. Singapore
- 7.7.2.10. Thailand
- 7.7.2.11. Vietnam
- 7.7.2.12. Rest of APAC
- 8. Latin America Anti Obesity Drugs Market Analysis, Opportunity and Forecast, 2016-2032
- 8.1. Latin America Anti Obesity Drugs Market Analysis, 2016-2021
- 8.2. Latin America Anti Obesity Drugs Market Opportunity and Forecast, 2023-2032
- 8.3. Latin America Anti Obesity Drugs Market Analysis, Opportunity and Forecast, By By Drug Type, 2016-2032
- 8.3.1. Latin America Anti Obesity Drugs Market Analysis by By Drug Type: Introduction
- 8.3.2. Market Size Absolute $ Opportunity Analysis and Forecast, By By Drug Type, 2016-2032
- 8.3.3. Prescription Drugs
- 8.3.4. Over-the-Counter (OTC) Drugs
- 8.4. Latin America Anti Obesity Drugs Market Analysis, Opportunity and Forecast, By By Mechanism of Action, 2016-2032
- 8.4.1. Latin America Anti Obesity Drugs Market Analysis by By Mechanism of Action: Introduction
- 8.4.2. Market Size Absolute $ Opportunity Analysis and Forecast, By By Mechanism of Action, 2016-2032
- 8.4.3. Appetite Suppressants
- 8.4.4. Fat Absorption Inhibitors
- 8.4.5. Serotonin-Norepinephrine Reuptake Inhibitors (SNRIs)
- 8.4.6. GLP-1 Receptor Agonists
- 8.4.7. Combination Drugs
- 8.4.8. Others
- 8.5. Latin America Anti Obesity Drugs Market Analysis, Opportunity and Forecast, By By Formulation, 2016-2032
- 8.5.1. Latin America Anti Obesity Drugs Market Analysis by By Formulation: Introduction
- 8.5.2. Market Size Absolute $ Opportunity Analysis and Forecast, By By Formulation, 2016-2032
- 8.5.3. Tablets
- 8.5.4. Capsules
- 8.5.5. Injections
- 8.5.6. Oral Liquids
- 8.5.7. Others
- 8.6. Latin America Anti Obesity Drugs Market Analysis, Opportunity and Forecast, By By End User, 2016-2032
- 8.6.1. Latin America Anti Obesity Drugs Market Analysis by By End User: Introduction
- 8.6.2. Market Size Absolute $ Opportunity Analysis and Forecast, By By End User, 2016-2032
- 8.6.3. Hospitals
- 8.6.4. Clinics
- 8.6.5. Homecare Settings
- 8.6.6. Weight Loss Centers
- 8.6.7. Others
- 8.7. Latin America Anti Obesity Drugs Market Analysis, Opportunity and Forecast, By Country , 2016-2032
- 8.7.1. Latin America Anti Obesity Drugs Market Analysis by Country : Introduction
- 8.7.2. Market Size Absolute $ Opportunity Analysis and Forecast, Country , 2016-2032
- 8.7.2.1. Brazil
- 8.7.2.2. Colombia
- 8.7.2.3. Chile
- 8.7.2.4. Argentina
- 8.7.2.5. Costa Rica
- 8.7.2.6. Rest of Latin America
- 9. Middle East & Africa Anti Obesity Drugs Market Analysis, Opportunity and Forecast, 2016-2032
- 9.1. Middle East & Africa Anti Obesity Drugs Market Analysis, 2016-2021
- 9.2. Middle East & Africa Anti Obesity Drugs Market Opportunity and Forecast, 2023-2032
- 9.3. Middle East & Africa Anti Obesity Drugs Market Analysis, Opportunity and Forecast, By By Drug Type, 2016-2032
- 9.3.1. Middle East & Africa Anti Obesity Drugs Market Analysis by By Drug Type: Introduction
- 9.3.2. Market Size Absolute $ Opportunity Analysis and Forecast, By By Drug Type, 2016-2032
- 9.3.3. Prescription Drugs
- 9.3.4. Over-the-Counter (OTC) Drugs
- 9.4. Middle East & Africa Anti Obesity Drugs Market Analysis, Opportunity and Forecast, By By Mechanism of Action, 2016-2032
- 9.4.1. Middle East & Africa Anti Obesity Drugs Market Analysis by By Mechanism of Action: Introduction
- 9.4.2. Market Size Absolute $ Opportunity Analysis and Forecast, By By Mechanism of Action, 2016-2032
- 9.4.3. Appetite Suppressants
- 9.4.4. Fat Absorption Inhibitors
- 9.4.5. Serotonin-Norepinephrine Reuptake Inhibitors (SNRIs)
- 9.4.6. GLP-1 Receptor Agonists
- 9.4.7. Combination Drugs
- 9.4.8. Others
- 9.5. Middle East & Africa Anti Obesity Drugs Market Analysis, Opportunity and Forecast, By By Formulation, 2016-2032
- 9.5.1. Middle East & Africa Anti Obesity Drugs Market Analysis by By Formulation: Introduction
- 9.5.2. Market Size Absolute $ Opportunity Analysis and Forecast, By By Formulation, 2016-2032
- 9.5.3. Tablets
- 9.5.4. Capsules
- 9.5.5. Injections
- 9.5.6. Oral Liquids
- 9.5.7. Others
- 9.6. Middle East & Africa Anti Obesity Drugs Market Analysis, Opportunity and Forecast, By By End User, 2016-2032
- 9.6.1. Middle East & Africa Anti Obesity Drugs Market Analysis by By End User: Introduction
- 9.6.2. Market Size Absolute $ Opportunity Analysis and Forecast, By By End User, 2016-2032
- 9.6.3. Hospitals
- 9.6.4. Clinics
- 9.6.5. Homecare Settings
- 9.6.6. Weight Loss Centers
- 9.6.7. Others
- 9.7. Middle East & Africa Anti Obesity Drugs Market Analysis, Opportunity and Forecast, By Country , 2016-2032
- 9.7.1. Middle East & Africa Anti Obesity Drugs Market Analysis by Country : Introduction
- 9.7.2. Market Size Absolute $ Opportunity Analysis and Forecast, Country , 2016-2032
- 9.7.2.1. Algeria
- 9.7.2.2. Egypt
- 9.7.2.3. Israel
- 9.7.2.4. Kuwait
- 9.7.2.5. Nigeria
- 9.7.2.6. Saudi Arabia
- 9.7.2.7. South Africa
- 9.7.2.8. Turkey
- 9.7.2.9. The UAE
- 9.7.2.10. Rest of MEA
- 10. Global Anti Obesity Drugs Market Analysis, Opportunity and Forecast, By Region , 2016-2032
- 10.1. Global Anti Obesity Drugs Market Analysis by Region : Introduction
- 10.2. Market Size Absolute $ Opportunity Analysis and Forecast, By Region , 2016-2032
- 10.2.1. North America
- 10.2.2. Western Europe
- 10.2.3. Eastern Europe
- 10.2.4. APAC
- 10.2.5. Latin America
- 10.2.6. Middle East & Africa
- 11. Global Anti Obesity Drugs Market Competitive Landscape, Market Share Analysis, and Company Profiles
- 11.1. Market Share Analysis
- 11.2. Company Profiles
- 11.3. Novo Nordisk A/S
- 11.3.1. Company Overview
- 11.3.2. Financial Highlights
- 11.3.3. Product Portfolio
- 11.3.4. SWOT Analysis
- 11.3.5. Key Strategies and Developments
- 11.4. F. Hoffmann-La Roche Ltd
- 11.4.1. Company Overview
- 11.4.2. Financial Highlights
- 11.4.3. Product Portfolio
- 11.4.4. SWOT Analysis
- 11.4.5. Key Strategies and Developments
- 11.5. GlaxoSmithKline plc
- 11.5.1. Company Overview
- 11.5.2. Financial Highlights
- 11.5.3. Product Portfolio
- 11.5.4. SWOT Analysis
- 11.5.5. Key Strategies and Developments
- 11.6. AstraZeneca
- 11.6.1. Company Overview
- 11.6.2. Financial Highlights
- 11.6.3. Product Portfolio
- 11.6.4. SWOT Analysis
- 11.6.5. Key Strategies and Developments
- 11.7. Boehringer Ingelheim International GmbH
- 11.7.1. Company Overview
- 11.7.2. Financial Highlights
- 11.7.3. Product Portfolio
- 11.7.4. SWOT Analysis
- 11.7.5. Key Strategies and Developments
- 11.8. Pfizer Inc.
- 11.8.1. Company Overview
- 11.8.2. Financial Highlights
- 11.8.3. Product Portfolio
- 11.8.4. SWOT Analysis
- 11.8.5. Key Strategies and Developments
- 11.9. Merck & Co., Inc.
- 11.9.1. Company Overview
- 11.9.2. Financial Highlights
- 11.9.3. Product Portfolio
- 11.9.4. SWOT Analysis
- 11.9.5. Key Strategies and Developments
- 11.10. Johnson & Johnson Services, Inc.
- 11.10.1. Company Overview
- 11.10.2. Financial Highlights
- 11.10.3. Product Portfolio
- 11.10.4. SWOT Analysis
- 11.10.5. Key Strategies and Developments
- 11.11. Takeda Pharmaceutical Company Limited
- 11.11.1. Company Overview
- 11.11.2. Financial Highlights
- 11.11.3. Product Portfolio
- 11.11.4. SWOT Analysis
- 11.11.5. Key Strategies and Developments
- 11.12. Eisai Co., Ltd.
- 11.12.1. Company Overview
- 11.12.2. Financial Highlights
- 11.12.3. Product Portfolio
- 11.12.4. SWOT Analysis
- 11.12.5. Key Strategies and Developments
- 11.13.1. Company Overview
- 11.13.2. Financial Highlights
- 11.13.3. Product Portfolio
- 11.13.4. SWOT Analysis
- 11.13.5. Key Strategies and Developments
- 11.14. Orexigen Therapeutics, Inc.
- 11.14.1. Company Overview
- 11.14.2. Financial Highlights
- 11.14.3. Product Portfolio
- 11.14.4. SWOT Analysis
- 11.14.5. Key Strategies and Developments
- 11.15. Zafgen, Inc.
- 11.15.1. Company Overview
- 11.15.2. Financial Highlights
- 11.15.3. Product Portfolio
- 11.15.4. SWOT Analysis
- 11.15.5. Key Strategies and Developments
- 11.16. Vivus, Inc.
- 11.16.1. Company Overview
- 11.16.2. Financial Highlights
- 11.16.3. Product Portfolio
- 11.16.4. SWOT Analysis
- 11.16.5. Key Strategies and Developments
- 11.17. Norgine B.V.
- 11.17.1. Company Overview
- 11.17.2. Financial Highlights
- 11.17.3. Product Portfolio
- 11.17.4. SWOT Analysis
- 11.17.5. Key Strategies and Developments
- 11.18. Other Key Players
- 11.18.1. Company Overview
- 11.18.2. Financial Highlights
- 11.18.3. Product Portfolio
- 11.18.4. SWOT Analysis
- 11.18.5. Key Strategies and Developments
- 12. Assumptions and Acronyms
- 13. Research Methodology
- 14. Contact
- List of Figures
- Figure 1: Global Anti Obesity Drugs Market Revenue (US$ Mn) Market Share by By Drug Type in 2022
- Figure 2: Global Anti Obesity Drugs Market Attractiveness Analysis by By Drug Type, 2016-2032
- Figure 3: Global Anti Obesity Drugs Market Revenue (US$ Mn) Market Share by By Mechanism of Actionin 2022
- Figure 4: Global Anti Obesity Drugs Market Attractiveness Analysis by By Mechanism of Action, 2016-2032
- Figure 5: Global Anti Obesity Drugs Market Revenue (US$ Mn) Market Share by By Formulationin 2022
- Figure 6: Global Anti Obesity Drugs Market Attractiveness Analysis by By Formulation, 2016-2032
- Figure 7: Global Anti Obesity Drugs Market Revenue (US$ Mn) Market Share by By End Userin 2022
- Figure 8: Global Anti Obesity Drugs Market Attractiveness Analysis by By End User, 2016-2032
- Figure 9: Global Anti Obesity Drugs Market Revenue (US$ Mn) Market Share by Region in 2022
- Figure 10: Global Anti Obesity Drugs Market Attractiveness Analysis by Region, 2016-2032
- Figure 11: Global Anti Obesity Drugs Market Revenue (US$ Mn) (2016-2032)
- Figure 12: Global Anti Obesity Drugs Market Revenue (US$ Mn) Comparison by Region (2016-2032)
- Figure 13: Global Anti Obesity Drugs Market Revenue (US$ Mn) Comparison by By Drug Type (2016-2032)
- Figure 14: Global Anti Obesity Drugs Market Revenue (US$ Mn) Comparison by By Mechanism of Action (2016-2032)
- Figure 15: Global Anti Obesity Drugs Market Revenue (US$ Mn) Comparison by By Formulation (2016-2032)
- Figure 16: Global Anti Obesity Drugs Market Revenue (US$ Mn) Comparison by By End User (2016-2032)
- Figure 17: Global Anti Obesity Drugs Market Y-o-Y Growth Rate Comparison by Region (2016-2032)
- Figure 18: Global Anti Obesity Drugs Market Y-o-Y Growth Rate Comparison by By Drug Type (2016-2032)
- Figure 19: Global Anti Obesity Drugs Market Y-o-Y Growth Rate Comparison by By Mechanism of Action (2016-2032)
- Figure 20: Global Anti Obesity Drugs Market Y-o-Y Growth Rate Comparison by By Formulation (2016-2032)
- Figure 21: Global Anti Obesity Drugs Market Y-o-Y Growth Rate Comparison by By End User (2016-2032)
- Figure 22: Global Anti Obesity Drugs Market Share Comparison by Region (2016-2032)
- Figure 23: Global Anti Obesity Drugs Market Share Comparison by By Drug Type (2016-2032)
- Figure 24: Global Anti Obesity Drugs Market Share Comparison by By Mechanism of Action (2016-2032)
- Figure 25: Global Anti Obesity Drugs Market Share Comparison by By Formulation (2016-2032)
- Figure 26: Global Anti Obesity Drugs Market Share Comparison by By End User (2016-2032)
- Figure 27: North America Anti Obesity Drugs Market Revenue (US$ Mn) Market Share by By Drug Typein 2022
- Figure 28: North America Anti Obesity Drugs Market Attractiveness Analysis by By Drug Type, 2016-2032
- Figure 29: North America Anti Obesity Drugs Market Revenue (US$ Mn) Market Share by By Mechanism of Actionin 2022
- Figure 30: North America Anti Obesity Drugs Market Attractiveness Analysis by By Mechanism of Action, 2016-2032
- Figure 31: North America Anti Obesity Drugs Market Revenue (US$ Mn) Market Share by By Formulationin 2022
- Figure 32: North America Anti Obesity Drugs Market Attractiveness Analysis by By Formulation, 2016-2032
- Figure 33: North America Anti Obesity Drugs Market Revenue (US$ Mn) Market Share by By End Userin 2022
- Figure 34: North America Anti Obesity Drugs Market Attractiveness Analysis by By End User, 2016-2032
- Figure 35: North America Anti Obesity Drugs Market Revenue (US$ Mn) Market Share by Country in 2022
- Figure 36: North America Anti Obesity Drugs Market Attractiveness Analysis by Country, 2016-2032
- Figure 37: North America Anti Obesity Drugs Market Revenue (US$ Mn) (2016-2032)
- Figure 38: North America Anti Obesity Drugs Market Revenue (US$ Mn) Comparison by Country (2016-2032)
- Figure 39: North America Anti Obesity Drugs Market Revenue (US$ Mn) Comparison by By Drug Type (2016-2032)
- Figure 40: North America Anti Obesity Drugs Market Revenue (US$ Mn) Comparison by By Mechanism of Action (2016-2032)
- Figure 41: North America Anti Obesity Drugs Market Revenue (US$ Mn) Comparison by By Formulation (2016-2032)
- Figure 42: North America Anti Obesity Drugs Market Revenue (US$ Mn) Comparison by By End User (2016-2032)
- Figure 43: North America Anti Obesity Drugs Market Y-o-Y Growth Rate Comparison by Country (2016-2032)
- Figure 44: North America Anti Obesity Drugs Market Y-o-Y Growth Rate Comparison by By Drug Type (2016-2032)
- Figure 45: North America Anti Obesity Drugs Market Y-o-Y Growth Rate Comparison by By Mechanism of Action (2016-2032)
- Figure 46: North America Anti Obesity Drugs Market Y-o-Y Growth Rate Comparison by By Formulation (2016-2032)
- Figure 47: North America Anti Obesity Drugs Market Y-o-Y Growth Rate Comparison by By End User (2016-2032)
- Figure 48: North America Anti Obesity Drugs Market Share Comparison by Country (2016-2032)
- Figure 49: North America Anti Obesity Drugs Market Share Comparison by By Drug Type (2016-2032)
- Figure 50: North America Anti Obesity Drugs Market Share Comparison by By Mechanism of Action (2016-2032)
- Figure 51: North America Anti Obesity Drugs Market Share Comparison by By Formulation (2016-2032)
- Figure 52: North America Anti Obesity Drugs Market Share Comparison by By End User (2016-2032)
- Figure 53: Western Europe Anti Obesity Drugs Market Revenue (US$ Mn) Market Share by By Drug Typein 2022
- Figure 54: Western Europe Anti Obesity Drugs Market Attractiveness Analysis by By Drug Type, 2016-2032
- Figure 55: Western Europe Anti Obesity Drugs Market Revenue (US$ Mn) Market Share by By Mechanism of Actionin 2022
- Figure 56: Western Europe Anti Obesity Drugs Market Attractiveness Analysis by By Mechanism of Action, 2016-2032
- Figure 57: Western Europe Anti Obesity Drugs Market Revenue (US$ Mn) Market Share by By Formulationin 2022
- Figure 58: Western Europe Anti Obesity Drugs Market Attractiveness Analysis by By Formulation, 2016-2032
- Figure 59: Western Europe Anti Obesity Drugs Market Revenue (US$ Mn) Market Share by By End Userin 2022
- Figure 60: Western Europe Anti Obesity Drugs Market Attractiveness Analysis by By End User, 2016-2032
- Figure 61: Western Europe Anti Obesity Drugs Market Revenue (US$ Mn) Market Share by Country in 2022
- Figure 62: Western Europe Anti Obesity Drugs Market Attractiveness Analysis by Country, 2016-2032
- Figure 63: Western Europe Anti Obesity Drugs Market Revenue (US$ Mn) (2016-2032)
- Figure 64: Western Europe Anti Obesity Drugs Market Revenue (US$ Mn) Comparison by Country (2016-2032)
- Figure 65: Western Europe Anti Obesity Drugs Market Revenue (US$ Mn) Comparison by By Drug Type (2016-2032)
- Figure 66: Western Europe Anti Obesity Drugs Market Revenue (US$ Mn) Comparison by By Mechanism of Action (2016-2032)
- Figure 67: Western Europe Anti Obesity Drugs Market Revenue (US$ Mn) Comparison by By Formulation (2016-2032)
- Figure 68: Western Europe Anti Obesity Drugs Market Revenue (US$ Mn) Comparison by By End User (2016-2032)
- Figure 69: Western Europe Anti Obesity Drugs Market Y-o-Y Growth Rate Comparison by Country (2016-2032)
- Figure 70: Western Europe Anti Obesity Drugs Market Y-o-Y Growth Rate Comparison by By Drug Type (2016-2032)
- Figure 71: Western Europe Anti Obesity Drugs Market Y-o-Y Growth Rate Comparison by By Mechanism of Action (2016-2032)
- Figure 72: Western Europe Anti Obesity Drugs Market Y-o-Y Growth Rate Comparison by By Formulation (2016-2032)
- Figure 73: Western Europe Anti Obesity Drugs Market Y-o-Y Growth Rate Comparison by By End User (2016-2032)
- Figure 74: Western Europe Anti Obesity Drugs Market Share Comparison by Country (2016-2032)
- Figure 75: Western Europe Anti Obesity Drugs Market Share Comparison by By Drug Type (2016-2032)
- Figure 76: Western Europe Anti Obesity Drugs Market Share Comparison by By Mechanism of Action (2016-2032)
- Figure 77: Western Europe Anti Obesity Drugs Market Share Comparison by By Formulation (2016-2032)
- Figure 78: Western Europe Anti Obesity Drugs Market Share Comparison by By End User (2016-2032)
- Figure 79: Eastern Europe Anti Obesity Drugs Market Revenue (US$ Mn) Market Share by By Drug Typein 2022
- Figure 80: Eastern Europe Anti Obesity Drugs Market Attractiveness Analysis by By Drug Type, 2016-2032
- Figure 81: Eastern Europe Anti Obesity Drugs Market Revenue (US$ Mn) Market Share by By Mechanism of Actionin 2022
- Figure 82: Eastern Europe Anti Obesity Drugs Market Attractiveness Analysis by By Mechanism of Action, 2016-2032
- Figure 83: Eastern Europe Anti Obesity Drugs Market Revenue (US$ Mn) Market Share by By Formulationin 2022
- Figure 84: Eastern Europe Anti Obesity Drugs Market Attractiveness Analysis by By Formulation, 2016-2032
- Figure 85: Eastern Europe Anti Obesity Drugs Market Revenue (US$ Mn) Market Share by By End Userin 2022
- Figure 86: Eastern Europe Anti Obesity Drugs Market Attractiveness Analysis by By End User, 2016-2032
- Figure 87: Eastern Europe Anti Obesity Drugs Market Revenue (US$ Mn) Market Share by Country in 2022
- Figure 88: Eastern Europe Anti Obesity Drugs Market Attractiveness Analysis by Country, 2016-2032
- Figure 89: Eastern Europe Anti Obesity Drugs Market Revenue (US$ Mn) (2016-2032)
- Figure 90: Eastern Europe Anti Obesity Drugs Market Revenue (US$ Mn) Comparison by Country (2016-2032)
- Figure 91: Eastern Europe Anti Obesity Drugs Market Revenue (US$ Mn) Comparison by By Drug Type (2016-2032)
- Figure 92: Eastern Europe Anti Obesity Drugs Market Revenue (US$ Mn) Comparison by By Mechanism of Action (2016-2032)
- Figure 93: Eastern Europe Anti Obesity Drugs Market Revenue (US$ Mn) Comparison by By Formulation (2016-2032)
- Figure 94: Eastern Europe Anti Obesity Drugs Market Revenue (US$ Mn) Comparison by By End User (2016-2032)
- Figure 95: Eastern Europe Anti Obesity Drugs Market Y-o-Y Growth Rate Comparison by Country (2016-2032)
- Figure 96: Eastern Europe Anti Obesity Drugs Market Y-o-Y Growth Rate Comparison by By Drug Type (2016-2032)
- Figure 97: Eastern Europe Anti Obesity Drugs Market Y-o-Y Growth Rate Comparison by By Mechanism of Action (2016-2032)
- Figure 98: Eastern Europe Anti Obesity Drugs Market Y-o-Y Growth Rate Comparison by By Formulation (2016-2032)
- Figure 99: Eastern Europe Anti Obesity Drugs Market Y-o-Y Growth Rate Comparison by By End User (2016-2032)
- Figure 100: Eastern Europe Anti Obesity Drugs Market Share Comparison by Country (2016-2032)
- Figure 101: Eastern Europe Anti Obesity Drugs Market Share Comparison by By Drug Type (2016-2032)
- Figure 102: Eastern Europe Anti Obesity Drugs Market Share Comparison by By Mechanism of Action (2016-2032)
- Figure 103: Eastern Europe Anti Obesity Drugs Market Share Comparison by By Formulation (2016-2032)
- Figure 104: Eastern Europe Anti Obesity Drugs Market Share Comparison by By End User (2016-2032)
- Figure 105: APAC Anti Obesity Drugs Market Revenue (US$ Mn) Market Share by By Drug Typein 2022
- Figure 106: APAC Anti Obesity Drugs Market Attractiveness Analysis by By Drug Type, 2016-2032
- Figure 107: APAC Anti Obesity Drugs Market Revenue (US$ Mn) Market Share by By Mechanism of Actionin 2022
- Figure 108: APAC Anti Obesity Drugs Market Attractiveness Analysis by By Mechanism of Action, 2016-2032
- Figure 109: APAC Anti Obesity Drugs Market Revenue (US$ Mn) Market Share by By Formulationin 2022
- Figure 110: APAC Anti Obesity Drugs Market Attractiveness Analysis by By Formulation, 2016-2032
- Figure 111: APAC Anti Obesity Drugs Market Revenue (US$ Mn) Market Share by By End Userin 2022
- Figure 112: APAC Anti Obesity Drugs Market Attractiveness Analysis by By End User, 2016-2032
- Figure 113: APAC Anti Obesity Drugs Market Revenue (US$ Mn) Market Share by Country in 2022
- Figure 114: APAC Anti Obesity Drugs Market Attractiveness Analysis by Country, 2016-2032
- Figure 115: APAC Anti Obesity Drugs Market Revenue (US$ Mn) (2016-2032)
- Figure 116: APAC Anti Obesity Drugs Market Revenue (US$ Mn) Comparison by Country (2016-2032)
- Figure 117: APAC Anti Obesity Drugs Market Revenue (US$ Mn) Comparison by By Drug Type (2016-2032)
- Figure 118: APAC Anti Obesity Drugs Market Revenue (US$ Mn) Comparison by By Mechanism of Action (2016-2032)
- Figure 119: APAC Anti Obesity Drugs Market Revenue (US$ Mn) Comparison by By Formulation (2016-2032)
- Figure 120: APAC Anti Obesity Drugs Market Revenue (US$ Mn) Comparison by By End User (2016-2032)
- Figure 121: APAC Anti Obesity Drugs Market Y-o-Y Growth Rate Comparison by Country (2016-2032)
- Figure 122: APAC Anti Obesity Drugs Market Y-o-Y Growth Rate Comparison by By Drug Type (2016-2032)
- Figure 123: APAC Anti Obesity Drugs Market Y-o-Y Growth Rate Comparison by By Mechanism of Action (2016-2032)
- Figure 124: APAC Anti Obesity Drugs Market Y-o-Y Growth Rate Comparison by By Formulation (2016-2032)
- Figure 125: APAC Anti Obesity Drugs Market Y-o-Y Growth Rate Comparison by By End User (2016-2032)
- Figure 126: APAC Anti Obesity Drugs Market Share Comparison by Country (2016-2032)
- Figure 127: APAC Anti Obesity Drugs Market Share Comparison by By Drug Type (2016-2032)
- Figure 128: APAC Anti Obesity Drugs Market Share Comparison by By Mechanism of Action (2016-2032)
- Figure 129: APAC Anti Obesity Drugs Market Share Comparison by By Formulation (2016-2032)
- Figure 130: APAC Anti Obesity Drugs Market Share Comparison by By End User (2016-2032)
- Figure 131: Latin America Anti Obesity Drugs Market Revenue (US$ Mn) Market Share by By Drug Typein 2022
- Figure 132: Latin America Anti Obesity Drugs Market Attractiveness Analysis by By Drug Type, 2016-2032
- Figure 133: Latin America Anti Obesity Drugs Market Revenue (US$ Mn) Market Share by By Mechanism of Actionin 2022
- Figure 134: Latin America Anti Obesity Drugs Market Attractiveness Analysis by By Mechanism of Action, 2016-2032
- Figure 135: Latin America Anti Obesity Drugs Market Revenue (US$ Mn) Market Share by By Formulationin 2022
- Figure 136: Latin America Anti Obesity Drugs Market Attractiveness Analysis by By Formulation, 2016-2032
- Figure 137: Latin America Anti Obesity Drugs Market Revenue (US$ Mn) Market Share by By End Userin 2022
- Figure 138: Latin America Anti Obesity Drugs Market Attractiveness Analysis by By End User, 2016-2032
- Figure 139: Latin America Anti Obesity Drugs Market Revenue (US$ Mn) Market Share by Country in 2022
- Figure 140: Latin America Anti Obesity Drugs Market Attractiveness Analysis by Country, 2016-2032
- Figure 141: Latin America Anti Obesity Drugs Market Revenue (US$ Mn) (2016-2032)
- Figure 142: Latin America Anti Obesity Drugs Market Revenue (US$ Mn) Comparison by Country (2016-2032)
- Figure 143: Latin America Anti Obesity Drugs Market Revenue (US$ Mn) Comparison by By Drug Type (2016-2032)
- Figure 144: Latin America Anti Obesity Drugs Market Revenue (US$ Mn) Comparison by By Mechanism of Action (2016-2032)
- Figure 145: Latin America Anti Obesity Drugs Market Revenue (US$ Mn) Comparison by By Formulation (2016-2032)
- Figure 146: Latin America Anti Obesity Drugs Market Revenue (US$ Mn) Comparison by By End User (2016-2032)
- Figure 147: Latin America Anti Obesity Drugs Market Y-o-Y Growth Rate Comparison by Country (2016-2032)
- Figure 148: Latin America Anti Obesity Drugs Market Y-o-Y Growth Rate Comparison by By Drug Type (2016-2032)
- Figure 149: Latin America Anti Obesity Drugs Market Y-o-Y Growth Rate Comparison by By Mechanism of Action (2016-2032)
- Figure 150: Latin America Anti Obesity Drugs Market Y-o-Y Growth Rate Comparison by By Formulation (2016-2032)
- Figure 151: Latin America Anti Obesity Drugs Market Y-o-Y Growth Rate Comparison by By End User (2016-2032)
- Figure 152: Latin America Anti Obesity Drugs Market Share Comparison by Country (2016-2032)
- Figure 153: Latin America Anti Obesity Drugs Market Share Comparison by By Drug Type (2016-2032)
- Figure 154: Latin America Anti Obesity Drugs Market Share Comparison by By Mechanism of Action (2016-2032)
- Figure 155: Latin America Anti Obesity Drugs Market Share Comparison by By Formulation (2016-2032)
- Figure 156: Latin America Anti Obesity Drugs Market Share Comparison by By End User (2016-2032)
- Figure 157: Middle East & Africa Anti Obesity Drugs Market Revenue (US$ Mn) Market Share by By Drug Typein 2022
- Figure 158: Middle East & Africa Anti Obesity Drugs Market Attractiveness Analysis by By Drug Type, 2016-2032
- Figure 159: Middle East & Africa Anti Obesity Drugs Market Revenue (US$ Mn) Market Share by By Mechanism of Actionin 2022
- Figure 160: Middle East & Africa Anti Obesity Drugs Market Attractiveness Analysis by By Mechanism of Action, 2016-2032
- Figure 161: Middle East & Africa Anti Obesity Drugs Market Revenue (US$ Mn) Market Share by By Formulationin 2022
- Figure 162: Middle East & Africa Anti Obesity Drugs Market Attractiveness Analysis by By Formulation, 2016-2032
- Figure 163: Middle East & Africa Anti Obesity Drugs Market Revenue (US$ Mn) Market Share by By End Userin 2022
- Figure 164: Middle East & Africa Anti Obesity Drugs Market Attractiveness Analysis by By End User, 2016-2032
- Figure 165: Middle East & Africa Anti Obesity Drugs Market Revenue (US$ Mn) Market Share by Country in 2022
- Figure 166: Middle East & Africa Anti Obesity Drugs Market Attractiveness Analysis by Country, 2016-2032
- Figure 167: Middle East & Africa Anti Obesity Drugs Market Revenue (US$ Mn) (2016-2032)
- Figure 168: Middle East & Africa Anti Obesity Drugs Market Revenue (US$ Mn) Comparison by Country (2016-2032)
- Figure 169: Middle East & Africa Anti Obesity Drugs Market Revenue (US$ Mn) Comparison by By Drug Type (2016-2032)
- Figure 170: Middle East & Africa Anti Obesity Drugs Market Revenue (US$ Mn) Comparison by By Mechanism of Action (2016-2032)
- Figure 171: Middle East & Africa Anti Obesity Drugs Market Revenue (US$ Mn) Comparison by By Formulation (2016-2032)
- Figure 172: Middle East & Africa Anti Obesity Drugs Market Revenue (US$ Mn) Comparison by By End User (2016-2032)
- Figure 173: Middle East & Africa Anti Obesity Drugs Market Y-o-Y Growth Rate Comparison by Country (2016-2032)
- Figure 174: Middle East & Africa Anti Obesity Drugs Market Y-o-Y Growth Rate Comparison by By Drug Type (2016-2032)
- Figure 175: Middle East & Africa Anti Obesity Drugs Market Y-o-Y Growth Rate Comparison by By Mechanism of Action (2016-2032)
- Figure 176: Middle East & Africa Anti Obesity Drugs Market Y-o-Y Growth Rate Comparison by By Formulation (2016-2032)
- Figure 177: Middle East & Africa Anti Obesity Drugs Market Y-o-Y Growth Rate Comparison by By End User (2016-2032)
- Figure 178: Middle East & Africa Anti Obesity Drugs Market Share Comparison by Country (2016-2032)
- Figure 179: Middle East & Africa Anti Obesity Drugs Market Share Comparison by By Drug Type (2016-2032)
- Figure 180: Middle East & Africa Anti Obesity Drugs Market Share Comparison by By Mechanism of Action (2016-2032)
- Figure 181: Middle East & Africa Anti Obesity Drugs Market Share Comparison by By Formulation (2016-2032)
- Figure 182: Middle East & Africa Anti Obesity Drugs Market Share Comparison by By End User (2016-2032)
- List of Tables
- Table 1: Global Anti Obesity Drugs Market Comparison by By Drug Type (2016-2032)
- Table 2: Global Anti Obesity Drugs Market Comparison by By Mechanism of Action (2016-2032)
- Table 3: Global Anti Obesity Drugs Market Comparison by By Formulation (2016-2032)
- Table 4: Global Anti Obesity Drugs Market Comparison by By End User (2016-2032)
- Table 5: Global Anti Obesity Drugs Market Revenue (US$ Mn) Comparison by Region (2016-2032)
- Table 6: Global Anti Obesity Drugs Market Revenue (US$ Mn) (2016-2032)
- Table 7: Global Anti Obesity Drugs Market Revenue (US$ Mn) Comparison by Region (2016-2032)
- Table 8: Global Anti Obesity Drugs Market Revenue (US$ Mn) Comparison by By Drug Type (2016-2032)
- Table 9: Global Anti Obesity Drugs Market Revenue (US$ Mn) Comparison by By Mechanism of Action (2016-2032)
- Table 10: Global Anti Obesity Drugs Market Revenue (US$ Mn) Comparison by By Formulation (2016-2032)
- Table 11: Global Anti Obesity Drugs Market Revenue (US$ Mn) Comparison by By End User (2016-2032)
- Table 12: Global Anti Obesity Drugs Market Y-o-Y Growth Rate Comparison by Region (2016-2032)
- Table 13: Global Anti Obesity Drugs Market Y-o-Y Growth Rate Comparison by By Drug Type (2016-2032)
- Table 14: Global Anti Obesity Drugs Market Y-o-Y Growth Rate Comparison by By Mechanism of Action (2016-2032)
- Table 15: Global Anti Obesity Drugs Market Y-o-Y Growth Rate Comparison by By Formulation (2016-2032)
- Table 16: Global Anti Obesity Drugs Market Y-o-Y Growth Rate Comparison by By End User (2016-2032)
- Table 17: Global Anti Obesity Drugs Market Share Comparison by Region (2016-2032)
- Table 18: Global Anti Obesity Drugs Market Share Comparison by By Drug Type (2016-2032)
- Table 19: Global Anti Obesity Drugs Market Share Comparison by By Mechanism of Action (2016-2032)
- Table 20: Global Anti Obesity Drugs Market Share Comparison by By Formulation (2016-2032)
- Table 21: Global Anti Obesity Drugs Market Share Comparison by By End User (2016-2032)
- Table 22: North America Anti Obesity Drugs Market Comparison by By Mechanism of Action (2016-2032)
- Table 23: North America Anti Obesity Drugs Market Comparison by By Formulation (2016-2032)
- Table 24: North America Anti Obesity Drugs Market Comparison by By End User (2016-2032)
- Table 25: North America Anti Obesity Drugs Market Revenue (US$ Mn) Comparison by Country (2016-2032)
- Table 26: North America Anti Obesity Drugs Market Revenue (US$ Mn) (2016-2032)
- Table 27: North America Anti Obesity Drugs Market Revenue (US$ Mn) Comparison by Country (2016-2032)
- Table 28: North America Anti Obesity Drugs Market Revenue (US$ Mn) Comparison by By Drug Type (2016-2032)
- Table 29: North America Anti Obesity Drugs Market Revenue (US$ Mn) Comparison by By Mechanism of Action (2016-2032)
- Table 30: North America Anti Obesity Drugs Market Revenue (US$ Mn) Comparison by By Formulation (2016-2032)
- Table 31: North America Anti Obesity Drugs Market Revenue (US$ Mn) Comparison by By End User (2016-2032)
- Table 32: North America Anti Obesity Drugs Market Y-o-Y Growth Rate Comparison by Country (2016-2032)
- Table 33: North America Anti Obesity Drugs Market Y-o-Y Growth Rate Comparison by By Drug Type (2016-2032)
- Table 34: North America Anti Obesity Drugs Market Y-o-Y Growth Rate Comparison by By Mechanism of Action (2016-2032)
- Table 35: North America Anti Obesity Drugs Market Y-o-Y Growth Rate Comparison by By Formulation (2016-2032)
- Table 36: North America Anti Obesity Drugs Market Y-o-Y Growth Rate Comparison by By End User (2016-2032)
- Table 37: North America Anti Obesity Drugs Market Share Comparison by Country (2016-2032)
- Table 38: North America Anti Obesity Drugs Market Share Comparison by By Drug Type (2016-2032)
- Table 39: North America Anti Obesity Drugs Market Share Comparison by By Mechanism of Action (2016-2032)
- Table 40: North America Anti Obesity Drugs Market Share Comparison by By Formulation (2016-2032)
- Table 41: North America Anti Obesity Drugs Market Share Comparison by By End User (2016-2032)
- Table 42: Western Europe Anti Obesity Drugs Market Comparison by By Drug Type (2016-2032)
- Table 43: Western Europe Anti Obesity Drugs Market Comparison by By Mechanism of Action (2016-2032)
- Table 44: Western Europe Anti Obesity Drugs Market Comparison by By Formulation (2016-2032)
- Table 45: Western Europe Anti Obesity Drugs Market Comparison by By End User (2016-2032)
- Table 46: Western Europe Anti Obesity Drugs Market Revenue (US$ Mn) Comparison by Country (2016-2032)
- Table 47: Western Europe Anti Obesity Drugs Market Revenue (US$ Mn) (2016-2032)
- Table 48: Western Europe Anti Obesity Drugs Market Revenue (US$ Mn) Comparison by Country (2016-2032)
- Table 49: Western Europe Anti Obesity Drugs Market Revenue (US$ Mn) Comparison by By Drug Type (2016-2032)
- Table 50: Western Europe Anti Obesity Drugs Market Revenue (US$ Mn) Comparison by By Mechanism of Action (2016-2032)
- Table 51: Western Europe Anti Obesity Drugs Market Revenue (US$ Mn) Comparison by By Formulation (2016-2032)
- Table 52: Western Europe Anti Obesity Drugs Market Revenue (US$ Mn) Comparison by By End User (2016-2032)
- Table 53: Western Europe Anti Obesity Drugs Market Y-o-Y Growth Rate Comparison by Country (2016-2032)
- Table 54: Western Europe Anti Obesity Drugs Market Y-o-Y Growth Rate Comparison by By Drug Type (2016-2032)
- Table 55: Western Europe Anti Obesity Drugs Market Y-o-Y Growth Rate Comparison by By Mechanism of Action (2016-2032)
- Table 56: Western Europe Anti Obesity Drugs Market Y-o-Y Growth Rate Comparison by By Formulation (2016-2032)
- Table 57: Western Europe Anti Obesity Drugs Market Y-o-Y Growth Rate Comparison by By End User (2016-2032)
- Table 58: Western Europe Anti Obesity Drugs Market Share Comparison by Country (2016-2032)
- Table 59: Western Europe Anti Obesity Drugs Market Share Comparison by By Drug Type (2016-2032)
- Table 60: Western Europe Anti Obesity Drugs Market Share Comparison by By Mechanism of Action (2016-2032)
- Table 61: Western Europe Anti Obesity Drugs Market Share Comparison by By Formulation (2016-2032)
- Table 62: Western Europe Anti Obesity Drugs Market Share Comparison by By End User (2016-2032)
- Table 63: Eastern Europe Anti Obesity Drugs Market Comparison by By Drug Type (2016-2032)
- Table 64: Eastern Europe Anti Obesity Drugs Market Comparison by By Mechanism of Action (2016-2032)
- Table 65: Eastern Europe Anti Obesity Drugs Market Comparison by By Formulation (2016-2032)
- Table 66: Eastern Europe Anti Obesity Drugs Market Comparison by By End User (2016-2032)
- Table 67: Eastern Europe Anti Obesity Drugs Market Revenue (US$ Mn) Comparison by Country (2016-2032)
- Table 68: Eastern Europe Anti Obesity Drugs Market Revenue (US$ Mn) (2016-2032)
- Table 69: Eastern Europe Anti Obesity Drugs Market Revenue (US$ Mn) Comparison by Country (2016-2032)
- Table 70: Eastern Europe Anti Obesity Drugs Market Revenue (US$ Mn) Comparison by By Drug Type (2016-2032)
- Table 71: Eastern Europe Anti Obesity Drugs Market Revenue (US$ Mn) Comparison by By Mechanism of Action (2016-2032)
- Table 72: Eastern Europe Anti Obesity Drugs Market Revenue (US$ Mn) Comparison by By Formulation (2016-2032)
- Table 73: Eastern Europe Anti Obesity Drugs Market Revenue (US$ Mn) Comparison by By End User (2016-2032)
- Table 74: Eastern Europe Anti Obesity Drugs Market Y-o-Y Growth Rate Comparison by Country (2016-2032)
- Table 75: Eastern Europe Anti Obesity Drugs Market Y-o-Y Growth Rate Comparison by By Drug Type (2016-2032)
- Table 76: Eastern Europe Anti Obesity Drugs Market Y-o-Y Growth Rate Comparison by By Mechanism of Action (2016-2032)
- Table 77: Eastern Europe Anti Obesity Drugs Market Y-o-Y Growth Rate Comparison by By Formulation (2016-2032)
- Table 78: Eastern Europe Anti Obesity Drugs Market Y-o-Y Growth Rate Comparison by By End User (2016-2032)
- Table 79: Eastern Europe Anti Obesity Drugs Market Share Comparison by Country (2016-2032)
- Table 80: Eastern Europe Anti Obesity Drugs Market Share Comparison by By Drug Type (2016-2032)
- Table 81: Eastern Europe Anti Obesity Drugs Market Share Comparison by By Mechanism of Action (2016-2032)
- Table 82: Eastern Europe Anti Obesity Drugs Market Share Comparison by By Formulation (2016-2032)
- Table 83: Eastern Europe Anti Obesity Drugs Market Share Comparison by By End User (2016-2032)
- Table 84: APAC Anti Obesity Drugs Market Comparison by By Drug Type (2016-2032)
- Table 85: APAC Anti Obesity Drugs Market Comparison by By Mechanism of Action (2016-2032)
- Table 86: APAC Anti Obesity Drugs Market Comparison by By Formulation (2016-2032)
- Table 87: APAC Anti Obesity Drugs Market Comparison by By End User (2016-2032)
- Table 88: APAC Anti Obesity Drugs Market Revenue (US$ Mn) Comparison by Country (2016-2032)
- Table 89: APAC Anti Obesity Drugs Market Revenue (US$ Mn) (2016-2032)
- Table 90: APAC Anti Obesity Drugs Market Revenue (US$ Mn) Comparison by Country (2016-2032)
- Table 91: APAC Anti Obesity Drugs Market Revenue (US$ Mn) Comparison by By Drug Type (2016-2032)
- Table 92: APAC Anti Obesity Drugs Market Revenue (US$ Mn) Comparison by By Mechanism of Action (2016-2032)
- Table 93: APAC Anti Obesity Drugs Market Revenue (US$ Mn) Comparison by By Formulation (2016-2032)
- Table 94: APAC Anti Obesity Drugs Market Revenue (US$ Mn) Comparison by By End User (2016-2032)
- Table 95: APAC Anti Obesity Drugs Market Y-o-Y Growth Rate Comparison by Country (2016-2032)
- Table 96: APAC Anti Obesity Drugs Market Y-o-Y Growth Rate Comparison by By Drug Type (2016-2032)
- Table 97: APAC Anti Obesity Drugs Market Y-o-Y Growth Rate Comparison by By Mechanism of Action (2016-2032)
- Table 98: APAC Anti Obesity Drugs Market Y-o-Y Growth Rate Comparison by By Formulation (2016-2032)
- Table 99: APAC Anti Obesity Drugs Market Y-o-Y Growth Rate Comparison by By End User (2016-2032)
- Table 100: APAC Anti Obesity Drugs Market Share Comparison by Country (2016-2032)
- Table 101: APAC Anti Obesity Drugs Market Share Comparison by By Drug Type (2016-2032)
- Table 102: APAC Anti Obesity Drugs Market Share Comparison by By Mechanism of Action (2016-2032)
- Table 103: APAC Anti Obesity Drugs Market Share Comparison by By Formulation (2016-2032)
- Table 104: APAC Anti Obesity Drugs Market Share Comparison by By End User (2016-2032)
- Table 105: Latin America Anti Obesity Drugs Market Comparison by By Drug Type (2016-2032)
- Table 106: Latin America Anti Obesity Drugs Market Comparison by By Mechanism of Action (2016-2032)
- Table 107: Latin America Anti Obesity Drugs Market Comparison by By Formulation (2016-2032)
- Table 108: Latin America Anti Obesity Drugs Market Comparison by By End User (2016-2032)
- Table 109: Latin America Anti Obesity Drugs Market Revenue (US$ Mn) Comparison by Country (2016-2032)
- Table 110: Latin America Anti Obesity Drugs Market Revenue (US$ Mn) (2016-2032)
- Table 111: Latin America Anti Obesity Drugs Market Revenue (US$ Mn) Comparison by Country (2016-2032)
- Table 112: Latin America Anti Obesity Drugs Market Revenue (US$ Mn) Comparison by By Drug Type (2016-2032)
- Table 113: Latin America Anti Obesity Drugs Market Revenue (US$ Mn) Comparison by By Mechanism of Action (2016-2032)
- Table 114: Latin America Anti Obesity Drugs Market Revenue (US$ Mn) Comparison by By Formulation (2016-2032)
- Table 115: Latin America Anti Obesity Drugs Market Revenue (US$ Mn) Comparison by By End User (2016-2032)
- Table 116: Latin America Anti Obesity Drugs Market Y-o-Y Growth Rate Comparison by Country (2016-2032)
- Table 117: Latin America Anti Obesity Drugs Market Y-o-Y Growth Rate Comparison by By Drug Type (2016-2032)
- Table 118: Latin America Anti Obesity Drugs Market Y-o-Y Growth Rate Comparison by By Mechanism of Action (2016-2032)
- Table 119: Latin America Anti Obesity Drugs Market Y-o-Y Growth Rate Comparison by By Formulation (2016-2032)
- Table 120: Latin America Anti Obesity Drugs Market Y-o-Y Growth Rate Comparison by By End User (2016-2032)
- Table 121: Latin America Anti Obesity Drugs Market Share Comparison by Country (2016-2032)
- Table 122: Latin America Anti Obesity Drugs Market Share Comparison by By Drug Type (2016-2032)
- Table 123: Latin America Anti Obesity Drugs Market Share Comparison by By Mechanism of Action (2016-2032)
- Table 124: Latin America Anti Obesity Drugs Market Share Comparison by By Formulation (2016-2032)
- Table 125: Latin America Anti Obesity Drugs Market Share Comparison by By End User (2016-2032)
- Table 126: Middle East & Africa Anti Obesity Drugs Market Comparison by By Drug Type (2016-2032)
- Table 127: Middle East & Africa Anti Obesity Drugs Market Comparison by By Mechanism of Action (2016-2032)
- Table 128: Middle East & Africa Anti Obesity Drugs Market Comparison by By Formulation (2016-2032)
- Table 129: Middle East & Africa Anti Obesity Drugs Market Comparison by By End User (2016-2032)
- Table 130: Middle East & Africa Anti Obesity Drugs Market Revenue (US$ Mn) Comparison by Country (2016-2032)
- Table 131: Middle East & Africa Anti Obesity Drugs Market Revenue (US$ Mn) (2016-2032)
- Table 132: Middle East & Africa Anti Obesity Drugs Market Revenue (US$ Mn) Comparison by Country (2016-2032)
- Table 133: Middle East & Africa Anti Obesity Drugs Market Revenue (US$ Mn) Comparison by By Drug Type (2016-2032)
- Table 134: Middle East & Africa Anti Obesity Drugs Market Revenue (US$ Mn) Comparison by By Mechanism of Action (2016-2032)
- Table 135: Middle East & Africa Anti Obesity Drugs Market Revenue (US$ Mn) Comparison by By Formulation (2016-2032)
- Table 136: Middle East & Africa Anti Obesity Drugs Market Revenue (US$ Mn) Comparison by By End User (2016-2032)
- Table 137: Middle East & Africa Anti Obesity Drugs Market Y-o-Y Growth Rate Comparison by Country (2016-2032)
- Table 138: Middle East & Africa Anti Obesity Drugs Market Y-o-Y Growth Rate Comparison by By Drug Type (2016-2032)
- Table 139: Middle East & Africa Anti Obesity Drugs Market Y-o-Y Growth Rate Comparison by By Mechanism of Action (2016-2032)
- Table 140: Middle East & Africa Anti Obesity Drugs Market Y-o-Y Growth Rate Comparison by By Formulation (2016-2032)
- Table 141: Middle East & Africa Anti Obesity Drugs Market Y-o-Y Growth Rate Comparison by By End User (2016-2032)
- Table 142: Middle East & Africa Anti Obesity Drugs Market Share Comparison by Country (2016-2032)
- Table 143: Middle East & Africa Anti Obesity Drugs Market Share Comparison by By Drug Type (2016-2032)
- Table 144: Middle East & Africa Anti Obesity Drugs Market Share Comparison by By Mechanism of Action (2016-2032)
- Table 145: Middle East & Africa Anti Obesity Drugs Market Share Comparison by By Formulation (2016-2032)
- Table 146: Middle East & Africa Anti Obesity Drugs Market Share Comparison by By End User (2016-2032)
- 1. Executive Summary
-
- Novo Nordisk A/S
- F. Hoffmann-La Roche Ltd
- GlaxoSmithKline plc
- AstraZeneca
- Boehringer Ingelheim International GmbH
- Pfizer Inc.
- Merck & Co., Inc.
- Johnson & Johnson Services, Inc.
- Takeda Pharmaceutical Company Limited
- Eisai Co., Ltd.
- Orexigen Therapeutics, Inc.
- Rhythm Pharmaceuticals, Inc.
- Zafgen, Inc.
- Vivus, Inc.
- Norgine B.V.
- Other Key Players
Our Clients


View Our Licence Options
