Global Prescription Drugs Market By Product Type(Generics, Orphan, Other Prescription Drugs), By Application(Oncology, Central Nervous System, Vaccines, Immunosuppressants, Others), By Distribution Channel(Hospital Pharmacies, Retail Pharmacies & Drug Stores, Others), By Region And Companies - Industry Segment Outlook, Market Assessment, Competition Scenario, Trends, And Forecast 2024-2033
-
45479
-
Feb 2025
-
300
-


-
This report was compiled by Trishita Deb Trishita Deb is an experienced market research and consulting professional with over 7 years of expertise across healthcare, consumer goods, and materials, contributing to over 400 healthcare-related reports. Correspondence Team Lead- Healthcare Linkedin | Detailed Market research Methodology Our methodology involves a mix of primary research, including interviews with leading mental health experts, and secondary research from reputable medical journals and databases. View Detailed Methodology Page
-
Quick Navigation
Report Overview
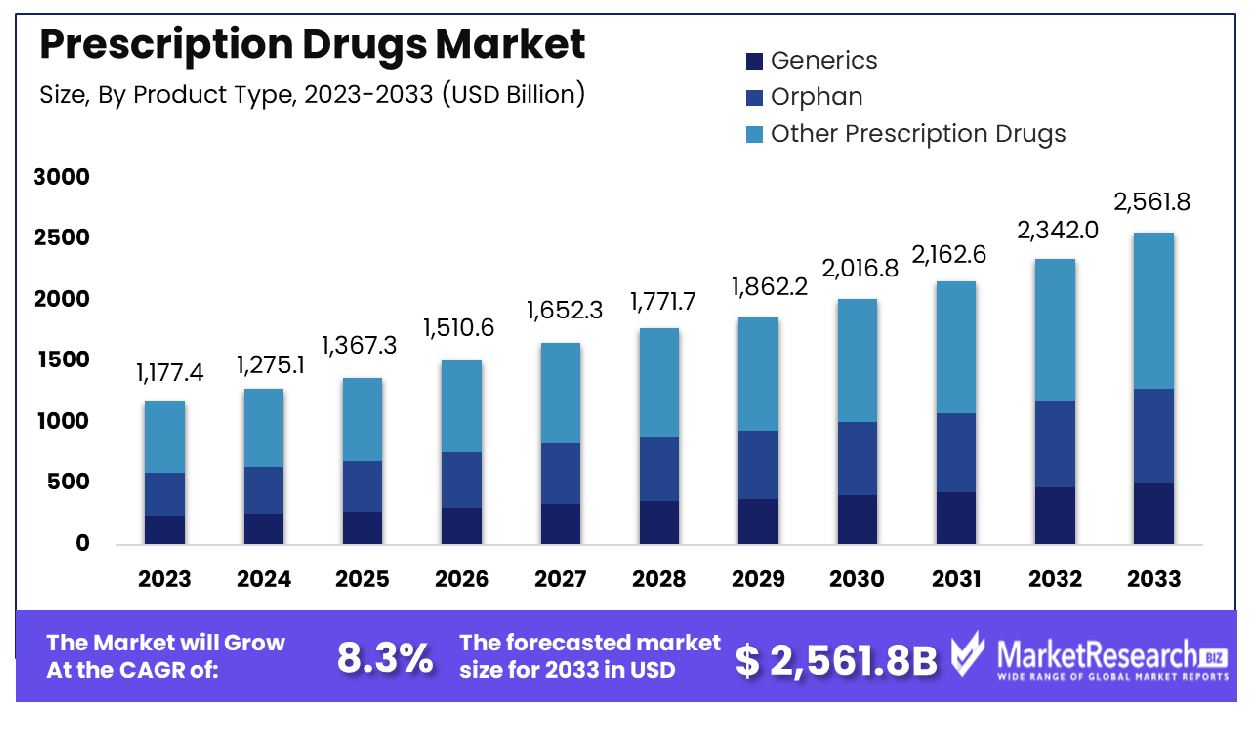
The Global Prescription Drugs Market was valued at USD 1,177.4 billion in 2023. It is expected to reach USD 2,561.8 billion by 2033, with a CAGR of 8.3% during the forecast period from 2024 to 2033.
The prescription drugs market encompasses the sale and distribution of medication that legally requires a medical prescription before it can be dispensed. This market is integral to the global healthcare industry, addressing a broad spectrum of therapeutic areas, from chronic conditions to acute illnesses. It is characterized by rigorous regulatory frameworks, extensive research and development activities, and substantial investments in pharmaceutical innovation.
Key stakeholders, including product managers, are pivotal in navigating the complexities of market dynamics, regulatory compliance, and product lifecycle management to drive growth and address unmet medical needs effectively.
The Prescription Drugs Market continues to exhibit robust growth fueled by various factors, as evidenced by recent statistics and projections. Prescription drug spending in the U.S. has shown a steady upward trajectory, with a projected increase of 6.0% to 8.0% overall in 2023. Notably, clinics and hospitals are expected to experience even higher growth rates, ranging from 8.0% to 10.0%, underlining the vital role these institutions play in the distribution and administration of pharmaceuticals.
Moreover, the World Drug Report 2023 underscores the dynamic nature of the pharmaceutical landscape, revealing a staggering 1,165 new psychoactive substances identified over the past 15 years. This influx of novel compounds underscores the continuous innovation within the industry, presenting both opportunities and challenges for stakeholders.
Delving deeper into demographic trends, recent prescription drug statistics for 2024 illuminate the widespread reliance on pharmaceutical interventions, with approximately 66% of U.S. adults reportedly utilizing prescription medications. Among the therapeutic areas driving substantial spending are antidiabetics, oncology, autoimmune, and respiratory diseases, reflecting the growing prevalence of chronic conditions and the corresponding demand for effective treatments.
Furthermore, insights from 2021 highlight the prevalence of prescription drug usage among adults, with a significant portion reporting adherence challenges due to cost considerations. Despite advancements in therapeutic options, affordability remains a critical issue, underscoring the importance of accessible healthcare solutions.
Key Takeaways
- Market Growth: The Global Prescription Drugs Market was valued at USD 1,177.4 billion in 2023. It is expected to reach USD 2,561.8 billion by 2033, with a CAGR of 8.3% during the forecast period from 2024 to 2033.
- By Product Type: Other Prescription Drugs dominate product type at 32%.
- By Application: Oncology leads applications at 35%.
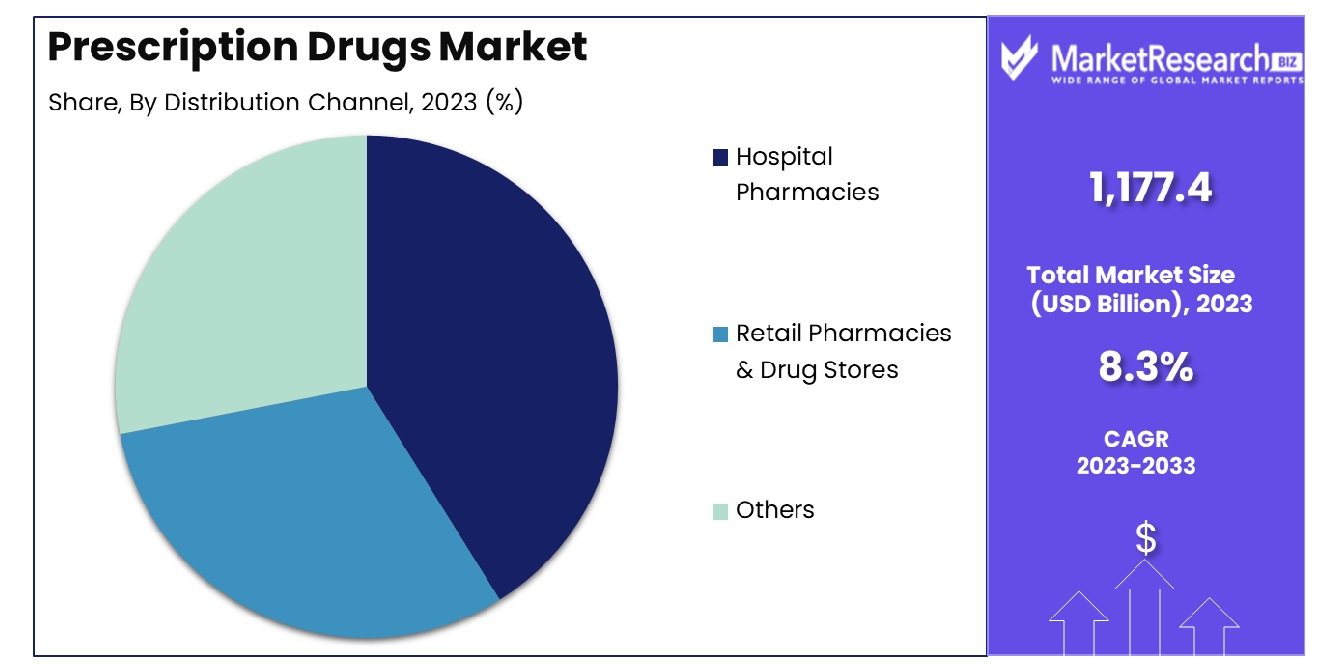
- By Distribution Channel: Hospital Pharmacies dominate distribution channels at 52%.
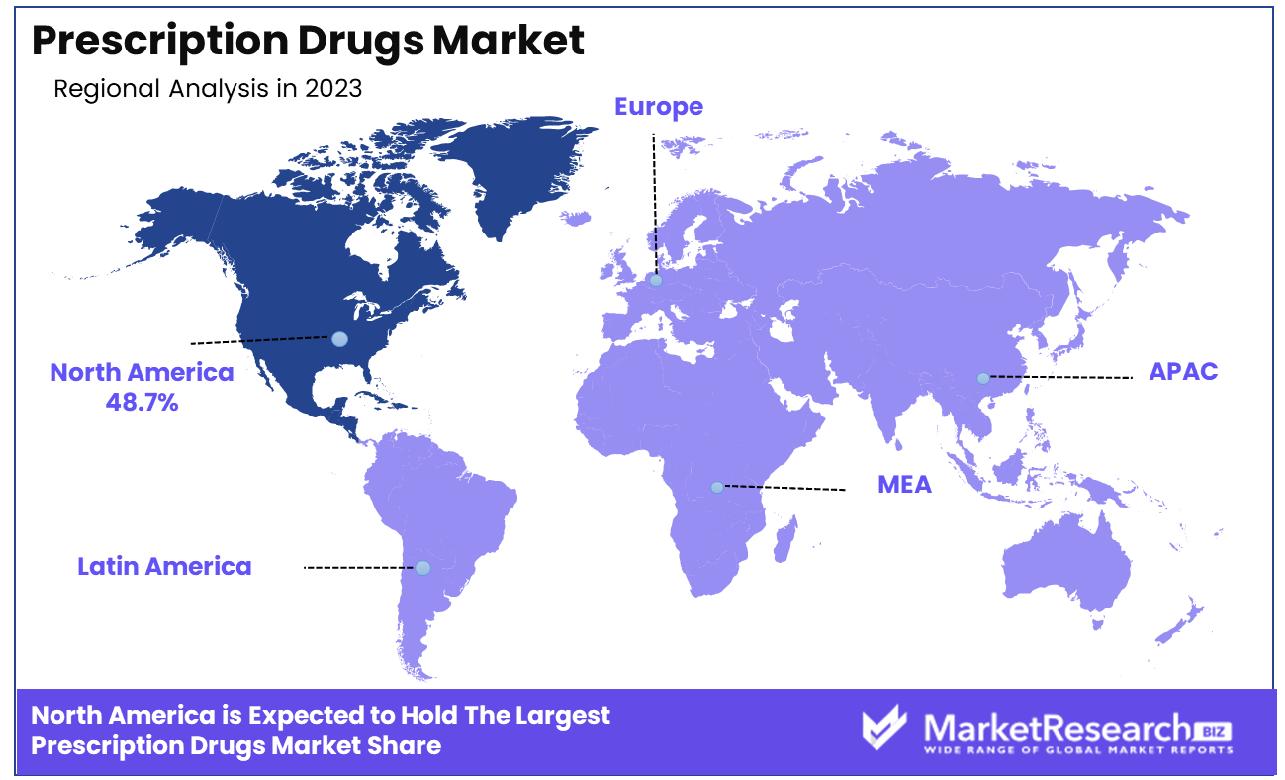
- Regional Dominance: The Prescription Drugs Market in North America accounted for 48.7% of the global market share.
- Growth Opportunity: In 2023, the global prescription drugs market will see growth due to increased government healthcare spending and the rise of direct-to-consumer advertising, creating expanded market opportunities and consumer awareness.
Driving factors
Growing Prevalence of Chronic Diseases and Aging Populations Driving Prescription Drug Market Expansion:
The escalating prevalence of chronic diseases, coupled with aging populations globally, stands as a primary catalyst propelling the growth trajectory of the Prescription Drugs Market. Chronic diseases such as cardiovascular ailments, diabetes, and cancer drugs exhibit a rising incidence rate due to factors like sedentary lifestyles and dietary habits. This trend is particularly pronounced in developed nations experiencing demographic shifts towards older populations. For instance, in the United States, the aging baby boomer population contributes significantly to the increasing demand for prescription medications.
According to recent statistics from reputable health organizations, the prevalence of chronic diseases continues to climb, with projections indicating sustained growth in the coming years. This surge necessitates prolonged therapeutic interventions, thereby augmenting the demand for prescription drugs. Additionally, the aging demographic requires more medical attention, leading to a higher prescription rate for various ailments associated with advanced age.
Role of Generic Drugs in Driving Prescription Drug Market Expansion:
The availability and cost-effectiveness of generic drugs play a pivotal role in fueling the expansion of the Prescription Drugs Market. Generic product drugs, which offer therapeutic equivalence to their branded counterparts at a fraction of the cost, cater to the needs of price-conscious consumers and healthcare systems striving to contain expenditure. As a result, the market share of generic products and drugs has been steadily increasing, driven by factors such as patent expirations and regulatory initiatives promoting their adoption.
Market data indicates a significant uptick in the utilization of generic drugs across regions, with forecasts suggesting sustained growth. This trend aligns with the objectives of healthcare policymakers and payers aiming to enhance the affordability and accessibility of essential medications. Consequently, the availability of generic alternatives exerts downward pressure on overall drug prices, driving market expansion while ensuring cost-effective treatment options for patients.
Amplified Healthcare Expenditure and Improved Access Propel Prescription Drug Market Growth
The escalating healthcare expenditure and initiatives aimed at improving access to prescription drugs are instrumental in fostering the growth of the Prescription Drugs Market. Increasing healthcare budgets allocated by governments and private entities reflect a commitment to addressing the healthcare needs of populations, including the provision of essential medications.
Statistics reveal a steady rise in healthcare spending globally, with a notable portion allocated towards pharmaceuticals. This augmented investment translates into enhanced infrastructure, expanded healthcare coverage, and subsidized drug procurement programs, all of which bolster access to prescription medications. Moreover, advancements in healthcare delivery models, such as telemedicine and community health initiatives, further facilitate the dissemination of prescription drugs to underserved populations.
Restraining Factors
Patent Expirations Pose Challenges to Prescription Drug Market Growth
The expiration of patent protection for top-selling brand-name drugs emerges as a significant restraining factor impacting the growth trajectory of the Prescription Drugs Market. Patents confer exclusivity rights to pharmaceutical manufacturers, enabling them to recoup research and development investments through pricing strategies. However, once patents expire, generic competitors can enter the market, offering lower-cost alternatives and eroding market share.
Statistics indicate a substantial financial impact resulting from patent expirations, with brand-name drugs facing revenue losses due to generic competition. Market data reveals that the entry of generic equivalents following patent expiry typically leads to sharp declines in the prices of affected medications. Consequently, pharmaceutical companies must navigate the challenge of sustaining revenue streams amidst intensified competition and pricing pressures.
Impact of Generic Equivalents on Brand-name Drug Sales
The emergence of generic equivalents for top-selling brand-name drugs poses a dual challenge to the Prescription Drugs Market, exerting downward pressure on price competition while expanding consumer choice. Generic drugs, offering comparable efficacy at reduced costs, appeal to healthcare providers, payers, and patients seeking value-driven alternatives.
Market statistics underscore the growing market share commanded by generic equivalents following patent expirations, with notable implications for brand-name drug sales. The availability of generics stimulates market competition, prompting brand-name manufacturers to implement pricing strategies and promotional efforts to retain market share. Consequently, brand loyalty may diminish as patients and healthcare professionals opt for cost-effective generic alternatives.
Product Type Analysis
Other prescription drugs hold a dominant share of 32% in the product type segment.
In 2023, Other Prescription Drugs held a dominant market position in the By Product Type segment of the Prescription Drugs Market, capturing more than a 32% share. This segment encompasses a diverse array of pharmaceuticals beyond generics and orphan drugs, reflecting the broad spectrum of treatments available within the prescription drug landscape.
The dominance of Other Prescription Drugs can be attributed to several factors. Firstly, the segment comprises patented drugs developed by pharmaceutical companies, often addressing prevalent health conditions where generic alternatives may not exist. Additionally, advancements in medical research and technology have led to the development of innovative therapeutic agents targeting specific disease mechanisms, further bolstering the market presence of Other Prescription Drugs.
Moreover, the increased prevalence of chronic diseases and lifestyle disorders has fueled the demand for specialized medications, driving growth within this segment. Pharmaceutical companies are continually investing in research and development to bring novel therapies to market, catering to the evolving healthcare needs of patients worldwide.
Moving forward, the trajectory of the Other Prescription Drugs segment is poised for continued expansion. As regulatory agencies streamline approval processes and encourage innovation, pharmaceutical companies are incentivized to invest in research initiatives aimed at addressing unmet medical needs. This, coupled with growing healthcare expenditures and expanding access to healthcare services globally, is expected to sustain the growth momentum of Other Prescription Drugs, solidifying its prominent position within the Prescription Drugs Market.
Application Analysis
In application, oncology leads with a dominating share of 35%.
In 2023, Oncology held a dominant market position in the By Application segment of the Prescription Drugs Market, capturing more than a 35% share. This segment encompasses a diverse range of therapeutic applications within the field of oncology, reflecting the significant impact of cancer-related treatments on the pharmaceutical landscape.
The dominance of Oncology within the segment can be attributed to several key factors. Firstly, the increasing prevalence of cancer companies worldwide has propelled the demand for oncology drugs, driving market growth. With advancements in medical research and technology, pharmaceutical companies are developing innovative therapies targeting various types of cancer drugs, offering new hope to patients and clinicians alike.
Furthermore, the oncology segment benefits from substantial investment in research and development, resulting in the drug discovery of novel treatment modalities and targeted therapies. Precision medicine approaches, including immunotherapy and targeted molecular therapies, have revolutionized cancer care, contributing to the market dominance of Oncology within the Prescription Drugs Market.
Moreover, supportive regulatory frameworks and expedited approval processes for oncology drugs have facilitated market access and commercialization, further bolstering the growth of this segment. As healthcare systems prioritize cancer care and allocate resources to improve patient outcomes, the demand for oncology drugs is expected to remain robust, sustaining the market leadership of Oncology within the Prescription Drugs Market.
Distribution Channel Analysis
Hospital pharmacies hold a significant share of 52% in the distribution channel.
In 2023, Hospital Pharmacies held a dominant market position in the By Distribution Channel segment of the Prescription Drugs Market, capturing more than a 52% share. This segment represents the primary channels through which prescription drug companies are distributed to patients, with Hospital Pharmacies playing a pivotal role in providing medications within healthcare facilities.
The significant market share of Hospital Pharmacies can be attributed to several key factors. Firstly, hospitals serve as major hubs for patient care, treating a wide range of acute and chronic conditions that require prescription medications. As integral components of healthcare systems, Hospital Pharmacies have established infrastructure and processes to efficiently dispense medications to inpatients and outpatients, contributing to their market dominance.
Moreover, the complex and specialized nature of many prescription drugs necessitates the involvement of pharmacists and healthcare professionals in the medication dispensing process. Hospital Pharmacies employ skilled pharmacists who play a crucial role in medication management, ensuring the safe and effective use of prescription drugs within clinical settings.
Additionally, hospitals often have access to a diverse formulary of medications, including specialty drugs and those used in critical care settings, further enhancing the market presence of Hospital Pharmacies within the Prescription Drugs Market.
Key Market Segments
By Product Type
- Generics
- Orphan
- Other Prescription Drugs
By Application
- Oncology
- Central Nervous System
- Vaccines
- Immunosuppressants
- Others
By Distribution Channel
- Hospital Pharmacies
- Retail Pharmacies & Drug Stores
- Others
Growth Opportunity
Increased Government Spending on Healthcare
The growth of the global prescription drugs market in 2023 presents a promising outlook, driven in part by increased government spending on healthcare. Across various regions, governments are prioritizing healthcare initiatives, allocating substantial budgets to bolster medical infrastructure and improve access to healthcare services.
This surge in funding not only enhances healthcare accessibility but also amplifies the demand for prescription expensive drugs. As governments strive to address healthcare disparities and meet the evolving needs of their populations, pharmaceutical companies stand to benefit from expanded market opportunities. The influx of resources into healthcare systems amplifies the purchasing market power for prescription medications, fostering a conducive environment for market growth and innovation.
Direct-to-Consumer Advertising
Another key driver propelling the growth of the global prescription drug company market entry is the proliferation of direct-to-consumer advertising. Pharmaceutical companies are increasingly leveraging this marketing strategy to disseminate information about their products directly to consumers. Through various channels such as television, print media, and digital platforms, consumers are exposed to a plethora of prescription drug company advertisements, raising awareness about new treatment options and therapeutic advancements.
This heightened awareness not only empowers consumers to make informed healthcare decisions but also fuels demand for prescription medications. By bridging the gap between manufacturers and end-users, direct-to-consumer advertising catalyzes market expansion, driving sales and fostering competitive dynamics within the pharmaceutical landscape.
Latest Trends
Rise of Direct-to-Consumer Advertising
The global prescription drug market is experiencing a transformative shift in 2023 with the rise of direct-to-consumer advertising. Pharmaceutical companies are increasingly bypassing traditional channels and marketing medications directly to patients.
This trend reflects a strategic approach by drug cost manufacturers to directly engage with consumers, raise awareness about treatment options, and influence patient preferences.
Through various mediums such as television commercials, digital platforms, and print media, consumers are being targeted with information about prescription drugs, including their benefits, potential side effects, and availability.This direct engagement not only empowers patients to play a more active role in their healthcare decisions but also creates new avenues for pharmaceutical companies to expand their market reach and drive sales. However, it also raises concerns about the ethical implications of directly marketing potent medications to consumers, necessitating careful consideration of regulatory guidelines and industry standards.
Growing Regulatory Scrutiny
Another notable trend shaping the global prescription drugs market in 2023 is the intensifying regulatory scrutiny. Regulatory bodies worldwide are adopting a more vigilant approach to monitoring drug pricing and safety, aiming to ensure transparency, affordability, and patient welfare.
This heightened oversight underscores the importance of compliance with regulatory requirements and adherence to ethical standards within the pharmaceutical industry. Drug manufacturers are facing increased pressure to demonstrate the efficacy, safety, and value of their products while navigating evolving regulatory landscapes.
Moreover, regulatory interventions such as pricing controls and quality assurance measures are influencing market entry dynamics and shaping industry practices. As stakeholders navigate these regulatory challenges, collaboration between industry players and regulatory authorities becomes paramount to fostering a sustainable and compliant pharmaceutical ecosystem.
Regional Analysis
In 2023, North America accounted for 48.7% of the global prescription drugs market, indicating significant regional dominance.
The global prescription drugs market exhibits regional variations, with distinct trends and dynamics shaping each geographical segment. North America emerges as the dominant region, commanding a significant market share of 48.7%, driven by factors such as robust healthcare infrastructure, high healthcare expenditure, and a large patient population.
In North America, the pharmaceutical industry benefits from extensive research and development activities, stringent regulatory frameworks, and widespread adoption of innovative therapies. Additionally, the region's aging population and rising prevalence of chronic diseases contribute to sustained demand for prescription medications.
Europe represents another key market for prescription drugs, characterized by advanced healthcare systems, favorable reimbursement policies, and increasing investments in biopharmaceutical research. The region's emphasis on patient-centric care and preventive healthcare measures fosters the demand for prescription medications, driving market growth. However, regulatory scrutiny and pricing pressures pose challenges to pharmaceutical companies operating in Europe.
In the Asia Pacific region, rapid urbanization, expanding middle-class population and improving healthcare infrastructure fuel the demand for prescription drugs. Countries like China, India, and Japan are witnessing significant market expansion, driven by rising healthcare spending and increasing access to medical services. Moreover, the emergence of generic drug manufacturers and the adoption of telemedicine platforms contribute to market growth in the region.
The Middle East & Africa and Latin America regions exhibit promising growth potential in the prescription drugs market, propelled by improving healthcare access, government initiatives to combat diseases, and a growing focus on pharmaceutical innovation. However, challenges such as inadequate healthcare infrastructure, economic instability, and regulatory complexities constrain market expansion in these regions.
Key Regions and Countries
North America
- The US
- Canada
- Rest of North America
Europe
- Germany
- France
- The UK
- Spain
- Netherlands
- Russia
- Italy
- Rest of Europe
Asia-Pacific
- China
- Japan
- Singapore
- Thailand
- South Korea
- Vietnam
- India
- New Zealand
- Rest of Asia Pacific
Latin America
- Mexico
- Brazil
- Rest of Latin America
Middle East & Africa
- Saudi Arabia
- South Africa
- UAE
- Rest of Middle East & Africa
Key Players Analysis
In 2023, the global Prescription Drugs Market was significantly influenced by key players such as Novartis AG, Pfizer Inc., F. Hoffmann-La Roche Ltd, Sanofi, Johnson & Johnson Services Inc., Merck & Co. Inc., AbbVie Inc., GlaxoSmithKline plc., AstraZeneca, and CELGENE CORPORATION (BRISTOL-MYERS SQUIBB COMPANY). These industry giants played pivotal roles in shaping the landscape of pharmaceuticals through their innovative products, strategic expansions, and robust research and development endeavors.
Novartis AG, a Swiss multinational pharmaceutical company, maintained its prominence through a diverse portfolio and a strong focus on cutting-edge therapies. Pfizer Inc., a U.S.-based pharmaceutical corporation, continued to lead with its vast array of prescription drugs spanning various therapeutic areas.
F. Hoffmann-La Roche Ltd, another Swiss powerhouse, stood out for its oncology and biotechnology innovations, contributing significantly to cancer treatment advancements. Sanofi, a French multinational pharmaceutical company, excelled in diabetes management and vaccines, bolstering its market presence.
Johnson & Johnson Services Inc. from the U.S. showcased resilience and innovation across its pharmaceutical divisions, reinforcing its position as a key player. Merck & Co. Inc. demonstrated leadership in vaccines and infectious diseases, addressing critical global health concerns.
AbbVie Inc., with its focus on immunology and oncology, continued to make strides in specialty pharmaceuticals. GlaxoSmithKline plc. remained at the forefront of respiratory and HIV treatments, leveraging its expertise in pharmaceuticals and vaccines.
AstraZeneca, a British-Swedish multinational, continued to expand its portfolio, particularly in cardiovascular and respiratory therapies. CELGENE CORPORATION (BRISTOL-MYERS SQUIBB COMPANY) contributed significantly to oncology treatments and immunotherapy, enhancing patient outcomes worldwide.
Market Key Players
- Novartis AG (Switzerland)
- Pfizer, Inc. (U.S.)
- F. Hoffmann-La Roche Ltd (Switzerland)
- Sanofi (France)
- Johnson & Johnson Services, Inc. (U.S.)
- Merck & Co., Inc. (U.S.)
- AbbVie, Inc. (U.S.)
- GlaxoSmithKline plc. (U.K.)
- AstraZeneca (U.K.)
- CELGENE CORPORATION (BRISTOL-MYERS SQUIBB COMPANY) (U.S)
Recent Development
- In April 2024, Associate Health Minister David Seymour announces a $1.7 billion boost to Pharmac's budget, addressing fiscal challenges and expanding access to medications in New Zealand.
- In April 2024, the Federal budget allocates $1.5B for pharmacare, covering diabetes and contraception. Ottawa aims for universal coverage, contingent on provincial cooperation. Impact on the healthcare system and costs scrutinized.
- In April 2024, Healthcare consumers like Steve Wexler advocate for smart shopping to save on prescription costs. Strategies include choosing the best health plan, comparing pharmacy prices, and utilizing discount card programs
Report Scope
Report Features Description Market Value (2023) USD 1,177.4 Billion Forecast Revenue (2033) USD 2,561.8 Billion CAGR (2024-2032) 8.3% Base Year for Estimation 2023 Historic Period 2016-2023 Forecast Period 2024-2033 Report Coverage Revenue Forecast, Market Dynamics, COVID-19 Impact, Competitive Landscape, Recent Developments Segments Covered By Product Type(Generics, Orphan, Other Prescription Drugs), By Application(Oncology, Central Nervous System, Vaccines, Immunosuppressants, Others), By Distribution Channel(Hospital Pharmacies, Retail Pharmacies & Drug Stores, Others) Regional Analysis North America - The US, Canada, Rest of North America, Europe - Germany, France, The UK, Spain, Italy, Russia, Netherlands, Rest of Europe, Asia-Pacific - China, Japan, South Korea, India, New Zealand, Singapore, Thailand, Vietnam, Rest of Asia Pacific, Latin America - Brazil, Mexico, Rest of Latin America, Middle East & Africa - South Africa, Saudi Arabia, UAE, Rest of Middle East & Africa Competitive Landscape Novartis AG (Switzerland), Pfizer, Inc. (U.S.), F. Hoffmann-La Roche Ltd (Switzerland), Sanofi (France), Johnson & Johnson Services, Inc. (U.S.), Merck & Co., Inc. (U.S.), AbbVie, Inc. (U.S.), GlaxoSmithKline plc. (U.K.), AstraZeneca (U.K.), CELGENE CORPORATION (BRISTOL-MYERS SQUIBB COMPANY) (U.S) Customization Scope Customization for segments, region/country-level will be provided. Moreover, additional customization can be done based on the requirements. Purchase Options We have three licenses to opt for Single User License, Multi-User License (Up to 5 Users), Corporate Use License (Unlimited User and Printable PDF) -
-
- Novartis AG (Switzerland)
- Pfizer, Inc. (U.S.)
- F. Hoffmann-La Roche Ltd (Switzerland)
- Sanofi (France)
- Johnson & Johnson Services, Inc. (U.S.)
- Merck & Co., Inc. (U.S.)
- AbbVie, Inc. (U.S.)
- GlaxoSmithKline plc. (U.K.)
- AstraZeneca (U.K.)
- CELGENE CORPORATION (BRISTOL-MYERS SQUIBB COMPANY) (U.S)
Our Clients


View Our Licence Options
