
Animation Market By Type(3D Animation, Stop Motion, Flipbook Animation), By Application(Media & Entertainment, Automotive, Others), By Revenue Stream(Over-the-Top (OTT), Advertising, Sale of Tickets, Others), By Industry(Media and Entertainment, Education, Retail, Others), By Region And Companies - Industry Segment Outlook, Market Assessment, Competition Scenario, Trends, And Forecast 2023-2032
-
15151
-
Nov 2023
-
173
-


-
This report was compiled by Vishwa Gaul Vishwa is an experienced market research and consulting professional with over 8 years of expertise in the ICT industry, contributing to over 700 reports across telecommunications, software, hardware, and digital solutions. Correspondence Team Lead- ICT Linkedin | Detailed Market research Methodology Our methodology involves a mix of primary research, including interviews with leading mental health experts, and secondary research from reputable medical journals and databases. View Detailed Methodology Page
-
Quick Navigation
- Animation Market Size, Share, Trends Analysis
- Animation Market Dynamics
- Animation Market Segmentation Analysis
- Animation Industry Segments
- Animation Market Growth Opportunity
- Animation Market Regional Analysis
- Animation Industry By Region
- Animation Market Share Analysis
- Animation Industry Key Players
- Animation Market Recent Development
- Report Scope
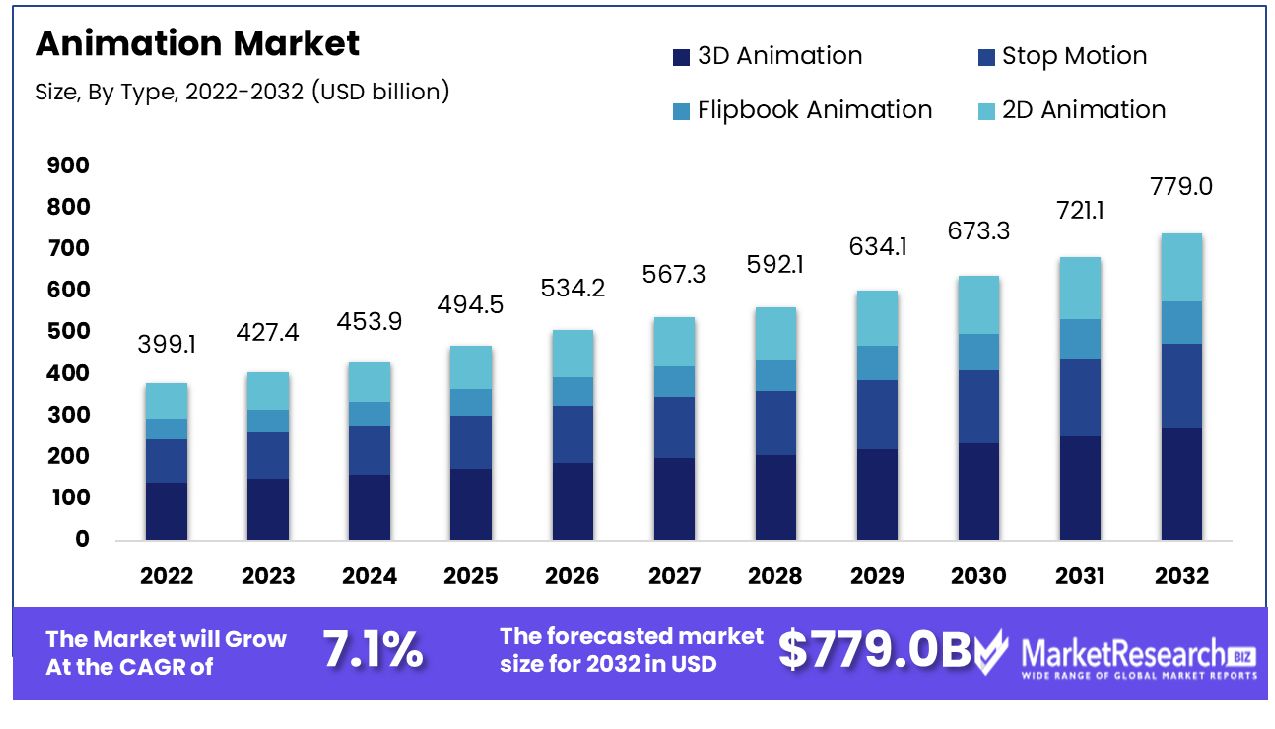
The global animation market was valued at USD 399.1 Billion in 2022. It is expected to reach USD 779.0 Billion by 2032, with a CAGR of 7.1% during the forecast period from 2023 to 2032.
Rising demand in media and film industries and advancement in technologies are two primary forces driving growth in the global market. The surge in demand for OTT is due to the internet penetration globally and new technological advancement which is used to create high-precision IoT networks are other factors for market growth.
Animation has an immense demand in the video gaming industry and is one of the essential components of contemporary game development. Animation is like giving life to the virtual characters and environments that have become important in developing immersive and realistic games.
A key animation industry opportunity lies with the Gen Z demographic worldwide based on data showing 74.2% of those ages 18-24 play video games regularly across 5 major countries. Additionally, video games rank as the top entertainment activity for Gen Z spanning the US, UK, Germany, Brazil, and Japan. This signals strong appeal for interactive animated content.
Given Gen Z's impact on future entertainment technology and content, their preference for games and digital animation creates rising demand for animated entertainment catered to young adults. From video game design to animated series, there is growing global market potential to engage Gen Z consumers through various animation mediums focused on their interests. Capturing Gen Z attention represents a major animation growth area.
Animation can be used to improve any game quality from simple and traditional 2D animation to modern and complex 3D animation. 2D animations are the most basic type of motion film which use bitmap graphics and are not as sophisticated. 3D stop motion is creating realistic 3D characters and objects that can work together within any virtual environment. 3D animated films require much more work than 2D animations and that is the reason why CGI companies are choosing 3D stop motion for gaming.
The media and film industry, playing a vital role, heavily utilizes CGI on digital platforms for promotional purposes, engaging audiences with high-quality content and immersive content. Companies like Walt Disney led in releasing animated films, illustrating the power of animated films in creating limitless characters and worlds. These films allow storytellers to explore narratives impossible with live-action alone, often incorporating Artificial Intelligence in Animation to enhance storytelling.
Animated films have become one of the favorite and popular films among all age groups. Filmmakers use CGI to discover complex themes and ideas that may be difficult to narrate in live-action but easy in animated films. For example, "Grave of the Fireflies" is a Japanese animated war film that tells the story of the impact of war on civilians.
The motion picture has allowed the filmmakers to develop a creative, stylish yet realistic story of the horrors of the war that left a strong impact upon the audience. Cartoon has provided a platform for creative themes and ideas through which narrating a story has become easy. Advanced technologies will continue to expand which will contribute to the market expansion during the forecast period.
Animation Market Dynamics
Media and Entertainment Industry Expansion Fuels Animation Market Growth
Media and entertainment's rapid expansion is a primary driver of growth in the global industry. As this sector flourishes, there is an ever-increasing demand for various animated movies, TV shows, and web series content - not limited to traditional markets but globally spread across various cultures and languages. The resulting surge in demand for animation services stimulates investments in animation studios and technological advancements, leading to a dynamic and competitive market environment. The long-term prediction is a sustained growth trajectory for the market, bolstered by a continuously evolving media landscape and the increasing global appetite for diverse animated content.
Growing Demand in Evolving Economies Boosts Animation Market
The burgeoning demand for animation in evolving economies significantly contributes to the growth of the global motion picture market. As these economies grow, there's an increase in disposable income and digital penetration, leading to higher consumption of animated content. This trend is particularly pronounced in countries with a young demographic profile and enjoys a strong appeal. This growing demand is encouraging both local content creation and international collaborations, diversifying the market and fostering innovation. The anticipated long-term impact includes the emergence of new animation hubs in these economies, further enriching the global motion picture landscape.
Technological Advancements Propel Animation Market Forward
Technological advancements, particularly in cloud computing and mobile solutions, are pivotal in driving the global animation market's expansion. These technologies enable more efficient and flexible cartoon production processes, making high-quality animation more accessible and cost-effective. Cloud computing allows for enhanced collaboration among global teams, breaking down geographical barriers in animation production. Meanwhile, mobile solutions are expanding the distribution channels for animated content, reaching wider audiences through smartphones and tablets. These technological strides are not only enhancing current production capabilities but are also shaping the future of motion pictures, with an emphasis on accessibility, collaboration, and innovation.
Limited Access to Advanced Technology Restrains Global Animation Market Growth
The global animation market's growth is significantly hindered by limited access to advanced technology in certain regions. The motion picture requires sophisticated software and hardware that may be prohibitively costly or hard to source in certain regions around the world, creating a technological divide; only those in regions with robust infrastructures can fully participate and contribute to the global animation industry. As a result, the market's growth potential is curtailed, and the diversity of creative inputs is limited, impacting the overall richness and variety of global CGI (Computer-Generated Imagery)content.
High Production Costs Restrains Global Animation Market Growth
High production costs are a major barrier to the growth of the global animation market. Creating stop motion, particularly of high quality, is a resource-intensive process involving skilled artists, advanced software, and sometimes costly hardware. These factors contribute to significant expenditures, making it challenging for smaller studios or independent animators to enter the market or sustain operations. Additionally, the increasing expectation for sophisticated, high-quality stop motion further drives up production costs. This financial barrier not only limits market entry but also restricts innovation and experimentation within the industry, as players may be inclined to stick with proven, less risky formats and stories.
Animation Market Segmentation Analysis
Type Analysis
3D animation represents the majority share of the animation market, due to its realism, depth, and dynamic visual appeal. 3D animation's widespread adoption across movies, television shows, and video games attests to its dominance. Technological innovations in rendering, motion capture, and 3D modeling have improved its quality and efficiency - leading to greater application across industries and accelerating this segment's expansion. 3D's rapid rise is further propelled by an ever-increasing demand for high-quality visual content across entertainment as well as other industries.
Stop motion and flipbook animation, while niche, are revered for their artistic and traditional values. 2D animation, despite being overshadowed by 3D animation, remains relevant, particularly in contexts where simplicity and cost-effectiveness are paramount. These segments contribute to the diversity of the market and cater to specific audience segments and artistic preferences.
Application Analysis
The media and entertainment sector is the primary application area for animated film, driven by the burgeoning demand for animated content in films, TV shows, and online platforms. The proliferation of digital platforms and the global reach of animated content have significantly expanded this segment. The versatility of stop motion in storytelling and its cross-cultural appeal solidify its dominance in this sector.
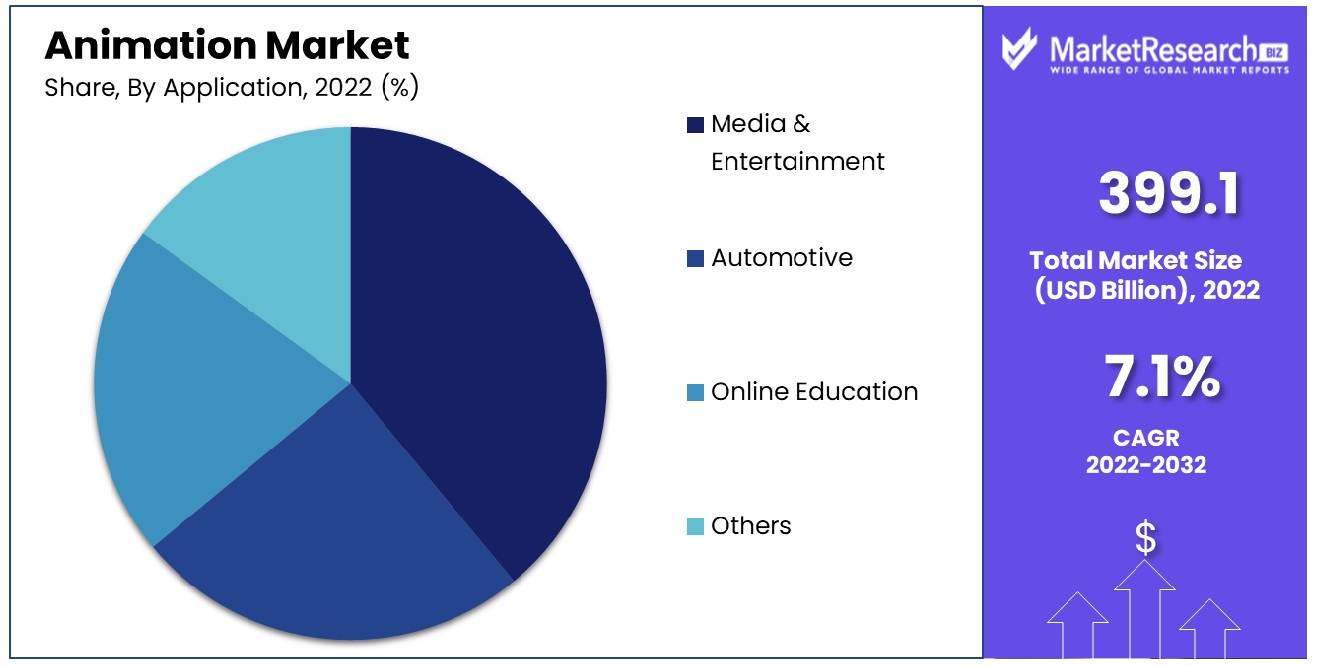
In the automotive sector used for design visualization and marketing. Online education utilizes animated films to create engaging and educational content, a trend that has accelerated with the growth of e-learning. The 'Others' category, encompassing sectors like healthcare and architecture, uses animated film for simulations and visualizations. While smaller in comparison to media and entertainment, these segments are crucial for their specialized applications and contribute to the industry's expansion.
Revenue Stream Analysis
OTT platforms represent the largest revenue stream for the animated film market. Streaming services such as Netflix, Amazon Prime, and Disney+ have led to an explosion in demand for animated content. Their global reach and investment in original productions are major contributors to its rapid expansion.
Advertising uses animated films to create compelling and memorable commercials, contributing significantly to the market. The sale of tickets for animated movies, particularly in cinemas, remains a substantial revenue stream, although it faces challenges from the increasing dominance of OTT platforms. The 'Others' category includes merchandising, DVD sales, and syndication rights, which, while declining, still play a role in the overall revenue landscape.
Industry Analysis
The media and entertainment industry is the cornerstone of the animated film market. This segment leverages animation in various forms, from blockbuster movies to animated series and web content, driving substantial growth in the industry.
In education, stop motion is increasingly used for creating interactive and engaging learning materials. The retail industry utilizes animated films for product demonstrations and advertising. These industries, while not as dominant as media and entertainment, are pivotal in diversifying the application of animated film and contributing to its overall growth.
Animation Industry Segments
By Type
- 3D Animation
- Stop Motion
- Flipbook Animation
- 2D Animation
By Application
- Media & Entertainment
- Automotive
- Online Education
- Others
By Revenue Stream
- Over-the-Top (OTT)
- Advertising
- Sale of Tickets
- Others
By Industry
- Media and Entertainment
- Education
- Retail
- Healthcare
- Manufacturing
- Others
Animation Market Growth Opportunity
Rising Viewership of Media Content Offers Growth Opportunities in the Global Animation Market
An increasing viewership of TV shows, movies, and other forms of media content is one of the key contributors to global animation market growth. Recent years have witnessed an apparent increase in media consumption across various platforms including streaming services and traditional television, which may be attributable to increasing content diversification as well as global accessibility of media sources. Animated content, known for its universal appeal across age groups, benefits immensely from this trend. Recent data indicates a steady rise in the popularity of animated shows and movies, signaling robust opportunities for expansion in production, distribution, and technological innovation within the animation industry.
Increasing Adoption of Animation in Education Fuels Market Growth
The growing use of animation in educational settings opens up significant opportunities for the global market. Educational institutions and content creators are increasingly turning a tools to enhance learning experiences. Animated content can simplify complex concepts, engage students more effectively, and cater to various learning styles. The recent shift towards digital and remote learning environments has further accelerated this trend. The demand for high-quality, educational animated content is rising, not just in traditional academic settings but also in online education platforms and corporate training programs, suggesting a broadening market scope and potential for innovation in educational stop motion.
Animation Market Regional Analysis
North America Dominates with Majority Market Share
North America, holding the largest market share by region, significantly influences the global animation market. The region's pioneering role in technology and content creation, combined with a strong culture of storytelling, drives its market dominance. The U.S., in particular, is home to globally recognized studios like Disney and Pixar, whose innovative approaches and wide-reaching franchises have set industry standards.

The market dynamics in North America, characterized by market revenue estimates indicating substantial investment, are shaped by high investment in technology, including CGI and 3D animation, and a large, diverse audience base. The integration of animation into various media platforms, from television to streaming services, further expands its reach. Additionally, collaborations between North American studios and international partners have broadened the market's scope and influence.
Europe: A Hub of Creative Talent and Diversity
Europe's animation market is distinguished by its rich tradition of storytelling and a diverse range of styles. European animation studios are known for their distinctive artistic approaches that often combine traditional techniques with cutting-edge technologies. This diversity, coupled with collaborations across countries, fosters a dynamic and innovative market environment.
Asia Pacific: Rapid Growth and Expanding Influence
The animation market in Asia Pacific is growing rapidly, driven by increasing demand for animated content and advancements in technology. Countries like Japan, South Korea, and India are significant contributors, each with their distinctive styles and burgeoning industries. The region's large, young population, coupled with growing digital penetration, creates a vast audience for animated content. This demographic and technological shift positions Asia Pacific as an emerging powerhouse in the global landscape.
Animation Industry By Region
North America
- The US
- Canada
- Rest of North America
Europe
- Germany
- France
- The UK
- Spain
- Italy
- Russia
- Netherlands
- Rest of Europe
Asia-Pacific
- China
- Japan
- South Korea
- India
- New Zealand
- Singapore
- Thailand
- Vietnam
- Rest of Asia Pacific
Latin America
- Brazil
- Mexico
- Rest of Latin America
Middle East & Africa
- South Africa
- Saudi Arabia
- UAE
- Rest of Middle East & Africa
In the global animation market, the prominent players listed collectively contribute significantly in terms of diversity, innovation, and strategic positioning. Adobe Systems Incorporated and Autodesk Inc., with their powerful software suites, are pivotal in shaping the technological backbone of the industry. Their tools have become synonymous with professional creation, highlighting the market's dependence on cutting-edge software solutions.
Corel and EIAS3D, though smaller in scale, contribute significantly through niche offerings and specialized tools, catering to specific needs within the process. MAXON Computer and SideFX, known for their robust 3D animation and visual effects software, underscore the industry's constant push toward realism and high-quality graphics.
Smith Micro and Newtec Inc., with their focus on user-friendly and versatile solutions, reflect the market's expanding base of amateur and semi-professional animators. Videocaddy and Animation Sharks, operating primarily in the realm of service provision, highlight the growing demand for outsourced animation services, indicative of the market's global interconnectedness.
Triggerfish Studios and GRAFTON, though regionally focused, have made significant international impacts, showcasing the power of cultural diversity and storytelling. Finally, industry giants Pixar, Walt Disney Animation Studios, and DreamWorks Animation demonstrate the immense influence of content creators in shaping market trends, consumer preferences, and the overall direction of the animation industry.
Together, these key companies not only drive technological advancements and creative excellence in the global market but also highlight the varied strategies - from software development to content creation and service provision - essential in navigating this multifaceted and rapidly evolving industry.
Animation Industry Key Players
- Adobe Systems Inc.
- Autodesk, Inc.
- Corel
- EIAS3D
- MAXON Computer
- SideFX
- Smith Micro
- Newtec Inc.
- Videocaddy
- Animation Sharks
- Triggerfish Studios
- GRAFTON
- Pixologic Inc.
- Walt Disney Animation Studios
- DreamWorks Animation
- Zco Corporation
- Trimble Inc.
- Animaker Inc.
- Bondware Inc.
- Exocortex Technologies
- Sony Corporation
- Image Metrics, Inc.
- Newtek Inc.
- NVIDIA Corporation
Animation Market Recent Development
- In October 2022, The Walt Disney Company’s ILM’s Mumbai facility was to operate a complete VFX and animation services pipeline, working on content for the local market to access the Southeast Asian talent pool. The studio is expected to work on VFX and animation projects of varying sizes and scales for TV, film, and streaming, as well as in-person attractions.
- In July 2022, Cinesite announced that it acquired a majority stake in animation & mocap studio Squeeze, located in Quebec City and Montreal. Squeeze is an animation studio located in Quebec City and Montreal with an international reputation. This acquisition was expected to allow Cinesite to increase further its content and service offerings for global markets while bringing mocap and unreal capabilities into the group to service video game and film productions.
- In January 2020, AARDMAN ANIMATIONS LTD, in collaboration with Greenpeace, unveiled a compelling animated film focused on raising awareness about the critical challenges facing the world's oceans. This impactful release not only contributed to increased revenue but also strengthened the company's product portfolio, positioning it for market expansion.
Report Scope
Report Features Description Market Value (2022) USD 399.1 Billion Forecast Revenue (2032) USD 779.0 Billion CAGR (2023-2032) 7.1% Base Year for Estimation 2022 Historic Period 2016-2022 Forecast Period 2023-2032 Report Coverage Revenue Forecast, Market Dynamics, COVID-19 Impact, Competitive Landscape, Recent Developments Segments Covered By Type(3D Animation, Stop Motion, Flipbook Animation, 2D Animation), By Application(Media & Entertainment, Automotive, Online Education, Others), By Revenue Stream(Over-the-Top (OTT), Advertising, Sale of Tickets, Others), By Industry(Media and Entertainment, Education, Retail, Healthcare, Manufacturing, Others) Regional Analysis North America - The US, Canada, Rest of North America, Europe - Germany, France, The UK, Spain, Italy, Russia, Netherlands, Rest of Europe, Asia-Pacific - China, Japan, South Korea, India, New Zealand, Singapore, Thailand, Vietnam, Rest of Asia Pacific, Latin America - Brazil, Mexico, Rest of Latin America, Middle East & Africa - South Africa, Saudi Arabia, UAE, Rest of Middle East & Africa Competitive Landscape Adobe Systems Inc., Autodesk, Inc., Corel, EIAS3D, MAXON Computer, SideFX, Smith Micro, Newtec Inc., Videocaddy, Animation Sharks, Triggerfish Studios, GRAFTON, Pixologic Inc., Walt Disney Animation Studios, DreamWorks Animation, Zco Corporation, Trimble Inc., Animaker Inc., Bondware Inc., Exocortex Technologies, Sony Corporation, Image Metrics, Inc., Newtek Inc., NVIDIA Corporation Customization Scope Customization for segments, region/country-level will be provided. Moreover, additional customization can be done based on the requirements. Purchase Options We have three licenses to opt for Single User License, Multi-User License (Up to 5 Users), Corporate Use License (Unlimited User and Printable PDF) -
- 1. Executive Summary
- 1.1. Definition
- 1.2. Taxonomy
- 1.3. Research Scope
- 1.4. Key Analysis
- 1.5. Key Findings by Major Segments
- 1.6. Top strategies by Major Players
- 2. Global Animation Market Overview
- 2.1. Animation Market Dynamics
- 2.1.1. Drivers
- 2.1.2. Opportunities
- 2.1.3. Restraints
- 2.1.4. Challenges
- 2.2. Macro-economic Factors
- 2.3. Regulatory Framework
- 2.4. Market Investment Feasibility Index
- 2.5. PEST Analysis
- 2.6. PORTER’S Five Force Analysis
- 2.7. Drivers & Restraints Impact Analysis
- 2.8. Industry Chain Analysis
- 2.9. Cost Structure Analysis
- 2.10. Marketing Strategy
- 2.11. Russia-Ukraine War Impact Analysis
- 2.12. Opportunity Map Analysis
- 2.13. Market Competition Scenario Analysis
- 2.14. Product Life Cycle Analysis
- 2.15. Opportunity Orbits
- 2.16. Manufacturer Intensity Map
- 2.17. Major Companies sales by Value & Volume
- 2.1. Animation Market Dynamics
- 3. Global Animation Market Analysis, Opportunity and Forecast, 2016-2032
- 3.1. Global Animation Market Analysis, 2016-2021
- 3.2. Global Animation Market Opportunity and Forecast, 2023-2032
- 3.3. Global Animation Market Analysis, Opportunity and Forecast, By By Type, 2016-2032
- 3.3.1. Global Animation Market Analysis by By Type: Introduction
- 3.3.2. Market Size Absolute $ Opportunity Analysis and Forecast, By By Type, 2016-2032
- 3.3.3. 3D Animation
- 3.3.4. Stop Motion
- 3.3.5. Flipbook Animation
- 3.3.6. 2D Animation
- 3.4. Global Animation Market Analysis, Opportunity and Forecast, By By Application, 2016-2032
- 3.4.1. Global Animation Market Analysis by By Application: Introduction
- 3.4.2. Market Size Absolute $ Opportunity Analysis and Forecast, By By Application, 2016-2032
- 3.4.3. Media & Entertainment
- 3.4.4. Automotive
- 3.4.5. Online Education
- 3.4.6. Others
- 3.5. Global Animation Market Analysis, Opportunity and Forecast, By By Revenue Stream, 2016-2032
- 3.5.1. Global Animation Market Analysis by By Revenue Stream: Introduction
- 3.5.2. Market Size Absolute $ Opportunity Analysis and Forecast, By By Revenue Stream, 2016-2032
- 3.5.3. Over-the-Top (OTT)
- 3.5.4. Advertising
- 3.5.5. Sale of Tickets
- 3.5.6. Others
- 3.6. Global Animation Market Analysis, Opportunity and Forecast, By By Industry, 2016-2032
- 3.6.1. Global Animation Market Analysis by By Industry: Introduction
- 3.6.2. Market Size Absolute $ Opportunity Analysis and Forecast, By By Industry, 2016-2032
- 3.6.3. Media and Entertainment
- 3.6.4. Education
- 3.6.5. Retail
- 3.6.6. Healthcare
- 3.6.7. Manufacturing
- 3.6.8. Others
- 4. North America Animation Market Analysis, Opportunity and Forecast, 2016-2032
- 4.1. North America Animation Market Analysis, 2016-2021
- 4.2. North America Animation Market Opportunity and Forecast, 2023-2032
- 4.3. North America Animation Market Analysis, Opportunity and Forecast, By By Type, 2016-2032
- 4.3.1. North America Animation Market Analysis by By Type: Introduction
- 4.3.2. Market Size Absolute $ Opportunity Analysis and Forecast, By By Type, 2016-2032
- 4.3.3. 3D Animation
- 4.3.4. Stop Motion
- 4.3.5. Flipbook Animation
- 4.3.6. 2D Animation
- 4.4. North America Animation Market Analysis, Opportunity and Forecast, By By Application, 2016-2032
- 4.4.1. North America Animation Market Analysis by By Application: Introduction
- 4.4.2. Market Size Absolute $ Opportunity Analysis and Forecast, By By Application, 2016-2032
- 4.4.3. Media & Entertainment
- 4.4.4. Automotive
- 4.4.5. Online Education
- 4.4.6. Others
- 4.5. North America Animation Market Analysis, Opportunity and Forecast, By By Revenue Stream, 2016-2032
- 4.5.1. North America Animation Market Analysis by By Revenue Stream: Introduction
- 4.5.2. Market Size Absolute $ Opportunity Analysis and Forecast, By By Revenue Stream, 2016-2032
- 4.5.3. Over-the-Top (OTT)
- 4.5.4. Advertising
- 4.5.5. Sale of Tickets
- 4.5.6. Others
- 4.6. North America Animation Market Analysis, Opportunity and Forecast, By By Industry, 2016-2032
- 4.6.1. North America Animation Market Analysis by By Industry: Introduction
- 4.6.2. Market Size Absolute $ Opportunity Analysis and Forecast, By By Industry, 2016-2032
- 4.6.3. Media and Entertainment
- 4.6.4. Education
- 4.6.5. Retail
- 4.6.6. Healthcare
- 4.6.7. Manufacturing
- 4.6.8. Others
- 4.7. North America Animation Market Analysis, Opportunity and Forecast, By Country , 2016-2032
- 4.7.1. North America Animation Market Analysis by Country : Introduction
- 4.7.2. Market Size Absolute $ Opportunity Analysis and Forecast, Country , 2016-2032
- 4.7.2.1. The US
- 4.7.2.2. Canada
- 4.7.2.3. Mexico
- 5. Western Europe Animation Market Analysis, Opportunity and Forecast, 2016-2032
- 5.1. Western Europe Animation Market Analysis, 2016-2021
- 5.2. Western Europe Animation Market Opportunity and Forecast, 2023-2032
- 5.3. Western Europe Animation Market Analysis, Opportunity and Forecast, By By Type, 2016-2032
- 5.3.1. Western Europe Animation Market Analysis by By Type: Introduction
- 5.3.2. Market Size Absolute $ Opportunity Analysis and Forecast, By By Type, 2016-2032
- 5.3.3. 3D Animation
- 5.3.4. Stop Motion
- 5.3.5. Flipbook Animation
- 5.3.6. 2D Animation
- 5.4. Western Europe Animation Market Analysis, Opportunity and Forecast, By By Application, 2016-2032
- 5.4.1. Western Europe Animation Market Analysis by By Application: Introduction
- 5.4.2. Market Size Absolute $ Opportunity Analysis and Forecast, By By Application, 2016-2032
- 5.4.3. Media & Entertainment
- 5.4.4. Automotive
- 5.4.5. Online Education
- 5.4.6. Others
- 5.5. Western Europe Animation Market Analysis, Opportunity and Forecast, By By Revenue Stream, 2016-2032
- 5.5.1. Western Europe Animation Market Analysis by By Revenue Stream: Introduction
- 5.5.2. Market Size Absolute $ Opportunity Analysis and Forecast, By By Revenue Stream, 2016-2032
- 5.5.3. Over-the-Top (OTT)
- 5.5.4. Advertising
- 5.5.5. Sale of Tickets
- 5.5.6. Others
- 5.6. Western Europe Animation Market Analysis, Opportunity and Forecast, By By Industry, 2016-2032
- 5.6.1. Western Europe Animation Market Analysis by By Industry: Introduction
- 5.6.2. Market Size Absolute $ Opportunity Analysis and Forecast, By By Industry, 2016-2032
- 5.6.3. Media and Entertainment
- 5.6.4. Education
- 5.6.5. Retail
- 5.6.6. Healthcare
- 5.6.7. Manufacturing
- 5.6.8. Others
- 5.7. Western Europe Animation Market Analysis, Opportunity and Forecast, By Country , 2016-2032
- 5.7.1. Western Europe Animation Market Analysis by Country : Introduction
- 5.7.2. Market Size Absolute $ Opportunity Analysis and Forecast, Country , 2016-2032
- 5.7.2.1. Germany
- 5.7.2.2. France
- 5.7.2.3. The UK
- 5.7.2.4. Spain
- 5.7.2.5. Italy
- 5.7.2.6. Portugal
- 5.7.2.7. Ireland
- 5.7.2.8. Austria
- 5.7.2.9. Switzerland
- 5.7.2.10. Benelux
- 5.7.2.11. Nordic
- 5.7.2.12. Rest of Western Europe
- 6. Eastern Europe Animation Market Analysis, Opportunity and Forecast, 2016-2032
- 6.1. Eastern Europe Animation Market Analysis, 2016-2021
- 6.2. Eastern Europe Animation Market Opportunity and Forecast, 2023-2032
- 6.3. Eastern Europe Animation Market Analysis, Opportunity and Forecast, By By Type, 2016-2032
- 6.3.1. Eastern Europe Animation Market Analysis by By Type: Introduction
- 6.3.2. Market Size Absolute $ Opportunity Analysis and Forecast, By By Type, 2016-2032
- 6.3.3. 3D Animation
- 6.3.4. Stop Motion
- 6.3.5. Flipbook Animation
- 6.3.6. 2D Animation
- 6.4. Eastern Europe Animation Market Analysis, Opportunity and Forecast, By By Application, 2016-2032
- 6.4.1. Eastern Europe Animation Market Analysis by By Application: Introduction
- 6.4.2. Market Size Absolute $ Opportunity Analysis and Forecast, By By Application, 2016-2032
- 6.4.3. Media & Entertainment
- 6.4.4. Automotive
- 6.4.5. Online Education
- 6.4.6. Others
- 6.5. Eastern Europe Animation Market Analysis, Opportunity and Forecast, By By Revenue Stream, 2016-2032
- 6.5.1. Eastern Europe Animation Market Analysis by By Revenue Stream: Introduction
- 6.5.2. Market Size Absolute $ Opportunity Analysis and Forecast, By By Revenue Stream, 2016-2032
- 6.5.3. Over-the-Top (OTT)
- 6.5.4. Advertising
- 6.5.5. Sale of Tickets
- 6.5.6. Others
- 6.6. Eastern Europe Animation Market Analysis, Opportunity and Forecast, By By Industry, 2016-2032
- 6.6.1. Eastern Europe Animation Market Analysis by By Industry: Introduction
- 6.6.2. Market Size Absolute $ Opportunity Analysis and Forecast, By By Industry, 2016-2032
- 6.6.3. Media and Entertainment
- 6.6.4. Education
- 6.6.5. Retail
- 6.6.6. Healthcare
- 6.6.7. Manufacturing
- 6.6.8. Others
- 6.7. Eastern Europe Animation Market Analysis, Opportunity and Forecast, By Country , 2016-2032
- 6.7.1. Eastern Europe Animation Market Analysis by Country : Introduction
- 6.7.2. Market Size Absolute $ Opportunity Analysis and Forecast, Country , 2016-2032
- 6.7.2.1. Russia
- 6.7.2.2. Poland
- 6.7.2.3. The Czech Republic
- 6.7.2.4. Greece
- 6.7.2.5. Rest of Eastern Europe
- 7. APAC Animation Market Analysis, Opportunity and Forecast, 2016-2032
- 7.1. APAC Animation Market Analysis, 2016-2021
- 7.2. APAC Animation Market Opportunity and Forecast, 2023-2032
- 7.3. APAC Animation Market Analysis, Opportunity and Forecast, By By Type, 2016-2032
- 7.3.1. APAC Animation Market Analysis by By Type: Introduction
- 7.3.2. Market Size Absolute $ Opportunity Analysis and Forecast, By By Type, 2016-2032
- 7.3.3. 3D Animation
- 7.3.4. Stop Motion
- 7.3.5. Flipbook Animation
- 7.3.6. 2D Animation
- 7.4. APAC Animation Market Analysis, Opportunity and Forecast, By By Application, 2016-2032
- 7.4.1. APAC Animation Market Analysis by By Application: Introduction
- 7.4.2. Market Size Absolute $ Opportunity Analysis and Forecast, By By Application, 2016-2032
- 7.4.3. Media & Entertainment
- 7.4.4. Automotive
- 7.4.5. Online Education
- 7.4.6. Others
- 7.5. APAC Animation Market Analysis, Opportunity and Forecast, By By Revenue Stream, 2016-2032
- 7.5.1. APAC Animation Market Analysis by By Revenue Stream: Introduction
- 7.5.2. Market Size Absolute $ Opportunity Analysis and Forecast, By By Revenue Stream, 2016-2032
- 7.5.3. Over-the-Top (OTT)
- 7.5.4. Advertising
- 7.5.5. Sale of Tickets
- 7.5.6. Others
- 7.6. APAC Animation Market Analysis, Opportunity and Forecast, By By Industry, 2016-2032
- 7.6.1. APAC Animation Market Analysis by By Industry: Introduction
- 7.6.2. Market Size Absolute $ Opportunity Analysis and Forecast, By By Industry, 2016-2032
- 7.6.3. Media and Entertainment
- 7.6.4. Education
- 7.6.5. Retail
- 7.6.6. Healthcare
- 7.6.7. Manufacturing
- 7.6.8. Others
- 7.7. APAC Animation Market Analysis, Opportunity and Forecast, By Country , 2016-2032
- 7.7.1. APAC Animation Market Analysis by Country : Introduction
- 7.7.2. Market Size Absolute $ Opportunity Analysis and Forecast, Country , 2016-2032
- 7.7.2.1. China
- 7.7.2.2. Japan
- 7.7.2.3. South Korea
- 7.7.2.4. India
- 7.7.2.5. Australia & New Zeland
- 7.7.2.6. Indonesia
- 7.7.2.7. Malaysia
- 7.7.2.8. Philippines
- 7.7.2.9. Singapore
- 7.7.2.10. Thailand
- 7.7.2.11. Vietnam
- 7.7.2.12. Rest of APAC
- 8. Latin America Animation Market Analysis, Opportunity and Forecast, 2016-2032
- 8.1. Latin America Animation Market Analysis, 2016-2021
- 8.2. Latin America Animation Market Opportunity and Forecast, 2023-2032
- 8.3. Latin America Animation Market Analysis, Opportunity and Forecast, By By Type, 2016-2032
- 8.3.1. Latin America Animation Market Analysis by By Type: Introduction
- 8.3.2. Market Size Absolute $ Opportunity Analysis and Forecast, By By Type, 2016-2032
- 8.3.3. 3D Animation
- 8.3.4. Stop Motion
- 8.3.5. Flipbook Animation
- 8.3.6. 2D Animation
- 8.4. Latin America Animation Market Analysis, Opportunity and Forecast, By By Application, 2016-2032
- 8.4.1. Latin America Animation Market Analysis by By Application: Introduction
- 8.4.2. Market Size Absolute $ Opportunity Analysis and Forecast, By By Application, 2016-2032
- 8.4.3. Media & Entertainment
- 8.4.4. Automotive
- 8.4.5. Online Education
- 8.4.6. Others
- 8.5. Latin America Animation Market Analysis, Opportunity and Forecast, By By Revenue Stream, 2016-2032
- 8.5.1. Latin America Animation Market Analysis by By Revenue Stream: Introduction
- 8.5.2. Market Size Absolute $ Opportunity Analysis and Forecast, By By Revenue Stream, 2016-2032
- 8.5.3. Over-the-Top (OTT)
- 8.5.4. Advertising
- 8.5.5. Sale of Tickets
- 8.5.6. Others
- 8.6. Latin America Animation Market Analysis, Opportunity and Forecast, By By Industry, 2016-2032
- 8.6.1. Latin America Animation Market Analysis by By Industry: Introduction
- 8.6.2. Market Size Absolute $ Opportunity Analysis and Forecast, By By Industry, 2016-2032
- 8.6.3. Media and Entertainment
- 8.6.4. Education
- 8.6.5. Retail
- 8.6.6. Healthcare
- 8.6.7. Manufacturing
- 8.6.8. Others
- 8.7. Latin America Animation Market Analysis, Opportunity and Forecast, By Country , 2016-2032
- 8.7.1. Latin America Animation Market Analysis by Country : Introduction
- 8.7.2. Market Size Absolute $ Opportunity Analysis and Forecast, Country , 2016-2032
- 8.7.2.1. Brazil
- 8.7.2.2. Colombia
- 8.7.2.3. Chile
- 8.7.2.4. Argentina
- 8.7.2.5. Costa Rica
- 8.7.2.6. Rest of Latin America
- 9. Middle East & Africa Animation Market Analysis, Opportunity and Forecast, 2016-2032
- 9.1. Middle East & Africa Animation Market Analysis, 2016-2021
- 9.2. Middle East & Africa Animation Market Opportunity and Forecast, 2023-2032
- 9.3. Middle East & Africa Animation Market Analysis, Opportunity and Forecast, By By Type, 2016-2032
- 9.3.1. Middle East & Africa Animation Market Analysis by By Type: Introduction
- 9.3.2. Market Size Absolute $ Opportunity Analysis and Forecast, By By Type, 2016-2032
- 9.3.3. 3D Animation
- 9.3.4. Stop Motion
- 9.3.5. Flipbook Animation
- 9.3.6. 2D Animation
- 9.4. Middle East & Africa Animation Market Analysis, Opportunity and Forecast, By By Application, 2016-2032
- 9.4.1. Middle East & Africa Animation Market Analysis by By Application: Introduction
- 9.4.2. Market Size Absolute $ Opportunity Analysis and Forecast, By By Application, 2016-2032
- 9.4.3. Media & Entertainment
- 9.4.4. Automotive
- 9.4.5. Online Education
- 9.4.6. Others
- 9.5. Middle East & Africa Animation Market Analysis, Opportunity and Forecast, By By Revenue Stream, 2016-2032
- 9.5.1. Middle East & Africa Animation Market Analysis by By Revenue Stream: Introduction
- 9.5.2. Market Size Absolute $ Opportunity Analysis and Forecast, By By Revenue Stream, 2016-2032
- 9.5.3. Over-the-Top (OTT)
- 9.5.4. Advertising
- 9.5.5. Sale of Tickets
- 9.5.6. Others
- 9.6. Middle East & Africa Animation Market Analysis, Opportunity and Forecast, By By Industry, 2016-2032
- 9.6.1. Middle East & Africa Animation Market Analysis by By Industry: Introduction
- 9.6.2. Market Size Absolute $ Opportunity Analysis and Forecast, By By Industry, 2016-2032
- 9.6.3. Media and Entertainment
- 9.6.4. Education
- 9.6.5. Retail
- 9.6.6. Healthcare
- 9.6.7. Manufacturing
- 9.6.8. Others
- 9.7. Middle East & Africa Animation Market Analysis, Opportunity and Forecast, By Country , 2016-2032
- 9.7.1. Middle East & Africa Animation Market Analysis by Country : Introduction
- 9.7.2. Market Size Absolute $ Opportunity Analysis and Forecast, Country , 2016-2032
- 9.7.2.1. Algeria
- 9.7.2.2. Egypt
- 9.7.2.3. Israel
- 9.7.2.4. Kuwait
- 9.7.2.5. Nigeria
- 9.7.2.6. Saudi Arabia
- 9.7.2.7. South Africa
- 9.7.2.8. Turkey
- 9.7.2.9. The UAE
- 9.7.2.10. Rest of MEA
- 10. Global Animation Market Analysis, Opportunity and Forecast, By Region , 2016-2032
- 10.1. Global Animation Market Analysis by Region : Introduction
- 10.2. Market Size Absolute $ Opportunity Analysis and Forecast, By Region , 2016-2032
- 10.2.1. North America
- 10.2.2. Western Europe
- 10.2.3. Eastern Europe
- 10.2.4. APAC
- 10.2.5. Latin America
- 10.2.6. Middle East & Africa
- 11. Global Animation Market Competitive Landscape, Market Share Analysis, and Company Profiles
- 11.1. Market Share Analysis
- 11.2. Company Profiles
- 11.3. Adobe Systems Inc.
- 11.3.1. Company Overview
- 11.3.2. Financial Highlights
- 11.3.3. Product Portfolio
- 11.3.4. SWOT Analysis
- 11.3.5. Key Strategies and Developments
- 11.4. Autodesk, Inc.
- 11.4.1. Company Overview
- 11.4.2. Financial Highlights
- 11.4.3. Product Portfolio
- 11.4.4. SWOT Analysis
- 11.4.5. Key Strategies and Developments
- 11.5. Corel
- 11.5.1. Company Overview
- 11.5.2. Financial Highlights
- 11.5.3. Product Portfolio
- 11.5.4. SWOT Analysis
- 11.5.5. Key Strategies and Developments
- 11.6. EIAS3D
- 11.6.1. Company Overview
- 11.6.2. Financial Highlights
- 11.6.3. Product Portfolio
- 11.6.4. SWOT Analysis
- 11.6.5. Key Strategies and Developments
- 11.7. MAXON Computer
- 11.7.1. Company Overview
- 11.7.2. Financial Highlights
- 11.7.3. Product Portfolio
- 11.7.4. SWOT Analysis
- 11.7.5. Key Strategies and Developments
- 11.8. SideFX
- 11.8.1. Company Overview
- 11.8.2. Financial Highlights
- 11.8.3. Product Portfolio
- 11.8.4. SWOT Analysis
- 11.8.5. Key Strategies and Developments
- 11.9. Smith Micro
- 11.9.1. Company Overview
- 11.9.2. Financial Highlights
- 11.9.3. Product Portfolio
- 11.9.4. SWOT Analysis
- 11.9.5. Key Strategies and Developments
- 11.10. Newtec Inc.
- 11.10.1. Company Overview
- 11.10.2. Financial Highlights
- 11.10.3. Product Portfolio
- 11.10.4. SWOT Analysis
- 11.10.5. Key Strategies and Developments
- 11.11. Videocaddy
- 11.11.1. Company Overview
- 11.11.2. Financial Highlights
- 11.11.3. Product Portfolio
- 11.11.4. SWOT Analysis
- 11.11.5. Key Strategies and Developments
- 11.12. Animation Sharks
- 11.12.1. Company Overview
- 11.12.2. Financial Highlights
- 11.12.3. Product Portfolio
- 11.12.4. SWOT Analysis
- 11.12.5. Key Strategies and Developments
- 11.13.1. Company Overview
- 11.13.2. Financial Highlights
- 11.13.3. Product Portfolio
- 11.13.4. SWOT Analysis
- 11.13.5. Key Strategies and Developments
- 11.14. Triggerfish Studios
- 11.14.1. Company Overview
- 11.14.2. Financial Highlights
- 11.14.3. Product Portfolio
- 11.14.4. SWOT Analysis
- 11.14.5. Key Strategies and Developments
- 11.15. Pixologic Inc.
- 11.15.1. Company Overview
- 11.15.2. Financial Highlights
- 11.15.3. Product Portfolio
- 11.15.4. SWOT Analysis
- 11.15.5. Key Strategies and Developments
- 11.16. Walt Disney Animation Studios
- 11.16.1. Company Overview
- 11.16.2. Financial Highlights
- 11.16.3. Product Portfolio
- 11.16.4. SWOT Analysis
- 11.16.5. Key Strategies and Developments
- 11.17. DreamWorks Animation
- 11.17.1. Company Overview
- 11.17.2. Financial Highlights
- 11.17.3. Product Portfolio
- 11.17.4. SWOT Analysis
- 11.17.5. Key Strategies and Developments
- 11.18. Zco Corporation
- 11.18.1. Company Overview
- 11.18.2. Financial Highlights
- 11.18.3. Product Portfolio
- 11.18.4. SWOT Analysis
- 11.18.5. Key Strategies and Developments
- 11.19. Trimble Inc.
- 11.19.1. Company Overview
- 11.19.2. Financial Highlights
- 11.19.3. Product Portfolio
- 11.19.4. SWOT Analysis
- 11.19.5. Key Strategies and Developments
- 11.20. Animaker Inc.
- 11.20.1. Company Overview
- 11.20.2. Financial Highlights
- 11.20.3. Product Portfolio
- 11.20.4. SWOT Analysis
- 11.20.5. Key Strategies and Developments
- 11.21. Bondware Inc.
- 11.21.1. Company Overview
- 11.21.2. Financial Highlights
- 11.21.3. Product Portfolio
- 11.21.4. SWOT Analysis
- 11.21.5. Key Strategies and Developments
- 11.22. Exocortex Technologies
- 11.22.1. Company Overview
- 11.22.2. Financial Highlights
- 11.22.3. Product Portfolio
- 11.22.4. SWOT Analysis
- 11.22.5. Key Strategies and Developments
- 12. Assumptions and Acronyms
- 13. Research Methodology
- 14. Contact
"
- List of Figures
- "
- Figure 1: Global Animation Market Revenue (US$ Mn) Market Share by By Type in 2022
- Figure 2: Global Animation Market Market Attractiveness Analysis by By Type, 2016-2032
- Figure 3: Global Animation Market Revenue (US$ Mn) Market Share by By Applicationin 2022
- Figure 4: Global Animation Market Market Attractiveness Analysis by By Application, 2016-2032
- Figure 5: Global Animation Market Revenue (US$ Mn) Market Share by By Revenue Streamin 2022
- Figure 6: Global Animation Market Market Attractiveness Analysis by By Revenue Stream, 2016-2032
- Figure 7: Global Animation Market Revenue (US$ Mn) Market Share by By Industryin 2022
- Figure 8: Global Animation Market Market Attractiveness Analysis by By Industry, 2016-2032
- Figure 9: Global Animation Market Revenue (US$ Mn) Market Share by Region in 2022
- Figure 10: Global Animation Market Market Attractiveness Analysis by Region, 2016-2032
- Figure 11: Global Animation Market Market Revenue (US$ Mn) (2016-2032)
- Figure 12: Global Animation Market Market Revenue (US$ Mn) Comparison by Region (2016-2032)
- Figure 13: Global Animation Market Market Revenue (US$ Mn) Comparison by By Type (2016-2032)
- Figure 14: Global Animation Market Market Revenue (US$ Mn) Comparison by By Application (2016-2032)
- Figure 15: Global Animation Market Market Revenue (US$ Mn) Comparison by By Revenue Stream (2016-2032)
- Figure 16: Global Animation Market Market Revenue (US$ Mn) Comparison by By Industry (2016-2032)
- Figure 17: Global Animation Market Market Y-o-Y Growth Rate Comparison by Region (2016-2032)
- Figure 18: Global Animation Market Market Y-o-Y Growth Rate Comparison by By Type (2016-2032)
- Figure 19: Global Animation Market Market Y-o-Y Growth Rate Comparison by By Application (2016-2032)
- Figure 20: Global Animation Market Market Y-o-Y Growth Rate Comparison by By Revenue Stream (2016-2032)
- Figure 21: Global Animation Market Market Y-o-Y Growth Rate Comparison by By Industry (2016-2032)
- Figure 22: Global Animation Market Market Share Comparison by Region (2016-2032)
- Figure 23: Global Animation Market Market Share Comparison by By Type (2016-2032)
- Figure 24: Global Animation Market Market Share Comparison by By Application (2016-2032)
- Figure 25: Global Animation Market Market Share Comparison by By Revenue Stream (2016-2032)
- Figure 26: Global Animation Market Market Share Comparison by By Industry (2016-2032)
- Figure 27: North America Animation Market Revenue (US$ Mn) Market Share by By Typein 2022
- Figure 28: North America Animation Market Market Attractiveness Analysis by By Type, 2016-2032
- Figure 29: North America Animation Market Revenue (US$ Mn) Market Share by By Applicationin 2022
- Figure 30: North America Animation Market Market Attractiveness Analysis by By Application, 2016-2032
- Figure 31: North America Animation Market Revenue (US$ Mn) Market Share by By Revenue Streamin 2022
- Figure 32: North America Animation Market Market Attractiveness Analysis by By Revenue Stream, 2016-2032
- Figure 33: North America Animation Market Revenue (US$ Mn) Market Share by By Industryin 2022
- Figure 34: North America Animation Market Market Attractiveness Analysis by By Industry, 2016-2032
- Figure 35: North America Animation Market Revenue (US$ Mn) Market Share by Country in 2022
- Figure 36: North America Animation Market Market Attractiveness Analysis by Country, 2016-2032
- Figure 37: North America Animation Market Market Revenue (US$ Mn) (2016-2032)
- Figure 38: North America Animation Market Market Revenue (US$ Mn) Comparison by Country (2016-2032)
- Figure 39: North America Animation Market Market Revenue (US$ Mn) Comparison by By Type (2016-2032)
- Figure 40: North America Animation Market Market Revenue (US$ Mn) Comparison by By Application (2016-2032)
- Figure 41: North America Animation Market Market Revenue (US$ Mn) Comparison by By Revenue Stream (2016-2032)
- Figure 42: North America Animation Market Market Revenue (US$ Mn) Comparison by By Industry (2016-2032)
- Figure 43: North America Animation Market Market Y-o-Y Growth Rate Comparison by Country (2016-2032)
- Figure 44: North America Animation Market Market Y-o-Y Growth Rate Comparison by By Type (2016-2032)
- Figure 45: North America Animation Market Market Y-o-Y Growth Rate Comparison by By Application (2016-2032)
- Figure 46: North America Animation Market Market Y-o-Y Growth Rate Comparison by By Revenue Stream (2016-2032)
- Figure 47: North America Animation Market Market Y-o-Y Growth Rate Comparison by By Industry (2016-2032)
- Figure 48: North America Animation Market Market Share Comparison by Country (2016-2032)
- Figure 49: North America Animation Market Market Share Comparison by By Type (2016-2032)
- Figure 50: North America Animation Market Market Share Comparison by By Application (2016-2032)
- Figure 51: North America Animation Market Market Share Comparison by By Revenue Stream (2016-2032)
- Figure 52: North America Animation Market Market Share Comparison by By Industry (2016-2032)
- Figure 53: Western Europe Animation Market Revenue (US$ Mn) Market Share by By Typein 2022
- Figure 54: Western Europe Animation Market Market Attractiveness Analysis by By Type, 2016-2032
- Figure 55: Western Europe Animation Market Revenue (US$ Mn) Market Share by By Applicationin 2022
- Figure 56: Western Europe Animation Market Market Attractiveness Analysis by By Application, 2016-2032
- Figure 57: Western Europe Animation Market Revenue (US$ Mn) Market Share by By Revenue Streamin 2022
- Figure 58: Western Europe Animation Market Market Attractiveness Analysis by By Revenue Stream, 2016-2032
- Figure 59: Western Europe Animation Market Revenue (US$ Mn) Market Share by By Industryin 2022
- Figure 60: Western Europe Animation Market Market Attractiveness Analysis by By Industry, 2016-2032
- Figure 61: Western Europe Animation Market Revenue (US$ Mn) Market Share by Country in 2022
- Figure 62: Western Europe Animation Market Market Attractiveness Analysis by Country, 2016-2032
- Figure 63: Western Europe Animation Market Market Revenue (US$ Mn) (2016-2032)
- Figure 64: Western Europe Animation Market Market Revenue (US$ Mn) Comparison by Country (2016-2032)
- Figure 65: Western Europe Animation Market Market Revenue (US$ Mn) Comparison by By Type (2016-2032)
- Figure 66: Western Europe Animation Market Market Revenue (US$ Mn) Comparison by By Application (2016-2032)
- Figure 67: Western Europe Animation Market Market Revenue (US$ Mn) Comparison by By Revenue Stream (2016-2032)
- Figure 68: Western Europe Animation Market Market Revenue (US$ Mn) Comparison by By Industry (2016-2032)
- Figure 69: Western Europe Animation Market Market Y-o-Y Growth Rate Comparison by Country (2016-2032)
- Figure 70: Western Europe Animation Market Market Y-o-Y Growth Rate Comparison by By Type (2016-2032)
- Figure 71: Western Europe Animation Market Market Y-o-Y Growth Rate Comparison by By Application (2016-2032)
- Figure 72: Western Europe Animation Market Market Y-o-Y Growth Rate Comparison by By Revenue Stream (2016-2032)
- Figure 73: Western Europe Animation Market Market Y-o-Y Growth Rate Comparison by By Industry (2016-2032)
- Figure 74: Western Europe Animation Market Market Share Comparison by Country (2016-2032)
- Figure 75: Western Europe Animation Market Market Share Comparison by By Type (2016-2032)
- Figure 76: Western Europe Animation Market Market Share Comparison by By Application (2016-2032)
- Figure 77: Western Europe Animation Market Market Share Comparison by By Revenue Stream (2016-2032)
- Figure 78: Western Europe Animation Market Market Share Comparison by By Industry (2016-2032)
- Figure 79: Eastern Europe Animation Market Revenue (US$ Mn) Market Share by By Typein 2022
- Figure 80: Eastern Europe Animation Market Market Attractiveness Analysis by By Type, 2016-2032
- Figure 81: Eastern Europe Animation Market Revenue (US$ Mn) Market Share by By Applicationin 2022
- Figure 82: Eastern Europe Animation Market Market Attractiveness Analysis by By Application, 2016-2032
- Figure 83: Eastern Europe Animation Market Revenue (US$ Mn) Market Share by By Revenue Streamin 2022
- Figure 84: Eastern Europe Animation Market Market Attractiveness Analysis by By Revenue Stream, 2016-2032
- Figure 85: Eastern Europe Animation Market Revenue (US$ Mn) Market Share by By Industryin 2022
- Figure 86: Eastern Europe Animation Market Market Attractiveness Analysis by By Industry, 2016-2032
- Figure 87: Eastern Europe Animation Market Revenue (US$ Mn) Market Share by Country in 2022
- Figure 88: Eastern Europe Animation Market Market Attractiveness Analysis by Country, 2016-2032
- Figure 89: Eastern Europe Animation Market Market Revenue (US$ Mn) (2016-2032)
- Figure 90: Eastern Europe Animation Market Market Revenue (US$ Mn) Comparison by Country (2016-2032)
- Figure 91: Eastern Europe Animation Market Market Revenue (US$ Mn) Comparison by By Type (2016-2032)
- Figure 92: Eastern Europe Animation Market Market Revenue (US$ Mn) Comparison by By Application (2016-2032)
- Figure 93: Eastern Europe Animation Market Market Revenue (US$ Mn) Comparison by By Revenue Stream (2016-2032)
- Figure 94: Eastern Europe Animation Market Market Revenue (US$ Mn) Comparison by By Industry (2016-2032)
- Figure 95: Eastern Europe Animation Market Market Y-o-Y Growth Rate Comparison by Country (2016-2032)
- Figure 96: Eastern Europe Animation Market Market Y-o-Y Growth Rate Comparison by By Type (2016-2032)
- Figure 97: Eastern Europe Animation Market Market Y-o-Y Growth Rate Comparison by By Application (2016-2032)
- Figure 98: Eastern Europe Animation Market Market Y-o-Y Growth Rate Comparison by By Revenue Stream (2016-2032)
- Figure 99: Eastern Europe Animation Market Market Y-o-Y Growth Rate Comparison by By Industry (2016-2032)
- Figure 100: Eastern Europe Animation Market Market Share Comparison by Country (2016-2032)
- Figure 101: Eastern Europe Animation Market Market Share Comparison by By Type (2016-2032)
- Figure 102: Eastern Europe Animation Market Market Share Comparison by By Application (2016-2032)
- Figure 103: Eastern Europe Animation Market Market Share Comparison by By Revenue Stream (2016-2032)
- Figure 104: Eastern Europe Animation Market Market Share Comparison by By Industry (2016-2032)
- Figure 105: APAC Animation Market Revenue (US$ Mn) Market Share by By Typein 2022
- Figure 106: APAC Animation Market Market Attractiveness Analysis by By Type, 2016-2032
- Figure 107: APAC Animation Market Revenue (US$ Mn) Market Share by By Applicationin 2022
- Figure 108: APAC Animation Market Market Attractiveness Analysis by By Application, 2016-2032
- Figure 109: APAC Animation Market Revenue (US$ Mn) Market Share by By Revenue Streamin 2022
- Figure 110: APAC Animation Market Market Attractiveness Analysis by By Revenue Stream, 2016-2032
- Figure 111: APAC Animation Market Revenue (US$ Mn) Market Share by By Industryin 2022
- Figure 112: APAC Animation Market Market Attractiveness Analysis by By Industry, 2016-2032
- Figure 113: APAC Animation Market Revenue (US$ Mn) Market Share by Country in 2022
- Figure 114: APAC Animation Market Market Attractiveness Analysis by Country, 2016-2032
- Figure 115: APAC Animation Market Market Revenue (US$ Mn) (2016-2032)
- Figure 116: APAC Animation Market Market Revenue (US$ Mn) Comparison by Country (2016-2032)
- Figure 117: APAC Animation Market Market Revenue (US$ Mn) Comparison by By Type (2016-2032)
- Figure 118: APAC Animation Market Market Revenue (US$ Mn) Comparison by By Application (2016-2032)
- Figure 119: APAC Animation Market Market Revenue (US$ Mn) Comparison by By Revenue Stream (2016-2032)
- Figure 120: APAC Animation Market Market Revenue (US$ Mn) Comparison by By Industry (2016-2032)
- Figure 121: APAC Animation Market Market Y-o-Y Growth Rate Comparison by Country (2016-2032)
- Figure 122: APAC Animation Market Market Y-o-Y Growth Rate Comparison by By Type (2016-2032)
- Figure 123: APAC Animation Market Market Y-o-Y Growth Rate Comparison by By Application (2016-2032)
- Figure 124: APAC Animation Market Market Y-o-Y Growth Rate Comparison by By Revenue Stream (2016-2032)
- Figure 125: APAC Animation Market Market Y-o-Y Growth Rate Comparison by By Industry (2016-2032)
- Figure 126: APAC Animation Market Market Share Comparison by Country (2016-2032)
- Figure 127: APAC Animation Market Market Share Comparison by By Type (2016-2032)
- Figure 128: APAC Animation Market Market Share Comparison by By Application (2016-2032)
- Figure 129: APAC Animation Market Market Share Comparison by By Revenue Stream (2016-2032)
- Figure 130: APAC Animation Market Market Share Comparison by By Industry (2016-2032)
- Figure 131: Latin America Animation Market Revenue (US$ Mn) Market Share by By Typein 2022
- Figure 132: Latin America Animation Market Market Attractiveness Analysis by By Type, 2016-2032
- Figure 133: Latin America Animation Market Revenue (US$ Mn) Market Share by By Applicationin 2022
- Figure 134: Latin America Animation Market Market Attractiveness Analysis by By Application, 2016-2032
- Figure 135: Latin America Animation Market Revenue (US$ Mn) Market Share by By Revenue Streamin 2022
- Figure 136: Latin America Animation Market Market Attractiveness Analysis by By Revenue Stream, 2016-2032
- Figure 137: Latin America Animation Market Revenue (US$ Mn) Market Share by By Industryin 2022
- Figure 138: Latin America Animation Market Market Attractiveness Analysis by By Industry, 2016-2032
- Figure 139: Latin America Animation Market Revenue (US$ Mn) Market Share by Country in 2022
- Figure 140: Latin America Animation Market Market Attractiveness Analysis by Country, 2016-2032
- Figure 141: Latin America Animation Market Market Revenue (US$ Mn) (2016-2032)
- Figure 142: Latin America Animation Market Market Revenue (US$ Mn) Comparison by Country (2016-2032)
- Figure 143: Latin America Animation Market Market Revenue (US$ Mn) Comparison by By Type (2016-2032)
- Figure 144: Latin America Animation Market Market Revenue (US$ Mn) Comparison by By Application (2016-2032)
- Figure 145: Latin America Animation Market Market Revenue (US$ Mn) Comparison by By Revenue Stream (2016-2032)
- Figure 146: Latin America Animation Market Market Revenue (US$ Mn) Comparison by By Industry (2016-2032)
- Figure 147: Latin America Animation Market Market Y-o-Y Growth Rate Comparison by Country (2016-2032)
- Figure 148: Latin America Animation Market Market Y-o-Y Growth Rate Comparison by By Type (2016-2032)
- Figure 149: Latin America Animation Market Market Y-o-Y Growth Rate Comparison by By Application (2016-2032)
- Figure 150: Latin America Animation Market Market Y-o-Y Growth Rate Comparison by By Revenue Stream (2016-2032)
- Figure 151: Latin America Animation Market Market Y-o-Y Growth Rate Comparison by By Industry (2016-2032)
- Figure 152: Latin America Animation Market Market Share Comparison by Country (2016-2032)
- Figure 153: Latin America Animation Market Market Share Comparison by By Type (2016-2032)
- Figure 154: Latin America Animation Market Market Share Comparison by By Application (2016-2032)
- Figure 155: Latin America Animation Market Market Share Comparison by By Revenue Stream (2016-2032)
- Figure 156: Latin America Animation Market Market Share Comparison by By Industry (2016-2032)
- Figure 157: Middle East & Africa Animation Market Revenue (US$ Mn) Market Share by By Typein 2022
- Figure 158: Middle East & Africa Animation Market Market Attractiveness Analysis by By Type, 2016-2032
- Figure 159: Middle East & Africa Animation Market Revenue (US$ Mn) Market Share by By Applicationin 2022
- Figure 160: Middle East & Africa Animation Market Market Attractiveness Analysis by By Application, 2016-2032
- Figure 161: Middle East & Africa Animation Market Revenue (US$ Mn) Market Share by By Revenue Streamin 2022
- Figure 162: Middle East & Africa Animation Market Market Attractiveness Analysis by By Revenue Stream, 2016-2032
- Figure 163: Middle East & Africa Animation Market Revenue (US$ Mn) Market Share by By Industryin 2022
- Figure 164: Middle East & Africa Animation Market Market Attractiveness Analysis by By Industry, 2016-2032
- Figure 165: Middle East & Africa Animation Market Revenue (US$ Mn) Market Share by Country in 2022
- Figure 166: Middle East & Africa Animation Market Market Attractiveness Analysis by Country, 2016-2032
- Figure 167: Middle East & Africa Animation Market Market Revenue (US$ Mn) (2016-2032)
- Figure 168: Middle East & Africa Animation Market Market Revenue (US$ Mn) Comparison by Country (2016-2032)
- Figure 169: Middle East & Africa Animation Market Market Revenue (US$ Mn) Comparison by By Type (2016-2032)
- Figure 170: Middle East & Africa Animation Market Market Revenue (US$ Mn) Comparison by By Application (2016-2032)
- Figure 171: Middle East & Africa Animation Market Market Revenue (US$ Mn) Comparison by By Revenue Stream (2016-2032)
- Figure 172: Middle East & Africa Animation Market Market Revenue (US$ Mn) Comparison by By Industry (2016-2032)
- Figure 173: Middle East & Africa Animation Market Market Y-o-Y Growth Rate Comparison by Country (2016-2032)
- Figure 174: Middle East & Africa Animation Market Market Y-o-Y Growth Rate Comparison by By Type (2016-2032)
- Figure 175: Middle East & Africa Animation Market Market Y-o-Y Growth Rate Comparison by By Application (2016-2032)
- Figure 176: Middle East & Africa Animation Market Market Y-o-Y Growth Rate Comparison by By Revenue Stream (2016-2032)
- Figure 177: Middle East & Africa Animation Market Market Y-o-Y Growth Rate Comparison by By Industry (2016-2032)
- Figure 178: Middle East & Africa Animation Market Market Share Comparison by Country (2016-2032)
- Figure 179: Middle East & Africa Animation Market Market Share Comparison by By Type (2016-2032)
- Figure 180: Middle East & Africa Animation Market Market Share Comparison by By Application (2016-2032)
- Figure 181: Middle East & Africa Animation Market Market Share Comparison by By Revenue Stream (2016-2032)
- Figure 182: Middle East & Africa Animation Market Market Share Comparison by By Industry (2016-2032)
"
- List of Tables
- "
- Table 1: Global Animation Market Market Comparison by By Type (2016-2032)
- Table 2: Global Animation Market Market Comparison by By Application (2016-2032)
- Table 3: Global Animation Market Market Comparison by By Revenue Stream (2016-2032)
- Table 4: Global Animation Market Market Comparison by By Industry (2016-2032)
- Table 5: Global Animation Market Revenue (US$ Mn) Comparison by Region (2016-2032)
- Table 6: Global Animation Market Market Revenue (US$ Mn) (2016-2032)
- Table 7: Global Animation Market Market Revenue (US$ Mn) Comparison by Region (2016-2032)
- Table 8: Global Animation Market Market Revenue (US$ Mn) Comparison by By Type (2016-2032)
- Table 9: Global Animation Market Market Revenue (US$ Mn) Comparison by By Application (2016-2032)
- Table 10: Global Animation Market Market Revenue (US$ Mn) Comparison by By Revenue Stream (2016-2032)
- Table 11: Global Animation Market Market Revenue (US$ Mn) Comparison by By Industry (2016-2032)
- Table 12: Global Animation Market Market Y-o-Y Growth Rate Comparison by Region (2016-2032)
- Table 13: Global Animation Market Market Y-o-Y Growth Rate Comparison by By Type (2016-2032)
- Table 14: Global Animation Market Market Y-o-Y Growth Rate Comparison by By Application (2016-2032)
- Table 15: Global Animation Market Market Y-o-Y Growth Rate Comparison by By Revenue Stream (2016-2032)
- Table 16: Global Animation Market Market Y-o-Y Growth Rate Comparison by By Industry (2016-2032)
- Table 17: Global Animation Market Market Share Comparison by Region (2016-2032)
- Table 18: Global Animation Market Market Share Comparison by By Type (2016-2032)
- Table 19: Global Animation Market Market Share Comparison by By Application (2016-2032)
- Table 20: Global Animation Market Market Share Comparison by By Revenue Stream (2016-2032)
- Table 21: Global Animation Market Market Share Comparison by By Industry (2016-2032)
- Table 22: North America Animation Market Market Comparison by By Application (2016-2032)
- Table 23: North America Animation Market Market Comparison by By Revenue Stream (2016-2032)
- Table 24: North America Animation Market Market Comparison by By Industry (2016-2032)
- Table 25: North America Animation Market Revenue (US$ Mn) Comparison by Country (2016-2032)
- Table 26: North America Animation Market Market Revenue (US$ Mn) (2016-2032)
- Table 27: North America Animation Market Market Revenue (US$ Mn) Comparison by Country (2016-2032)
- Table 28: North America Animation Market Market Revenue (US$ Mn) Comparison by By Type (2016-2032)
- Table 29: North America Animation Market Market Revenue (US$ Mn) Comparison by By Application (2016-2032)
- Table 30: North America Animation Market Market Revenue (US$ Mn) Comparison by By Revenue Stream (2016-2032)
- Table 31: North America Animation Market Market Revenue (US$ Mn) Comparison by By Industry (2016-2032)
- Table 32: North America Animation Market Market Y-o-Y Growth Rate Comparison by Country (2016-2032)
- Table 33: North America Animation Market Market Y-o-Y Growth Rate Comparison by By Type (2016-2032)
- Table 34: North America Animation Market Market Y-o-Y Growth Rate Comparison by By Application (2016-2032)
- Table 35: North America Animation Market Market Y-o-Y Growth Rate Comparison by By Revenue Stream (2016-2032)
- Table 36: North America Animation Market Market Y-o-Y Growth Rate Comparison by By Industry (2016-2032)
- Table 37: North America Animation Market Market Share Comparison by Country (2016-2032)
- Table 38: North America Animation Market Market Share Comparison by By Type (2016-2032)
- Table 39: North America Animation Market Market Share Comparison by By Application (2016-2032)
- Table 40: North America Animation Market Market Share Comparison by By Revenue Stream (2016-2032)
- Table 41: North America Animation Market Market Share Comparison by By Industry (2016-2032)
- Table 42: Western Europe Animation Market Market Comparison by By Type (2016-2032)
- Table 43: Western Europe Animation Market Market Comparison by By Application (2016-2032)
- Table 44: Western Europe Animation Market Market Comparison by By Revenue Stream (2016-2032)
- Table 45: Western Europe Animation Market Market Comparison by By Industry (2016-2032)
- Table 46: Western Europe Animation Market Revenue (US$ Mn) Comparison by Country (2016-2032)
- Table 47: Western Europe Animation Market Market Revenue (US$ Mn) (2016-2032)
- Table 48: Western Europe Animation Market Market Revenue (US$ Mn) Comparison by Country (2016-2032)
- Table 49: Western Europe Animation Market Market Revenue (US$ Mn) Comparison by By Type (2016-2032)
- Table 50: Western Europe Animation Market Market Revenue (US$ Mn) Comparison by By Application (2016-2032)
- Table 51: Western Europe Animation Market Market Revenue (US$ Mn) Comparison by By Revenue Stream (2016-2032)
- Table 52: Western Europe Animation Market Market Revenue (US$ Mn) Comparison by By Industry (2016-2032)
- Table 53: Western Europe Animation Market Market Y-o-Y Growth Rate Comparison by Country (2016-2032)
- Table 54: Western Europe Animation Market Market Y-o-Y Growth Rate Comparison by By Type (2016-2032)
- Table 55: Western Europe Animation Market Market Y-o-Y Growth Rate Comparison by By Application (2016-2032)
- Table 56: Western Europe Animation Market Market Y-o-Y Growth Rate Comparison by By Revenue Stream (2016-2032)
- Table 57: Western Europe Animation Market Market Y-o-Y Growth Rate Comparison by By Industry (2016-2032)
- Table 58: Western Europe Animation Market Market Share Comparison by Country (2016-2032)
- Table 59: Western Europe Animation Market Market Share Comparison by By Type (2016-2032)
- Table 60: Western Europe Animation Market Market Share Comparison by By Application (2016-2032)
- Table 61: Western Europe Animation Market Market Share Comparison by By Revenue Stream (2016-2032)
- Table 62: Western Europe Animation Market Market Share Comparison by By Industry (2016-2032)
- Table 63: Eastern Europe Animation Market Market Comparison by By Type (2016-2032)
- Table 64: Eastern Europe Animation Market Market Comparison by By Application (2016-2032)
- Table 65: Eastern Europe Animation Market Market Comparison by By Revenue Stream (2016-2032)
- Table 66: Eastern Europe Animation Market Market Comparison by By Industry (2016-2032)
- Table 67: Eastern Europe Animation Market Revenue (US$ Mn) Comparison by Country (2016-2032)
- Table 68: Eastern Europe Animation Market Market Revenue (US$ Mn) (2016-2032)
- Table 69: Eastern Europe Animation Market Market Revenue (US$ Mn) Comparison by Country (2016-2032)
- Table 70: Eastern Europe Animation Market Market Revenue (US$ Mn) Comparison by By Type (2016-2032)
- Table 71: Eastern Europe Animation Market Market Revenue (US$ Mn) Comparison by By Application (2016-2032)
- Table 72: Eastern Europe Animation Market Market Revenue (US$ Mn) Comparison by By Revenue Stream (2016-2032)
- Table 73: Eastern Europe Animation Market Market Revenue (US$ Mn) Comparison by By Industry (2016-2032)
- Table 74: Eastern Europe Animation Market Market Y-o-Y Growth Rate Comparison by Country (2016-2032)
- Table 75: Eastern Europe Animation Market Market Y-o-Y Growth Rate Comparison by By Type (2016-2032)
- Table 76: Eastern Europe Animation Market Market Y-o-Y Growth Rate Comparison by By Application (2016-2032)
- Table 77: Eastern Europe Animation Market Market Y-o-Y Growth Rate Comparison by By Revenue Stream (2016-2032)
- Table 78: Eastern Europe Animation Market Market Y-o-Y Growth Rate Comparison by By Industry (2016-2032)
- Table 79: Eastern Europe Animation Market Market Share Comparison by Country (2016-2032)
- Table 80: Eastern Europe Animation Market Market Share Comparison by By Type (2016-2032)
- Table 81: Eastern Europe Animation Market Market Share Comparison by By Application (2016-2032)
- Table 82: Eastern Europe Animation Market Market Share Comparison by By Revenue Stream (2016-2032)
- Table 83: Eastern Europe Animation Market Market Share Comparison by By Industry (2016-2032)
- Table 84: APAC Animation Market Market Comparison by By Type (2016-2032)
- Table 85: APAC Animation Market Market Comparison by By Application (2016-2032)
- Table 86: APAC Animation Market Market Comparison by By Revenue Stream (2016-2032)
- Table 87: APAC Animation Market Market Comparison by By Industry (2016-2032)
- Table 88: APAC Animation Market Revenue (US$ Mn) Comparison by Country (2016-2032)
- Table 89: APAC Animation Market Market Revenue (US$ Mn) (2016-2032)
- Table 90: APAC Animation Market Market Revenue (US$ Mn) Comparison by Country (2016-2032)
- Table 91: APAC Animation Market Market Revenue (US$ Mn) Comparison by By Type (2016-2032)
- Table 92: APAC Animation Market Market Revenue (US$ Mn) Comparison by By Application (2016-2032)
- Table 93: APAC Animation Market Market Revenue (US$ Mn) Comparison by By Revenue Stream (2016-2032)
- Table 94: APAC Animation Market Market Revenue (US$ Mn) Comparison by By Industry (2016-2032)
- Table 95: APAC Animation Market Market Y-o-Y Growth Rate Comparison by Country (2016-2032)
- Table 96: APAC Animation Market Market Y-o-Y Growth Rate Comparison by By Type (2016-2032)
- Table 97: APAC Animation Market Market Y-o-Y Growth Rate Comparison by By Application (2016-2032)
- Table 98: APAC Animation Market Market Y-o-Y Growth Rate Comparison by By Revenue Stream (2016-2032)
- Table 99: APAC Animation Market Market Y-o-Y Growth Rate Comparison by By Industry (2016-2032)
- Table 100: APAC Animation Market Market Share Comparison by Country (2016-2032)
- Table 101: APAC Animation Market Market Share Comparison by By Type (2016-2032)
- Table 102: APAC Animation Market Market Share Comparison by By Application (2016-2032)
- Table 103: APAC Animation Market Market Share Comparison by By Revenue Stream (2016-2032)
- Table 104: APAC Animation Market Market Share Comparison by By Industry (2016-2032)
- Table 105: Latin America Animation Market Market Comparison by By Type (2016-2032)
- Table 106: Latin America Animation Market Market Comparison by By Application (2016-2032)
- Table 107: Latin America Animation Market Market Comparison by By Revenue Stream (2016-2032)
- Table 108: Latin America Animation Market Market Comparison by By Industry (2016-2032)
- Table 109: Latin America Animation Market Revenue (US$ Mn) Comparison by Country (2016-2032)
- Table 110: Latin America Animation Market Market Revenue (US$ Mn) (2016-2032)
- Table 111: Latin America Animation Market Market Revenue (US$ Mn) Comparison by Country (2016-2032)
- Table 112: Latin America Animation Market Market Revenue (US$ Mn) Comparison by By Type (2016-2032)
- Table 113: Latin America Animation Market Market Revenue (US$ Mn) Comparison by By Application (2016-2032)
- Table 114: Latin America Animation Market Market Revenue (US$ Mn) Comparison by By Revenue Stream (2016-2032)
- Table 115: Latin America Animation Market Market Revenue (US$ Mn) Comparison by By Industry (2016-2032)
- Table 116: Latin America Animation Market Market Y-o-Y Growth Rate Comparison by Country (2016-2032)
- Table 117: Latin America Animation Market Market Y-o-Y Growth Rate Comparison by By Type (2016-2032)
- Table 118: Latin America Animation Market Market Y-o-Y Growth Rate Comparison by By Application (2016-2032)
- Table 119: Latin America Animation Market Market Y-o-Y Growth Rate Comparison by By Revenue Stream (2016-2032)
- Table 120: Latin America Animation Market Market Y-o-Y Growth Rate Comparison by By Industry (2016-2032)
- Table 121: Latin America Animation Market Market Share Comparison by Country (2016-2032)
- Table 122: Latin America Animation Market Market Share Comparison by By Type (2016-2032)
- Table 123: Latin America Animation Market Market Share Comparison by By Application (2016-2032)
- Table 124: Latin America Animation Market Market Share Comparison by By Revenue Stream (2016-2032)
- Table 125: Latin America Animation Market Market Share Comparison by By Industry (2016-2032)
- Table 126: Middle East & Africa Animation Market Market Comparison by By Type (2016-2032)
- Table 127: Middle East & Africa Animation Market Market Comparison by By Application (2016-2032)
- Table 128: Middle East & Africa Animation Market Market Comparison by By Revenue Stream (2016-2032)
- Table 129: Middle East & Africa Animation Market Market Comparison by By Industry (2016-2032)
- Table 130: Middle East & Africa Animation Market Revenue (US$ Mn) Comparison by Country (2016-2032)
- Table 131: Middle East & Africa Animation Market Market Revenue (US$ Mn) (2016-2032)
- Table 132: Middle East & Africa Animation Market Market Revenue (US$ Mn) Comparison by Country (2016-2032)
- Table 133: Middle East & Africa Animation Market Market Revenue (US$ Mn) Comparison by By Type (2016-2032)
- Table 134: Middle East & Africa Animation Market Market Revenue (US$ Mn) Comparison by By Application (2016-2032)
- Table 135: Middle East & Africa Animation Market Market Revenue (US$ Mn) Comparison by By Revenue Stream (2016-2032)
- Table 136: Middle East & Africa Animation Market Market Revenue (US$ Mn) Comparison by By Industry (2016-2032)
- Table 137: Middle East & Africa Animation Market Market Y-o-Y Growth Rate Comparison by Country (2016-2032)
- Table 138: Middle East & Africa Animation Market Market Y-o-Y Growth Rate Comparison by By Type (2016-2032)
- Table 139: Middle East & Africa Animation Market Market Y-o-Y Growth Rate Comparison by By Application (2016-2032)
- Table 140: Middle East & Africa Animation Market Market Y-o-Y Growth Rate Comparison by By Revenue Stream (2016-2032)
- Table 141: Middle East & Africa Animation Market Market Y-o-Y Growth Rate Comparison by By Industry (2016-2032)
- Table 142: Middle East & Africa Animation Market Market Share Comparison by Country (2016-2032)
- Table 143: Middle East & Africa Animation Market Market Share Comparison by By Type (2016-2032)
- Table 144: Middle East & Africa Animation Market Market Share Comparison by By Application (2016-2032)
- Table 145: Middle East & Africa Animation Market Market Share Comparison by By Revenue Stream (2016-2032)
- Table 146: Middle East & Africa Animation Market Market Share Comparison by By Industry (2016-2032)
- 1. Executive Summary
-
- Adobe Systems Inc.
- Autodesk, Inc.
- Corel
- EIAS3D
- MAXON Computer
- SideFX
- Smith Micro
- Newtec Inc.
- Videocaddy
- Animation Sharks
- Triggerfish Studios
- GRAFTON
- Pixologic Inc.
- Walt Disney Animation Studios
- DreamWorks Animation
- Zco Corporation
- Trimble Inc.
- Animaker Inc.
- Bondware Inc.
- Exocortex Technologies
- Sony Corporation
- Image Metrics, Inc.
- Newtek Inc.
- NVIDIA Corporation
Our Clients


View Our Licence Options
