
Alcoholic Beverages Market By Type(Beer, Wine, Spirits), By Alcoholic Content(High, Medium, Low), By Category(Mass, Premium), By Packaging(Plastic Bottles, Glass Bottles, Tins), By Distribution Channel(Supermarkets, Specialty Stores, Liquor Stores), By Region And Companies - Industry Segment Outlook, Market Assessment, Competition Scenario, Trends, And Forecast 2024-2033
-
5602
-
Feb 2024
-
176
-


-
This report was compiled by Shreyas Rokade Shreyas Rokade is a seasoned Research Analyst with CMFE, bringing extensive expertise in market research and consulting, with a strong background in Chemical Engineering. Correspondence Team Lead-CMFE Linkedin | Detailed Market research Methodology Our methodology involves a mix of primary research, including interviews with leading mental health experts, and secondary research from reputable medical journals and databases. View Detailed Methodology Page
-
Quick Navigation
Report Overview
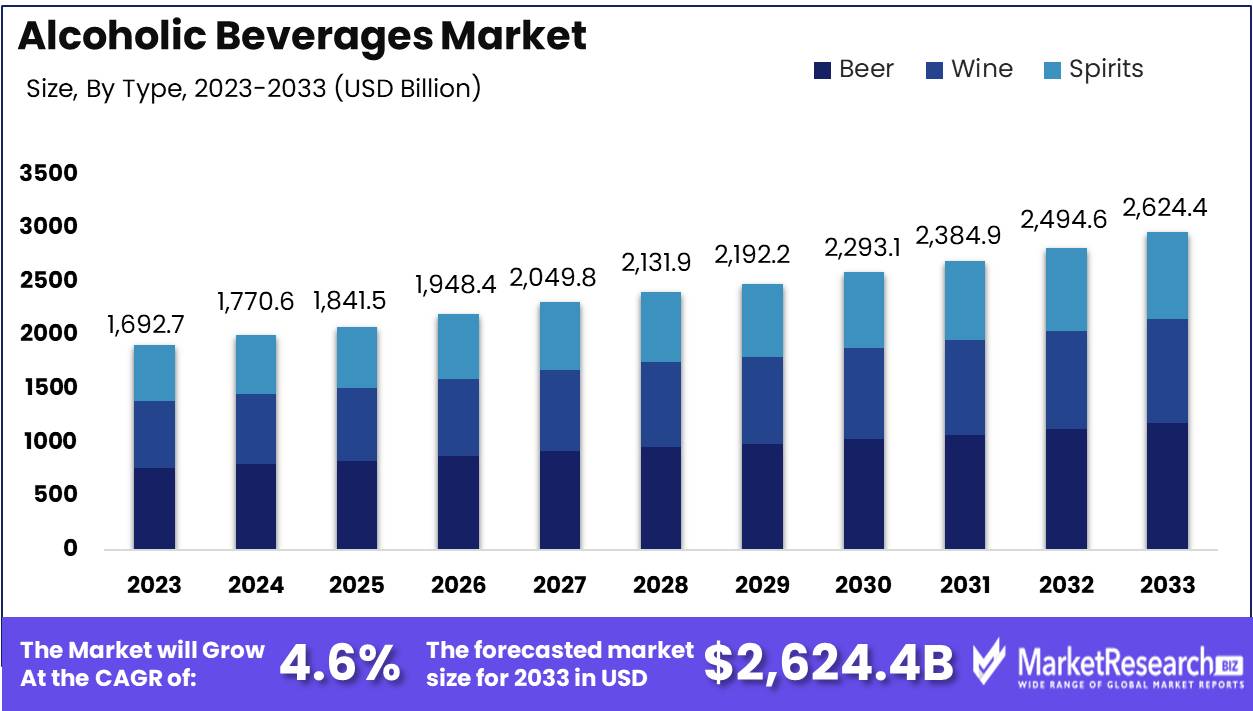
The alcoholic beverages market was valued at USD 1,692.7 billion in 2023, It is expected to reach USD 2,624.4 billion by 2033, with a CAGR of 4.6% during the forecast period from 2024 to 2033. The surge in demand for hybrid alcoholic beverages and changes in customer preferences are some of the main key driving factors for the alcoholic beverage market.
Alcoholic beverages are defined as drinks containing ethanol, a type of alcohol that is made through the fermentation of sugars by yeast. It has many categories that consist of different types of beverages like wine, beer, cocktails, and spirits. Meanwhile, beer is made from fermented grains, spirits are made up from distilled fermented products, and wine is developed from fermented grapes.
The alcohol content changes, with beer commonly having a lower alcohol content by volume than wine or spirits. This has been an important part of human social, and recreational activities for centuries, religious, playing roles in rituals, celebrations, and cooking traditions globally. The consumption of alcoholic beverages is often related to social enjoyment, more drinking can lead to health issues and societal issues, highlighting the prominence of responsible alcohol consumption.
An article published by CNBC in February 2024, highlights that US spirits has maintained its market share strength in 2023 and shattered out beer industry and wine for the second year. In the US, supplier sales grew in 2023 to USD 37.7 billion. Although the alcoholic beverages industry has gained slight total revenue, it has overtaken beer and wine sales by 0.4% and 26.1% respectively. Moreover, the pre-mixed cocktails were up the spirits category last year by rising 26.7% to USD 2.8 billion in sales revenue.
Alcoholic beverages like red wines have been connected to more health advantages when consumed in moderation, with some of the studies suggesting that it has some positive outcomes on cardiovascular health. It is important to know that more amount of alcohol consumptions have some serious health risks and some societal challenges that comprise accidents, addictions, and several public health challenges. Maintaining a balance among social, cultural, and economic aspects with responsible alcoholic consumption practices are main to appreciate the prominence of alcoholic beverages in a well-rounded context. The demand for alcoholic beverages will increase due to its high requirement in food and beverages industries which will help in market expansion in the coming years.
Key Takeaways
- Market Growth: Alcoholic Beverages Market was valued at USD 1,692.7 billion in 2023, It is expected to reach USD 2,624.4 billion by 2033, with a CAGR of 4.6% during the forecast period from 2024 to 2033.
- By Type: Beer dominates, while wine and spirits also hold significant market shares.
- By Alcoholic Content: High, medium, and low alcoholic content options cater to diverse preferences.
- By Category: Mass category dominates, while the premium category experiences rapid growth trends.
- By Packaging: Plastic bottles, glass bottles, and tins are common packaging options.
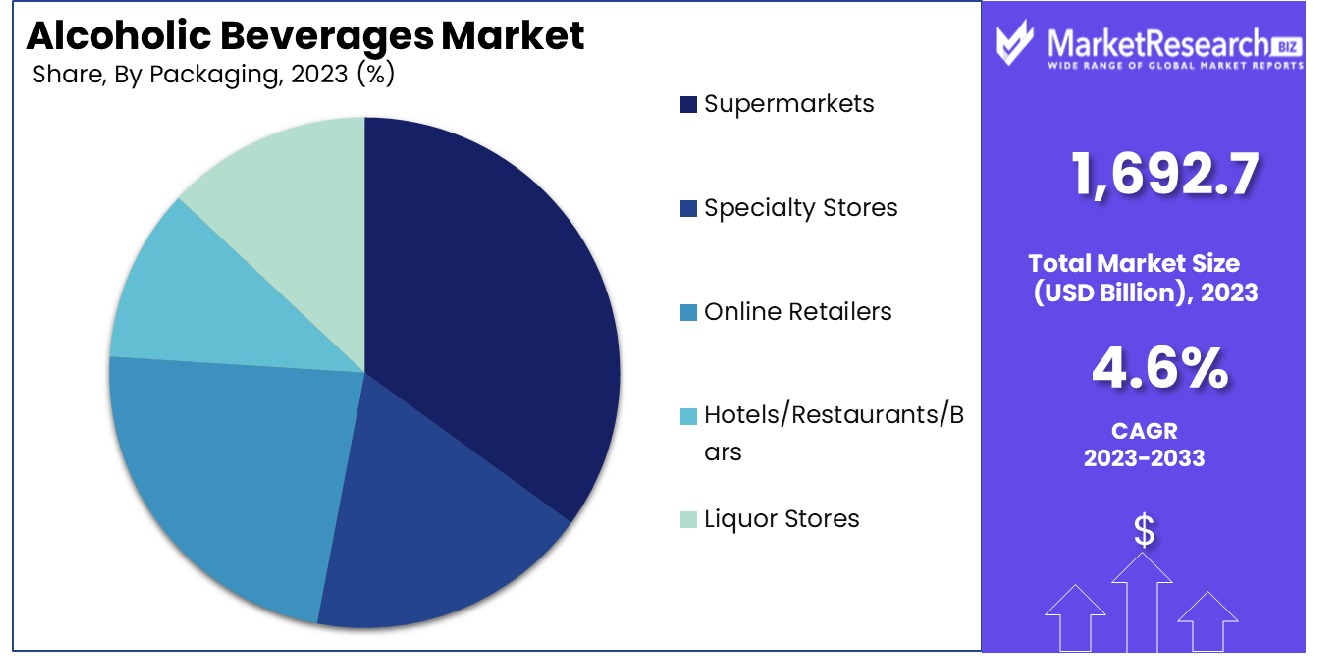
- By Distribution Channel: Supermarkets dominate the alcoholic beverages market distribution channel significantly.
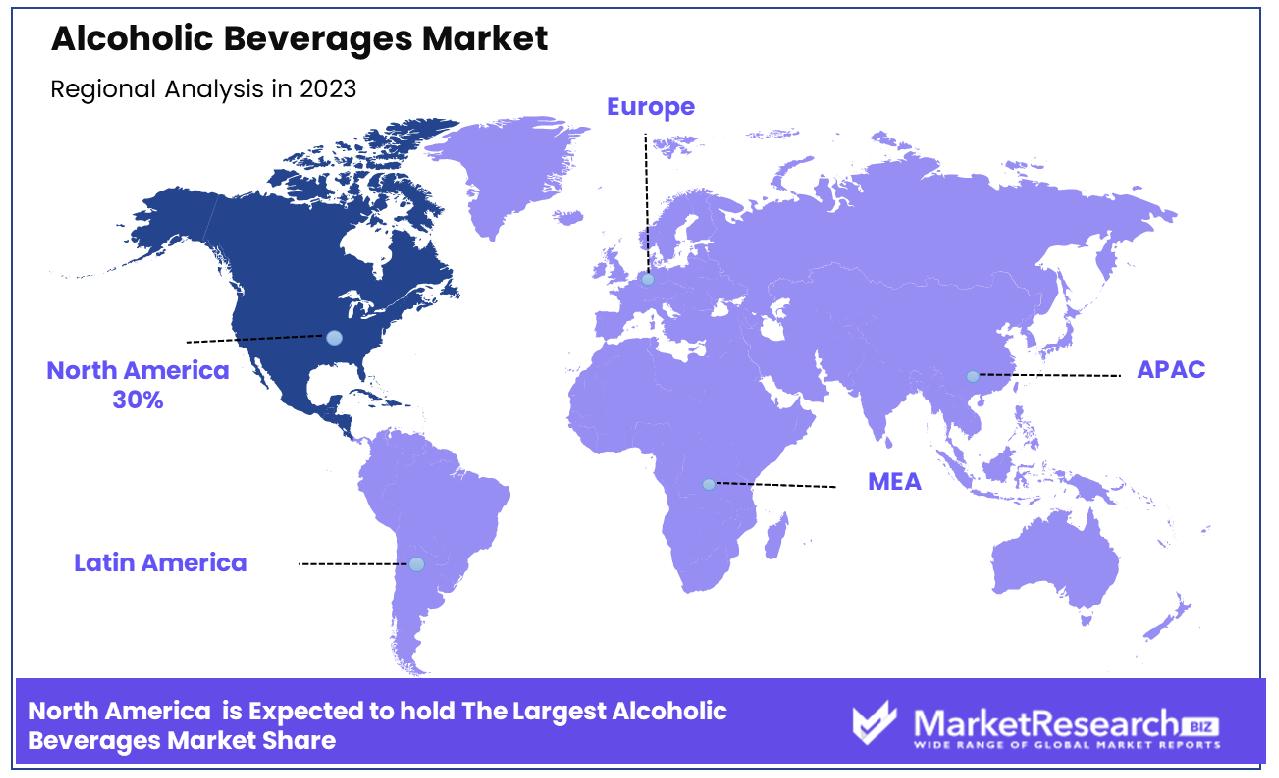
- Regional Dominance: North America Dominates with 30% Market Share in the Alcoholic Beverages Market
- Growth Opportunity: Craft and micro-distilleries offer personalized experiences, while direct-to-consumer sales empower brands, reshaping the alcoholic beverages market landscape.
Driving factors
Premiumization Drives Market Growth
The premiumization trend has significantly impacted the alcoholic beverages market, encouraging consumers to opt for higher-quality, often artisanal, products. This shift has enabled companies to command higher prices, thereby increasing revenues. According to IWSR, growth in consumer spending, with 33% of Americans spending over $50 on a single bottle of alcohol in 2022, up from 24% in 2021, underscores the value placed on quality over quantity.
This trend not only elevates consumer expectations but also spurs innovation among producers, who are motivated to craft distinguished products that stand out in a competitive market. The ripple effect of premiumization extends to enhancing brand perception and loyalty, potentially leading to sustained market growth as consumers continue to seek out premium experiences.
New Product Development Propels Market Expansion
Innovation in product development, characterized by the introduction of new flavors, packaging, and formats such as ready-to-drink cocktails and hard seltzers, has been a pivotal growth driver for the alcoholic beverages market. The surge in hard seltzer sales in the US exemplifies consumer demand for novel, convenient, and lower-calorie options. This continuous innovation not only caters to evolving consumer preferences but also opens new avenues for market expansion.
By diversifying their product portfolios, companies can reach broader audiences, including health-conscious consumers and millennials seeking variety and convenience. The dynamic nature of product development fosters a competitive environment that encourages brands to remain at the forefront of industry trends, ultimately contributing to the industry's overall growth.
E-commerce and Delivery Accelerate Market Dynamics
The proliferation of online sales and delivery services has revolutionized the alcoholic beverages market, making purchases more convenient and accessible. China's emergence as the world's largest market for online alcohol sales, with annual growth rates of 10%-20%, highlights the significant impact of e-commerce on industry dynamics. This digital transformation enables consumers to make impulsive buying decisions and access a wider range of products than available in traditional retail settings.
The convenience of e-commerce, coupled with the expansion of delivery services, not only broadens the customer base but also stimulates frequent purchases. As this trend continues, it is expected to further integrate the alcoholic beverages market into the digital economy, fostering growth through increased accessibility and consumer engagement.
Restraining Factors
Health Consciousness Curbs Alcohol Consumption
The growing trend of health consciousness among consumers significantly impacts the alcoholic beverages market. With a better understanding of alcohol's health risks and calorie content, many individuals are opting to reduce their alcohol intake or switch to alternatives perceived as healthier, such as hard seltzers, which offer lower calorie content.
This shift is evidenced by a notable decline in per capita alcohol consumption over the past decade in mature markets such as the United States and the United Kingdom, reflecting a broader trend towards wellness and moderation in consumption habits.
Regulatory Environment Tightens, Impacting Alcohol Market Dynamics
Regulatory measures, including restrictions on alcohol availability, sales hours, minimum legal drinking ages, stringent advertising regulations, and elevated taxes, significantly constrain the alcoholic beverages market's growth. For example, Scandinavian countries impose high excise taxes on alcoholic products, effectively limiting consumption levels.
Similarly, the implementation of minimum unit pricing for alcohol in Scotland in 2018 has been shown to reduce alcohol purchases. These regulations aim to mitigate alcohol-related harms but also present considerable challenges for the industry, affecting everything from market access to consumer pricing and overall demand.
By Type Analysis
Beer stands out as the dominant segment within the alcoholic beverages market. Among its sub-segments, Lager is particularly prominent, favored worldwide for its crisp and refreshing taste, making it a staple at social gatherings and sporting events. However, other sub-segments like Ale, Stout, and Craft beers play crucial roles in market growth. Craft and specialty beers, in particular, have seen a surge in popularity, as consumers increasingly seek unique flavors and artisanal brewing techniques. This trend towards diversification has encouraged innovation within the beer segment, expanding its appeal and driving growth.
Wine is another key segment, with Red Wine leading in popularity. Red wine is celebrated for its rich flavors and potential health benefits, attracting a broad consumer base. Other wine varieties, such as White, Rosé, Sparkling, and Fortified wines, contribute to the segment's diversity, catering to varying consumer preferences for different occasions. Spirits encompass a wide range of products, with Vodka and Whiskey among the most popular. Vodka's versatility in cocktails and its smooth profile appeal to a wide audience, while Whiskey — including Scotch, Bourbon, and Rye — attracts connoisseurs and casual drinkers alike with its complexity and heritage.
By Alcoholic Content Analysis
The market is segmented into High, Medium, and Low alcoholic content categories. High-alcohol beverages, often spirits, cater to consumers looking for intensity and depth in flavor. Medium and low-alcohol options, including many beers and wines, appeal to a broader audience seeking lighter, more sessionable drinking experiences. This segmentation allows brands to target specific consumer preferences and occasions, from casual social drinking to more formal celebrations.
By Category Analysis
The Mass category dominates the market, driven by widespread availability and affordability. However, the Premium segment is experiencing rapid growth, fueled by consumers' increasing willingness to pay more for higher quality, artisanal, and specialty beverages. This shift towards premiumization reflects a broader trend across consumer goods, with individuals seeking products that offer superior taste, exclusivity, and a more authentic drinking experience.
By Packaging Analysis
Packaging options like Plastic Bottles, Glass Bottles, and Tins serve different consumer needs and preferences. Glass bottles are preferred for premium products due to their ability to preserve the quality and flavor of the beverage. Plastic bottles and tins, offering convenience and portability, cater to the casual, on-the-go consumption market. The choice of packaging plays a significant role in branding and environmental sustainability, influencing consumer purchasing decisions.
By Distribution Channel Analysis
Supermarkets are the dominant distribution channel for alcoholic beverages, offering a wide selection and convenience. However, Specialty Stores, Online Retailers, Hotels/Restaurants/Bars, and Liquor Stores also play essential roles. The growth of online retail has been particularly noteworthy, expanding the market's reach and making it easier for consumers to explore and purchase a wider variety of alcoholic beverages.
Key Market Segments
By Type
Beer:
- Lager
- Ale
- Stout
- Others (Craft beer, specialty beers)
Wine:
- Red wine
- White wine
- Rosé wine
- Sparkling wine
- Fortified wine (e.g., Port, Sherry)
Spirits:
- Vodka
- Whiskey (Scotch, Bourbon, Rye, etc.)
- Rum
- Gin
- Tequila
- Brandy/Cognac
- Liqueurs
- Others (e.g., Absinthe, Akvavit)
By Alcoholic Content
- High
- Medium
- Low
By Category
- Mass
- Premium
By Packaging
- Plastic Bottles
- Glass Bottles
- Tins
By Distribution Channel
- Supermarkets
- Specialty Stores
- Online Retailers
- Hotels/Restaurants/Bars
- Liquor Stores
Growth Opportunity
Customization: A Tailored Approach Elevates the Alcoholic Beverages Market
The surge in popularity of craft and micro-distilleries underscores a burgeoning market trend towards customization in the alcoholic beverage industry sector. Consumers' growing desire for personalized experiences is met by establishments offering custom spirits and beers, which not only cater to individual preferences but also foster a sense of connection with local brands.
This shift towards small-batch, tailored offerings represents a significant departure from the traditional mass-produced alcohol industry, positioning customization as a key driver of growth. Such initiatives enable brands to differentiate themselves in a crowded market, offering a unique value proposition that appeals to a discerning clientele.
Direct-to-Consumer Sales: Redefining the Alcoholic Beverages Landscape
The adoption of direct-to-consumer (DTC) sales models by small distilleries and breweries presents a formidable opportunity within the alcoholic beverages market. By leveraging owned e-commerce platforms, producers can bypass traditional retail channels, enhancing profit margins and gaining direct insights into consumer preferences. This strategy not only facilitates a deeper understanding of market dynamics but also enables rapid product innovation in response to feedback.
The growth of DTC sales is a testament to changing consumer behaviors, with an increasing number of buyers appreciating the convenience and personalized experience of purchasing directly from producers. As such, the expansion of DTC channels is poised to reshape the alcoholic beverages market, offering a pathway for small brands to achieve significant growth.
Latest Trends
Rise of Craft Cocktails
Craft cocktails are surging in popularity, driven by consumer demand for unique, artisanal experiences. This trend emphasizes quality ingredients, innovative flavors, and skilled mixology, appealing to discerning drinkers seeking authenticity and sophistication.
Demand for Low- and No-Alcohol Options
Health-conscious consumers are driving the growth of low- and no-alcohol alternatives in the alcoholic beverages market. This trend reflects a shift towards moderation and wellness, with consumers seeking flavorful options that offer social enjoyment without the effects of traditional alcohol. The market responds with a range of innovative products, including non-alcoholic beverages spirits, beers, and wines, catering to diverse preferences and lifestyles.
Regional Analysis
North America Dominates with 30% Market Share in the Alcoholic Beverages Market
North America's substantial 30% hold on the global alcoholic beverages market is largely attributed to its vast consumer base with a high disposable income and a culturally ingrained tradition of alcohol consumption. The region's market is propelled by a diverse demographic profile, leading to a wide array of preferences that drive innovation and variety in product offerings. The United States, in particular, has a vibrant craft beer and spirits scene, which has significantly contributed to market growth. Additionally, stringent regulations ensure product quality and safety, fostering consumer trust and further driving consumption.
The North American market is characterized by a strong distribution network that spans retail and online channels, making alcoholic beverages readily accessible to consumers. The rise of e-commerce in alcohol sales, particularly during the COVID-19 pandemic, has opened new avenues for market expansion. Furthermore, the region's commitment to marketing and promotional strategies has effectively tapped into various consumer segments, from millennials seeking craft and artisanal options to older generations preferring traditional brands.
Europe: A Tradition-Steeped Market with Premium Products
Europe commands a significant share of the global alcoholic beverages market, buoyed by its rich brewing and distilling heritage and the prevalence of alcohol consumption as a cultural norm. The region excels in producing premium wines, beers, and spirits, with a strong emphasis on quality and tradition. European countries also benefit from geographical indications that protect and enhance the value of regional products. Moving forward, the market is expected to grow, albeit at a slower pace, with sustainability and innovation in packaging and product offerings driving consumer interest.
Asia Pacific: Rapid Growth Fueled by Emerging Economies
The Asia Pacific region is witnessing rapid growth in the alcoholic beverages market, driven by economic development and increasing urbanization in countries like China and India. This growth is characterized by a burgeoning middle class with more disposable income and a growing openness to Western drinking habits. The region's diverse cultures offer unique opportunities for localized and international brands alike. Future growth is expected to be robust, with increasing demand for premium and imported alcoholic beverages. However, market major players need to navigate cultural sensitivities and regulatory environments across different countries.
Key Regions and Countries
North America
- The US
- Canada
- Rest of North America
Europe
- Germany
- France
- The UK
- Spain
- Netherlands
- Russia
- Italy
- Rest of Europe
Asia-Pacific
- China
- Japan
- Singapore
- Thailand
- South Korea
- Vietnam
- India
- New Zealand
- Rest of Asia Pacific
Latin America
- Mexico
- Brazil
- Rest of Latin America
Middle East & Africa
- Saudi Arabia
- South Africa
- UAE
- Rest of Middle East & Africa
Key Players Analysis
In the vibrant landscape of the global alcoholic beverages market, several key players exert substantial influence through strategic positioning and impactful market initiatives. Anheuser-Busch InBev, the world's leading brewer, dominates with its extensive portfolio of over 500 beer brands, capitalizing on scale, diversity, and global reach to cater to varying consumer tastes and preferences. Diageo follows, commanding a significant presence in the spirits sector with iconic brands across categories, driving growth through innovation and a keen focus on premiumization.
Heineken and Carlsberg, with their global footprint, have successfully penetrated emerging markets, leveraging strong brand identity and expansive distribution networks. Pernod Ricard's strategy of owning an exhaustive portfolio of premium spirits and wines has positioned it as a key player in the luxury segment, enhancing its global standing.
Asahi Group Holdings and Constellation Brands have made strategic acquisitions to broaden their product ranges and enter new markets, signaling a trend toward consolidation in the industry for wider market reach. Brown-Forman, Bacardi, and Rémy Cointreau, with their focus on heritage and craftsmanship, continue to thrive in the premium segment, appealing to consumers seeking authenticity and quality.
Market Key Players
- Anheuser-Busch InBev
- Diageo
- Heineken
- Pernod Ricard
- China Resources Snow Breweries
- Carlsberg
- Molson Coors Beverage Company
- Kirin Holdings
- Asahi Group Holdings
- Thai Beverage
- Constellation Brands
- Brown-Forman
- Suntory Holdings
- Bacardi
- Rémy Cointreau
Recent Development
- In January 2024, Smirnoff vodka launched a new spicy tamarind variety available at ASDA and Tesco in the UK. It aims to offer a bold sweet-meets-spicy flavor experience, capitalizing on the predicted tamarind flavor trend for 2024.
- In January 2024, Mother Earth Brewing in Kinston introduced Kaya, a non-alcoholic beverage containing 3 mg of Delta 9 THC for a calming, present experience. It's aimed at providing an alternative during Dry January and promoting well-being.
- In January 2024, Coca-Cola India enters the Indian alcoholic beverage market with Lemon-Dou, a lime-flavored cocktail, as part of its strategy to diversify its product portfolio and become a total beverage company.
Report Scope
Report Features Description Market Value (2023) USD 1,692.7 Billion Forecast Revenue (2033) USD 2,624.4 Billion CAGR (2024-2032) 4.6% Base Year for Estimation 2023 Historic Period 2016-2023 Forecast Period 2024-2033 Report Coverage Revenue Forecast, Market Dynamics, COVID-19 Impact, Competitive Landscape, Recent Developments Segments Covered By Type, Beer(Lager, Ale, Stout, Others (Craft beer, specialty beers)), Wine(Red wine, White wine, Rosé wine, Sparkling wine, Fortified wine (e.g., Port, Sherry)), Spirits(Vodka, Whiskey (Scotch, Bourbon, Rye, etc.), Rum, Gin, Tequila, Brandy/Cognac, Liqueurs, Others (e.g., Absinthe, Akvavit))By Alcoholic Content(High, Medium, Low), By Category(Mass, Premium), By Packaging(Plastic Bottles, Glass Bottles, Tins), By Distribution Channel(Supermarkets, Specialty Stores, Online Retailers, Hotels/Restaurants/Bars, Liquor Stores) Regional Analysis North America - The US, Canada, Rest of North America, Europe - Germany, France, The UK, Spain, Italy, Russia, Netherlands, Rest of Europe, Asia-Pacific - China, Japan, South Korea, India, New Zealand, Singapore, Thailand, Vietnam, Rest of Asia Pacific, Latin America - Brazil, Mexico, Rest of Latin America, Middle East & Africa - South Africa, Saudi Arabia, UAE, Rest of Middle East & Africa Competitive Landscape Anheuser-Busch InBev, Diageo, Heineken, Pernod Ricard, China Resources Snow Breweries, Carlsberg, Molson Coors Beverage Company, Kirin Holdings, Asahi Group Holdings, Thai Beverage, Constellation Brands, Brown-Forman, Suntory Holdings, Bacardi, Rémy Cointreau Customization Scope Customization for segments, region/country-level will be provided. Moreover, additional customization can be done based on the requirements. Purchase Options We have three licenses to opt for Single User License, Multi-User License (Up to 5 Users), Corporate Use License (Unlimited User and Printable PDF) -
- 1. Executive Summary
- 1.1. Definition
- 1.2. Taxonomy
- 1.3. Research Scope
- 1.4. Key Analysis
- 1.5. Key Findings by Major Segments
- 1.6. Top strategies by Major Players
- 2. Global Alcoholic Beverages Market Overview
- 2.1. Alcoholic Beverages Market Dynamics
- 2.1.1. Drivers
- 2.1.2. Opportunities
- 2.1.3. Restraints
- 2.1.4. Challenges
- 2.2. Macro-economic Factors
- 2.3. Regulatory Framework
- 2.4. Market Investment Feasibility Index
- 2.5. PEST Analysis
- 2.6. PORTER’S Five Force Analysis
- 2.7. Drivers & Restraints Impact Analysis
- 2.8. Industry Chain Analysis
- 2.9. Cost Structure Analysis
- 2.10. Marketing Strategy
- 2.11. Russia-Ukraine War Impact Analysis
- 2.12. Opportunity Map Analysis
- 2.13. Market Competition Scenario Analysis
- 2.14. Product Life Cycle Analysis
- 2.15. Opportunity Orbits
- 2.16. Manufacturer Intensity Map
- 2.17. Major Companies sales by Value & Volume
- 2.1. Alcoholic Beverages Market Dynamics
- 3. Global Alcoholic Beverages Market Analysis, Opportunity and Forecast, 2016-2032
- 3.1. Global Alcoholic Beverages Market Analysis, 2016-2021
- 3.2. Global Alcoholic Beverages Market Opportunity and Forecast, 2023-2032
- 3.3. Global Alcoholic Beverages Market Analysis, Opportunity and Forecast, By By Type, 2016-2032
- 3.3.1. Global Alcoholic Beverages Market Analysis by By Type: Introduction
- 3.3.2. Market Size Absolute $ Opportunity Analysis and Forecast, By By Type, 2016-2032
- 3.3.3. Beer
- 3.3.3.1. Lager
- 3.3.3.2. Ale
- 3.3.3.3. Stout
- 3.3.3.4. Others (Craft beer, specialty beers)
- 3.3.4. Wine
- 3.3.4.1. Red wine
- 3.3.4.2. White wine
- 3.3.4.3. Rosé wine
- 3.3.4.4. Sparkling wine
- 3.3.4.5. Fortified wine (e.g., Port, Sherry)
- 3.3.5. Spirits
- 3.3.5.1. Vodka
- 3.3.5.2. Whiskey (Scotch, Bourbon, Rye, etc.)
- 3.3.5.3. Rum, Gin, Tequila
- 3.3.5.4. Brandy/Cognac, Liqueurs
- 3.3.5.5. Others (e.g., Absinthe, Akvavit)
- 3.4. Global Alcoholic Beverages Market Analysis, Opportunity and Forecast, By By Alcoholic Content, 2016-2032
- 3.4.1. Global Alcoholic Beverages Market Analysis by By Alcoholic Content: Introduction
- 3.4.2. Market Size Absolute $ Opportunity Analysis and Forecast, By By Alcoholic Content, 2016-2032
- 3.4.3. High
- 3.4.4. Medium
- 3.4.5. Low
- 3.5. Global Alcoholic Beverages Market Analysis, Opportunity and Forecast, By By Category, 2016-2032
- 3.5.1. Global Alcoholic Beverages Market Analysis by By Category: Introduction
- 3.5.2. Market Size Absolute $ Opportunity Analysis and Forecast, By By Category, 2016-2032
- 3.5.3. Mass
- 3.5.4. Premium
- 3.6. Global Alcoholic Beverages Market Analysis, Opportunity and Forecast, By By Packaging, 2016-2032
- 3.6.1. Global Alcoholic Beverages Market Analysis by By Packaging: Introduction
- 3.6.2. Market Size Absolute $ Opportunity Analysis and Forecast, By By Packaging, 2016-2032
- 3.6.3. Plastic Bottles
- 3.6.4. Glass Bottles
- 3.6.5. Tins
- 3.7. Global Alcoholic Beverages Market Analysis, Opportunity and Forecast, By By Distribution Channel, 2016-2032
- 3.7.1. Global Alcoholic Beverages Market Analysis by By Distribution Channel: Introduction
- 3.7.2. Market Size Absolute $ Opportunity Analysis and Forecast, By By Distribution Channel, 2016-2032
- 3.7.3. Supermarkets
- 3.7.4. Specialty Stores
- 3.7.5. Online Retailers
- 3.7.6. Hotels/Restaurants/Bars
- 3.7.7. Liquor Stores
- 4. North America Alcoholic Beverages Market Analysis, Opportunity and Forecast, 2016-2032
- 4.1. North America Alcoholic Beverages Market Analysis, 2016-2021
- 4.2. North America Alcoholic Beverages Market Opportunity and Forecast, 2023-2032
- 4.3. North America Alcoholic Beverages Market Analysis, Opportunity and Forecast, By By Type, 2016-2032
- 4.3.1. North America Alcoholic Beverages Market Analysis by By Type: Introduction
- 4.3.2. Market Size Absolute $ Opportunity Analysis and Forecast, By By Type, 2016-2032
- 4.3.3. Beer
- 4.3.3.1. Lager
- 4.3.3.2. Ale
- 4.3.3.3. Stout
- 4.3.3.4. Others (Craft beer, specialty beers)
- 4.3.4. Wine
- 4.3.4.1. Red wine
- 4.3.4.2. White wine
- 4.3.4.3. Rosé wine
- 4.3.4.4. Sparkling wine
- 4.3.4.5. Fortified wine (e.g., Port, Sherry)
- 4.3.5. Spirits
- 4.3.5.1. Vodka
- 4.3.5.2. Whiskey (Scotch, Bourbon, Rye, etc.)
- 4.3.5.3. Rum, Gin, Tequila
- 4.3.5.4. Brandy/Cognac, Liqueurs
- 4.3.5.5. Others (e.g., Absinthe, Akvavit)
- 4.4. North America Alcoholic Beverages Market Analysis, Opportunity and Forecast, By By Alcoholic Content, 2016-2032
- 4.4.1. North America Alcoholic Beverages Market Analysis by By Alcoholic Content: Introduction
- 4.4.2. Market Size Absolute $ Opportunity Analysis and Forecast, By By Alcoholic Content, 2016-2032
- 4.4.3. High
- 4.4.4. Medium
- 4.4.5. Low
- 4.5. North America Alcoholic Beverages Market Analysis, Opportunity and Forecast, By By Category, 2016-2032
- 4.5.1. North America Alcoholic Beverages Market Analysis by By Category: Introduction
- 4.5.2. Market Size Absolute $ Opportunity Analysis and Forecast, By By Category, 2016-2032
- 4.5.3. Mass
- 4.5.4. Premium
- 4.6. North America Alcoholic Beverages Market Analysis, Opportunity and Forecast, By By Packaging, 2016-2032
- 4.6.1. North America Alcoholic Beverages Market Analysis by By Packaging: Introduction
- 4.6.2. Market Size Absolute $ Opportunity Analysis and Forecast, By By Packaging, 2016-2032
- 4.6.3. Plastic Bottles
- 4.6.4. Glass Bottles
- 4.6.5. Tins
- 4.7. North America Alcoholic Beverages Market Analysis, Opportunity and Forecast, By By Distribution Channel, 2016-2032
- 4.7.1. North America Alcoholic Beverages Market Analysis by By Distribution Channel: Introduction
- 4.7.2. Market Size Absolute $ Opportunity Analysis and Forecast, By By Distribution Channel, 2016-2032
- 4.7.3. Supermarkets
- 4.7.4. Specialty Stores
- 4.7.5. Online Retailers
- 4.7.6. Hotels/Restaurants/Bars
- 4.7.7. Liquor Stores
- 4.8. North America Alcoholic Beverages Market Analysis, Opportunity and Forecast, By Country , 2016-2032
- 4.8.1. North America Alcoholic Beverages Market Analysis by Country : Introduction
- 4.8.2. Market Size Absolute $ Opportunity Analysis and Forecast, Country , 2016-2032
- 4.8.2.1. The US
- 4.8.2.2. Canada
- 4.8.2.3. Mexico
- 5. Western Europe Alcoholic Beverages Market Analysis, Opportunity and Forecast, 2016-2032
- 5.1. Western Europe Alcoholic Beverages Market Analysis, 2016-2021
- 5.2. Western Europe Alcoholic Beverages Market Opportunity and Forecast, 2023-2032
- 5.3. Western Europe Alcoholic Beverages Market Analysis, Opportunity and Forecast, By By Type, 2016-2032
- 5.3.1. Western Europe Alcoholic Beverages Market Analysis by By Type: Introduction
- 5.3.2. Market Size Absolute $ Opportunity Analysis and Forecast, By By Type, 2016-2032
- 5.3.3. Beer
- 5.3.3.1. Lager
- 5.3.3.2. Ale
- 5.3.3.3. Stout
- 5.3.3.4. Others (Craft beer, specialty beers)
- 5.3.4. Wine
- 5.3.4.1. Red wine
- 5.3.4.2. White wine
- 5.3.4.3. Rosé wine
- 5.3.4.4. Sparkling wine
- 5.3.4.5. Fortified wine (e.g., Port, Sherry)
- 5.3.5. Spirits
- 5.3.5.1. Vodka
- 5.3.5.2. Whiskey (Scotch, Bourbon, Rye, etc.)
- 5.3.5.3. Rum, Gin, Tequila
- 5.3.5.4. Brandy/Cognac, Liqueurs
- 5.3.5.5. Others (e.g., Absinthe, Akvavit)
- 5.4. Western Europe Alcoholic Beverages Market Analysis, Opportunity and Forecast, By By Alcoholic Content, 2016-2032
- 5.4.1. Western Europe Alcoholic Beverages Market Analysis by By Alcoholic Content: Introduction
- 5.4.2. Market Size Absolute $ Opportunity Analysis and Forecast, By By Alcoholic Content, 2016-2032
- 5.4.3. High
- 5.4.4. Medium
- 5.4.5. Low
- 5.5. Western Europe Alcoholic Beverages Market Analysis, Opportunity and Forecast, By By Category, 2016-2032
- 5.5.1. Western Europe Alcoholic Beverages Market Analysis by By Category: Introduction
- 5.5.2. Market Size Absolute $ Opportunity Analysis and Forecast, By By Category, 2016-2032
- 5.5.3. Mass
- 5.5.4. Premium
- 5.6. Western Europe Alcoholic Beverages Market Analysis, Opportunity and Forecast, By By Packaging, 2016-2032
- 5.6.1. Western Europe Alcoholic Beverages Market Analysis by By Packaging: Introduction
- 5.6.2. Market Size Absolute $ Opportunity Analysis and Forecast, By By Packaging, 2016-2032
- 5.6.3. Plastic Bottles
- 5.6.4. Glass Bottles
- 5.6.5. Tins
- 5.7. Western Europe Alcoholic Beverages Market Analysis, Opportunity and Forecast, By By Distribution Channel, 2016-2032
- 5.7.1. Western Europe Alcoholic Beverages Market Analysis by By Distribution Channel: Introduction
- 5.7.2. Market Size Absolute $ Opportunity Analysis and Forecast, By By Distribution Channel, 2016-2032
- 5.7.3. Supermarkets
- 5.7.4. Specialty Stores
- 5.7.5. Online Retailers
- 5.7.6. Hotels/Restaurants/Bars
- 5.7.7. Liquor Stores
- 5.8. Western Europe Alcoholic Beverages Market Analysis, Opportunity and Forecast, By Country , 2016-2032
- 5.8.1. Western Europe Alcoholic Beverages Market Analysis by Country : Introduction
- 5.8.2. Market Size Absolute $ Opportunity Analysis and Forecast, Country , 2016-2032
- 5.8.2.1. Germany
- 5.8.2.2. France
- 5.8.2.3. The UK
- 5.8.2.4. Spain
- 5.8.2.5. Italy
- 5.8.2.6. Portugal
- 5.8.2.7. Ireland
- 5.8.2.8. Austria
- 5.8.2.9. Switzerland
- 5.8.2.10. Benelux
- 5.8.2.11. Nordic
- 5.8.2.12. Rest of Western Europe
- 6. Eastern Europe Alcoholic Beverages Market Analysis, Opportunity and Forecast, 2016-2032
- 6.1. Eastern Europe Alcoholic Beverages Market Analysis, 2016-2021
- 6.2. Eastern Europe Alcoholic Beverages Market Opportunity and Forecast, 2023-2032
- 6.3. Eastern Europe Alcoholic Beverages Market Analysis, Opportunity and Forecast, By By Type, 2016-2032
- 6.3.1. Eastern Europe Alcoholic Beverages Market Analysis by By Type: Introduction
- 6.3.2. Market Size Absolute $ Opportunity Analysis and Forecast, By By Type, 2016-2032
- 6.3.3. Beer
- 6.3.3.1. Lager
- 6.3.3.2. Ale
- 6.3.3.3. Stout
- 6.3.3.4. Others (Craft beer, specialty beers)
- 6.3.4. Wine
- 6.3.4.1. Red wine
- 6.3.4.2. White wine
- 6.3.4.3. Rosé wine
- 6.3.4.4. Sparkling wine
- 6.3.4.5. Fortified wine (e.g., Port, Sherry)
- 6.3.5. Spirits
- 6.3.5.1. Vodka
- 6.3.5.2. Whiskey (Scotch, Bourbon, Rye, etc.)
- 6.3.5.3. Rum, Gin, Tequila
- 6.3.5.4. Brandy/Cognac, Liqueurs
- 6.3.5.5. Others (e.g., Absinthe, Akvavit)
- 6.4. Eastern Europe Alcoholic Beverages Market Analysis, Opportunity and Forecast, By By Alcoholic Content, 2016-2032
- 6.4.1. Eastern Europe Alcoholic Beverages Market Analysis by By Alcoholic Content: Introduction
- 6.4.2. Market Size Absolute $ Opportunity Analysis and Forecast, By By Alcoholic Content, 2016-2032
- 6.4.3. High
- 6.4.4. Medium
- 6.4.5. Low
- 6.5. Eastern Europe Alcoholic Beverages Market Analysis, Opportunity and Forecast, By By Category, 2016-2032
- 6.5.1. Eastern Europe Alcoholic Beverages Market Analysis by By Category: Introduction
- 6.5.2. Market Size Absolute $ Opportunity Analysis and Forecast, By By Category, 2016-2032
- 6.5.3. Mass
- 6.5.4. Premium
- 6.6. Eastern Europe Alcoholic Beverages Market Analysis, Opportunity and Forecast, By By Packaging, 2016-2032
- 6.6.1. Eastern Europe Alcoholic Beverages Market Analysis by By Packaging: Introduction
- 6.6.2. Market Size Absolute $ Opportunity Analysis and Forecast, By By Packaging, 2016-2032
- 6.6.3. Plastic Bottles
- 6.6.4. Glass Bottles
- 6.6.5. Tins
- 6.7. Eastern Europe Alcoholic Beverages Market Analysis, Opportunity and Forecast, By By Distribution Channel, 2016-2032
- 6.7.1. Eastern Europe Alcoholic Beverages Market Analysis by By Distribution Channel: Introduction
- 6.7.2. Market Size Absolute $ Opportunity Analysis and Forecast, By By Distribution Channel, 2016-2032
- 6.7.3. Supermarkets
- 6.7.4. Specialty Stores
- 6.7.5. Online Retailers
- 6.7.6. Hotels/Restaurants/Bars
- 6.7.7. Liquor Stores
- 6.8. Eastern Europe Alcoholic Beverages Market Analysis, Opportunity and Forecast, By Country , 2016-2032
- 6.8.1. Eastern Europe Alcoholic Beverages Market Analysis by Country : Introduction
- 6.8.2. Market Size Absolute $ Opportunity Analysis and Forecast, Country , 2016-2032
- 6.8.2.1. Russia
- 6.8.2.2. Poland
- 6.8.2.3. The Czech Republic
- 6.8.2.4. Greece
- 6.8.2.5. Rest of Eastern Europe
- 7. APAC Alcoholic Beverages Market Analysis, Opportunity and Forecast, 2016-2032
- 7.1. APAC Alcoholic Beverages Market Analysis, 2016-2021
- 7.2. APAC Alcoholic Beverages Market Opportunity and Forecast, 2023-2032
- 7.3. APAC Alcoholic Beverages Market Analysis, Opportunity and Forecast, By By Type, 2016-2032
- 7.3.1. APAC Alcoholic Beverages Market Analysis by By Type: Introduction
- 7.3.2. Market Size Absolute $ Opportunity Analysis and Forecast, By By Type, 2016-2032
- 7.3.3. Beer
- 7.3.3.1. Lager
- 7.3.3.2. Ale
- 7.3.3.3. Stout
- 7.3.3.4. Others (Craft beer, specialty beers)
- 7.3.4. Wine
- 7.3.4.1. Red wine
- 7.3.4.2. White wine
- 7.3.4.3. Rosé wine
- 7.3.4.4. Sparkling wine
- 7.3.4.5. Fortified wine (e.g., Port, Sherry)
- 7.3.5. Spirits
- 7.3.5.1. Vodka
- 7.3.5.2. Whiskey (Scotch, Bourbon, Rye, etc.)
- 7.3.5.3. Rum, Gin, Tequila
- 7.3.5.4. Brandy/Cognac, Liqueurs
- 7.3.5.5. Others (e.g., Absinthe, Akvavit)
- 7.4. APAC Alcoholic Beverages Market Analysis, Opportunity and Forecast, By By Alcoholic Content, 2016-2032
- 7.4.1. APAC Alcoholic Beverages Market Analysis by By Alcoholic Content: Introduction
- 7.4.2. Market Size Absolute $ Opportunity Analysis and Forecast, By By Alcoholic Content, 2016-2032
- 7.4.3. High
- 7.4.4. Medium
- 7.4.5. Low
- 7.5. APAC Alcoholic Beverages Market Analysis, Opportunity and Forecast, By By Category, 2016-2032
- 7.5.1. APAC Alcoholic Beverages Market Analysis by By Category: Introduction
- 7.5.2. Market Size Absolute $ Opportunity Analysis and Forecast, By By Category, 2016-2032
- 7.5.3. Mass
- 7.5.4. Premium
- 7.6. APAC Alcoholic Beverages Market Analysis, Opportunity and Forecast, By By Packaging, 2016-2032
- 7.6.1. APAC Alcoholic Beverages Market Analysis by By Packaging: Introduction
- 7.6.2. Market Size Absolute $ Opportunity Analysis and Forecast, By By Packaging, 2016-2032
- 7.6.3. Plastic Bottles
- 7.6.4. Glass Bottles
- 7.6.5. Tins
- 7.7. APAC Alcoholic Beverages Market Analysis, Opportunity and Forecast, By By Distribution Channel, 2016-2032
- 7.7.1. APAC Alcoholic Beverages Market Analysis by By Distribution Channel: Introduction
- 7.7.2. Market Size Absolute $ Opportunity Analysis and Forecast, By By Distribution Channel, 2016-2032
- 7.7.3. Supermarkets
- 7.7.4. Specialty Stores
- 7.7.5. Online Retailers
- 7.7.6. Hotels/Restaurants/Bars
- 7.7.7. Liquor Stores
- 7.8. APAC Alcoholic Beverages Market Analysis, Opportunity and Forecast, By Country , 2016-2032
- 7.8.1. APAC Alcoholic Beverages Market Analysis by Country : Introduction
- 7.8.2. Market Size Absolute $ Opportunity Analysis and Forecast, Country , 2016-2032
- 7.8.2.1. China
- 7.8.2.2. Japan
- 7.8.2.3. South Korea
- 7.8.2.4. India
- 7.8.2.5. Australia & New Zeland
- 7.8.2.6. Indonesia
- 7.8.2.7. Malaysia
- 7.8.2.8. Philippines
- 7.8.2.9. Singapore
- 7.8.2.10. Thailand
- 7.8.2.11. Vietnam
- 7.8.2.12. Rest of APAC
- 8. Latin America Alcoholic Beverages Market Analysis, Opportunity and Forecast, 2016-2032
- 8.1. Latin America Alcoholic Beverages Market Analysis, 2016-2021
- 8.2. Latin America Alcoholic Beverages Market Opportunity and Forecast, 2023-2032
- 8.3. Latin America Alcoholic Beverages Market Analysis, Opportunity and Forecast, By By Type, 2016-2032
- 8.3.1. Latin America Alcoholic Beverages Market Analysis by By Type: Introduction
- 8.3.2. Market Size Absolute $ Opportunity Analysis and Forecast, By By Type, 2016-2032
- 8.3.3. Beer
- 8.3.3.1. Lager
- 8.3.3.2. Ale
- 8.3.3.3. Stout
- 8.3.3.4. Others (Craft beer, specialty beers)
- 8.3.4. Wine
- 8.3.4.1. Red wine
- 8.3.4.2. White wine
- 8.3.4.3. Rosé wine
- 8.3.4.4. Sparkling wine
- 8.3.4.5. Fortified wine (e.g., Port, Sherry)
- 8.3.5. Spirits
- 8.3.5.1. Vodka
- 8.3.5.2. Whiskey (Scotch, Bourbon, Rye, etc.)
- 8.3.5.3. Rum, Gin, Tequila
- 8.3.5.4. Brandy/Cognac, Liqueurs
- 8.3.5.5. Others (e.g., Absinthe, Akvavit)
- 8.4. Latin America Alcoholic Beverages Market Analysis, Opportunity and Forecast, By By Alcoholic Content, 2016-2032
- 8.4.1. Latin America Alcoholic Beverages Market Analysis by By Alcoholic Content: Introduction
- 8.4.2. Market Size Absolute $ Opportunity Analysis and Forecast, By By Alcoholic Content, 2016-2032
- 8.4.3. High
- 8.4.4. Medium
- 8.4.5. Low
- 8.5. Latin America Alcoholic Beverages Market Analysis, Opportunity and Forecast, By By Category, 2016-2032
- 8.5.1. Latin America Alcoholic Beverages Market Analysis by By Category: Introduction
- 8.5.2. Market Size Absolute $ Opportunity Analysis and Forecast, By By Category, 2016-2032
- 8.5.3. Mass
- 8.5.4. Premium
- 8.6. Latin America Alcoholic Beverages Market Analysis, Opportunity and Forecast, By By Packaging, 2016-2032
- 8.6.1. Latin America Alcoholic Beverages Market Analysis by By Packaging: Introduction
- 8.6.2. Market Size Absolute $ Opportunity Analysis and Forecast, By By Packaging, 2016-2032
- 8.6.3. Plastic Bottles
- 8.6.4. Glass Bottles
- 8.6.5. Tins
- 8.7. Latin America Alcoholic Beverages Market Analysis, Opportunity and Forecast, By By Distribution Channel, 2016-2032
- 8.7.1. Latin America Alcoholic Beverages Market Analysis by By Distribution Channel: Introduction
- 8.7.2. Market Size Absolute $ Opportunity Analysis and Forecast, By By Distribution Channel, 2016-2032
- 8.7.3. Supermarkets
- 8.7.4. Specialty Stores
- 8.7.5. Online Retailers
- 8.7.6. Hotels/Restaurants/Bars
- 8.7.7. Liquor Stores
- 8.8. Latin America Alcoholic Beverages Market Analysis, Opportunity and Forecast, By Country , 2016-2032
- 8.8.1. Latin America Alcoholic Beverages Market Analysis by Country : Introduction
- 8.8.2. Market Size Absolute $ Opportunity Analysis and Forecast, Country , 2016-2032
- 8.8.2.1. Brazil
- 8.8.2.2. Colombia
- 8.8.2.3. Chile
- 8.8.2.4. Argentina
- 8.8.2.5. Costa Rica
- 8.8.2.6. Rest of Latin America
- 9. Middle East & Africa Alcoholic Beverages Market Analysis, Opportunity and Forecast, 2016-2032
- 9.1. Middle East & Africa Alcoholic Beverages Market Analysis, 2016-2021
- 9.2. Middle East & Africa Alcoholic Beverages Market Opportunity and Forecast, 2023-2032
- 9.3. Middle East & Africa Alcoholic Beverages Market Analysis, Opportunity and Forecast, By By Type, 2016-2032
- 9.3.1. Middle East & Africa Alcoholic Beverages Market Analysis by By Type: Introduction
- 9.3.2. Market Size Absolute $ Opportunity Analysis and Forecast, By By Type, 2016-2032
- 9.3.3. Beer
- 9.3.3.1. Lager
- 9.3.3.2. Ale
- 9.3.3.3. Stout
- 9.3.3.4. Others (Craft beer, specialty beers)
- 9.3.4. Wine
- 9.3.4.1. Red wine
- 9.3.4.2. White wine
- 9.3.4.3. Rosé wine
- 9.3.4.4. Sparkling wine
- 9.3.4.5. Fortified wine (e.g., Port, Sherry)
- 9.3.5. Spirits
- 9.3.5.1. Vodka
- 9.3.5.2. Whiskey (Scotch, Bourbon, Rye, etc.)
- 9.3.5.3. Rum, Gin, Tequila
- 9.3.5.4. Brandy/Cognac, Liqueurs
- 9.3.5.5. Others (e.g., Absinthe, Akvavit)
- 9.4. Middle East & Africa Alcoholic Beverages Market Analysis, Opportunity and Forecast, By By Alcoholic Content, 2016-2032
- 9.4.1. Middle East & Africa Alcoholic Beverages Market Analysis by By Alcoholic Content: Introduction
- 9.4.2. Market Size Absolute $ Opportunity Analysis and Forecast, By By Alcoholic Content, 2016-2032
- 9.4.3. High
- 9.4.4. Medium
- 9.4.5. Low
- 9.5. Middle East & Africa Alcoholic Beverages Market Analysis, Opportunity and Forecast, By By Category, 2016-2032
- 9.5.1. Middle East & Africa Alcoholic Beverages Market Analysis by By Category: Introduction
- 9.5.2. Market Size Absolute $ Opportunity Analysis and Forecast, By By Category, 2016-2032
- 9.5.3. Mass
- 9.5.4. Premium
- 9.6. Middle East & Africa Alcoholic Beverages Market Analysis, Opportunity and Forecast, By By Packaging, 2016-2032
- 9.6.1. Middle East & Africa Alcoholic Beverages Market Analysis by By Packaging: Introduction
- 9.6.2. Market Size Absolute $ Opportunity Analysis and Forecast, By By Packaging, 2016-2032
- 9.6.3. Plastic Bottles
- 9.6.4. Glass Bottles
- 9.6.5. Tins
- 9.7. Middle East & Africa Alcoholic Beverages Market Analysis, Opportunity and Forecast, By By Distribution Channel, 2016-2032
- 9.7.1. Middle East & Africa Alcoholic Beverages Market Analysis by By Distribution Channel: Introduction
- 9.7.2. Market Size Absolute $ Opportunity Analysis and Forecast, By By Distribution Channel, 2016-2032
- 9.7.3. Supermarkets
- 9.7.4. Specialty Stores
- 9.7.5. Online Retailers
- 9.7.6. Hotels/Restaurants/Bars
- 9.7.7. Liquor Stores
- 9.8. Middle East & Africa Alcoholic Beverages Market Analysis, Opportunity and Forecast, By Country , 2016-2032
- 9.8.1. Middle East & Africa Alcoholic Beverages Market Analysis by Country : Introduction
- 9.8.2. Market Size Absolute $ Opportunity Analysis and Forecast, Country , 2016-2032
- 9.8.2.1. Algeria
- 9.8.2.2. Egypt
- 9.8.2.3. Israel
- 9.8.2.4. Kuwait
- 9.8.2.5. Nigeria
- 9.8.2.6. Saudi Arabia
- 9.8.2.7. South Africa
- 9.8.2.8. Turkey
- 9.8.2.9. The UAE
- 9.8.2.10. Rest of MEA
- 10. Global Alcoholic Beverages Market Analysis, Opportunity and Forecast, By Region , 2016-2032
- 10.1. Global Alcoholic Beverages Market Analysis by Region : Introduction
- 10.2. Market Size Absolute $ Opportunity Analysis and Forecast, By Region , 2016-2032
- 10.2.1. North America
- 10.2.2. Western Europe
- 10.2.3. Eastern Europe
- 10.2.4. APAC
- 10.2.5. Latin America
- 10.2.6. Middle East & Africa
- 11. Global Alcoholic Beverages Market Competitive Landscape, Market Share Analysis, and Company Profiles
- 11.1. Market Share Analysis
- 11.2. Company Profiles
- 11.3. Anheuser-Busch InBev
- 11.3.1. Company Overview
- 11.3.2. Financial Highlights
- 11.3.3. Product Portfolio
- 11.3.4. SWOT Analysis
- 11.3.5. Key Strategies and Developments
- 11.4. Diageo
- 11.4.1. Company Overview
- 11.4.2. Financial Highlights
- 11.4.3. Product Portfolio
- 11.4.4. SWOT Analysis
- 11.4.5. Key Strategies and Developments
- 11.5. Heineken
- 11.5.1. Company Overview
- 11.5.2. Financial Highlights
- 11.5.3. Product Portfolio
- 11.5.4. SWOT Analysis
- 11.5.5. Key Strategies and Developments
- 11.6. Pernod Ricard
- 11.6.1. Company Overview
- 11.6.2. Financial Highlights
- 11.6.3. Product Portfolio
- 11.6.4. SWOT Analysis
- 11.6.5. Key Strategies and Developments
- 11.7. China Resources Snow Breweries
- 11.7.1. Company Overview
- 11.7.2. Financial Highlights
- 11.7.3. Product Portfolio
- 11.7.4. SWOT Analysis
- 11.7.5. Key Strategies and Developments
- 11.8. Carlsberg
- 11.8.1. Company Overview
- 11.8.2. Financial Highlights
- 11.8.3. Product Portfolio
- 11.8.4. SWOT Analysis
- 11.8.5. Key Strategies and Developments
- 11.9. Molson Coors Beverage Company
- 11.9.1. Company Overview
- 11.9.2. Financial Highlights
- 11.9.3. Product Portfolio
- 11.9.4. SWOT Analysis
- 11.9.5. Key Strategies and Developments
- 11.10. Kirin Holdings
- 11.10.1. Company Overview
- 11.10.2. Financial Highlights
- 11.10.3. Product Portfolio
- 11.10.4. SWOT Analysis
- 11.10.5. Key Strategies and Developments
- 11.11. Asahi Group Holdings
- 11.11.1. Company Overview
- 11.11.2. Financial Highlights
- 11.11.3. Product Portfolio
- 11.11.4. SWOT Analysis
- 11.11.5. Key Strategies and Developments
- 11.12. Thai Beverage
- 11.12.1. Company Overview
- 11.12.2. Financial Highlights
- 11.12.3. Product Portfolio
- 11.12.4. SWOT Analysis
- 11.12.5. Key Strategies and Developments
- 11.13.1. Company Overview
- 11.13.2. Financial Highlights
- 11.13.3. Product Portfolio
- 11.13.4. SWOT Analysis
- 11.13.5. Key Strategies and Developments
- 11.14. Constellation Brands
- 11.14.1. Company Overview
- 11.14.2. Financial Highlights
- 11.14.3. Product Portfolio
- 11.14.4. SWOT Analysis
- 11.14.5. Key Strategies and Developments
- 11.15. Suntory Holdings
- 11.15.1. Company Overview
- 11.15.2. Financial Highlights
- 11.15.3. Product Portfolio
- 11.15.4. SWOT Analysis
- 11.15.5. Key Strategies and Developments
- 11.16. Bacardi
- 11.16.1. Company Overview
- 11.16.2. Financial Highlights
- 11.16.3. Product Portfolio
- 11.16.4. SWOT Analysis
- 11.16.5. Key Strategies and Developments
- 11.17. Rémy Cointreau
- 11.17.1. Company Overview
- 11.17.2. Financial Highlights
- 11.17.3. Product Portfolio
- 11.17.4. SWOT Analysis
- 11.17.5. Key Strategies and Developments
- 12. Assumptions and Acronyms
- 13. Research Methodology
- 14. Contact
"
- List of Figures
- "
- Figure 1: Global Alcoholic Beverages Market Revenue (US$ Mn) Market Share by By Type in 2022
- Figure 2: Global Alcoholic Beverages Market Market Attractiveness Analysis by By Type, 2016-2032
- Figure 3: Global Alcoholic Beverages Market Revenue (US$ Mn) Market Share by By Alcoholic Contentin 2022
- Figure 4: Global Alcoholic Beverages Market Market Attractiveness Analysis by By Alcoholic Content, 2016-2032
- Figure 5: Global Alcoholic Beverages Market Revenue (US$ Mn) Market Share by By Categoryin 2022
- Figure 6: Global Alcoholic Beverages Market Market Attractiveness Analysis by By Category, 2016-2032
- Figure 7: Global Alcoholic Beverages Market Revenue (US$ Mn) Market Share by By Packagingin 2022
- Figure 8: Global Alcoholic Beverages Market Market Attractiveness Analysis by By Packaging, 2016-2032
- Figure 9: Global Alcoholic Beverages Market Revenue (US$ Mn) Market Share by By Distribution Channelin 2022
- Figure 10: Global Alcoholic Beverages Market Market Attractiveness Analysis by By Distribution Channel, 2016-2032
- Figure 11: Global Alcoholic Beverages Market Revenue (US$ Mn) Market Share by Region in 2022
- Figure 12: Global Alcoholic Beverages Market Market Attractiveness Analysis by Region, 2016-2032
- Figure 13: Global Alcoholic Beverages Market Market Revenue (US$ Mn) (2016-2032)
- Figure 14: Global Alcoholic Beverages Market Market Revenue (US$ Mn) Comparison by Region (2016-2032)
- Figure 15: Global Alcoholic Beverages Market Market Revenue (US$ Mn) Comparison by By Type (2016-2032)
- Figure 16: Global Alcoholic Beverages Market Market Revenue (US$ Mn) Comparison by By Alcoholic Content (2016-2032)
- Figure 17: Global Alcoholic Beverages Market Market Revenue (US$ Mn) Comparison by By Category (2016-2032)
- Figure 18: Global Alcoholic Beverages Market Market Revenue (US$ Mn) Comparison by By Packaging (2016-2032)
- Figure 19: Global Alcoholic Beverages Market Market Revenue (US$ Mn) Comparison by By Distribution Channel (2016-2032)
- Figure 20: Global Alcoholic Beverages Market Market Y-o-Y Growth Rate Comparison by Region (2016-2032)
- Figure 21: Global Alcoholic Beverages Market Market Y-o-Y Growth Rate Comparison by By Type (2016-2032)
- Figure 22: Global Alcoholic Beverages Market Market Y-o-Y Growth Rate Comparison by By Alcoholic Content (2016-2032)
- Figure 23: Global Alcoholic Beverages Market Market Y-o-Y Growth Rate Comparison by By Category (2016-2032)
- Figure 24: Global Alcoholic Beverages Market Market Y-o-Y Growth Rate Comparison by By Packaging (2016-2032)
- Figure 25: Global Alcoholic Beverages Market Market Y-o-Y Growth Rate Comparison by By Distribution Channel (2016-2032)
- Figure 26: Global Alcoholic Beverages Market Market Share Comparison by Region (2016-2032)
- Figure 27: Global Alcoholic Beverages Market Market Share Comparison by By Type (2016-2032)
- Figure 28: Global Alcoholic Beverages Market Market Share Comparison by By Alcoholic Content (2016-2032)
- Figure 29: Global Alcoholic Beverages Market Market Share Comparison by By Category (2016-2032)
- Figure 30: Global Alcoholic Beverages Market Market Share Comparison by By Packaging (2016-2032)
- Figure 31: Global Alcoholic Beverages Market Market Share Comparison by By Distribution Channel (2016-2032)
- Figure 32: North America Alcoholic Beverages Market Revenue (US$ Mn) Market Share by By Typein 2022
- Figure 33: North America Alcoholic Beverages Market Market Attractiveness Analysis by By Type, 2016-2032
- Figure 34: North America Alcoholic Beverages Market Revenue (US$ Mn) Market Share by By Alcoholic Contentin 2022
- Figure 35: North America Alcoholic Beverages Market Market Attractiveness Analysis by By Alcoholic Content, 2016-2032
- Figure 36: North America Alcoholic Beverages Market Revenue (US$ Mn) Market Share by By Categoryin 2022
- Figure 37: North America Alcoholic Beverages Market Market Attractiveness Analysis by By Category, 2016-2032
- Figure 38: North America Alcoholic Beverages Market Revenue (US$ Mn) Market Share by By Packagingin 2022
- Figure 39: North America Alcoholic Beverages Market Market Attractiveness Analysis by By Packaging, 2016-2032
- Figure 40: North America Alcoholic Beverages Market Revenue (US$ Mn) Market Share by By Distribution Channelin 2022
- Figure 41: North America Alcoholic Beverages Market Market Attractiveness Analysis by By Distribution Channel, 2016-2032
- Figure 42: North America Alcoholic Beverages Market Revenue (US$ Mn) Market Share by Country in 2022
- Figure 43: North America Alcoholic Beverages Market Market Attractiveness Analysis by Country, 2016-2032
- Figure 44: North America Alcoholic Beverages Market Market Revenue (US$ Mn) (2016-2032)
- Figure 45: North America Alcoholic Beverages Market Market Revenue (US$ Mn) Comparison by Country (2016-2032)
- Figure 46: North America Alcoholic Beverages Market Market Revenue (US$ Mn) Comparison by By Type (2016-2032)
- Figure 47: North America Alcoholic Beverages Market Market Revenue (US$ Mn) Comparison by By Alcoholic Content (2016-2032)
- Figure 48: North America Alcoholic Beverages Market Market Revenue (US$ Mn) Comparison by By Category (2016-2032)
- Figure 49: North America Alcoholic Beverages Market Market Revenue (US$ Mn) Comparison by By Packaging (2016-2032)
- Figure 50: North America Alcoholic Beverages Market Market Revenue (US$ Mn) Comparison by By Distribution Channel (2016-2032)
- Figure 51: North America Alcoholic Beverages Market Market Y-o-Y Growth Rate Comparison by Country (2016-2032)
- Figure 52: North America Alcoholic Beverages Market Market Y-o-Y Growth Rate Comparison by By Type (2016-2032)
- Figure 53: North America Alcoholic Beverages Market Market Y-o-Y Growth Rate Comparison by By Alcoholic Content (2016-2032)
- Figure 54: North America Alcoholic Beverages Market Market Y-o-Y Growth Rate Comparison by By Category (2016-2032)
- Figure 55: North America Alcoholic Beverages Market Market Y-o-Y Growth Rate Comparison by By Packaging (2016-2032)
- Figure 56: North America Alcoholic Beverages Market Market Y-o-Y Growth Rate Comparison by By Distribution Channel (2016-2032)
- Figure 57: North America Alcoholic Beverages Market Market Share Comparison by Country (2016-2032)
- Figure 58: North America Alcoholic Beverages Market Market Share Comparison by By Type (2016-2032)
- Figure 59: North America Alcoholic Beverages Market Market Share Comparison by By Alcoholic Content (2016-2032)
- Figure 60: North America Alcoholic Beverages Market Market Share Comparison by By Category (2016-2032)
- Figure 61: North America Alcoholic Beverages Market Market Share Comparison by By Packaging (2016-2032)
- Figure 62: North America Alcoholic Beverages Market Market Share Comparison by By Distribution Channel (2016-2032)
- Figure 63: Western Europe Alcoholic Beverages Market Revenue (US$ Mn) Market Share by By Typein 2022
- Figure 64: Western Europe Alcoholic Beverages Market Market Attractiveness Analysis by By Type, 2016-2032
- Figure 65: Western Europe Alcoholic Beverages Market Revenue (US$ Mn) Market Share by By Alcoholic Contentin 2022
- Figure 66: Western Europe Alcoholic Beverages Market Market Attractiveness Analysis by By Alcoholic Content, 2016-2032
- Figure 67: Western Europe Alcoholic Beverages Market Revenue (US$ Mn) Market Share by By Categoryin 2022
- Figure 68: Western Europe Alcoholic Beverages Market Market Attractiveness Analysis by By Category, 2016-2032
- Figure 69: Western Europe Alcoholic Beverages Market Revenue (US$ Mn) Market Share by By Packagingin 2022
- Figure 70: Western Europe Alcoholic Beverages Market Market Attractiveness Analysis by By Packaging, 2016-2032
- Figure 71: Western Europe Alcoholic Beverages Market Revenue (US$ Mn) Market Share by By Distribution Channelin 2022
- Figure 72: Western Europe Alcoholic Beverages Market Market Attractiveness Analysis by By Distribution Channel, 2016-2032
- Figure 73: Western Europe Alcoholic Beverages Market Revenue (US$ Mn) Market Share by Country in 2022
- Figure 74: Western Europe Alcoholic Beverages Market Market Attractiveness Analysis by Country, 2016-2032
- Figure 75: Western Europe Alcoholic Beverages Market Market Revenue (US$ Mn) (2016-2032)
- Figure 76: Western Europe Alcoholic Beverages Market Market Revenue (US$ Mn) Comparison by Country (2016-2032)
- Figure 77: Western Europe Alcoholic Beverages Market Market Revenue (US$ Mn) Comparison by By Type (2016-2032)
- Figure 78: Western Europe Alcoholic Beverages Market Market Revenue (US$ Mn) Comparison by By Alcoholic Content (2016-2032)
- Figure 79: Western Europe Alcoholic Beverages Market Market Revenue (US$ Mn) Comparison by By Category (2016-2032)
- Figure 80: Western Europe Alcoholic Beverages Market Market Revenue (US$ Mn) Comparison by By Packaging (2016-2032)
- Figure 81: Western Europe Alcoholic Beverages Market Market Revenue (US$ Mn) Comparison by By Distribution Channel (2016-2032)
- Figure 82: Western Europe Alcoholic Beverages Market Market Y-o-Y Growth Rate Comparison by Country (2016-2032)
- Figure 83: Western Europe Alcoholic Beverages Market Market Y-o-Y Growth Rate Comparison by By Type (2016-2032)
- Figure 84: Western Europe Alcoholic Beverages Market Market Y-o-Y Growth Rate Comparison by By Alcoholic Content (2016-2032)
- Figure 85: Western Europe Alcoholic Beverages Market Market Y-o-Y Growth Rate Comparison by By Category (2016-2032)
- Figure 86: Western Europe Alcoholic Beverages Market Market Y-o-Y Growth Rate Comparison by By Packaging (2016-2032)
- Figure 87: Western Europe Alcoholic Beverages Market Market Y-o-Y Growth Rate Comparison by By Distribution Channel (2016-2032)
- Figure 88: Western Europe Alcoholic Beverages Market Market Share Comparison by Country (2016-2032)
- Figure 89: Western Europe Alcoholic Beverages Market Market Share Comparison by By Type (2016-2032)
- Figure 90: Western Europe Alcoholic Beverages Market Market Share Comparison by By Alcoholic Content (2016-2032)
- Figure 91: Western Europe Alcoholic Beverages Market Market Share Comparison by By Category (2016-2032)
- Figure 92: Western Europe Alcoholic Beverages Market Market Share Comparison by By Packaging (2016-2032)
- Figure 93: Western Europe Alcoholic Beverages Market Market Share Comparison by By Distribution Channel (2016-2032)
- Figure 94: Eastern Europe Alcoholic Beverages Market Revenue (US$ Mn) Market Share by By Typein 2022
- Figure 95: Eastern Europe Alcoholic Beverages Market Market Attractiveness Analysis by By Type, 2016-2032
- Figure 96: Eastern Europe Alcoholic Beverages Market Revenue (US$ Mn) Market Share by By Alcoholic Contentin 2022
- Figure 97: Eastern Europe Alcoholic Beverages Market Market Attractiveness Analysis by By Alcoholic Content, 2016-2032
- Figure 98: Eastern Europe Alcoholic Beverages Market Revenue (US$ Mn) Market Share by By Categoryin 2022
- Figure 99: Eastern Europe Alcoholic Beverages Market Market Attractiveness Analysis by By Category, 2016-2032
- Figure 100: Eastern Europe Alcoholic Beverages Market Revenue (US$ Mn) Market Share by By Packagingin 2022
- Figure 101: Eastern Europe Alcoholic Beverages Market Market Attractiveness Analysis by By Packaging, 2016-2032
- Figure 102: Eastern Europe Alcoholic Beverages Market Revenue (US$ Mn) Market Share by By Distribution Channelin 2022
- Figure 103: Eastern Europe Alcoholic Beverages Market Market Attractiveness Analysis by By Distribution Channel, 2016-2032
- Figure 104: Eastern Europe Alcoholic Beverages Market Revenue (US$ Mn) Market Share by Country in 2022
- Figure 105: Eastern Europe Alcoholic Beverages Market Market Attractiveness Analysis by Country, 2016-2032
- Figure 106: Eastern Europe Alcoholic Beverages Market Market Revenue (US$ Mn) (2016-2032)
- Figure 107: Eastern Europe Alcoholic Beverages Market Market Revenue (US$ Mn) Comparison by Country (2016-2032)
- Figure 108: Eastern Europe Alcoholic Beverages Market Market Revenue (US$ Mn) Comparison by By Type (2016-2032)
- Figure 109: Eastern Europe Alcoholic Beverages Market Market Revenue (US$ Mn) Comparison by By Alcoholic Content (2016-2032)
- Figure 110: Eastern Europe Alcoholic Beverages Market Market Revenue (US$ Mn) Comparison by By Category (2016-2032)
- Figure 111: Eastern Europe Alcoholic Beverages Market Market Revenue (US$ Mn) Comparison by By Packaging (2016-2032)
- Figure 112: Eastern Europe Alcoholic Beverages Market Market Revenue (US$ Mn) Comparison by By Distribution Channel (2016-2032)
- Figure 113: Eastern Europe Alcoholic Beverages Market Market Y-o-Y Growth Rate Comparison by Country (2016-2032)
- Figure 114: Eastern Europe Alcoholic Beverages Market Market Y-o-Y Growth Rate Comparison by By Type (2016-2032)
- Figure 115: Eastern Europe Alcoholic Beverages Market Market Y-o-Y Growth Rate Comparison by By Alcoholic Content (2016-2032)
- Figure 116: Eastern Europe Alcoholic Beverages Market Market Y-o-Y Growth Rate Comparison by By Category (2016-2032)
- Figure 117: Eastern Europe Alcoholic Beverages Market Market Y-o-Y Growth Rate Comparison by By Packaging (2016-2032)
- Figure 118: Eastern Europe Alcoholic Beverages Market Market Y-o-Y Growth Rate Comparison by By Distribution Channel (2016-2032)
- Figure 119: Eastern Europe Alcoholic Beverages Market Market Share Comparison by Country (2016-2032)
- Figure 120: Eastern Europe Alcoholic Beverages Market Market Share Comparison by By Type (2016-2032)
- Figure 121: Eastern Europe Alcoholic Beverages Market Market Share Comparison by By Alcoholic Content (2016-2032)
- Figure 122: Eastern Europe Alcoholic Beverages Market Market Share Comparison by By Category (2016-2032)
- Figure 123: Eastern Europe Alcoholic Beverages Market Market Share Comparison by By Packaging (2016-2032)
- Figure 124: Eastern Europe Alcoholic Beverages Market Market Share Comparison by By Distribution Channel (2016-2032)
- Figure 125: APAC Alcoholic Beverages Market Revenue (US$ Mn) Market Share by By Typein 2022
- Figure 126: APAC Alcoholic Beverages Market Market Attractiveness Analysis by By Type, 2016-2032
- Figure 127: APAC Alcoholic Beverages Market Revenue (US$ Mn) Market Share by By Alcoholic Contentin 2022
- Figure 128: APAC Alcoholic Beverages Market Market Attractiveness Analysis by By Alcoholic Content, 2016-2032
- Figure 129: APAC Alcoholic Beverages Market Revenue (US$ Mn) Market Share by By Categoryin 2022
- Figure 130: APAC Alcoholic Beverages Market Market Attractiveness Analysis by By Category, 2016-2032
- Figure 131: APAC Alcoholic Beverages Market Revenue (US$ Mn) Market Share by By Packagingin 2022
- Figure 132: APAC Alcoholic Beverages Market Market Attractiveness Analysis by By Packaging, 2016-2032
- Figure 133: APAC Alcoholic Beverages Market Revenue (US$ Mn) Market Share by By Distribution Channelin 2022
- Figure 134: APAC Alcoholic Beverages Market Market Attractiveness Analysis by By Distribution Channel, 2016-2032
- Figure 135: APAC Alcoholic Beverages Market Revenue (US$ Mn) Market Share by Country in 2022
- Figure 136: APAC Alcoholic Beverages Market Market Attractiveness Analysis by Country, 2016-2032
- Figure 137: APAC Alcoholic Beverages Market Market Revenue (US$ Mn) (2016-2032)
- Figure 138: APAC Alcoholic Beverages Market Market Revenue (US$ Mn) Comparison by Country (2016-2032)
- Figure 139: APAC Alcoholic Beverages Market Market Revenue (US$ Mn) Comparison by By Type (2016-2032)
- Figure 140: APAC Alcoholic Beverages Market Market Revenue (US$ Mn) Comparison by By Alcoholic Content (2016-2032)
- Figure 141: APAC Alcoholic Beverages Market Market Revenue (US$ Mn) Comparison by By Category (2016-2032)
- Figure 142: APAC Alcoholic Beverages Market Market Revenue (US$ Mn) Comparison by By Packaging (2016-2032)
- Figure 143: APAC Alcoholic Beverages Market Market Revenue (US$ Mn) Comparison by By Distribution Channel (2016-2032)
- Figure 144: APAC Alcoholic Beverages Market Market Y-o-Y Growth Rate Comparison by Country (2016-2032)
- Figure 145: APAC Alcoholic Beverages Market Market Y-o-Y Growth Rate Comparison by By Type (2016-2032)
- Figure 146: APAC Alcoholic Beverages Market Market Y-o-Y Growth Rate Comparison by By Alcoholic Content (2016-2032)
- Figure 147: APAC Alcoholic Beverages Market Market Y-o-Y Growth Rate Comparison by By Category (2016-2032)
- Figure 148: APAC Alcoholic Beverages Market Market Y-o-Y Growth Rate Comparison by By Packaging (2016-2032)
- Figure 149: APAC Alcoholic Beverages Market Market Y-o-Y Growth Rate Comparison by By Distribution Channel (2016-2032)
- Figure 150: APAC Alcoholic Beverages Market Market Share Comparison by Country (2016-2032)
- Figure 151: APAC Alcoholic Beverages Market Market Share Comparison by By Type (2016-2032)
- Figure 152: APAC Alcoholic Beverages Market Market Share Comparison by By Alcoholic Content (2016-2032)
- Figure 153: APAC Alcoholic Beverages Market Market Share Comparison by By Category (2016-2032)
- Figure 154: APAC Alcoholic Beverages Market Market Share Comparison by By Packaging (2016-2032)
- Figure 155: APAC Alcoholic Beverages Market Market Share Comparison by By Distribution Channel (2016-2032)
- Figure 156: Latin America Alcoholic Beverages Market Revenue (US$ Mn) Market Share by By Typein 2022
- Figure 157: Latin America Alcoholic Beverages Market Market Attractiveness Analysis by By Type, 2016-2032
- Figure 158: Latin America Alcoholic Beverages Market Revenue (US$ Mn) Market Share by By Alcoholic Contentin 2022
- Figure 159: Latin America Alcoholic Beverages Market Market Attractiveness Analysis by By Alcoholic Content, 2016-2032
- Figure 160: Latin America Alcoholic Beverages Market Revenue (US$ Mn) Market Share by By Categoryin 2022
- Figure 161: Latin America Alcoholic Beverages Market Market Attractiveness Analysis by By Category, 2016-2032
- Figure 162: Latin America Alcoholic Beverages Market Revenue (US$ Mn) Market Share by By Packagingin 2022
- Figure 163: Latin America Alcoholic Beverages Market Market Attractiveness Analysis by By Packaging, 2016-2032
- Figure 164: Latin America Alcoholic Beverages Market Revenue (US$ Mn) Market Share by By Distribution Channelin 2022
- Figure 165: Latin America Alcoholic Beverages Market Market Attractiveness Analysis by By Distribution Channel, 2016-2032
- Figure 166: Latin America Alcoholic Beverages Market Revenue (US$ Mn) Market Share by Country in 2022
- Figure 167: Latin America Alcoholic Beverages Market Market Attractiveness Analysis by Country, 2016-2032
- Figure 168: Latin America Alcoholic Beverages Market Market Revenue (US$ Mn) (2016-2032)
- Figure 169: Latin America Alcoholic Beverages Market Market Revenue (US$ Mn) Comparison by Country (2016-2032)
- Figure 170: Latin America Alcoholic Beverages Market Market Revenue (US$ Mn) Comparison by By Type (2016-2032)
- Figure 171: Latin America Alcoholic Beverages Market Market Revenue (US$ Mn) Comparison by By Alcoholic Content (2016-2032)
- Figure 172: Latin America Alcoholic Beverages Market Market Revenue (US$ Mn) Comparison by By Category (2016-2032)
- Figure 173: Latin America Alcoholic Beverages Market Market Revenue (US$ Mn) Comparison by By Packaging (2016-2032)
- Figure 174: Latin America Alcoholic Beverages Market Market Revenue (US$ Mn) Comparison by By Distribution Channel (2016-2032)
- Figure 175: Latin America Alcoholic Beverages Market Market Y-o-Y Growth Rate Comparison by Country (2016-2032)
- Figure 176: Latin America Alcoholic Beverages Market Market Y-o-Y Growth Rate Comparison by By Type (2016-2032)
- Figure 177: Latin America Alcoholic Beverages Market Market Y-o-Y Growth Rate Comparison by By Alcoholic Content (2016-2032)
- Figure 178: Latin America Alcoholic Beverages Market Market Y-o-Y Growth Rate Comparison by By Category (2016-2032)
- Figure 179: Latin America Alcoholic Beverages Market Market Y-o-Y Growth Rate Comparison by By Packaging (2016-2032)
- Figure 180: Latin America Alcoholic Beverages Market Market Y-o-Y Growth Rate Comparison by By Distribution Channel (2016-2032)
- Figure 181: Latin America Alcoholic Beverages Market Market Share Comparison by Country (2016-2032)
- Figure 182: Latin America Alcoholic Beverages Market Market Share Comparison by By Type (2016-2032)
- Figure 183: Latin America Alcoholic Beverages Market Market Share Comparison by By Alcoholic Content (2016-2032)
- Figure 184: Latin America Alcoholic Beverages Market Market Share Comparison by By Category (2016-2032)
- Figure 185: Latin America Alcoholic Beverages Market Market Share Comparison by By Packaging (2016-2032)
- Figure 186: Latin America Alcoholic Beverages Market Market Share Comparison by By Distribution Channel (2016-2032)
- Figure 187: Middle East & Africa Alcoholic Beverages Market Revenue (US$ Mn) Market Share by By Typein 2022
- Figure 188: Middle East & Africa Alcoholic Beverages Market Market Attractiveness Analysis by By Type, 2016-2032
- Figure 189: Middle East & Africa Alcoholic Beverages Market Revenue (US$ Mn) Market Share by By Alcoholic Contentin 2022
- Figure 190: Middle East & Africa Alcoholic Beverages Market Market Attractiveness Analysis by By Alcoholic Content, 2016-2032
- Figure 191: Middle East & Africa Alcoholic Beverages Market Revenue (US$ Mn) Market Share by By Categoryin 2022
- Figure 192: Middle East & Africa Alcoholic Beverages Market Market Attractiveness Analysis by By Category, 2016-2032
- Figure 193: Middle East & Africa Alcoholic Beverages Market Revenue (US$ Mn) Market Share by By Packagingin 2022
- Figure 194: Middle East & Africa Alcoholic Beverages Market Market Attractiveness Analysis by By Packaging, 2016-2032
- Figure 195: Middle East & Africa Alcoholic Beverages Market Revenue (US$ Mn) Market Share by By Distribution Channelin 2022
- Figure 196: Middle East & Africa Alcoholic Beverages Market Market Attractiveness Analysis by By Distribution Channel, 2016-2032
- Figure 197: Middle East & Africa Alcoholic Beverages Market Revenue (US$ Mn) Market Share by Country in 2022
- Figure 198: Middle East & Africa Alcoholic Beverages Market Market Attractiveness Analysis by Country, 2016-2032
- Figure 199: Middle East & Africa Alcoholic Beverages Market Market Revenue (US$ Mn) (2016-2032)
- Figure 200: Middle East & Africa Alcoholic Beverages Market Market Revenue (US$ Mn) Comparison by Country (2016-2032)
- Figure 201: Middle East & Africa Alcoholic Beverages Market Market Revenue (US$ Mn) Comparison by By Type (2016-2032)
- Figure 202: Middle East & Africa Alcoholic Beverages Market Market Revenue (US$ Mn) Comparison by By Alcoholic Content (2016-2032)
- Figure 203: Middle East & Africa Alcoholic Beverages Market Market Revenue (US$ Mn) Comparison by By Category (2016-2032)
- Figure 204: Middle East & Africa Alcoholic Beverages Market Market Revenue (US$ Mn) Comparison by By Packaging (2016-2032)
- Figure 205: Middle East & Africa Alcoholic Beverages Market Market Revenue (US$ Mn) Comparison by By Distribution Channel (2016-2032)
- Figure 206: Middle East & Africa Alcoholic Beverages Market Market Y-o-Y Growth Rate Comparison by Country (2016-2032)
- Figure 207: Middle East & Africa Alcoholic Beverages Market Market Y-o-Y Growth Rate Comparison by By Type (2016-2032)
- Figure 208: Middle East & Africa Alcoholic Beverages Market Market Y-o-Y Growth Rate Comparison by By Alcoholic Content (2016-2032)
- Figure 209: Middle East & Africa Alcoholic Beverages Market Market Y-o-Y Growth Rate Comparison by By Category (2016-2032)
- Figure 210: Middle East & Africa Alcoholic Beverages Market Market Y-o-Y Growth Rate Comparison by By Packaging (2016-2032)
- Figure 211: Middle East & Africa Alcoholic Beverages Market Market Y-o-Y Growth Rate Comparison by By Distribution Channel (2016-2032)
- Figure 212: Middle East & Africa Alcoholic Beverages Market Market Share Comparison by Country (2016-2032)
- Figure 213: Middle East & Africa Alcoholic Beverages Market Market Share Comparison by By Type (2016-2032)
- Figure 214: Middle East & Africa Alcoholic Beverages Market Market Share Comparison by By Alcoholic Content (2016-2032)
- Figure 215: Middle East & Africa Alcoholic Beverages Market Market Share Comparison by By Category (2016-2032)
- Figure 216: Middle East & Africa Alcoholic Beverages Market Market Share Comparison by By Packaging (2016-2032)
- Figure 217: Middle East & Africa Alcoholic Beverages Market Market Share Comparison by By Distribution Channel (2016-2032)
"
- List of Tables
- "
- Table 1: Global Alcoholic Beverages Market Market Comparison by By Type (2016-2032)
- Table 2: Global Alcoholic Beverages Market Market Comparison by By Alcoholic Content (2016-2032)
- Table 3: Global Alcoholic Beverages Market Market Comparison by By Category (2016-2032)
- Table 4: Global Alcoholic Beverages Market Market Comparison by By Packaging (2016-2032)
- Table 5: Global Alcoholic Beverages Market Market Comparison by By Distribution Channel (2016-2032)
- Table 6: Global Alcoholic Beverages Market Revenue (US$ Mn) Comparison by Region (2016-2032)
- Table 7: Global Alcoholic Beverages Market Market Revenue (US$ Mn) (2016-2032)
- Table 8: Global Alcoholic Beverages Market Market Revenue (US$ Mn) Comparison by Region (2016-2032)
- Table 9: Global Alcoholic Beverages Market Market Revenue (US$ Mn) Comparison by By Type (2016-2032)
- Table 10: Global Alcoholic Beverages Market Market Revenue (US$ Mn) Comparison by By Alcoholic Content (2016-2032)
- Table 11: Global Alcoholic Beverages Market Market Revenue (US$ Mn) Comparison by By Category (2016-2032)
- Table 12: Global Alcoholic Beverages Market Market Revenue (US$ Mn) Comparison by By Packaging (2016-2032)
- Table 13: Global Alcoholic Beverages Market Market Revenue (US$ Mn) Comparison by By Distribution Channel (2016-2032)
- Table 14: Global Alcoholic Beverages Market Market Y-o-Y Growth Rate Comparison by Region (2016-2032)
- Table 15: Global Alcoholic Beverages Market Market Y-o-Y Growth Rate Comparison by By Type (2016-2032)
- Table 16: Global Alcoholic Beverages Market Market Y-o-Y Growth Rate Comparison by By Alcoholic Content (2016-2032)
- Table 17: Global Alcoholic Beverages Market Market Y-o-Y Growth Rate Comparison by By Category (2016-2032)
- Table 18: Global Alcoholic Beverages Market Market Y-o-Y Growth Rate Comparison by By Packaging (2016-2032)
- Table 19: Global Alcoholic Beverages Market Market Y-o-Y Growth Rate Comparison by By Distribution Channel (2016-2032)
- Table 20: Global Alcoholic Beverages Market Market Share Comparison by Region (2016-2032)
- Table 21: Global Alcoholic Beverages Market Market Share Comparison by By Type (2016-2032)
- Table 22: Global Alcoholic Beverages Market Market Share Comparison by By Alcoholic Content (2016-2032)
- Table 23: Global Alcoholic Beverages Market Market Share Comparison by By Category (2016-2032)
- Table 24: Global Alcoholic Beverages Market Market Share Comparison by By Packaging (2016-2032)
- Table 25: Global Alcoholic Beverages Market Market Share Comparison by By Distribution Channel (2016-2032)
- Table 26: North America Alcoholic Beverages Market Market Comparison by By Alcoholic Content (2016-2032)
- Table 27: North America Alcoholic Beverages Market Market Comparison by By Category (2016-2032)
- Table 28: North America Alcoholic Beverages Market Market Comparison by By Packaging (2016-2032)
- Table 29: North America Alcoholic Beverages Market Market Comparison by By Distribution Channel (2016-2032)
- Table 30: North America Alcoholic Beverages Market Revenue (US$ Mn) Comparison by Country (2016-2032)
- Table 31: North America Alcoholic Beverages Market Market Revenue (US$ Mn) (2016-2032)
- Table 32: North America Alcoholic Beverages Market Market Revenue (US$ Mn) Comparison by Country (2016-2032)
- Table 33: North America Alcoholic Beverages Market Market Revenue (US$ Mn) Comparison by By Type (2016-2032)
- Table 34: North America Alcoholic Beverages Market Market Revenue (US$ Mn) Comparison by By Alcoholic Content (2016-2032)
- Table 35: North America Alcoholic Beverages Market Market Revenue (US$ Mn) Comparison by By Category (2016-2032)
- Table 36: North America Alcoholic Beverages Market Market Revenue (US$ Mn) Comparison by By Packaging (2016-2032)
- Table 37: North America Alcoholic Beverages Market Market Revenue (US$ Mn) Comparison by By Distribution Channel (2016-2032)
- Table 38: North America Alcoholic Beverages Market Market Y-o-Y Growth Rate Comparison by Country (2016-2032)
- Table 39: North America Alcoholic Beverages Market Market Y-o-Y Growth Rate Comparison by By Type (2016-2032)
- Table 40: North America Alcoholic Beverages Market Market Y-o-Y Growth Rate Comparison by By Alcoholic Content (2016-2032)
- Table 41: North America Alcoholic Beverages Market Market Y-o-Y Growth Rate Comparison by By Category (2016-2032)
- Table 42: North America Alcoholic Beverages Market Market Y-o-Y Growth Rate Comparison by By Packaging (2016-2032)
- Table 43: North America Alcoholic Beverages Market Market Y-o-Y Growth Rate Comparison by By Distribution Channel (2016-2032)
- Table 44: North America Alcoholic Beverages Market Market Share Comparison by Country (2016-2032)
- Table 45: North America Alcoholic Beverages Market Market Share Comparison by By Type (2016-2032)
- Table 46: North America Alcoholic Beverages Market Market Share Comparison by By Alcoholic Content (2016-2032)
- Table 47: North America Alcoholic Beverages Market Market Share Comparison by By Category (2016-2032)
- Table 48: North America Alcoholic Beverages Market Market Share Comparison by By Packaging (2016-2032)
- Table 49: North America Alcoholic Beverages Market Market Share Comparison by By Distribution Channel (2016-2032)
- Table 50: Western Europe Alcoholic Beverages Market Market Comparison by By Type (2016-2032)
- Table 51: Western Europe Alcoholic Beverages Market Market Comparison by By Alcoholic Content (2016-2032)
- Table 52: Western Europe Alcoholic Beverages Market Market Comparison by By Category (2016-2032)
- Table 53: Western Europe Alcoholic Beverages Market Market Comparison by By Packaging (2016-2032)
- Table 54: Western Europe Alcoholic Beverages Market Market Comparison by By Distribution Channel (2016-2032)
- Table 55: Western Europe Alcoholic Beverages Market Revenue (US$ Mn) Comparison by Country (2016-2032)
- Table 56: Western Europe Alcoholic Beverages Market Market Revenue (US$ Mn) (2016-2032)
- Table 57: Western Europe Alcoholic Beverages Market Market Revenue (US$ Mn) Comparison by Country (2016-2032)
- Table 58: Western Europe Alcoholic Beverages Market Market Revenue (US$ Mn) Comparison by By Type (2016-2032)
- Table 59: Western Europe Alcoholic Beverages Market Market Revenue (US$ Mn) Comparison by By Alcoholic Content (2016-2032)
- Table 60: Western Europe Alcoholic Beverages Market Market Revenue (US$ Mn) Comparison by By Category (2016-2032)
- Table 61: Western Europe Alcoholic Beverages Market Market Revenue (US$ Mn) Comparison by By Packaging (2016-2032)
- Table 62: Western Europe Alcoholic Beverages Market Market Revenue (US$ Mn) Comparison by By Distribution Channel (2016-2032)
- Table 63: Western Europe Alcoholic Beverages Market Market Y-o-Y Growth Rate Comparison by Country (2016-2032)
- Table 64: Western Europe Alcoholic Beverages Market Market Y-o-Y Growth Rate Comparison by By Type (2016-2032)
- Table 65: Western Europe Alcoholic Beverages Market Market Y-o-Y Growth Rate Comparison by By Alcoholic Content (2016-2032)
- Table 66: Western Europe Alcoholic Beverages Market Market Y-o-Y Growth Rate Comparison by By Category (2016-2032)
- Table 67: Western Europe Alcoholic Beverages Market Market Y-o-Y Growth Rate Comparison by By Packaging (2016-2032)
- Table 68: Western Europe Alcoholic Beverages Market Market Y-o-Y Growth Rate Comparison by By Distribution Channel (2016-2032)
- Table 69: Western Europe Alcoholic Beverages Market Market Share Comparison by Country (2016-2032)
- Table 70: Western Europe Alcoholic Beverages Market Market Share Comparison by By Type (2016-2032)
- Table 71: Western Europe Alcoholic Beverages Market Market Share Comparison by By Alcoholic Content (2016-2032)
- Table 72: Western Europe Alcoholic Beverages Market Market Share Comparison by By Category (2016-2032)
- Table 73: Western Europe Alcoholic Beverages Market Market Share Comparison by By Packaging (2016-2032)
- Table 74: Western Europe Alcoholic Beverages Market Market Share Comparison by By Distribution Channel (2016-2032)
- Table 75: Eastern Europe Alcoholic Beverages Market Market Comparison by By Type (2016-2032)
- Table 76: Eastern Europe Alcoholic Beverages Market Market Comparison by By Alcoholic Content (2016-2032)
- Table 77: Eastern Europe Alcoholic Beverages Market Market Comparison by By Category (2016-2032)
- Table 78: Eastern Europe Alcoholic Beverages Market Market Comparison by By Packaging (2016-2032)
- Table 79: Eastern Europe Alcoholic Beverages Market Market Comparison by By Distribution Channel (2016-2032)
- Table 80: Eastern Europe Alcoholic Beverages Market Revenue (US$ Mn) Comparison by Country (2016-2032)
- Table 81: Eastern Europe Alcoholic Beverages Market Market Revenue (US$ Mn) (2016-2032)
- Table 82: Eastern Europe Alcoholic Beverages Market Market Revenue (US$ Mn) Comparison by Country (2016-2032)
- Table 83: Eastern Europe Alcoholic Beverages Market Market Revenue (US$ Mn) Comparison by By Type (2016-2032)
- Table 84: Eastern Europe Alcoholic Beverages Market Market Revenue (US$ Mn) Comparison by By Alcoholic Content (2016-2032)
- Table 85: Eastern Europe Alcoholic Beverages Market Market Revenue (US$ Mn) Comparison by By Category (2016-2032)
- Table 86: Eastern Europe Alcoholic Beverages Market Market Revenue (US$ Mn) Comparison by By Packaging (2016-2032)
- Table 87: Eastern Europe Alcoholic Beverages Market Market Revenue (US$ Mn) Comparison by By Distribution Channel (2016-2032)
- Table 88: Eastern Europe Alcoholic Beverages Market Market Y-o-Y Growth Rate Comparison by Country (2016-2032)
- Table 89: Eastern Europe Alcoholic Beverages Market Market Y-o-Y Growth Rate Comparison by By Type (2016-2032)
- Table 90: Eastern Europe Alcoholic Beverages Market Market Y-o-Y Growth Rate Comparison by By Alcoholic Content (2016-2032)
- Table 91: Eastern Europe Alcoholic Beverages Market Market Y-o-Y Growth Rate Comparison by By Category (2016-2032)
- Table 92: Eastern Europe Alcoholic Beverages Market Market Y-o-Y Growth Rate Comparison by By Packaging (2016-2032)
- Table 93: Eastern Europe Alcoholic Beverages Market Market Y-o-Y Growth Rate Comparison by By Distribution Channel (2016-2032)
- Table 94: Eastern Europe Alcoholic Beverages Market Market Share Comparison by Country (2016-2032)
- Table 95: Eastern Europe Alcoholic Beverages Market Market Share Comparison by By Type (2016-2032)
- Table 96: Eastern Europe Alcoholic Beverages Market Market Share Comparison by By Alcoholic Content (2016-2032)
- Table 97: Eastern Europe Alcoholic Beverages Market Market Share Comparison by By Category (2016-2032)
- Table 98: Eastern Europe Alcoholic Beverages Market Market Share Comparison by By Packaging (2016-2032)
- Table 99: Eastern Europe Alcoholic Beverages Market Market Share Comparison by By Distribution Channel (2016-2032)
- Table 100: APAC Alcoholic Beverages Market Market Comparison by By Type (2016-2032)
- Table 101: APAC Alcoholic Beverages Market Market Comparison by By Alcoholic Content (2016-2032)
- Table 102: APAC Alcoholic Beverages Market Market Comparison by By Category (2016-2032)
- Table 103: APAC Alcoholic Beverages Market Market Comparison by By Packaging (2016-2032)
- Table 104: APAC Alcoholic Beverages Market Market Comparison by By Distribution Channel (2016-2032)
- Table 105: APAC Alcoholic Beverages Market Revenue (US$ Mn) Comparison by Country (2016-2032)
- Table 106: APAC Alcoholic Beverages Market Market Revenue (US$ Mn) (2016-2032)
- Table 107: APAC Alcoholic Beverages Market Market Revenue (US$ Mn) Comparison by Country (2016-2032)
- Table 108: APAC Alcoholic Beverages Market Market Revenue (US$ Mn) Comparison by By Type (2016-2032)
- Table 109: APAC Alcoholic Beverages Market Market Revenue (US$ Mn) Comparison by By Alcoholic Content (2016-2032)
- Table 110: APAC Alcoholic Beverages Market Market Revenue (US$ Mn) Comparison by By Category (2016-2032)
- Table 111: APAC Alcoholic Beverages Market Market Revenue (US$ Mn) Comparison by By Packaging (2016-2032)
- Table 112: APAC Alcoholic Beverages Market Market Revenue (US$ Mn) Comparison by By Distribution Channel (2016-2032)
- Table 113: APAC Alcoholic Beverages Market Market Y-o-Y Growth Rate Comparison by Country (2016-2032)
- Table 114: APAC Alcoholic Beverages Market Market Y-o-Y Growth Rate Comparison by By Type (2016-2032)
- Table 115: APAC Alcoholic Beverages Market Market Y-o-Y Growth Rate Comparison by By Alcoholic Content (2016-2032)
- Table 116: APAC Alcoholic Beverages Market Market Y-o-Y Growth Rate Comparison by By Category (2016-2032)
- Table 117: APAC Alcoholic Beverages Market Market Y-o-Y Growth Rate Comparison by By Packaging (2016-2032)
- Table 118: APAC Alcoholic Beverages Market Market Y-o-Y Growth Rate Comparison by By Distribution Channel (2016-2032)
- Table 119: APAC Alcoholic Beverages Market Market Share Comparison by Country (2016-2032)
- Table 120: APAC Alcoholic Beverages Market Market Share Comparison by By Type (2016-2032)
- Table 121: APAC Alcoholic Beverages Market Market Share Comparison by By Alcoholic Content (2016-2032)
- Table 122: APAC Alcoholic Beverages Market Market Share Comparison by By Category (2016-2032)
- Table 123: APAC Alcoholic Beverages Market Market Share Comparison by By Packaging (2016-2032)
- Table 124: APAC Alcoholic Beverages Market Market Share Comparison by By Distribution Channel (2016-2032)
- Table 125: Latin America Alcoholic Beverages Market Market Comparison by By Type (2016-2032)
- Table 126: Latin America Alcoholic Beverages Market Market Comparison by By Alcoholic Content (2016-2032)
- Table 127: Latin America Alcoholic Beverages Market Market Comparison by By Category (2016-2032)
- Table 128: Latin America Alcoholic Beverages Market Market Comparison by By Packaging (2016-2032)
- Table 129: Latin America Alcoholic Beverages Market Market Comparison by By Distribution Channel (2016-2032)
- Table 130: Latin America Alcoholic Beverages Market Revenue (US$ Mn) Comparison by Country (2016-2032)
- Table 131: Latin America Alcoholic Beverages Market Market Revenue (US$ Mn) (2016-2032)
- Table 132: Latin America Alcoholic Beverages Market Market Revenue (US$ Mn) Comparison by Country (2016-2032)
- Table 133: Latin America Alcoholic Beverages Market Market Revenue (US$ Mn) Comparison by By Type (2016-2032)
- Table 134: Latin America Alcoholic Beverages Market Market Revenue (US$ Mn) Comparison by By Alcoholic Content (2016-2032)
- Table 135: Latin America Alcoholic Beverages Market Market Revenue (US$ Mn) Comparison by By Category (2016-2032)
- Table 136: Latin America Alcoholic Beverages Market Market Revenue (US$ Mn) Comparison by By Packaging (2016-2032)
- Table 137: Latin America Alcoholic Beverages Market Market Revenue (US$ Mn) Comparison by By Distribution Channel (2016-2032)
- Table 138: Latin America Alcoholic Beverages Market Market Y-o-Y Growth Rate Comparison by Country (2016-2032)
- Table 139: Latin America Alcoholic Beverages Market Market Y-o-Y Growth Rate Comparison by By Type (2016-2032)
- Table 140: Latin America Alcoholic Beverages Market Market Y-o-Y Growth Rate Comparison by By Alcoholic Content (2016-2032)
- Table 141: Latin America Alcoholic Beverages Market Market Y-o-Y Growth Rate Comparison by By Category (2016-2032)
- Table 142: Latin America Alcoholic Beverages Market Market Y-o-Y Growth Rate Comparison by By Packaging (2016-2032)
- Table 143: Latin America Alcoholic Beverages Market Market Y-o-Y Growth Rate Comparison by By Distribution Channel (2016-2032)
- Table 144: Latin America Alcoholic Beverages Market Market Share Comparison by Country (2016-2032)
- Table 145: Latin America Alcoholic Beverages Market Market Share Comparison by By Type (2016-2032)
- Table 146: Latin America Alcoholic Beverages Market Market Share Comparison by By Alcoholic Content (2016-2032)
- Table 147: Latin America Alcoholic Beverages Market Market Share Comparison by By Category (2016-2032)
- Table 148: Latin America Alcoholic Beverages Market Market Share Comparison by By Packaging (2016-2032)
- Table 149: Latin America Alcoholic Beverages Market Market Share Comparison by By Distribution Channel (2016-2032)
- Table 150: Middle East & Africa Alcoholic Beverages Market Market Comparison by By Type (2016-2032)
- Table 151: Middle East & Africa Alcoholic Beverages Market Market Comparison by By Alcoholic Content (2016-2032)
- Table 152: Middle East & Africa Alcoholic Beverages Market Market Comparison by By Category (2016-2032)
- Table 153: Middle East & Africa Alcoholic Beverages Market Market Comparison by By Packaging (2016-2032)
- Table 154: Middle East & Africa Alcoholic Beverages Market Market Comparison by By Distribution Channel (2016-2032)
- Table 155: Middle East & Africa Alcoholic Beverages Market Revenue (US$ Mn) Comparison by Country (2016-2032)
- Table 156: Middle East & Africa Alcoholic Beverages Market Market Revenue (US$ Mn) (2016-2032)
- Table 157: Middle East & Africa Alcoholic Beverages Market Market Revenue (US$ Mn) Comparison by Country (2016-2032)
- Table 158: Middle East & Africa Alcoholic Beverages Market Market Revenue (US$ Mn) Comparison by By Type (2016-2032)
- Table 159: Middle East & Africa Alcoholic Beverages Market Market Revenue (US$ Mn) Comparison by By Alcoholic Content (2016-2032)
- Table 160: Middle East & Africa Alcoholic Beverages Market Market Revenue (US$ Mn) Comparison by By Category (2016-2032)
- Table 161: Middle East & Africa Alcoholic Beverages Market Market Revenue (US$ Mn) Comparison by By Packaging (2016-2032)
- Table 162: Middle East & Africa Alcoholic Beverages Market Market Revenue (US$ Mn) Comparison by By Distribution Channel (2016-2032)
- Table 163: Middle East & Africa Alcoholic Beverages Market Market Y-o-Y Growth Rate Comparison by Country (2016-2032)
- Table 164: Middle East & Africa Alcoholic Beverages Market Market Y-o-Y Growth Rate Comparison by By Type (2016-2032)
- Table 165: Middle East & Africa Alcoholic Beverages Market Market Y-o-Y Growth Rate Comparison by By Alcoholic Content (2016-2032)
- Table 166: Middle East & Africa Alcoholic Beverages Market Market Y-o-Y Growth Rate Comparison by By Category (2016-2032)
- Table 167: Middle East & Africa Alcoholic Beverages Market Market Y-o-Y Growth Rate Comparison by By Packaging (2016-2032)
- Table 168: Middle East & Africa Alcoholic Beverages Market Market Y-o-Y Growth Rate Comparison by By Distribution Channel (2016-2032)
- Table 169: Middle East & Africa Alcoholic Beverages Market Market Share Comparison by Country (2016-2032)
- Table 170: Middle East & Africa Alcoholic Beverages Market Market Share Comparison by By Type (2016-2032)
- Table 171: Middle East & Africa Alcoholic Beverages Market Market Share Comparison by By Alcoholic Content (2016-2032)
- Table 172: Middle East & Africa Alcoholic Beverages Market Market Share Comparison by By Category (2016-2032)
- Table 173: Middle East & Africa Alcoholic Beverages Market Market Share Comparison by By Packaging (2016-2032)
- Table 174: Middle East & Africa Alcoholic Beverages Market Market Share Comparison by By Distribution Channel (2016-2032)
- 1. Executive Summary
-
- Anheuser-Busch InBev
- Diageo
- Heineken
- Pernod Ricard
- China Resources Snow Breweries
- Carlsberg
- Molson Coors Beverage Company
- Kirin Holdings
- Asahi Group Holdings
- Thai Beverage
- Constellation Brands
- Brown-Forman
- Suntory Holdings
- Bacardi
- Rémy Cointreau
Our Clients


View Our Licence Options
