
Water As Fuel Market Size, Share, Growth, And Industry Analysis – By Application (Industrial Hydrogen Production, and Others), By Technology (PEM Electrolysis, Alkaline Electrolysis, Solid Oxide Electrolysis, and Others), By End-Use Industry (Refineries, Manufacturing, Petrochemicals, Others), By Product Type, By Distribution Mode, And By Region Forecast - 2023-2032
-
40880
-
Aug 2023
-
137
-


-
This report was compiled by Shreyas Rokade Shreyas Rokade is a seasoned Research Analyst with CMFE, bringing extensive expertise in market research and consulting, with a strong background in Chemical Engineering. Correspondence Team Lead-CMFE Linkedin | Detailed Market research Methodology Our methodology involves a mix of primary research, including interviews with leading mental health experts, and secondary research from reputable medical journals and databases. View Detailed Methodology Page
-
Quick Navigation
Report Overview
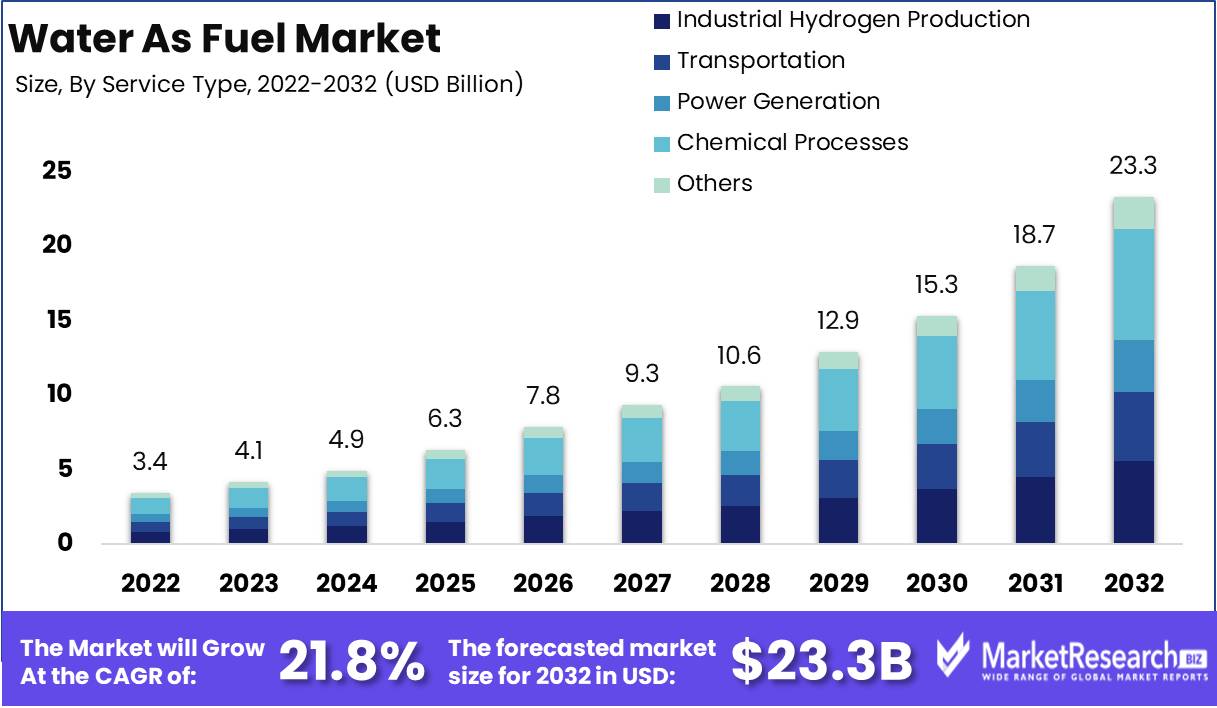
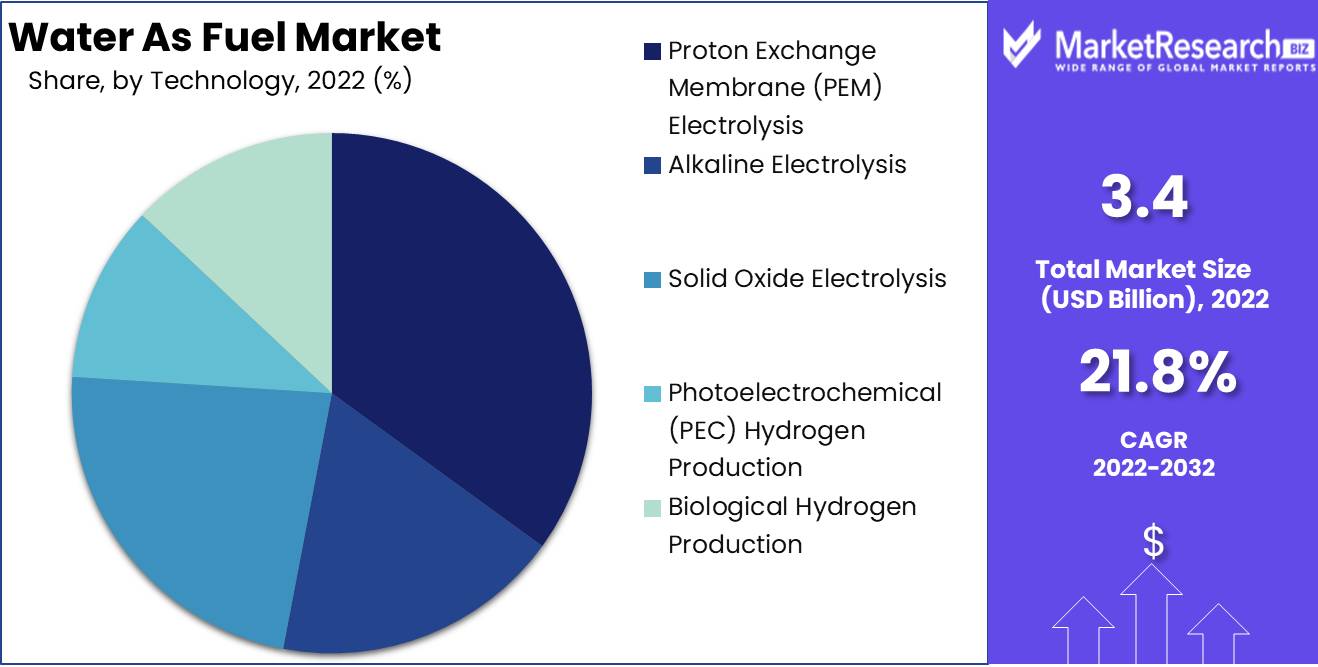
The Global Water As Fuel Market revenue is expected to increase to USD 23.3 Bn in 2032 from USD 3.4 Bn in 2022, and register a revenue CAGR of 21.8% during the forecast period (2023 to 2032).
Water as a fuel holds promise as a clean and renewable energy source, primarily through hydrogen production via water electrolysis. This involves splitting water molecules into hydrogen and oxygen using electricity. Such programs focus on developing efficient electrolysis techniques, often leveraging renewable energy sources such as solar and wind to power the process sustainably.
These initiatives offer a pathway to decarbonize various sectors, from transportation to industry. Cutting-edge technologies like Proton Exchange Membrane (PEM) and alkaline electrolyzers enhance efficiency and scalability. Also, advancements in photoelectrochemical and biological processes are being explored.
Market solutions span on-site hydrogen generation, fuel cells for power production, and hydrogen-based transportation, and these offer promise of a greener energy landscape.
The global water as fuel market has been rapidly registering inclining revenue growth, driven by increasing focus on clean and green energy sources and technologies. Water electrolysis for hydrogen production is at the forefront in this arena, and the technology is expected to continue to drive innovation and revenues ahead.
Rising consumption of hydrogen in industries such as transportation and power generation is also supporting market growth. Services in the market include advanced electrolyzer installations, on-site hydrogen production, and fuel cell deployment. Technological advancements in PEM and alkaline electrolyzers enhance efficiency. Government initiatives for green hydrogen production is expected to further support market growth, as adoption offers advantages of reduced carbon emissions and energy independence.
Driving factors
Government Support and Incentives & Rising Demand for Clean Energy
Growing environmental concerns and climate targets prompt governments worldwide to offer subsidies, tax incentives, and grants for water-as-fuel research and implementation, and this is expected to boost market revenue.
The global shift towards sustainable energy sources is driving demand for green hydrogen production through water electrolysis, and this holds major potential as an increasing number of industries seek low-carbon alternatives. Hydrogen stations play a pivotal role in the utilization of water as fuel, as they facilitate the electrolysis process to extract hydrogen from water molecules.
Advancements in Electrolyzer Technology & Integration with Renewable Energy Sources
Ongoing R&D in Proton Exchange Membrane (PEM) and alkaline electrolyzers enhances efficiency, reduces costs, and increases scalability. As water-as-fuel systems become more economically viable and more innovative solutions are introduced, revenue from this market is expected to increase substantially over the forecast period.
Coupling water electrolysis with surplus renewable energy such as solar and wind power not only promotes clean hydrogen production, but also generates additional revenue streams from excess energy utilization. Such innovations only promise to continue and development of more cutting-solutions are expected to enter the market in the near future.
Expanding Industrial Applications & Global Partnerships and Collaborations
Water-derived hydrogen finds application in various sectors including transportation, distributed power generation, and chemical industries, thereby providing streams for expanding revenue avenues as diverse industries adopt the technology.
Collaborative efforts between research institutions, industries, and governments worldwide facilitate knowledge sharing, technology transfer, and funding, thereby accelerating market growth through collective expertise and resources.
Restraining Factors
High Initial Investment & Limited Hydrogen Infrastructure
The substantial upfront costs associated with setting up water-as-fuel infrastructure, including advanced electrolyzers and renewable energy integration, can deter potential investors and restrain market growth.
The lack of a robust hydrogen distribution network also restrains adoption of water-as-fuel solutions, as the transportation and storage of hydrogen pose challenges that limit market expansion.
Technological Challenges & Competition from Alternatives
Despite advancements, electrolyzer technology still faces efficiency and durability issues, impacting market growth by limiting scalability and reliability.
Competition from other clean energy sources like batteries and carbon capture technologies diverts attention and investment away from water-as-fuel solutions, affecting market share and revenue potential.
Regulatory Uncertainty & Lack of Public Awareness
Evolving regulations and standards related to hydrogen production, transportation, and safety can create uncertainty, and hamper market growth due to concerns over compliance and legal hurdles.
Limited public awareness about the benefits and potential of water-as-fuel technologies can slow down adoption rates, and restrain revenue growth as potential customers remain unfamiliar with the technology's advantages.
Opportunity
Electrolyzer Manufacturing & Renewable Energy Integration
Companies can capitalize on the growing demand for water electrolyzers by developing and manufacturing advanced electrolyzer technologies, catering to both large-scale industrial applications and smaller, decentralized systems.
Offering solutions that enable seamless integration of water electrolysis with renewable energy sources like solar and wind, companies can tap into the demand for efficient green hydrogen production.
Hydrogen Storage and Distribution & Fuel Cell Deployment
Developing innovative hydrogen storage and distribution solutions, such as advanced tanks and pipelines, presents an opportunity to address a critical infrastructure gap in the market.
Companies can provide fuel cell technologies for applications ranging from transportation to power generation, offering end-to-end solutions that utilize hydrogen produced through water electrolysis.
Research and Development Services & Consulting and Advisory Services
Organizations can offer R&D services to collaborate with industries and governments, driving innovation and helping address technical challenges related to water-as-fuel technologies.
Companies knowledgeable in water-as-fuel solutions can provide consulting services to guide clients through the adoption process, offering expertise on system design, implementation, and regulatory compliance.
By Application
Among the application segments, the transportation segment accounts for a significantly larger revenue share in the global water as fuel market. A key factor such as increased focus on reducing carbon emissions across various transportation modes, including vehicles, maritime vessels, and aviation, is driving demand for clean energy alternatives like hydrogen. Hydrogen fuel cells offer a promising solution for achieving emission reduction targets and fuel efficiency improvements. Surge in demand is supported by stringent environmental regulations, incentives for sustainable transportation, and technological advancements enhancing the feasibility of hydrogen-powered vehicles and transportation systems.
By Technology
The Proton Exchange Membrane (PEM) electrolysis segment among the technology segments accounts for relatively larger revenue share owing to higher adoption and preference. PEM electrolysis offers higher efficiency, scalability, and flexibility compared to other technologies. Steady revenue growth in this segment is supported by increasing investments in R&D, with focus on driving down costs and enhancing electrolyzer performance. The advent of innovative catalyst materials, improved membrane technology, and better system design are among other major factors contributing to revenue dominance of the PEM electrolysis segment.
By End-Use Industry
The industrial hydrogen production segment accounts for comparatively larger share than other end-use industry segments owing increasing traction as in increasing number of industries such as refineries, petrochemicals, and manufacturing seek to reduce carbon footprint and transition to cleaner energy sources. Hydrogen serves as a versatile feedstock and fuel, aligning with sustainability goals. Steady demand is supported by regulatory pressures, corporate sustainability commitments, and the need to optimize industrial processes. Also, the integration of hydrogen in existing infrastructure and chemical processes further supports dominance of this segment in terms of revenue contribution.
Key Market Segments
By Application
- Industrial Hydrogen Production
- Transportation
- Power Generation
- Chemical Processes
- Others
By Technology
- Proton Exchange Membrane (PEM) Electrolysis
- Alkaline Electrolysis
- Solid Oxide Electrolysis
- Photoelectrochemical (PEC) Hydrogen Production
- Biological Hydrogen Production
By End-Use Industry
- Refineries
- Manufacturing
- Petrochemicals
- Utilities
- Automotive
- Aerospace
- Electronics
- Others
By Product Type
- Electrolyzers (PEM, Alkaline, Solid Oxide)
- Fuel Cells
- Hydrogen Storage Systems
- Hydrogen Infrastructure
- Others
By Distribution Mode
- On-Site Hydrogen Production
- Centralized Hydrogen Production
- Pipeline Distribution
- Transport Distribution (Cylinders, Tankers)
- Others
Regional Analysis
North America
In North America, the water as fuel market exhibits significant growth, capturing a substantial market share driven by the United States and Canada. The region's commitment to reducing carbon emissions fuels demand for hydrogen-based solutions. Robust investments in research and development foster technological advancements, enhancing electrolyzer efficiency. Initiatives like tax incentives and partnerships between government agencies and private sectors bolster revenue growth. The transportation and power generation sectors present lucrative opportunities, with potential revenue growth driven by the expanding adoption of hydrogen fuel cells and green energy strategies.
Europe
Europe has emerged as a prominent player in the global water as fuel market, led by rising traction of the solutions in countries such as Germany, France, and the Netherlands. High emphasis on achieving carbon neutrality underpins a robust demand for hydrogen technologies in the region. Stringent regulations and subsidies for renewable energy promote electrolyzer installations, and supporting market revenue growth. Hydrogen is pivotal in sectors such as industrial processes and transportation, positioning Europe for substantial industry growth. Collaborative projects and cross-border initiatives enhance hydrogen infrastructure, thereby supporting regional revenue expansion through advancements in hydrogen production, storage, and distribution technologies.
Asia Pacific
Asia Pacific market revenue growth is supported by developments in countries such as Japan, South Korea, and China, which subsequently account for significant revenue share respectively. Rapid industrialization and urbanization are key factors driving the need for cleaner energy solutions, and this is boosting hydrogen demand. Technological developments in PEM electrolysis and fuel cells supports the region's commitment to innovation. Robust government initiatives, such as China's push for hydrogen economy development, further accelerate market expansion. Strong emphasis on green transportation, fuel cell adoption, and hydrogen infrastructure investments position Asia-Pacific as a key player in driving global revenue growth.
Latin America
Latin America exhibits a burgeoning water as fuel market, with Brazil and Chile leading the charge. The region's vast renewable energy resources align well with hydrogen production through electrolysis. Increasing interest in sustainable transportation and power generation drives market share growth. Technological developments in electrolyzer efficiency and integration with renewable sources fuel industry growth. Government-backed initiatives promoting clean energy adoption provide momentum for revenue expansion. Collaborative efforts between countries encourage regional hydrogen infrastructure development, elevating Latin America's position in the global water as fuel market.
Middle East & Africa
Middle East & Africa market revenue growth is expected to incline moderately initially, spearheaded by the United Arab Emirates and South Africa showing interest in water-as-fuel as a potential energy alternative. Abundant renewable energy potential accelerates hydrogen production through electrolysis. Strategic investments in infrastructure and hydrogen projects offer growth prospects. Technological advancements in electrolyzer efficiency contribute to market share expansion. Initiatives aimed at diversifying energy portfolios and addressing environmental challenges bolster revenue growth. As the region seeks energy diversification, hydrogen emerges as a pivotal player in driving sustainable economic growth and clean energy transitions.
Key Regions and Countries
North America
- US
- Canada
- Mexico
Western Europe
- Germany
- France
- The UK
- Spain
- Italy
- Portugal
- Ireland
- Austria
- Switzerland
- Benelux
- Nordic
- Rest of Western Europe
Eastern Europe
- Russia
- Poland
- The Czech Republic
- Greece
- Rest of Eastern Europe
APAC
- China
- Japan
- South Korea
- India
- Australia & New Zealand
- Indonesia
- Malaysia
- Philippines
- Singapore
- Thailand
- Vietnam
- Rest of APAC
Latin America
- Brazil
- Colombia
- Chile
- Argentina
- Costa Rica
- Rest of Latin America
Middle East & Africa
- Algeria
- Egypt
- Israel
- Kuwait
- Nigeria
- Saudi Arabia
- South Africa
- Turkey
- United Arab Emirates
- Rest of MEA
Competitive Landscape
The landscape in the global water as fuel market is getting increasingly competitive and evolving rapidly, and this is driven by increasing urgency to transition to cleaner energy sources. Leading players in this landscape include a mix of established energy giants, innovative startups, and research institutions. The dynamism of the market is characterized by a blend of technology advancements, strategic partnerships, and government initiatives.
Siemens holds a significant position in the water as fuel market. With a strong focus on electrolyzer development and integration, the company is leveraging its extensive expertise to drive efficiency improvements and scalability in hydrogen production. Its collaborations with research institutes and its involvement in green hydrogen projects bolster its competitive standing.
ITM Power is a pioneer in electrolyzer technology, and commands a notable presence in the water-as-fuel landscape. Known for its advancements in both PEM and alkaline electrolyzers, ITM Power's solutions cater to a wide range of industries seeking to integrate green hydrogen into their operations. The company's strategic partnerships and project deployments underline its competitive advantage.
Ballard Power Systems is a frontrunner in fuel cell technology, and contributes to the water as fuel market by providing advanced fuel cells for various applications. Its collaborations with industry players and government agencies reinforce its competitive positioning, particularly in the transportation sector where hydrogen fuel cells are gaining momentum.
Enapter, which is an emerging player in this market, specializes in modular hydrogen generators. The company’s innovative approach and emphasis on decentralized hydrogen production align with the market trends. Enapter's compact electrolysers are suited for residential, commercial, and industrial applications, positioning the company as a disruptor in the competitive landscape.
Plug Power indicates high focus on fuel cell solutions for mobility and stationary power applications, and holds a strong position, particularly in the transportation sector. Its partnerships with major companies and involvement in key projects strengthen its competitive presence.
The competitive landscape is further enriched by collaborations between research institutions, governments, and private entities. Initiatives like the European Clean Hydrogen Alliance and regional hydrogen development programs foster an environment of innovation and cooperation.
While established players bring their industry experience and resources to the table, innovative startups are driving disruptive technologies and expanding the market's horizons. The competitive landscape's trajectory hinges on technological advancements, regulatory support, and the ability of companies to provide comprehensive and cost-effective solutions to cater to the diverse needs of industries transitioning to a sustainable energy future.
Top Key Players in Water As Fuel Market
- Siemens AG
- ITM Power
- Ballard Power Systems
- Enapter
- Plug Power
- McPhy Energy
- Nel Hydrogen
- Hydrogenics Corporation
- FuelCell Energy
- Air Liquide
- Linde plc
- Ceres Power
- Green Hydrogen Systems
- Mitsubishi Power
- Thyssenkrupp Industrial Solutions AG
Recent Development
- In 2022, the company Water Fuel Cell Corporation announced that it had developed a water-powered fuel cell that could generate electricity with no emissions. The company is still in the early stages of development, but it hopes to bring its technology to market in the next few years.
- In 2023, the company Hydrogenics announced that it had developed a new type of water-splitting electrolyzer that is more efficient and less expensive than previous models. The company is currently testing its technology with partners in the automotive and energy industries.
- In 2023, the company Aquafuel Energy announced that it had received funding from the US Department of Energy to develop a water-powered fuel cell for use in buses and trucks. The company hopes to have its technology ready for commercialization in the next few years.
Report Scope:
Report Features Description Market Value (2022) USD 3.4 Bn Forecast Revenue (2032) USD 23.3 Bn CAGR (2023-2032) 21.8% Base Year for Estimation 2022 Historic Period 2016-2022 Forecast Period 2023-2032 Report Coverage Revenue Forecast, Market Dynamics, Competitive Landscape, Competitive Analysis, Segment and Sub-segment Breakdown and Analysis, Trend Analysis, Opportunity & Strategy Reporting Segments Covered Application (Industrial Hydrogen Production, Transportation, Power Generation, Chemical Processes, Others), Technology (Proton Exchange Membrane (PEM) Electrolysis, Alkaline Electrolysis, Solid Oxide Electrolysis, Photoelectrochemical (PEC) Hydrogen Production, Biological Hydrogen Production), End-Use Industry (Refineries, Manufacturing, Petrochemicals, Utilities, Automotive, Aerospace, Electronics, Others), Product Type (Electrolyzers (PEM, Alkaline, Solid Oxide), Fuel Cells, Hydrogen Storage Systems, Hydrogen Infrastructure, Others), Distribution Mode (On-Site Hydrogen Production, Centralized Hydrogen Production, Pipeline Distribution, Transport Distribution (Cylinders, Tankers), Others) Regional Analysis North America (United States, Canada); Asia Pacific (China, India, Japan, Australia & New Zealand, Association of Southeast Asian Nations (ASEAN), Rest of Asia Pacific); Europe (Germany, U.K., France, Spain, Italy, Russia, Poland, BENELUX [Belgium, the Netherlands, Luxembourg], NORDIC [Norway, Sweden, Finland, Denmark], Rest of Europe); Latin America (Brazil, Mexico, Argentina, Rest of Latin America); Middle East & Africa (Saudi Arabia, United Arab Emirates, South Africa, Egypt, Israel, Rest of Middle East & Africa) Competitive Landscape Siemens AG, ITM Power, Ballard Power Systems, Enapter, Plug Power, McPhy Energy, Nel Hydrogen, Hydrogenics Corporation, FuelCell Energy, Air Liquide, Linde plc, Ceres Power, Green Hydrogen Systems, Mitsubishi Power, Thyssenkrupp Industrial Solutions AG Customization Scope Further customization of segments, regions/country-breakdown can be provided upon request. Purchase Options Licenses Available are Single User License, Multi-User License (Up to 5 Users), Corporate Use License (Unlimited User and Printable PDF) -
- 1. Executive Summary
- 1.1. Definition
- 1.2. Taxonomy
- 1.3. Research Scope
- 1.4. Key Analysis
- 1.5. Key Findings by Major Segments
- 1.6. Top strategies by Major Players
- 2. Global Water As Fuel Market Overview
- 2.1. Water As Fuel Market Dynamics
- 2.1.1. Drivers
- 2.1.2. Opportunities
- 2.1.3. Restraints
- 2.1.4. Challenges
- 2.2. Macro-economic Factors
- 2.3. Regulatory Framework
- 2.4. Market Investment Feasibility Index
- 2.5. PEST Analysis
- 2.6. PORTER’S Five Force Analysis
- 2.7. Drivers & Restraints Impact Analysis
- 2.8. Industry Chain Analysis
- 2.9. Cost Structure Analysis
- 2.10. Marketing Strategy
- 2.11. Russia-Ukraine War Impact Analysis
- 2.12. Opportunity Map Analysis
- 2.13. Market Competition Scenario Analysis
- 2.14. Product Life Cycle Analysis
- 2.15. Opportunity Orbits
- 2.16. Manufacturer Intensity Map
- 2.17. Major Companies sales by Value & Volume
- 2.1. Water As Fuel Market Dynamics
- 3. Global Water As Fuel Market Analysis, Opportunity and Forecast, 2016-2032
- 3.1. Global Water As Fuel Market Analysis, 2016-2021
- 3.2. Global Water As Fuel Market Opportunity and Forecast, 2023-2032
- 3.3. Global Water As Fuel Market Analysis, Opportunity and Forecast, By By Application Segmentation, 2016-2032
- 3.3.1. Global Water As Fuel Market Analysis by By Application Segmentation: Introduction
- 3.3.2. Market Size Absolute $ Opportunity Analysis and Forecast, By By Application Segmentation, 2016-2032
- 3.3.3. Industrial Hydrogen Production
- 3.3.4. Transportation
- 3.3.5. Power Generation
- 3.3.6. Chemical Processes
- 3.3.7. Others
- 3.4. Global Water As Fuel Market Analysis, Opportunity and Forecast, By By Technology Segmentation, 2016-2032
- 3.4.1. Global Water As Fuel Market Analysis by By Technology Segmentation: Introduction
- 3.4.2. Market Size Absolute $ Opportunity Analysis and Forecast, By By Technology Segmentation, 2016-2032
- 3.4.3. Proton Exchange Membrane (PEM) Electrolysis
- 3.4.4. Alkaline Electrolysis
- 3.4.5. Solid Oxide Electrolysis
- 3.4.6. Photoelectrochemical (PEC) Hydrogen Production
- 3.4.7. Biological Hydrogen Production
- 3.5. Global Water As Fuel Market Analysis, Opportunity and Forecast, By By End-Use Industry Segmentation, 2016-2032
- 3.5.1. Global Water As Fuel Market Analysis by By End-Use Industry Segmentation: Introduction
- 3.5.2. Market Size Absolute $ Opportunity Analysis and Forecast, By By End-Use Industry Segmentation, 2016-2032
- 3.5.3. Refineries
- 3.5.4. Manufacturing
- 3.5.5. Petrochemicals
- 3.5.6. Utilities
- 3.5.7. Automotive
- 3.5.8. Aerospace
- 3.5.9. Electronics
- 3.5.10. Others
- 3.6. Global Water As Fuel Market Analysis, Opportunity and Forecast, By By Product Type Segmentation, 2016-2032
- 3.6.1. Global Water As Fuel Market Analysis by By Product Type Segmentation: Introduction
- 3.6.2. Market Size Absolute $ Opportunity Analysis and Forecast, By By Product Type Segmentation, 2016-2032
- 3.6.3. Electrolyzers (PEM, Alkaline, Solid Oxide)
- 3.6.4. Fuel Cells
- 3.6.5. Hydrogen Storage Systems
- 3.6.6. Hydrogen Infrastructure
- 3.6.7. Others
- 3.7. Global Water As Fuel Market Analysis, Opportunity and Forecast, By By Distribution Mode Segmentation, 2016-2032
- 3.7.1. Global Water As Fuel Market Analysis by By Distribution Mode Segmentation: Introduction
- 3.7.2. Market Size Absolute $ Opportunity Analysis and Forecast, By By Distribution Mode Segmentation, 2016-2032
- 3.7.3. On-Site Hydrogen Production
- 3.7.4. Centralized Hydrogen Production
- 3.7.5. Pipeline Distribution
- 3.7.6. Transport Distribution (Cylinders, Tankers)
- 3.7.7. Others
- 4. North America Water As Fuel Market Analysis, Opportunity and Forecast, 2016-2032
- 4.1. North America Water As Fuel Market Analysis, 2016-2021
- 4.2. North America Water As Fuel Market Opportunity and Forecast, 2023-2032
- 4.3. North America Water As Fuel Market Analysis, Opportunity and Forecast, By By Application Segmentation, 2016-2032
- 4.3.1. North America Water As Fuel Market Analysis by By Application Segmentation: Introduction
- 4.3.2. Market Size Absolute $ Opportunity Analysis and Forecast, By By Application Segmentation, 2016-2032
- 4.3.3. Industrial Hydrogen Production
- 4.3.4. Transportation
- 4.3.5. Power Generation
- 4.3.6. Chemical Processes
- 4.3.7. Others
- 4.4. North America Water As Fuel Market Analysis, Opportunity and Forecast, By By Technology Segmentation, 2016-2032
- 4.4.1. North America Water As Fuel Market Analysis by By Technology Segmentation: Introduction
- 4.4.2. Market Size Absolute $ Opportunity Analysis and Forecast, By By Technology Segmentation, 2016-2032
- 4.4.3. Proton Exchange Membrane (PEM) Electrolysis
- 4.4.4. Alkaline Electrolysis
- 4.4.5. Solid Oxide Electrolysis
- 4.4.6. Photoelectrochemical (PEC) Hydrogen Production
- 4.4.7. Biological Hydrogen Production
- 4.5. North America Water As Fuel Market Analysis, Opportunity and Forecast, By By End-Use Industry Segmentation, 2016-2032
- 4.5.1. North America Water As Fuel Market Analysis by By End-Use Industry Segmentation: Introduction
- 4.5.2. Market Size Absolute $ Opportunity Analysis and Forecast, By By End-Use Industry Segmentation, 2016-2032
- 4.5.3. Refineries
- 4.5.4. Manufacturing
- 4.5.5. Petrochemicals
- 4.5.6. Utilities
- 4.5.7. Automotive
- 4.5.8. Aerospace
- 4.5.9. Electronics
- 4.5.10. Others
- 4.6. North America Water As Fuel Market Analysis, Opportunity and Forecast, By By Product Type Segmentation, 2016-2032
- 4.6.1. North America Water As Fuel Market Analysis by By Product Type Segmentation: Introduction
- 4.6.2. Market Size Absolute $ Opportunity Analysis and Forecast, By By Product Type Segmentation, 2016-2032
- 4.6.3. Electrolyzers (PEM, Alkaline, Solid Oxide)
- 4.6.4. Fuel Cells
- 4.6.5. Hydrogen Storage Systems
- 4.6.6. Hydrogen Infrastructure
- 4.6.7. Others
- 4.7. North America Water As Fuel Market Analysis, Opportunity and Forecast, By By Distribution Mode Segmentation, 2016-2032
- 4.7.1. North America Water As Fuel Market Analysis by By Distribution Mode Segmentation: Introduction
- 4.7.2. Market Size Absolute $ Opportunity Analysis and Forecast, By By Distribution Mode Segmentation, 2016-2032
- 4.7.3. On-Site Hydrogen Production
- 4.7.4. Centralized Hydrogen Production
- 4.7.5. Pipeline Distribution
- 4.7.6. Transport Distribution (Cylinders, Tankers)
- 4.7.7. Others
- 4.8. North America Water As Fuel Market Analysis, Opportunity and Forecast, By Country , 2016-2032
- 4.8.1. North America Water As Fuel Market Analysis by Country : Introduction
- 4.8.2. Market Size Absolute $ Opportunity Analysis and Forecast, Country , 2016-2032
- 4.8.2.1. The US
- 4.8.2.2. Canada
- 4.8.2.3. Mexico
- 5. Western Europe Water As Fuel Market Analysis, Opportunity and Forecast, 2016-2032
- 5.1. Western Europe Water As Fuel Market Analysis, 2016-2021
- 5.2. Western Europe Water As Fuel Market Opportunity and Forecast, 2023-2032
- 5.3. Western Europe Water As Fuel Market Analysis, Opportunity and Forecast, By By Application Segmentation, 2016-2032
- 5.3.1. Western Europe Water As Fuel Market Analysis by By Application Segmentation: Introduction
- 5.3.2. Market Size Absolute $ Opportunity Analysis and Forecast, By By Application Segmentation, 2016-2032
- 5.3.3. Industrial Hydrogen Production
- 5.3.4. Transportation
- 5.3.5. Power Generation
- 5.3.6. Chemical Processes
- 5.3.7. Others
- 5.4. Western Europe Water As Fuel Market Analysis, Opportunity and Forecast, By By Technology Segmentation, 2016-2032
- 5.4.1. Western Europe Water As Fuel Market Analysis by By Technology Segmentation: Introduction
- 5.4.2. Market Size Absolute $ Opportunity Analysis and Forecast, By By Technology Segmentation, 2016-2032
- 5.4.3. Proton Exchange Membrane (PEM) Electrolysis
- 5.4.4. Alkaline Electrolysis
- 5.4.5. Solid Oxide Electrolysis
- 5.4.6. Photoelectrochemical (PEC) Hydrogen Production
- 5.4.7. Biological Hydrogen Production
- 5.5. Western Europe Water As Fuel Market Analysis, Opportunity and Forecast, By By End-Use Industry Segmentation, 2016-2032
- 5.5.1. Western Europe Water As Fuel Market Analysis by By End-Use Industry Segmentation: Introduction
- 5.5.2. Market Size Absolute $ Opportunity Analysis and Forecast, By By End-Use Industry Segmentation, 2016-2032
- 5.5.3. Refineries
- 5.5.4. Manufacturing
- 5.5.5. Petrochemicals
- 5.5.6. Utilities
- 5.5.7. Automotive
- 5.5.8. Aerospace
- 5.5.9. Electronics
- 5.5.10. Others
- 5.6. Western Europe Water As Fuel Market Analysis, Opportunity and Forecast, By By Product Type Segmentation, 2016-2032
- 5.6.1. Western Europe Water As Fuel Market Analysis by By Product Type Segmentation: Introduction
- 5.6.2. Market Size Absolute $ Opportunity Analysis and Forecast, By By Product Type Segmentation, 2016-2032
- 5.6.3. Electrolyzers (PEM, Alkaline, Solid Oxide)
- 5.6.4. Fuel Cells
- 5.6.5. Hydrogen Storage Systems
- 5.6.6. Hydrogen Infrastructure
- 5.6.7. Others
- 5.7. Western Europe Water As Fuel Market Analysis, Opportunity and Forecast, By By Distribution Mode Segmentation, 2016-2032
- 5.7.1. Western Europe Water As Fuel Market Analysis by By Distribution Mode Segmentation: Introduction
- 5.7.2. Market Size Absolute $ Opportunity Analysis and Forecast, By By Distribution Mode Segmentation, 2016-2032
- 5.7.3. On-Site Hydrogen Production
- 5.7.4. Centralized Hydrogen Production
- 5.7.5. Pipeline Distribution
- 5.7.6. Transport Distribution (Cylinders, Tankers)
- 5.7.7. Others
- 5.8. Western Europe Water As Fuel Market Analysis, Opportunity and Forecast, By Country , 2016-2032
- 5.8.1. Western Europe Water As Fuel Market Analysis by Country : Introduction
- 5.8.2. Market Size Absolute $ Opportunity Analysis and Forecast, Country , 2016-2032
- 5.8.2.1. Germany
- 5.8.2.2. France
- 5.8.2.3. The UK
- 5.8.2.4. Spain
- 5.8.2.5. Italy
- 5.8.2.6. Portugal
- 5.8.2.7. Ireland
- 5.8.2.8. Austria
- 5.8.2.9. Switzerland
- 5.8.2.10. Benelux
- 5.8.2.11. Nordic
- 5.8.2.12. Rest of Western Europe
- 6. Eastern Europe Water As Fuel Market Analysis, Opportunity and Forecast, 2016-2032
- 6.1. Eastern Europe Water As Fuel Market Analysis, 2016-2021
- 6.2. Eastern Europe Water As Fuel Market Opportunity and Forecast, 2023-2032
- 6.3. Eastern Europe Water As Fuel Market Analysis, Opportunity and Forecast, By By Application Segmentation, 2016-2032
- 6.3.1. Eastern Europe Water As Fuel Market Analysis by By Application Segmentation: Introduction
- 6.3.2. Market Size Absolute $ Opportunity Analysis and Forecast, By By Application Segmentation, 2016-2032
- 6.3.3. Industrial Hydrogen Production
- 6.3.4. Transportation
- 6.3.5. Power Generation
- 6.3.6. Chemical Processes
- 6.3.7. Others
- 6.4. Eastern Europe Water As Fuel Market Analysis, Opportunity and Forecast, By By Technology Segmentation, 2016-2032
- 6.4.1. Eastern Europe Water As Fuel Market Analysis by By Technology Segmentation: Introduction
- 6.4.2. Market Size Absolute $ Opportunity Analysis and Forecast, By By Technology Segmentation, 2016-2032
- 6.4.3. Proton Exchange Membrane (PEM) Electrolysis
- 6.4.4. Alkaline Electrolysis
- 6.4.5. Solid Oxide Electrolysis
- 6.4.6. Photoelectrochemical (PEC) Hydrogen Production
- 6.4.7. Biological Hydrogen Production
- 6.5. Eastern Europe Water As Fuel Market Analysis, Opportunity and Forecast, By By End-Use Industry Segmentation, 2016-2032
- 6.5.1. Eastern Europe Water As Fuel Market Analysis by By End-Use Industry Segmentation: Introduction
- 6.5.2. Market Size Absolute $ Opportunity Analysis and Forecast, By By End-Use Industry Segmentation, 2016-2032
- 6.5.3. Refineries
- 6.5.4. Manufacturing
- 6.5.5. Petrochemicals
- 6.5.6. Utilities
- 6.5.7. Automotive
- 6.5.8. Aerospace
- 6.5.9. Electronics
- 6.5.10. Others
- 6.6. Eastern Europe Water As Fuel Market Analysis, Opportunity and Forecast, By By Product Type Segmentation, 2016-2032
- 6.6.1. Eastern Europe Water As Fuel Market Analysis by By Product Type Segmentation: Introduction
- 6.6.2. Market Size Absolute $ Opportunity Analysis and Forecast, By By Product Type Segmentation, 2016-2032
- 6.6.3. Electrolyzers (PEM, Alkaline, Solid Oxide)
- 6.6.4. Fuel Cells
- 6.6.5. Hydrogen Storage Systems
- 6.6.6. Hydrogen Infrastructure
- 6.6.7. Others
- 6.7. Eastern Europe Water As Fuel Market Analysis, Opportunity and Forecast, By By Distribution Mode Segmentation, 2016-2032
- 6.7.1. Eastern Europe Water As Fuel Market Analysis by By Distribution Mode Segmentation: Introduction
- 6.7.2. Market Size Absolute $ Opportunity Analysis and Forecast, By By Distribution Mode Segmentation, 2016-2032
- 6.7.3. On-Site Hydrogen Production
- 6.7.4. Centralized Hydrogen Production
- 6.7.5. Pipeline Distribution
- 6.7.6. Transport Distribution (Cylinders, Tankers)
- 6.7.7. Others
- 6.8. Eastern Europe Water As Fuel Market Analysis, Opportunity and Forecast, By Country , 2016-2032
- 6.8.1. Eastern Europe Water As Fuel Market Analysis by Country : Introduction
- 6.8.2. Market Size Absolute $ Opportunity Analysis and Forecast, Country , 2016-2032
- 6.8.2.1. Russia
- 6.8.2.2. Poland
- 6.8.2.3. The Czech Republic
- 6.8.2.4. Greece
- 6.8.2.5. Rest of Eastern Europe
- 7. APAC Water As Fuel Market Analysis, Opportunity and Forecast, 2016-2032
- 7.1. APAC Water As Fuel Market Analysis, 2016-2021
- 7.2. APAC Water As Fuel Market Opportunity and Forecast, 2023-2032
- 7.3. APAC Water As Fuel Market Analysis, Opportunity and Forecast, By By Application Segmentation, 2016-2032
- 7.3.1. APAC Water As Fuel Market Analysis by By Application Segmentation: Introduction
- 7.3.2. Market Size Absolute $ Opportunity Analysis and Forecast, By By Application Segmentation, 2016-2032
- 7.3.3. Industrial Hydrogen Production
- 7.3.4. Transportation
- 7.3.5. Power Generation
- 7.3.6. Chemical Processes
- 7.3.7. Others
- 7.4. APAC Water As Fuel Market Analysis, Opportunity and Forecast, By By Technology Segmentation, 2016-2032
- 7.4.1. APAC Water As Fuel Market Analysis by By Technology Segmentation: Introduction
- 7.4.2. Market Size Absolute $ Opportunity Analysis and Forecast, By By Technology Segmentation, 2016-2032
- 7.4.3. Proton Exchange Membrane (PEM) Electrolysis
- 7.4.4. Alkaline Electrolysis
- 7.4.5. Solid Oxide Electrolysis
- 7.4.6. Photoelectrochemical (PEC) Hydrogen Production
- 7.4.7. Biological Hydrogen Production
- 7.5. APAC Water As Fuel Market Analysis, Opportunity and Forecast, By By End-Use Industry Segmentation, 2016-2032
- 7.5.1. APAC Water As Fuel Market Analysis by By End-Use Industry Segmentation: Introduction
- 7.5.2. Market Size Absolute $ Opportunity Analysis and Forecast, By By End-Use Industry Segmentation, 2016-2032
- 7.5.3. Refineries
- 7.5.4. Manufacturing
- 7.5.5. Petrochemicals
- 7.5.6. Utilities
- 7.5.7. Automotive
- 7.5.8. Aerospace
- 7.5.9. Electronics
- 7.5.10. Others
- 7.6. APAC Water As Fuel Market Analysis, Opportunity and Forecast, By By Product Type Segmentation, 2016-2032
- 7.6.1. APAC Water As Fuel Market Analysis by By Product Type Segmentation: Introduction
- 7.6.2. Market Size Absolute $ Opportunity Analysis and Forecast, By By Product Type Segmentation, 2016-2032
- 7.6.3. Electrolyzers (PEM, Alkaline, Solid Oxide)
- 7.6.4. Fuel Cells
- 7.6.5. Hydrogen Storage Systems
- 7.6.6. Hydrogen Infrastructure
- 7.6.7. Others
- 7.7. APAC Water As Fuel Market Analysis, Opportunity and Forecast, By By Distribution Mode Segmentation, 2016-2032
- 7.7.1. APAC Water As Fuel Market Analysis by By Distribution Mode Segmentation: Introduction
- 7.7.2. Market Size Absolute $ Opportunity Analysis and Forecast, By By Distribution Mode Segmentation, 2016-2032
- 7.7.3. On-Site Hydrogen Production
- 7.7.4. Centralized Hydrogen Production
- 7.7.5. Pipeline Distribution
- 7.7.6. Transport Distribution (Cylinders, Tankers)
- 7.7.7. Others
- 7.8. APAC Water As Fuel Market Analysis, Opportunity and Forecast, By Country , 2016-2032
- 7.8.1. APAC Water As Fuel Market Analysis by Country : Introduction
- 7.8.2. Market Size Absolute $ Opportunity Analysis and Forecast, Country , 2016-2032
- 7.8.2.1. China
- 7.8.2.2. Japan
- 7.8.2.3. South Korea
- 7.8.2.4. India
- 7.8.2.5. Australia & New Zeland
- 7.8.2.6. Indonesia
- 7.8.2.7. Malaysia
- 7.8.2.8. Philippines
- 7.8.2.9. Singapore
- 7.8.2.10. Thailand
- 7.8.2.11. Vietnam
- 7.8.2.12. Rest of APAC
- 8. Latin America Water As Fuel Market Analysis, Opportunity and Forecast, 2016-2032
- 8.1. Latin America Water As Fuel Market Analysis, 2016-2021
- 8.2. Latin America Water As Fuel Market Opportunity and Forecast, 2023-2032
- 8.3. Latin America Water As Fuel Market Analysis, Opportunity and Forecast, By By Application Segmentation, 2016-2032
- 8.3.1. Latin America Water As Fuel Market Analysis by By Application Segmentation: Introduction
- 8.3.2. Market Size Absolute $ Opportunity Analysis and Forecast, By By Application Segmentation, 2016-2032
- 8.3.3. Industrial Hydrogen Production
- 8.3.4. Transportation
- 8.3.5. Power Generation
- 8.3.6. Chemical Processes
- 8.3.7. Others
- 8.4. Latin America Water As Fuel Market Analysis, Opportunity and Forecast, By By Technology Segmentation, 2016-2032
- 8.4.1. Latin America Water As Fuel Market Analysis by By Technology Segmentation: Introduction
- 8.4.2. Market Size Absolute $ Opportunity Analysis and Forecast, By By Technology Segmentation, 2016-2032
- 8.4.3. Proton Exchange Membrane (PEM) Electrolysis
- 8.4.4. Alkaline Electrolysis
- 8.4.5. Solid Oxide Electrolysis
- 8.4.6. Photoelectrochemical (PEC) Hydrogen Production
- 8.4.7. Biological Hydrogen Production
- 8.5. Latin America Water As Fuel Market Analysis, Opportunity and Forecast, By By End-Use Industry Segmentation, 2016-2032
- 8.5.1. Latin America Water As Fuel Market Analysis by By End-Use Industry Segmentation: Introduction
- 8.5.2. Market Size Absolute $ Opportunity Analysis and Forecast, By By End-Use Industry Segmentation, 2016-2032
- 8.5.3. Refineries
- 8.5.4. Manufacturing
- 8.5.5. Petrochemicals
- 8.5.6. Utilities
- 8.5.7. Automotive
- 8.5.8. Aerospace
- 8.5.9. Electronics
- 8.5.10. Others
- 8.6. Latin America Water As Fuel Market Analysis, Opportunity and Forecast, By By Product Type Segmentation, 2016-2032
- 8.6.1. Latin America Water As Fuel Market Analysis by By Product Type Segmentation: Introduction
- 8.6.2. Market Size Absolute $ Opportunity Analysis and Forecast, By By Product Type Segmentation, 2016-2032
- 8.6.3. Electrolyzers (PEM, Alkaline, Solid Oxide)
- 8.6.4. Fuel Cells
- 8.6.5. Hydrogen Storage Systems
- 8.6.6. Hydrogen Infrastructure
- 8.6.7. Others
- 8.7. Latin America Water As Fuel Market Analysis, Opportunity and Forecast, By By Distribution Mode Segmentation, 2016-2032
- 8.7.1. Latin America Water As Fuel Market Analysis by By Distribution Mode Segmentation: Introduction
- 8.7.2. Market Size Absolute $ Opportunity Analysis and Forecast, By By Distribution Mode Segmentation, 2016-2032
- 8.7.3. On-Site Hydrogen Production
- 8.7.4. Centralized Hydrogen Production
- 8.7.5. Pipeline Distribution
- 8.7.6. Transport Distribution (Cylinders, Tankers)
- 8.7.7. Others
- 8.8. Latin America Water As Fuel Market Analysis, Opportunity and Forecast, By Country , 2016-2032
- 8.8.1. Latin America Water As Fuel Market Analysis by Country : Introduction
- 8.8.2. Market Size Absolute $ Opportunity Analysis and Forecast, Country , 2016-2032
- 8.8.2.1. Brazil
- 8.8.2.2. Colombia
- 8.8.2.3. Chile
- 8.8.2.4. Argentina
- 8.8.2.5. Costa Rica
- 8.8.2.6. Rest of Latin America
- 9. Middle East & Africa Water As Fuel Market Analysis, Opportunity and Forecast, 2016-2032
- 9.1. Middle East & Africa Water As Fuel Market Analysis, 2016-2021
- 9.2. Middle East & Africa Water As Fuel Market Opportunity and Forecast, 2023-2032
- 9.3. Middle East & Africa Water As Fuel Market Analysis, Opportunity and Forecast, By By Application Segmentation, 2016-2032
- 9.3.1. Middle East & Africa Water As Fuel Market Analysis by By Application Segmentation: Introduction
- 9.3.2. Market Size Absolute $ Opportunity Analysis and Forecast, By By Application Segmentation, 2016-2032
- 9.3.3. Industrial Hydrogen Production
- 9.3.4. Transportation
- 9.3.5. Power Generation
- 9.3.6. Chemical Processes
- 9.3.7. Others
- 9.4. Middle East & Africa Water As Fuel Market Analysis, Opportunity and Forecast, By By Technology Segmentation, 2016-2032
- 9.4.1. Middle East & Africa Water As Fuel Market Analysis by By Technology Segmentation: Introduction
- 9.4.2. Market Size Absolute $ Opportunity Analysis and Forecast, By By Technology Segmentation, 2016-2032
- 9.4.3. Proton Exchange Membrane (PEM) Electrolysis
- 9.4.4. Alkaline Electrolysis
- 9.4.5. Solid Oxide Electrolysis
- 9.4.6. Photoelectrochemical (PEC) Hydrogen Production
- 9.4.7. Biological Hydrogen Production
- 9.5. Middle East & Africa Water As Fuel Market Analysis, Opportunity and Forecast, By By End-Use Industry Segmentation, 2016-2032
- 9.5.1. Middle East & Africa Water As Fuel Market Analysis by By End-Use Industry Segmentation: Introduction
- 9.5.2. Market Size Absolute $ Opportunity Analysis and Forecast, By By End-Use Industry Segmentation, 2016-2032
- 9.5.3. Refineries
- 9.5.4. Manufacturing
- 9.5.5. Petrochemicals
- 9.5.6. Utilities
- 9.5.7. Automotive
- 9.5.8. Aerospace
- 9.5.9. Electronics
- 9.5.10. Others
- 9.6. Middle East & Africa Water As Fuel Market Analysis, Opportunity and Forecast, By By Product Type Segmentation, 2016-2032
- 9.6.1. Middle East & Africa Water As Fuel Market Analysis by By Product Type Segmentation: Introduction
- 9.6.2. Market Size Absolute $ Opportunity Analysis and Forecast, By By Product Type Segmentation, 2016-2032
- 9.6.3. Electrolyzers (PEM, Alkaline, Solid Oxide)
- 9.6.4. Fuel Cells
- 9.6.5. Hydrogen Storage Systems
- 9.6.6. Hydrogen Infrastructure
- 9.6.7. Others
- 9.7. Middle East & Africa Water As Fuel Market Analysis, Opportunity and Forecast, By By Distribution Mode Segmentation, 2016-2032
- 9.7.1. Middle East & Africa Water As Fuel Market Analysis by By Distribution Mode Segmentation: Introduction
- 9.7.2. Market Size Absolute $ Opportunity Analysis and Forecast, By By Distribution Mode Segmentation, 2016-2032
- 9.7.3. On-Site Hydrogen Production
- 9.7.4. Centralized Hydrogen Production
- 9.7.5. Pipeline Distribution
- 9.7.6. Transport Distribution (Cylinders, Tankers)
- 9.7.7. Others
- 9.8. Middle East & Africa Water As Fuel Market Analysis, Opportunity and Forecast, By Country , 2016-2032
- 9.8.1. Middle East & Africa Water As Fuel Market Analysis by Country : Introduction
- 9.8.2. Market Size Absolute $ Opportunity Analysis and Forecast, Country , 2016-2032
- 9.8.2.1. Algeria
- 9.8.2.2. Egypt
- 9.8.2.3. Israel
- 9.8.2.4. Kuwait
- 9.8.2.5. Nigeria
- 9.8.2.6. Saudi Arabia
- 9.8.2.7. South Africa
- 9.8.2.8. Turkey
- 9.8.2.9. The UAE
- 9.8.2.10. Rest of MEA
- 10. Global Water As Fuel Market Analysis, Opportunity and Forecast, By Region , 2016-2032
- 10.1. Global Water As Fuel Market Analysis by Region : Introduction
- 10.2. Market Size Absolute $ Opportunity Analysis and Forecast, By Region , 2016-2032
- 10.2.1. North America
- 10.2.2. Western Europe
- 10.2.3. Eastern Europe
- 10.2.4. APAC
- 10.2.5. Latin America
- 10.2.6. Middle East & Africa
- 11. Global Water As Fuel Market Competitive Landscape, Market Share Analysis, and Company Profiles
- 11.1. Market Share Analysis
- 11.2. Company Profiles
- 11.3. Siemens AG
- 11.3.1. Company Overview
- 11.3.2. Financial Highlights
- 11.3.3. Product Portfolio
- 11.3.4. SWOT Analysis
- 11.3.5. Key Strategies and Developments
- 11.4. ITM Power
- 11.4.1. Company Overview
- 11.4.2. Financial Highlights
- 11.4.3. Product Portfolio
- 11.4.4. SWOT Analysis
- 11.4.5. Key Strategies and Developments
- 11.5. Ballard Power Systems
- 11.5.1. Company Overview
- 11.5.2. Financial Highlights
- 11.5.3. Product Portfolio
- 11.5.4. SWOT Analysis
- 11.5.5. Key Strategies and Developments
- 11.6. Enapter
- 11.6.1. Company Overview
- 11.6.2. Financial Highlights
- 11.6.3. Product Portfolio
- 11.6.4. SWOT Analysis
- 11.6.5. Key Strategies and Developments
- 11.7. Plug Power
- 11.7.1. Company Overview
- 11.7.2. Financial Highlights
- 11.7.3. Product Portfolio
- 11.7.4. SWOT Analysis
- 11.7.5. Key Strategies and Developments
- 11.8. McPhy Energy
- 11.8.1. Company Overview
- 11.8.2. Financial Highlights
- 11.8.3. Product Portfolio
- 11.8.4. SWOT Analysis
- 11.8.5. Key Strategies and Developments
- 11.9. Nel Hydrogen
- 11.9.1. Company Overview
- 11.9.2. Financial Highlights
- 11.9.3. Product Portfolio
- 11.9.4. SWOT Analysis
- 11.9.5. Key Strategies and Developments
- 11.10. Hydrogenics Corporation
- 11.10.1. Company Overview
- 11.10.2. Financial Highlights
- 11.10.3. Product Portfolio
- 11.10.4. SWOT Analysis
- 11.10.5. Key Strategies and Developments
- 11.11. FuelCell Energy
- 11.11.1. Company Overview
- 11.11.2. Financial Highlights
- 11.11.3. Product Portfolio
- 11.11.4. SWOT Analysis
- 11.11.5. Key Strategies and Developments
- 11.12. Air Liquide
- 11.12.1. Company Overview
- 11.12.2. Financial Highlights
- 11.12.3. Product Portfolio
- 11.12.4. SWOT Analysis
- 11.12.5. Key Strategies and Developments
- 11.13. Linde plc
- 11.13.1. Company Overview
- 11.13.2. Financial Highlights
- 11.13.3. Product Portfolio
- 11.13.4. SWOT Analysis
- 11.13.5. Key Strategies and Developments
- 11.14. Ceres Power
- 11.14.1. Company Overview
- 11.14.2. Financial Highlights
- 11.14.3. Product Portfolio
- 11.14.4. SWOT Analysis
- 11.14.5. Key Strategies and Developments
- 11.15. Green Hydrogen Systems
- 11.15.1. Company Overview
- 11.15.2. Financial Highlights
- 11.15.3. Product Portfolio
- 11.15.4. SWOT Analysis
- 11.15.5. Key Strategies and Developments
- 11.16. Mitsubishi Power
- 11.16.1. Company Overview
- 11.16.2. Financial Highlights
- 11.16.3. Product Portfolio
- 11.16.4. SWOT Analysis
- 11.16.5. Key Strategies and Developments
- 11.17. Thyssenkrupp Industrial Solutions AG
- 11.17.1. Company Overview
- 11.17.2. Financial Highlights
- 11.17.3. Product Portfolio
- 11.17.4. SWOT Analysis
- 11.17.5. Key Strategies and Developments
- 12. Assumptions and Acronyms
- 13. Research Methodology
- 14. Contact
- List of Figures
- Figure 1: Global Water As Fuel Market Revenue (US$ Mn) Market Share by By Application Segmentation in 2022
- Figure 2: Global Water As Fuel Market Attractiveness Analysis by By Application Segmentation, 2016-2032
- Figure 3: Global Water As Fuel Market Revenue (US$ Mn) Market Share by By Technology Segmentationin 2022
- Figure 4: Global Water As Fuel Market Attractiveness Analysis by By Technology Segmentation, 2016-2032
- Figure 5: Global Water As Fuel Market Revenue (US$ Mn) Market Share by By End-Use Industry Segmentationin 2022
- Figure 6: Global Water As Fuel Market Attractiveness Analysis by By End-Use Industry Segmentation, 2016-2032
- Figure 7: Global Water As Fuel Market Revenue (US$ Mn) Market Share by By Product Type Segmentationin 2022
- Figure 8: Global Water As Fuel Market Attractiveness Analysis by By Product Type Segmentation, 2016-2032
- Figure 9: Global Water As Fuel Market Revenue (US$ Mn) Market Share by By Distribution Mode Segmentationin 2022
- Figure 10: Global Water As Fuel Market Attractiveness Analysis by By Distribution Mode Segmentation, 2016-2032
- Figure 11: Global Water As Fuel Market Revenue (US$ Mn) Market Share by Region in 2022
- Figure 12: Global Water As Fuel Market Attractiveness Analysis by Region, 2016-2032
- Figure 13: Global Water As Fuel Market Revenue (US$ Mn) (2016-2032)
- Figure 14: Global Water As Fuel Market Revenue (US$ Mn) Comparison by Region (2016-2032)
- Figure 15: Global Water As Fuel Market Revenue (US$ Mn) Comparison by By Application Segmentation (2016-2032)
- Figure 16: Global Water As Fuel Market Revenue (US$ Mn) Comparison by By Technology Segmentation (2016-2032)
- Figure 17: Global Water As Fuel Market Revenue (US$ Mn) Comparison by By End-Use Industry Segmentation (2016-2032)
- Figure 18: Global Water As Fuel Market Revenue (US$ Mn) Comparison by By Product Type Segmentation (2016-2032)
- Figure 19: Global Water As Fuel Market Revenue (US$ Mn) Comparison by By Distribution Mode Segmentation (2016-2032)
- Figure 20: Global Water As Fuel Market Y-o-Y Growth Rate Comparison by Region (2016-2032)
- Figure 21: Global Water As Fuel Market Y-o-Y Growth Rate Comparison by By Application Segmentation (2016-2032)
- Figure 22: Global Water As Fuel Market Y-o-Y Growth Rate Comparison by By Technology Segmentation (2016-2032)
- Figure 23: Global Water As Fuel Market Y-o-Y Growth Rate Comparison by By End-Use Industry Segmentation (2016-2032)
- Figure 24: Global Water As Fuel Market Y-o-Y Growth Rate Comparison by By Product Type Segmentation (2016-2032)
- Figure 25: Global Water As Fuel Market Y-o-Y Growth Rate Comparison by By Distribution Mode Segmentation (2016-2032)
- Figure 26: Global Water As Fuel Market Share Comparison by Region (2016-2032)
- Figure 27: Global Water As Fuel Market Share Comparison by By Application Segmentation (2016-2032)
- Figure 28: Global Water As Fuel Market Share Comparison by By Technology Segmentation (2016-2032)
- Figure 29: Global Water As Fuel Market Share Comparison by By End-Use Industry Segmentation (2016-2032)
- Figure 30: Global Water As Fuel Market Share Comparison by By Product Type Segmentation (2016-2032)
- Figure 31: Global Water As Fuel Market Share Comparison by By Distribution Mode Segmentation (2016-2032)
- Figure 32: North America Water As Fuel Market Revenue (US$ Mn) Market Share by By Application Segmentationin 2022
- Figure 33: North America Water As Fuel Market Attractiveness Analysis by By Application Segmentation, 2016-2032
- Figure 34: North America Water As Fuel Market Revenue (US$ Mn) Market Share by By Technology Segmentationin 2022
- Figure 35: North America Water As Fuel Market Attractiveness Analysis by By Technology Segmentation, 2016-2032
- Figure 36: North America Water As Fuel Market Revenue (US$ Mn) Market Share by By End-Use Industry Segmentationin 2022
- Figure 37: North America Water As Fuel Market Attractiveness Analysis by By End-Use Industry Segmentation, 2016-2032
- Figure 38: North America Water As Fuel Market Revenue (US$ Mn) Market Share by By Product Type Segmentationin 2022
- Figure 39: North America Water As Fuel Market Attractiveness Analysis by By Product Type Segmentation, 2016-2032
- Figure 40: North America Water As Fuel Market Revenue (US$ Mn) Market Share by By Distribution Mode Segmentationin 2022
- Figure 41: North America Water As Fuel Market Attractiveness Analysis by By Distribution Mode Segmentation, 2016-2032
- Figure 42: North America Water As Fuel Market Revenue (US$ Mn) Market Share by Country in 2022
- Figure 43: North America Water As Fuel Market Attractiveness Analysis by Country, 2016-2032
- Figure 44: North America Water As Fuel Market Revenue (US$ Mn) (2016-2032)
- Figure 45: North America Water As Fuel Market Revenue (US$ Mn) Comparison by Country (2016-2032)
- Figure 46: North America Water As Fuel Market Revenue (US$ Mn) Comparison by By Application Segmentation (2016-2032)
- Figure 47: North America Water As Fuel Market Revenue (US$ Mn) Comparison by By Technology Segmentation (2016-2032)
- Figure 48: North America Water As Fuel Market Revenue (US$ Mn) Comparison by By End-Use Industry Segmentation (2016-2032)
- Figure 49: North America Water As Fuel Market Revenue (US$ Mn) Comparison by By Product Type Segmentation (2016-2032)
- Figure 50: North America Water As Fuel Market Revenue (US$ Mn) Comparison by By Distribution Mode Segmentation (2016-2032)
- Figure 51: North America Water As Fuel Market Y-o-Y Growth Rate Comparison by Country (2016-2032)
- Figure 52: North America Water As Fuel Market Y-o-Y Growth Rate Comparison by By Application Segmentation (2016-2032)
- Figure 53: North America Water As Fuel Market Y-o-Y Growth Rate Comparison by By Technology Segmentation (2016-2032)
- Figure 54: North America Water As Fuel Market Y-o-Y Growth Rate Comparison by By End-Use Industry Segmentation (2016-2032)
- Figure 55: North America Water As Fuel Market Y-o-Y Growth Rate Comparison by By Product Type Segmentation (2016-2032)
- Figure 56: North America Water As Fuel Market Y-o-Y Growth Rate Comparison by By Distribution Mode Segmentation (2016-2032)
- Figure 57: North America Water As Fuel Market Share Comparison by Country (2016-2032)
- Figure 58: North America Water As Fuel Market Share Comparison by By Application Segmentation (2016-2032)
- Figure 59: North America Water As Fuel Market Share Comparison by By Technology Segmentation (2016-2032)
- Figure 60: North America Water As Fuel Market Share Comparison by By End-Use Industry Segmentation (2016-2032)
- Figure 61: North America Water As Fuel Market Share Comparison by By Product Type Segmentation (2016-2032)
- Figure 62: North America Water As Fuel Market Share Comparison by By Distribution Mode Segmentation (2016-2032)
- Figure 63: Western Europe Water As Fuel Market Revenue (US$ Mn) Market Share by By Application Segmentationin 2022
- Figure 64: Western Europe Water As Fuel Market Attractiveness Analysis by By Application Segmentation, 2016-2032
- Figure 65: Western Europe Water As Fuel Market Revenue (US$ Mn) Market Share by By Technology Segmentationin 2022
- Figure 66: Western Europe Water As Fuel Market Attractiveness Analysis by By Technology Segmentation, 2016-2032
- Figure 67: Western Europe Water As Fuel Market Revenue (US$ Mn) Market Share by By End-Use Industry Segmentationin 2022
- Figure 68: Western Europe Water As Fuel Market Attractiveness Analysis by By End-Use Industry Segmentation, 2016-2032
- Figure 69: Western Europe Water As Fuel Market Revenue (US$ Mn) Market Share by By Product Type Segmentationin 2022
- Figure 70: Western Europe Water As Fuel Market Attractiveness Analysis by By Product Type Segmentation, 2016-2032
- Figure 71: Western Europe Water As Fuel Market Revenue (US$ Mn) Market Share by By Distribution Mode Segmentationin 2022
- Figure 72: Western Europe Water As Fuel Market Attractiveness Analysis by By Distribution Mode Segmentation, 2016-2032
- Figure 73: Western Europe Water As Fuel Market Revenue (US$ Mn) Market Share by Country in 2022
- Figure 74: Western Europe Water As Fuel Market Attractiveness Analysis by Country, 2016-2032
- Figure 75: Western Europe Water As Fuel Market Revenue (US$ Mn) (2016-2032)
- Figure 76: Western Europe Water As Fuel Market Revenue (US$ Mn) Comparison by Country (2016-2032)
- Figure 77: Western Europe Water As Fuel Market Revenue (US$ Mn) Comparison by By Application Segmentation (2016-2032)
- Figure 78: Western Europe Water As Fuel Market Revenue (US$ Mn) Comparison by By Technology Segmentation (2016-2032)
- Figure 79: Western Europe Water As Fuel Market Revenue (US$ Mn) Comparison by By End-Use Industry Segmentation (2016-2032)
- Figure 80: Western Europe Water As Fuel Market Revenue (US$ Mn) Comparison by By Product Type Segmentation (2016-2032)
- Figure 81: Western Europe Water As Fuel Market Revenue (US$ Mn) Comparison by By Distribution Mode Segmentation (2016-2032)
- Figure 82: Western Europe Water As Fuel Market Y-o-Y Growth Rate Comparison by Country (2016-2032)
- Figure 83: Western Europe Water As Fuel Market Y-o-Y Growth Rate Comparison by By Application Segmentation (2016-2032)
- Figure 84: Western Europe Water As Fuel Market Y-o-Y Growth Rate Comparison by By Technology Segmentation (2016-2032)
- Figure 85: Western Europe Water As Fuel Market Y-o-Y Growth Rate Comparison by By End-Use Industry Segmentation (2016-2032)
- Figure 86: Western Europe Water As Fuel Market Y-o-Y Growth Rate Comparison by By Product Type Segmentation (2016-2032)
- Figure 87: Western Europe Water As Fuel Market Y-o-Y Growth Rate Comparison by By Distribution Mode Segmentation (2016-2032)
- Figure 88: Western Europe Water As Fuel Market Share Comparison by Country (2016-2032)
- Figure 89: Western Europe Water As Fuel Market Share Comparison by By Application Segmentation (2016-2032)
- Figure 90: Western Europe Water As Fuel Market Share Comparison by By Technology Segmentation (2016-2032)
- Figure 91: Western Europe Water As Fuel Market Share Comparison by By End-Use Industry Segmentation (2016-2032)
- Figure 92: Western Europe Water As Fuel Market Share Comparison by By Product Type Segmentation (2016-2032)
- Figure 93: Western Europe Water As Fuel Market Share Comparison by By Distribution Mode Segmentation (2016-2032)
- Figure 94: Eastern Europe Water As Fuel Market Revenue (US$ Mn) Market Share by By Application Segmentationin 2022
- Figure 95: Eastern Europe Water As Fuel Market Attractiveness Analysis by By Application Segmentation, 2016-2032
- Figure 96: Eastern Europe Water As Fuel Market Revenue (US$ Mn) Market Share by By Technology Segmentationin 2022
- Figure 97: Eastern Europe Water As Fuel Market Attractiveness Analysis by By Technology Segmentation, 2016-2032
- Figure 98: Eastern Europe Water As Fuel Market Revenue (US$ Mn) Market Share by By End-Use Industry Segmentationin 2022
- Figure 99: Eastern Europe Water As Fuel Market Attractiveness Analysis by By End-Use Industry Segmentation, 2016-2032
- Figure 100: Eastern Europe Water As Fuel Market Revenue (US$ Mn) Market Share by By Product Type Segmentationin 2022
- Figure 101: Eastern Europe Water As Fuel Market Attractiveness Analysis by By Product Type Segmentation, 2016-2032
- Figure 102: Eastern Europe Water As Fuel Market Revenue (US$ Mn) Market Share by By Distribution Mode Segmentationin 2022
- Figure 103: Eastern Europe Water As Fuel Market Attractiveness Analysis by By Distribution Mode Segmentation, 2016-2032
- Figure 104: Eastern Europe Water As Fuel Market Revenue (US$ Mn) Market Share by Country in 2022
- Figure 105: Eastern Europe Water As Fuel Market Attractiveness Analysis by Country, 2016-2032
- Figure 106: Eastern Europe Water As Fuel Market Revenue (US$ Mn) (2016-2032)
- Figure 107: Eastern Europe Water As Fuel Market Revenue (US$ Mn) Comparison by Country (2016-2032)
- Figure 108: Eastern Europe Water As Fuel Market Revenue (US$ Mn) Comparison by By Application Segmentation (2016-2032)
- Figure 109: Eastern Europe Water As Fuel Market Revenue (US$ Mn) Comparison by By Technology Segmentation (2016-2032)
- Figure 110: Eastern Europe Water As Fuel Market Revenue (US$ Mn) Comparison by By End-Use Industry Segmentation (2016-2032)
- Figure 111: Eastern Europe Water As Fuel Market Revenue (US$ Mn) Comparison by By Product Type Segmentation (2016-2032)
- Figure 112: Eastern Europe Water As Fuel Market Revenue (US$ Mn) Comparison by By Distribution Mode Segmentation (2016-2032)
- Figure 113: Eastern Europe Water As Fuel Market Y-o-Y Growth Rate Comparison by Country (2016-2032)
- Figure 114: Eastern Europe Water As Fuel Market Y-o-Y Growth Rate Comparison by By Application Segmentation (2016-2032)
- Figure 115: Eastern Europe Water As Fuel Market Y-o-Y Growth Rate Comparison by By Technology Segmentation (2016-2032)
- Figure 116: Eastern Europe Water As Fuel Market Y-o-Y Growth Rate Comparison by By End-Use Industry Segmentation (2016-2032)
- Figure 117: Eastern Europe Water As Fuel Market Y-o-Y Growth Rate Comparison by By Product Type Segmentation (2016-2032)
- Figure 118: Eastern Europe Water As Fuel Market Y-o-Y Growth Rate Comparison by By Distribution Mode Segmentation (2016-2032)
- Figure 119: Eastern Europe Water As Fuel Market Share Comparison by Country (2016-2032)
- Figure 120: Eastern Europe Water As Fuel Market Share Comparison by By Application Segmentation (2016-2032)
- Figure 121: Eastern Europe Water As Fuel Market Share Comparison by By Technology Segmentation (2016-2032)
- Figure 122: Eastern Europe Water As Fuel Market Share Comparison by By End-Use Industry Segmentation (2016-2032)
- Figure 123: Eastern Europe Water As Fuel Market Share Comparison by By Product Type Segmentation (2016-2032)
- Figure 124: Eastern Europe Water As Fuel Market Share Comparison by By Distribution Mode Segmentation (2016-2032)
- Figure 125: APAC Water As Fuel Market Revenue (US$ Mn) Market Share by By Application Segmentationin 2022
- Figure 126: APAC Water As Fuel Market Attractiveness Analysis by By Application Segmentation, 2016-2032
- Figure 127: APAC Water As Fuel Market Revenue (US$ Mn) Market Share by By Technology Segmentationin 2022
- Figure 128: APAC Water As Fuel Market Attractiveness Analysis by By Technology Segmentation, 2016-2032
- Figure 129: APAC Water As Fuel Market Revenue (US$ Mn) Market Share by By End-Use Industry Segmentationin 2022
- Figure 130: APAC Water As Fuel Market Attractiveness Analysis by By End-Use Industry Segmentation, 2016-2032
- Figure 131: APAC Water As Fuel Market Revenue (US$ Mn) Market Share by By Product Type Segmentationin 2022
- Figure 132: APAC Water As Fuel Market Attractiveness Analysis by By Product Type Segmentation, 2016-2032
- Figure 133: APAC Water As Fuel Market Revenue (US$ Mn) Market Share by By Distribution Mode Segmentationin 2022
- Figure 134: APAC Water As Fuel Market Attractiveness Analysis by By Distribution Mode Segmentation, 2016-2032
- Figure 135: APAC Water As Fuel Market Revenue (US$ Mn) Market Share by Country in 2022
- Figure 136: APAC Water As Fuel Market Attractiveness Analysis by Country, 2016-2032
- Figure 137: APAC Water As Fuel Market Revenue (US$ Mn) (2016-2032)
- Figure 138: APAC Water As Fuel Market Revenue (US$ Mn) Comparison by Country (2016-2032)
- Figure 139: APAC Water As Fuel Market Revenue (US$ Mn) Comparison by By Application Segmentation (2016-2032)
- Figure 140: APAC Water As Fuel Market Revenue (US$ Mn) Comparison by By Technology Segmentation (2016-2032)
- Figure 141: APAC Water As Fuel Market Revenue (US$ Mn) Comparison by By End-Use Industry Segmentation (2016-2032)
- Figure 142: APAC Water As Fuel Market Revenue (US$ Mn) Comparison by By Product Type Segmentation (2016-2032)
- Figure 143: APAC Water As Fuel Market Revenue (US$ Mn) Comparison by By Distribution Mode Segmentation (2016-2032)
- Figure 144: APAC Water As Fuel Market Y-o-Y Growth Rate Comparison by Country (2016-2032)
- Figure 145: APAC Water As Fuel Market Y-o-Y Growth Rate Comparison by By Application Segmentation (2016-2032)
- Figure 146: APAC Water As Fuel Market Y-o-Y Growth Rate Comparison by By Technology Segmentation (2016-2032)
- Figure 147: APAC Water As Fuel Market Y-o-Y Growth Rate Comparison by By End-Use Industry Segmentation (2016-2032)
- Figure 148: APAC Water As Fuel Market Y-o-Y Growth Rate Comparison by By Product Type Segmentation (2016-2032)
- Figure 149: APAC Water As Fuel Market Y-o-Y Growth Rate Comparison by By Distribution Mode Segmentation (2016-2032)
- Figure 150: APAC Water As Fuel Market Share Comparison by Country (2016-2032)
- Figure 151: APAC Water As Fuel Market Share Comparison by By Application Segmentation (2016-2032)
- Figure 152: APAC Water As Fuel Market Share Comparison by By Technology Segmentation (2016-2032)
- Figure 153: APAC Water As Fuel Market Share Comparison by By End-Use Industry Segmentation (2016-2032)
- Figure 154: APAC Water As Fuel Market Share Comparison by By Product Type Segmentation (2016-2032)
- Figure 155: APAC Water As Fuel Market Share Comparison by By Distribution Mode Segmentation (2016-2032)
- Figure 156: Latin America Water As Fuel Market Revenue (US$ Mn) Market Share by By Application Segmentationin 2022
- Figure 157: Latin America Water As Fuel Market Attractiveness Analysis by By Application Segmentation, 2016-2032
- Figure 158: Latin America Water As Fuel Market Revenue (US$ Mn) Market Share by By Technology Segmentationin 2022
- Figure 159: Latin America Water As Fuel Market Attractiveness Analysis by By Technology Segmentation, 2016-2032
- Figure 160: Latin America Water As Fuel Market Revenue (US$ Mn) Market Share by By End-Use Industry Segmentationin 2022
- Figure 161: Latin America Water As Fuel Market Attractiveness Analysis by By End-Use Industry Segmentation, 2016-2032
- Figure 162: Latin America Water As Fuel Market Revenue (US$ Mn) Market Share by By Product Type Segmentationin 2022
- Figure 163: Latin America Water As Fuel Market Attractiveness Analysis by By Product Type Segmentation, 2016-2032
- Figure 164: Latin America Water As Fuel Market Revenue (US$ Mn) Market Share by By Distribution Mode Segmentationin 2022
- Figure 165: Latin America Water As Fuel Market Attractiveness Analysis by By Distribution Mode Segmentation, 2016-2032
- Figure 166: Latin America Water As Fuel Market Revenue (US$ Mn) Market Share by Country in 2022
- Figure 167: Latin America Water As Fuel Market Attractiveness Analysis by Country, 2016-2032
- Figure 168: Latin America Water As Fuel Market Revenue (US$ Mn) (2016-2032)
- Figure 169: Latin America Water As Fuel Market Revenue (US$ Mn) Comparison by Country (2016-2032)
- Figure 170: Latin America Water As Fuel Market Revenue (US$ Mn) Comparison by By Application Segmentation (2016-2032)
- Figure 171: Latin America Water As Fuel Market Revenue (US$ Mn) Comparison by By Technology Segmentation (2016-2032)
- Figure 172: Latin America Water As Fuel Market Revenue (US$ Mn) Comparison by By End-Use Industry Segmentation (2016-2032)
- Figure 173: Latin America Water As Fuel Market Revenue (US$ Mn) Comparison by By Product Type Segmentation (2016-2032)
- Figure 174: Latin America Water As Fuel Market Revenue (US$ Mn) Comparison by By Distribution Mode Segmentation (2016-2032)
- Figure 175: Latin America Water As Fuel Market Y-o-Y Growth Rate Comparison by Country (2016-2032)
- Figure 176: Latin America Water As Fuel Market Y-o-Y Growth Rate Comparison by By Application Segmentation (2016-2032)
- Figure 177: Latin America Water As Fuel Market Y-o-Y Growth Rate Comparison by By Technology Segmentation (2016-2032)
- Figure 178: Latin America Water As Fuel Market Y-o-Y Growth Rate Comparison by By End-Use Industry Segmentation (2016-2032)
- Figure 179: Latin America Water As Fuel Market Y-o-Y Growth Rate Comparison by By Product Type Segmentation (2016-2032)
- Figure 180: Latin America Water As Fuel Market Y-o-Y Growth Rate Comparison by By Distribution Mode Segmentation (2016-2032)
- Figure 181: Latin America Water As Fuel Market Share Comparison by Country (2016-2032)
- Figure 182: Latin America Water As Fuel Market Share Comparison by By Application Segmentation (2016-2032)
- Figure 183: Latin America Water As Fuel Market Share Comparison by By Technology Segmentation (2016-2032)
- Figure 184: Latin America Water As Fuel Market Share Comparison by By End-Use Industry Segmentation (2016-2032)
- Figure 185: Latin America Water As Fuel Market Share Comparison by By Product Type Segmentation (2016-2032)
- Figure 186: Latin America Water As Fuel Market Share Comparison by By Distribution Mode Segmentation (2016-2032)
- Figure 187: Middle East & Africa Water As Fuel Market Revenue (US$ Mn) Market Share by By Application Segmentationin 2022
- Figure 188: Middle East & Africa Water As Fuel Market Attractiveness Analysis by By Application Segmentation, 2016-2032
- Figure 189: Middle East & Africa Water As Fuel Market Revenue (US$ Mn) Market Share by By Technology Segmentationin 2022
- Figure 190: Middle East & Africa Water As Fuel Market Attractiveness Analysis by By Technology Segmentation, 2016-2032
- Figure 191: Middle East & Africa Water As Fuel Market Revenue (US$ Mn) Market Share by By End-Use Industry Segmentationin 2022
- Figure 192: Middle East & Africa Water As Fuel Market Attractiveness Analysis by By End-Use Industry Segmentation, 2016-2032
- Figure 193: Middle East & Africa Water As Fuel Market Revenue (US$ Mn) Market Share by By Product Type Segmentationin 2022
- Figure 194: Middle East & Africa Water As Fuel Market Attractiveness Analysis by By Product Type Segmentation, 2016-2032
- Figure 195: Middle East & Africa Water As Fuel Market Revenue (US$ Mn) Market Share by By Distribution Mode Segmentationin 2022
- Figure 196: Middle East & Africa Water As Fuel Market Attractiveness Analysis by By Distribution Mode Segmentation, 2016-2032
- Figure 197: Middle East & Africa Water As Fuel Market Revenue (US$ Mn) Market Share by Country in 2022
- Figure 198: Middle East & Africa Water As Fuel Market Attractiveness Analysis by Country, 2016-2032
- Figure 199: Middle East & Africa Water As Fuel Market Revenue (US$ Mn) (2016-2032)
- Figure 200: Middle East & Africa Water As Fuel Market Revenue (US$ Mn) Comparison by Country (2016-2032)
- Figure 201: Middle East & Africa Water As Fuel Market Revenue (US$ Mn) Comparison by By Application Segmentation (2016-2032)
- Figure 202: Middle East & Africa Water As Fuel Market Revenue (US$ Mn) Comparison by By Technology Segmentation (2016-2032)
- Figure 203: Middle East & Africa Water As Fuel Market Revenue (US$ Mn) Comparison by By End-Use Industry Segmentation (2016-2032)
- Figure 204: Middle East & Africa Water As Fuel Market Revenue (US$ Mn) Comparison by By Product Type Segmentation (2016-2032)
- Figure 205: Middle East & Africa Water As Fuel Market Revenue (US$ Mn) Comparison by By Distribution Mode Segmentation (2016-2032)
- Figure 206: Middle East & Africa Water As Fuel Market Y-o-Y Growth Rate Comparison by Country (2016-2032)
- Figure 207: Middle East & Africa Water As Fuel Market Y-o-Y Growth Rate Comparison by By Application Segmentation (2016-2032)
- Figure 208: Middle East & Africa Water As Fuel Market Y-o-Y Growth Rate Comparison by By Technology Segmentation (2016-2032)
- Figure 209: Middle East & Africa Water As Fuel Market Y-o-Y Growth Rate Comparison by By End-Use Industry Segmentation (2016-2032)
- Figure 210: Middle East & Africa Water As Fuel Market Y-o-Y Growth Rate Comparison by By Product Type Segmentation (2016-2032)
- Figure 211: Middle East & Africa Water As Fuel Market Y-o-Y Growth Rate Comparison by By Distribution Mode Segmentation (2016-2032)
- Figure 212: Middle East & Africa Water As Fuel Market Share Comparison by Country (2016-2032)
- Figure 213: Middle East & Africa Water As Fuel Market Share Comparison by By Application Segmentation (2016-2032)
- Figure 214: Middle East & Africa Water As Fuel Market Share Comparison by By Technology Segmentation (2016-2032)
- Figure 215: Middle East & Africa Water As Fuel Market Share Comparison by By End-Use Industry Segmentation (2016-2032)
- Figure 216: Middle East & Africa Water As Fuel Market Share Comparison by By Product Type Segmentation (2016-2032)
- Figure 217: Middle East & Africa Water As Fuel Market Share Comparison by By Distribution Mode Segmentation (2016-2032)
- List of Tables
- Table 1: Global Water As Fuel Market Comparison by By Application Segmentation (2016-2032)
- Table 2: Global Water As Fuel Market Comparison by By Technology Segmentation (2016-2032)
- Table 3: Global Water As Fuel Market Comparison by By End-Use Industry Segmentation (2016-2032)
- Table 4: Global Water As Fuel Market Comparison by By Product Type Segmentation (2016-2032)
- Table 5: Global Water As Fuel Market Comparison by By Distribution Mode Segmentation (2016-2032)
- Table 6: Global Water As Fuel Market Revenue (US$ Mn) Comparison by Region (2016-2032)
- Table 7: Global Water As Fuel Market Revenue (US$ Mn) (2016-2032)
- Table 8: Global Water As Fuel Market Revenue (US$ Mn) Comparison by Region (2016-2032)
- Table 9: Global Water As Fuel Market Revenue (US$ Mn) Comparison by By Application Segmentation (2016-2032)
- Table 10: Global Water As Fuel Market Revenue (US$ Mn) Comparison by By Technology Segmentation (2016-2032)
- Table 11: Global Water As Fuel Market Revenue (US$ Mn) Comparison by By End-Use Industry Segmentation (2016-2032)
- Table 12: Global Water As Fuel Market Revenue (US$ Mn) Comparison by By Product Type Segmentation (2016-2032)
- Table 13: Global Water As Fuel Market Revenue (US$ Mn) Comparison by By Distribution Mode Segmentation (2016-2032)
- Table 14: Global Water As Fuel Market Y-o-Y Growth Rate Comparison by Region (2016-2032)
- Table 15: Global Water As Fuel Market Y-o-Y Growth Rate Comparison by By Application Segmentation (2016-2032)
- Table 16: Global Water As Fuel Market Y-o-Y Growth Rate Comparison by By Technology Segmentation (2016-2032)
- Table 17: Global Water As Fuel Market Y-o-Y Growth Rate Comparison by By End-Use Industry Segmentation (2016-2032)
- Table 18: Global Water As Fuel Market Y-o-Y Growth Rate Comparison by By Product Type Segmentation (2016-2032)
- Table 19: Global Water As Fuel Market Y-o-Y Growth Rate Comparison by By Distribution Mode Segmentation (2016-2032)
- Table 20: Global Water As Fuel Market Share Comparison by Region (2016-2032)
- Table 21: Global Water As Fuel Market Share Comparison by By Application Segmentation (2016-2032)
- Table 22: Global Water As Fuel Market Share Comparison by By Technology Segmentation (2016-2032)
- Table 23: Global Water As Fuel Market Share Comparison by By End-Use Industry Segmentation (2016-2032)
- Table 24: Global Water As Fuel Market Share Comparison by By Product Type Segmentation (2016-2032)
- Table 25: Global Water As Fuel Market Share Comparison by By Distribution Mode Segmentation (2016-2032)
- Table 26: North America Water As Fuel Market Comparison by By Technology Segmentation (2016-2032)
- Table 27: North America Water As Fuel Market Comparison by By End-Use Industry Segmentation (2016-2032)
- Table 28: North America Water As Fuel Market Comparison by By Product Type Segmentation (2016-2032)
- Table 29: North America Water As Fuel Market Comparison by By Distribution Mode Segmentation (2016-2032)
- Table 30: North America Water As Fuel Market Revenue (US$ Mn) Comparison by Country (2016-2032)
- Table 31: North America Water As Fuel Market Revenue (US$ Mn) (2016-2032)
- Table 32: North America Water As Fuel Market Revenue (US$ Mn) Comparison by Country (2016-2032)
- Table 33: North America Water As Fuel Market Revenue (US$ Mn) Comparison by By Application Segmentation (2016-2032)
- Table 34: North America Water As Fuel Market Revenue (US$ Mn) Comparison by By Technology Segmentation (2016-2032)
- Table 35: North America Water As Fuel Market Revenue (US$ Mn) Comparison by By End-Use Industry Segmentation (2016-2032)
- Table 36: North America Water As Fuel Market Revenue (US$ Mn) Comparison by By Product Type Segmentation (2016-2032)
- Table 37: North America Water As Fuel Market Revenue (US$ Mn) Comparison by By Distribution Mode Segmentation (2016-2032)
- Table 38: North America Water As Fuel Market Y-o-Y Growth Rate Comparison by Country (2016-2032)
- Table 39: North America Water As Fuel Market Y-o-Y Growth Rate Comparison by By Application Segmentation (2016-2032)
- Table 40: North America Water As Fuel Market Y-o-Y Growth Rate Comparison by By Technology Segmentation (2016-2032)
- Table 41: North America Water As Fuel Market Y-o-Y Growth Rate Comparison by By End-Use Industry Segmentation (2016-2032)
- Table 42: North America Water As Fuel Market Y-o-Y Growth Rate Comparison by By Product Type Segmentation (2016-2032)
- Table 43: North America Water As Fuel Market Y-o-Y Growth Rate Comparison by By Distribution Mode Segmentation (2016-2032)
- Table 44: North America Water As Fuel Market Share Comparison by Country (2016-2032)
- Table 45: North America Water As Fuel Market Share Comparison by By Application Segmentation (2016-2032)
- Table 46: North America Water As Fuel Market Share Comparison by By Technology Segmentation (2016-2032)
- Table 47: North America Water As Fuel Market Share Comparison by By End-Use Industry Segmentation (2016-2032)
- Table 48: North America Water As Fuel Market Share Comparison by By Product Type Segmentation (2016-2032)
- Table 49: North America Water As Fuel Market Share Comparison by By Distribution Mode Segmentation (2016-2032)
- Table 50: Western Europe Water As Fuel Market Comparison by By Application Segmentation (2016-2032)
- Table 51: Western Europe Water As Fuel Market Comparison by By Technology Segmentation (2016-2032)
- Table 52: Western Europe Water As Fuel Market Comparison by By End-Use Industry Segmentation (2016-2032)
- Table 53: Western Europe Water As Fuel Market Comparison by By Product Type Segmentation (2016-2032)
- Table 54: Western Europe Water As Fuel Market Comparison by By Distribution Mode Segmentation (2016-2032)
- Table 55: Western Europe Water As Fuel Market Revenue (US$ Mn) Comparison by Country (2016-2032)
- Table 56: Western Europe Water As Fuel Market Revenue (US$ Mn) (2016-2032)
- Table 57: Western Europe Water As Fuel Market Revenue (US$ Mn) Comparison by Country (2016-2032)
- Table 58: Western Europe Water As Fuel Market Revenue (US$ Mn) Comparison by By Application Segmentation (2016-2032)
- Table 59: Western Europe Water As Fuel Market Revenue (US$ Mn) Comparison by By Technology Segmentation (2016-2032)
- Table 60: Western Europe Water As Fuel Market Revenue (US$ Mn) Comparison by By End-Use Industry Segmentation (2016-2032)
- Table 61: Western Europe Water As Fuel Market Revenue (US$ Mn) Comparison by By Product Type Segmentation (2016-2032)
- Table 62: Western Europe Water As Fuel Market Revenue (US$ Mn) Comparison by By Distribution Mode Segmentation (2016-2032)
- Table 63: Western Europe Water As Fuel Market Y-o-Y Growth Rate Comparison by Country (2016-2032)
- Table 64: Western Europe Water As Fuel Market Y-o-Y Growth Rate Comparison by By Application Segmentation (2016-2032)
- Table 65: Western Europe Water As Fuel Market Y-o-Y Growth Rate Comparison by By Technology Segmentation (2016-2032)
- Table 66: Western Europe Water As Fuel Market Y-o-Y Growth Rate Comparison by By End-Use Industry Segmentation (2016-2032)
- Table 67: Western Europe Water As Fuel Market Y-o-Y Growth Rate Comparison by By Product Type Segmentation (2016-2032)
- Table 68: Western Europe Water As Fuel Market Y-o-Y Growth Rate Comparison by By Distribution Mode Segmentation (2016-2032)
- Table 69: Western Europe Water As Fuel Market Share Comparison by Country (2016-2032)
- Table 70: Western Europe Water As Fuel Market Share Comparison by By Application Segmentation (2016-2032)
- Table 71: Western Europe Water As Fuel Market Share Comparison by By Technology Segmentation (2016-2032)
- Table 72: Western Europe Water As Fuel Market Share Comparison by By End-Use Industry Segmentation (2016-2032)
- Table 73: Western Europe Water As Fuel Market Share Comparison by By Product Type Segmentation (2016-2032)
- Table 74: Western Europe Water As Fuel Market Share Comparison by By Distribution Mode Segmentation (2016-2032)
- Table 75: Eastern Europe Water As Fuel Market Comparison by By Application Segmentation (2016-2032)
- Table 76: Eastern Europe Water As Fuel Market Comparison by By Technology Segmentation (2016-2032)
- Table 77: Eastern Europe Water As Fuel Market Comparison by By End-Use Industry Segmentation (2016-2032)
- Table 78: Eastern Europe Water As Fuel Market Comparison by By Product Type Segmentation (2016-2032)
- Table 79: Eastern Europe Water As Fuel Market Comparison by By Distribution Mode Segmentation (2016-2032)
- Table 80: Eastern Europe Water As Fuel Market Revenue (US$ Mn) Comparison by Country (2016-2032)
- Table 81: Eastern Europe Water As Fuel Market Revenue (US$ Mn) (2016-2032)
- Table 82: Eastern Europe Water As Fuel Market Revenue (US$ Mn) Comparison by Country (2016-2032)
- Table 83: Eastern Europe Water As Fuel Market Revenue (US$ Mn) Comparison by By Application Segmentation (2016-2032)
- Table 84: Eastern Europe Water As Fuel Market Revenue (US$ Mn) Comparison by By Technology Segmentation (2016-2032)
- Table 85: Eastern Europe Water As Fuel Market Revenue (US$ Mn) Comparison by By End-Use Industry Segmentation (2016-2032)
- Table 86: Eastern Europe Water As Fuel Market Revenue (US$ Mn) Comparison by By Product Type Segmentation (2016-2032)
- Table 87: Eastern Europe Water As Fuel Market Revenue (US$ Mn) Comparison by By Distribution Mode Segmentation (2016-2032)
- Table 88: Eastern Europe Water As Fuel Market Y-o-Y Growth Rate Comparison by Country (2016-2032)
- Table 89: Eastern Europe Water As Fuel Market Y-o-Y Growth Rate Comparison by By Application Segmentation (2016-2032)
- Table 90: Eastern Europe Water As Fuel Market Y-o-Y Growth Rate Comparison by By Technology Segmentation (2016-2032)
- Table 91: Eastern Europe Water As Fuel Market Y-o-Y Growth Rate Comparison by By End-Use Industry Segmentation (2016-2032)
- Table 92: Eastern Europe Water As Fuel Market Y-o-Y Growth Rate Comparison by By Product Type Segmentation (2016-2032)
- Table 93: Eastern Europe Water As Fuel Market Y-o-Y Growth Rate Comparison by By Distribution Mode Segmentation (2016-2032)
- Table 94: Eastern Europe Water As Fuel Market Share Comparison by Country (2016-2032)
- Table 95: Eastern Europe Water As Fuel Market Share Comparison by By Application Segmentation (2016-2032)
- Table 96: Eastern Europe Water As Fuel Market Share Comparison by By Technology Segmentation (2016-2032)
- Table 97: Eastern Europe Water As Fuel Market Share Comparison by By End-Use Industry Segmentation (2016-2032)
- Table 98: Eastern Europe Water As Fuel Market Share Comparison by By Product Type Segmentation (2016-2032)
- Table 99: Eastern Europe Water As Fuel Market Share Comparison by By Distribution Mode Segmentation (2016-2032)
- Table 100: APAC Water As Fuel Market Comparison by By Application Segmentation (2016-2032)
- Table 101: APAC Water As Fuel Market Comparison by By Technology Segmentation (2016-2032)
- Table 102: APAC Water As Fuel Market Comparison by By End-Use Industry Segmentation (2016-2032)
- Table 103: APAC Water As Fuel Market Comparison by By Product Type Segmentation (2016-2032)
- Table 104: APAC Water As Fuel Market Comparison by By Distribution Mode Segmentation (2016-2032)
- Table 105: APAC Water As Fuel Market Revenue (US$ Mn) Comparison by Country (2016-2032)
- Table 106: APAC Water As Fuel Market Revenue (US$ Mn) (2016-2032)
- Table 107: APAC Water As Fuel Market Revenue (US$ Mn) Comparison by Country (2016-2032)
- Table 108: APAC Water As Fuel Market Revenue (US$ Mn) Comparison by By Application Segmentation (2016-2032)
- Table 109: APAC Water As Fuel Market Revenue (US$ Mn) Comparison by By Technology Segmentation (2016-2032)
- Table 110: APAC Water As Fuel Market Revenue (US$ Mn) Comparison by By End-Use Industry Segmentation (2016-2032)
- Table 111: APAC Water As Fuel Market Revenue (US$ Mn) Comparison by By Product Type Segmentation (2016-2032)
- Table 112: APAC Water As Fuel Market Revenue (US$ Mn) Comparison by By Distribution Mode Segmentation (2016-2032)
- Table 113: APAC Water As Fuel Market Y-o-Y Growth Rate Comparison by Country (2016-2032)
- Table 114: APAC Water As Fuel Market Y-o-Y Growth Rate Comparison by By Application Segmentation (2016-2032)
- Table 115: APAC Water As Fuel Market Y-o-Y Growth Rate Comparison by By Technology Segmentation (2016-2032)
- Table 116: APAC Water As Fuel Market Y-o-Y Growth Rate Comparison by By End-Use Industry Segmentation (2016-2032)
- Table 117: APAC Water As Fuel Market Y-o-Y Growth Rate Comparison by By Product Type Segmentation (2016-2032)
- Table 118: APAC Water As Fuel Market Y-o-Y Growth Rate Comparison by By Distribution Mode Segmentation (2016-2032)
- Table 119: APAC Water As Fuel Market Share Comparison by Country (2016-2032)
- Table 120: APAC Water As Fuel Market Share Comparison by By Application Segmentation (2016-2032)
- Table 121: APAC Water As Fuel Market Share Comparison by By Technology Segmentation (2016-2032)
- Table 122: APAC Water As Fuel Market Share Comparison by By End-Use Industry Segmentation (2016-2032)
- Table 123: APAC Water As Fuel Market Share Comparison by By Product Type Segmentation (2016-2032)
- Table 124: APAC Water As Fuel Market Share Comparison by By Distribution Mode Segmentation (2016-2032)
- Table 125: Latin America Water As Fuel Market Comparison by By Application Segmentation (2016-2032)
- Table 126: Latin America Water As Fuel Market Comparison by By Technology Segmentation (2016-2032)
- Table 127: Latin America Water As Fuel Market Comparison by By End-Use Industry Segmentation (2016-2032)
- Table 128: Latin America Water As Fuel Market Comparison by By Product Type Segmentation (2016-2032)
- Table 129: Latin America Water As Fuel Market Comparison by By Distribution Mode Segmentation (2016-2032)
- Table 130: Latin America Water As Fuel Market Revenue (US$ Mn) Comparison by Country (2016-2032)
- Table 131: Latin America Water As Fuel Market Revenue (US$ Mn) (2016-2032)
- Table 132: Latin America Water As Fuel Market Revenue (US$ Mn) Comparison by Country (2016-2032)
- Table 133: Latin America Water As Fuel Market Revenue (US$ Mn) Comparison by By Application Segmentation (2016-2032)
- Table 134: Latin America Water As Fuel Market Revenue (US$ Mn) Comparison by By Technology Segmentation (2016-2032)
- Table 135: Latin America Water As Fuel Market Revenue (US$ Mn) Comparison by By End-Use Industry Segmentation (2016-2032)
- Table 136: Latin America Water As Fuel Market Revenue (US$ Mn) Comparison by By Product Type Segmentation (2016-2032)
- Table 137: Latin America Water As Fuel Market Revenue (US$ Mn) Comparison by By Distribution Mode Segmentation (2016-2032)
- Table 138: Latin America Water As Fuel Market Y-o-Y Growth Rate Comparison by Country (2016-2032)
- Table 139: Latin America Water As Fuel Market Y-o-Y Growth Rate Comparison by By Application Segmentation (2016-2032)
- Table 140: Latin America Water As Fuel Market Y-o-Y Growth Rate Comparison by By Technology Segmentation (2016-2032)
- Table 141: Latin America Water As Fuel Market Y-o-Y Growth Rate Comparison by By End-Use Industry Segmentation (2016-2032)
- Table 142: Latin America Water As Fuel Market Y-o-Y Growth Rate Comparison by By Product Type Segmentation (2016-2032)
- Table 143: Latin America Water As Fuel Market Y-o-Y Growth Rate Comparison by By Distribution Mode Segmentation (2016-2032)
- Table 144: Latin America Water As Fuel Market Share Comparison by Country (2016-2032)
- Table 145: Latin America Water As Fuel Market Share Comparison by By Application Segmentation (2016-2032)
- Table 146: Latin America Water As Fuel Market Share Comparison by By Technology Segmentation (2016-2032)
- Table 147: Latin America Water As Fuel Market Share Comparison by By End-Use Industry Segmentation (2016-2032)
- Table 148: Latin America Water As Fuel Market Share Comparison by By Product Type Segmentation (2016-2032)
- Table 149: Latin America Water As Fuel Market Share Comparison by By Distribution Mode Segmentation (2016-2032)
- Table 150: Middle East & Africa Water As Fuel Market Comparison by By Application Segmentation (2016-2032)
- Table 151: Middle East & Africa Water As Fuel Market Comparison by By Technology Segmentation (2016-2032)
- Table 152: Middle East & Africa Water As Fuel Market Comparison by By End-Use Industry Segmentation (2016-2032)
- Table 153: Middle East & Africa Water As Fuel Market Comparison by By Product Type Segmentation (2016-2032)
- Table 154: Middle East & Africa Water As Fuel Market Comparison by By Distribution Mode Segmentation (2016-2032)
- Table 155: Middle East & Africa Water As Fuel Market Revenue (US$ Mn) Comparison by Country (2016-2032)
- Table 156: Middle East & Africa Water As Fuel Market Revenue (US$ Mn) (2016-2032)
- Table 157: Middle East & Africa Water As Fuel Market Revenue (US$ Mn) Comparison by Country (2016-2032)
- Table 158: Middle East & Africa Water As Fuel Market Revenue (US$ Mn) Comparison by By Application Segmentation (2016-2032)
- Table 159: Middle East & Africa Water As Fuel Market Revenue (US$ Mn) Comparison by By Technology Segmentation (2016-2032)
- Table 160: Middle East & Africa Water As Fuel Market Revenue (US$ Mn) Comparison by By End-Use Industry Segmentation (2016-2032)
- Table 161: Middle East & Africa Water As Fuel Market Revenue (US$ Mn) Comparison by By Product Type Segmentation (2016-2032)
- Table 162: Middle East & Africa Water As Fuel Market Revenue (US$ Mn) Comparison by By Distribution Mode Segmentation (2016-2032)
- Table 163: Middle East & Africa Water As Fuel Market Y-o-Y Growth Rate Comparison by Country (2016-2032)
- Table 164: Middle East & Africa Water As Fuel Market Y-o-Y Growth Rate Comparison by By Application Segmentation (2016-2032)
- Table 165: Middle East & Africa Water As Fuel Market Y-o-Y Growth Rate Comparison by By Technology Segmentation (2016-2032)
- Table 166: Middle East & Africa Water As Fuel Market Y-o-Y Growth Rate Comparison by By End-Use Industry Segmentation (2016-2032)
- Table 167: Middle East & Africa Water As Fuel Market Y-o-Y Growth Rate Comparison by By Product Type Segmentation (2016-2032)
- Table 168: Middle East & Africa Water As Fuel Market Y-o-Y Growth Rate Comparison by By Distribution Mode Segmentation (2016-2032)
- Table 169: Middle East & Africa Water As Fuel Market Share Comparison by Country (2016-2032)
- Table 170: Middle East & Africa Water As Fuel Market Share Comparison by By Application Segmentation (2016-2032)
- Table 171: Middle East & Africa Water As Fuel Market Share Comparison by By Technology Segmentation (2016-2032)
- Table 172: Middle East & Africa Water As Fuel Market Share Comparison by By End-Use Industry Segmentation (2016-2032)
- Table 173: Middle East & Africa Water As Fuel Market Share Comparison by By Product Type Segmentation (2016-2032)
- Table 174: Middle East & Africa Water As Fuel Market Share Comparison by By Distribution Mode Segmentation (2016-2032)
- 1. Executive Summary
-
- Siemens AG
- ITM Power
- Ballard Power Systems
- Enapter
- Plug Power
- McPhy Energy
- Nel Hydrogen
- Hydrogenics Corporation
- FuelCell Energy
- Air Liquide
- Linde plc
- Ceres Power
- Green Hydrogen Systems
- Mitsubishi Power
- Thyssenkrupp Industrial Solutions AG
Our Clients


View Our Licence Options
