
Global Virtual Reality (VR) In Healthcare Market Size, Share, Growth, And Industry Analysis By Application (Medical Training and Education, and others), Technology (Augmented Reality (AR), Virtual Reality (VR)), And By Region Forecast - 2023-2032
-
41141
-
Sep 2023
-
150
-


-
This report was compiled by Correspondence Linkedin | Detailed Market research Methodology Our methodology involves a mix of primary research, including interviews with leading mental health experts, and secondary research from reputable medical journals and databases. View Detailed Methodology Page
-
Quick Navigation
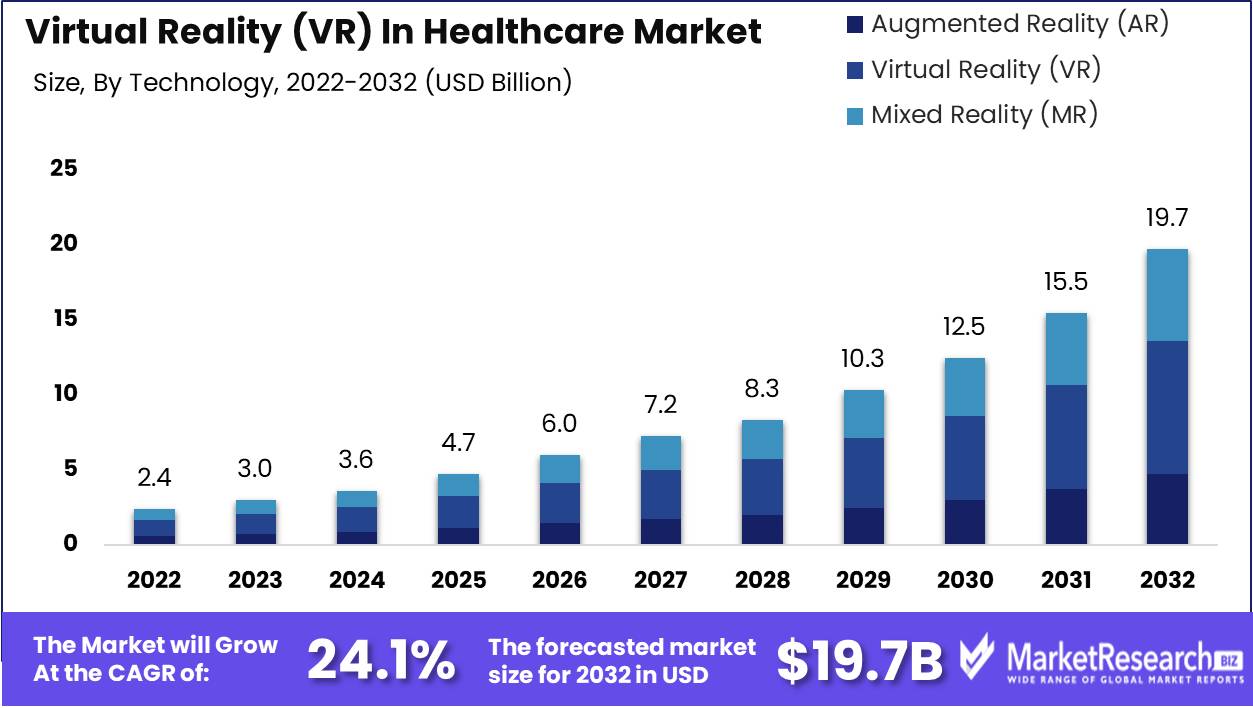
The global Virtual Reality (VR) in healthcare market revenue is expected to increase to USD 19.7 Bn in 2032 from USD 2.4 Bn in 2022, and register a revenue CAGR of 24.1% during the forecast period (2023 to 2032).
Some Key Takeaways
- The global Virtual Reality (VR) in healthcare market is registering a substantially rapid growth rate and was valued at approximately USD 2.4 billion in 2022. Revenue is projected to exceed USD 4.7 billion by the end of 2025, and the market is expected to register a robust Compound Annual Growth Rate (CAGR) of around 24.1% over the forecast period.
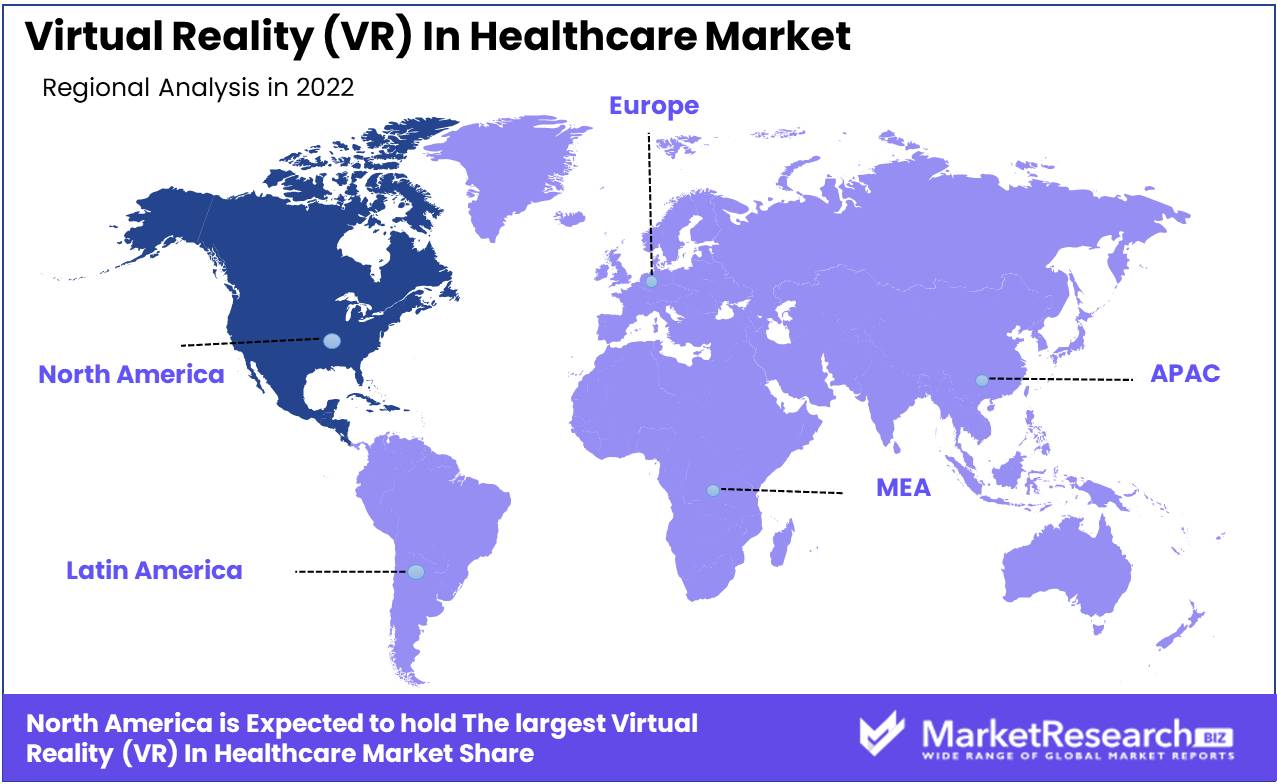
- North America continues to account for dominant revenue contribution to the global Virtual Reality (VR) In Healthcare Market and is expected to register a revenue CAGR of around 28.7% over the forecast period.
- Asia Pacific market is expected to retain dominance for fastest revenue growth rate over the forecast period, which can be attributed to the large population and a growing base of healthcare providers and consumers seeking to modernize healthcare offerings and integrate more advanced technologies.
- In 2022, a remarkable 45% increase in utilization of AI-powered diagnostic tools was noted and this is attributed to continuous evolution of VR technology, including advancements in AI diagnostics, telehealth platforms, and remote monitoring devices.
- According to survey findings in 2022, around 58% of healthcare professionals preferred VR-based simulations for medical training and surgical planning due to their effectiveness and immersive nature.
- VR in healthcare has significantly improved access to medical care. In 2023, more than 50% of telehealth consultations took place in underserved rural areas, demonstrating its potential to bridge healthcare disparities and bring quality healthcare to remote regions.
Market Overview
Virtual Reality (VR) has been gaining significant traction within the healthcare sector, and the technology enables further development of an expanding range of innovative solutions for use for education in the medical field, treatment of patients, and for improved diagnostic processes. VR, immersive VR, Augmented Reality (AR), and Mixed Reality (MR) have been gaining wide popularity and rising preference in applications such as medical training, surgical planning and preparation, and also in patient therapy. VR has been playing a major role in healthcare services and is applied to surgical simulations, patient rehabilitation, mental health therapy, and remote consultations, among others.
The global Virtual Reality (VR) In Healthcare Market is expected to continue to account for a significantly rapid revenue growth rate of over 30% over the forecast period. Some key drivers include high demand for immersive training experiences for medical professionals, patient engagement through VR therapy, and the need for remote consultations, especially post-pandemic.
Consumption trends indicate a rising preference for VR-based surgical simulations, pain management, and therapy solutions. Advances in VR technology such as haptic feedback and 3D visualization are serving to enhance user experience, and this coupled with various initiatives to promote adoption of VR in healthcare applications and government and private organizations investing in research and development are other key factors.
The advantages of VR in healthcare encompass improved training, reduced anxiety in patients, and enhanced diagnostics. Detailed analysis and insights highlight a promising future for this transformative technology in the healthcare sector.
Driving Factors
Increased Adoption of Telemedicine
Growing acceptance of telemedicine, especially post-COVID-19 pandemic, is driving demand for VR in healthcare. VR technology facilitates immersive remote consultations, thereby improving patient engagement and expanding revenue potential for players operating in the market.
Enhanced Medical Training and Education
VR offers realistic surgical simulations and interactive educational tools, enabling healthcare professionals to hone their skills and knowledge. This also enables development of a better-trained workforce, ultimately leading to improved patient care and increased revenue.
Rising Prevalence of Chronic Diseases
Global incline in prevalence of chronic diseases is necessitating development and use of more innovative treatment approaches. VR-based therapies and pain management solutions continue to gain traction, owing to results such as leading to improved patient outcomes.
Investments in R&D
Ongoing investments by both public and private sectors in VR technology is a major factor driving advancements in VR technology and expanding end-uses and applications. Also, development of more sophisticated VR hardware and software tailored to the healthcare sector is expected to support market growth to a major extent.
Patient-Centric Approach
VR is proving to be game-changer in healthcare applications and enhances patient experience by reducing anxiety during some procedures and providing non-pharmacological pain management. Such as patient-centric focus improves outcomes, as well as has an overly positive impact on preference among patients and healthcare providers and experts in medical fields, and this is another key factor supporting revenue growth.
Restraining Factors
High Initial Costs
key factor expected to restrain revenue growth of the market is the substantial initial investment required for VR hardware and software implementation in healthcare facilities. This factor can limit budget constrained healthcare providers from adopting VR technology, thereby restraining potential market revenue.
Regulatory Hurdles
Need for stringent compliance and presence of norms and regulations in the healthcare industry, and navigating these regulations for VR applications can be complex and time-consuming. Compliance with stringent data privacy and patient safety standards can also delay adoption of VR solutions, and have a negative impact on market revenue growth.
Limited Content Development
The scarcity of high-quality, medically validated VR content hinders wider adoption of VR in healthcare. Developing accurate and effective VR simulations and therapies is time consuming, critical, and takes up resources. This is another major factor causing sluggish market expansion and revenue growth.
Opportunities
Content Development Services
Offering of specialized content development services for VR applications in healthcare is a strategy that can open up revenue opportunities for companies operating in the market. Development of high-quality, medically accurate simulations, training modules, and therapy programs can also create lucrative revenue streams as healthcare providers seek customized VR content to enhance patient care and medical training.
Telehealth Integration Solutions
Rising demand for telemedicine presents significant opportunity for companies to develop VR solutions that seamlessly integrate with telehealth platforms. This can enhance the virtual healthcare experience, and provide added value to offerings of healthcare providers.
Hardware and Software Sales
Hardware costs can be a major barrier to entry, so companies can generate revenue by developing and offering VR hardware and software tailored specifically for healthcare settings and applications. Innovations in VR headset technology and medical-grade software can serve to leverage substantial increase in market share as healthcare facilities upgrade equipment and infrastructure, and the modernization trend continues to remain at the forefront of patient care and education in a number of developed and developing economies.
Segment Analysis
By Application
The medical training and education segment accounted for a substantially large revenue share in the global Virtual Reality (VR) In Healthcare Market in 2022. Some key factors driving growth of this segment are increasing demand for immersive and realistic training experiences for medical professionals and continuous advancements in VR technology.
An increasing number of healthcare institutions and medical schools are steadily adopting VR-based simulations and interactive modules for surgical and diagnostic training, thus reducing the need for physical cadavers and offering a safe, cost-effective, and repeatable training environment. As VR technology evolves with haptic feedback and real-time feedback mechanisms, it further enhances the effectiveness of medical training, and such advancements are contributing significantly to revenue growth.
By Technology
Virtual reality segment among the technology segments accounted for a significantly large revenue share in 2022. Growing adoption of VR in telemedicine and the development of VR content tailored to healthcare needs, coupled with increasing number of telemedicine providers integrating VR into their platforms to offer immersive remote consultations and therapy sessions, particularly in mental health, are driving market revenue growth. Also, the creation of medically validated VR content, such as 3D anatomical models and surgical simulations, is driving demand. These factors, coupled with increasing affordability and accessibility of VR hardware, are contributing to high revenue share of the VR segment.
End-User
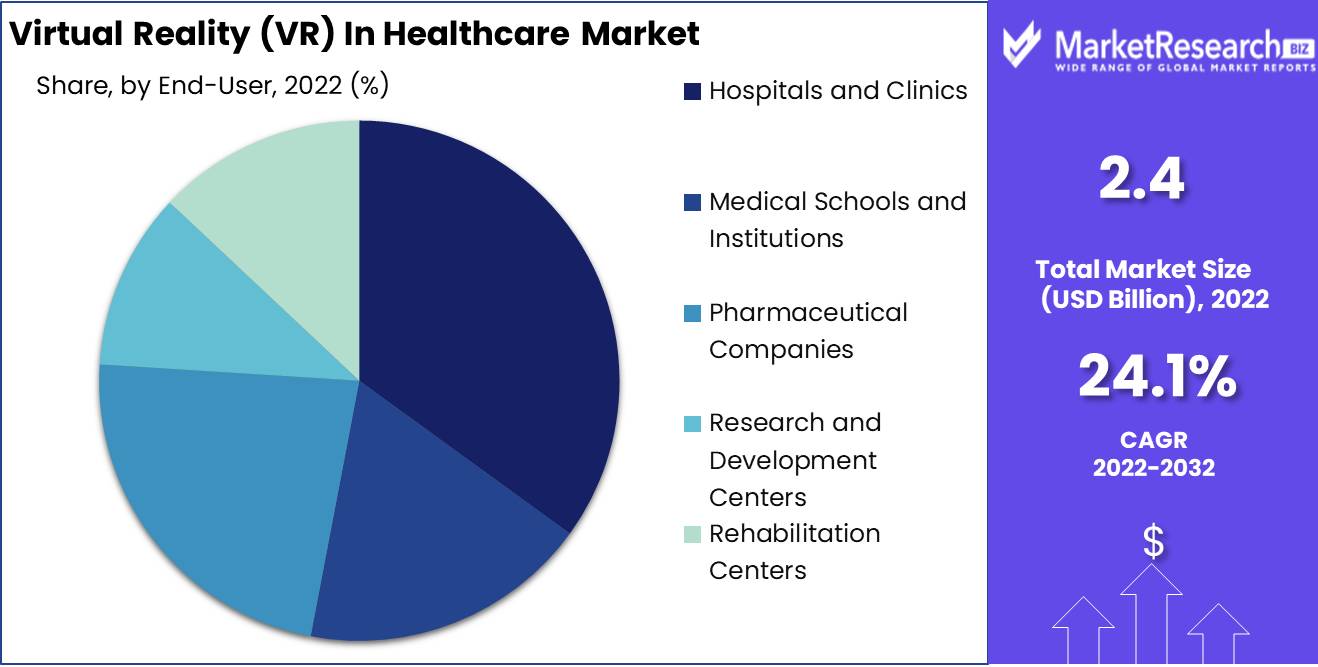
Among the end-user segments the hospitals and clinics segment accounted for largest share of revenue. Increasing utilization of VR for surgical planning and simulations within hospital settings, and rising demand for VR-based patient therapies, are primary factors driving revenue growth of this segment. Surgical teams are adopting VR for preoperative planning, reducing errors and enhancing patient outcomes. Moreover, VR therapies for pain management and rehabilitation are becoming more prevalent in clinical settings, improving patient satisfaction and recovery rates.
Market Segmentation
By Application
- Medical Training and Education
- Pain Management and Therapy
- Surgical Simulations
- Patient Rehabilitation
- Cognitive Rehabilitation
Technology
- Augmented Reality (AR)
- Virtual Reality (VR)
- Mixed Reality (MR)
End-User
- Hospitals and Clinics
- Medical Schools and Institutions
- Pharmaceutical Companies
- Research and Development Centers
- Rehabilitation Centers
Content Type
- 3D Models and Anatomy Visualization
- Interactive Modules and Simulations
- Therapeutic VR Programs
- Diagnostic VR Tools
- Training and Procedure Walkthroughs
Component
- Hardware
- VR Headsets
- Haptic Devices
- Software
- VR Applications
- Simulation Software
- Services
- Content Development
- Consulting
- Accessories
- Controllers
- Sensors
- Maintenance and Support
Regional Analysis
North America
North America accounted for largest market share in the global Virtual Reality (VR) In Healthcare Market in 2022, and this can be attributed to presence of advanced healthcare infrastructure and robust adoption of advanced technologies and solutions in countries in the region. Increasing investments in VR for medical training, telemedicine integration, and pain management, and technological advancements on development of more advanced VR headsets and software are other key factors expected to continue to drive market revenue growth. Initiatives such as public-private partnerships and funding for VR research are also supporting revenue growth, with the U.S. accounting for substantially larger revenue share among the countries.
Europe
Europe follows closely behind North America in terms of market share and revenue potential. The region is witnessing steady industry growth as VR makes major headway into the healthcare sector and are being considered crucial for surgical simulations, telehealth applications, and patient rehabilitation. Technological advancements in VR content and hardware are also factors supporting market revenue growth. Government initiatives, particularly in countries such as the UK and Germany, are driving investments in healthcare VR, and creating a conducive environment for revenue growth.
Asia-Pacific
Asia-Pacific represents a rapidly expanding market for VR in healthcare, with significant revenue growth potential. The region is registering a rapid market revenue growth rate, driven by robust industry expansion and modernization, rising healthcare investments, and increasing awareness of VR benefits. Technological advancements are being driven by companies in countries such as China, Japan, and South Korea. Government initiatives to improve healthcare infrastructure and technology adoption are further supporting revenue growth.
Latin America
Latin America is emerging as a lucrative market for VR in healthcare, with untapped potential to be addressed. Steady growth can be expected as healthcare providers recognize the value of VR for medical education and patient therapy. Technological advancements in VR content creation are contributing to market expansion. Initiatives aimed at improving healthcare access and quality in the region are expected to create lucrative revenue growth opportunities.
Middle East & Africa
Interest in VR for healthcare applications are gaining traction across the sector in the Middle East and Africa. Industry growth potential is significant, especially as VR becomes more integrated into medical training and telemedicine. Technological developments in VR hardware are driving market expansion. Initiatives to enhance healthcare services, including telehealth programs, in untapped regions is expected to support revenue growth.
Segmentation By Region
North America
- United States
- Canada
Asia Pacific
- China
- India
- Japan
- Australia & New Zealand
- Association of Southeast Asian Nations (ASEAN)
- Rest of Asia Pacific
Europe
- Germany
- The U.K.
- France
- Spain
- Italy
- Russia
- Poland
- BENELUX (Belgium, the Netherlands, Luxembourg)
- NORDIC (Norway, Sweden, Finland, Denmark)
- Rest of Europe
Latin America
- Brazil
- Mexico
- Argentina
- Rest of Latin America
Middle East & Africa
- Saudi Arabia
- United Arab Emirates
- South Africa
- Egypt
- Israel
- Rest of MEA (Middle East & Africa)
Competitive Landscape
The landscape in the global VR in healthcare market is highly competitive and characterized by a mix of established tech giants, innovative startups, and specialized service providers. These companies are focused on leveraging majority market share and deploying various strategies and approaches to remain ahead in the rapidly growing market.
Companies are entering into strategic agreements, leveraging each other’s technology and hardware to maintain a robust presence in the market, and creating much-needed content for pain management applications and therapeutics to drive sales and revenues.
For instance, Oculus VR (a subsidiary of Meta Platforms, Inc.), remains a major player, and offers VR hardware and software solutions for healthcare applications. The company has the backing of Meta Platforms (formerly Facebook), and Oculus also has a strong market presence and extensive resources to develop VR technologies for healthcare.
Also, HTC Corporation, known for its Vive VR headset, has been actively engaged in the healthcare VR market. The company has entered into partnerships with various healthcare institutions to provide VR solutions for medical training and patient therapy. Providing the necessary needs for training in the healthcare sector is another major strategy being adopted by companies.
For example, Medtronic plc, which is a global leader in medical technology, has been leveraging VR for surgical training and healthcare simulations. The company’s commitment to enhancing medical education through VR positions it as a key player.
In addition, AppliedVR, Inc. specializes in creating VR content and platforms for pain management and therapeutic purposes. The company has gained recognition for immersive VR solutions aimed at alleviating chronic pain and reducing the need for pharmaceutical interventions. Other companies are focused intently on developing and offering telehealth services, providing VR-based therapy and remote patient monitoring.
Furthermore, Surgical Theater, LLC. specializes in surgical simulations and 360-degree virtual reality for preoperative planning. The company’s immersive VR technology assists surgeons in better understanding and preparing for complex procedures.
Company List
- Oculus VR
- HTC Corporation
- Sony Corporation
- Samsung Electronics Co., Ltd.
- Google LLC
- Medtronic plc
- AppliedVR, Inc.
- Osso VR, Inc.
- ImmersiveTouch Inc.
- Surgical Theater, LLC
- VirtaMed AG
- Psious
- Oculus Surgical
- MindMaze
- Firsthand Technology
- Touch Surgery
- FundamentalVR
- XRHealth
- Embodied Labs
- Vicarious Surgical
Recent Developments
- In May 2022, PrecisionOS announced teaming up with Medtronic Saudi Arabia and expanding its VR training offerings into general surgery. The company is a leading provider of surgeon education, and offers training for complex soft tissue surgery on a portable VR solution, the Meta Quest.
- Medtronic unveiled a virtual reality surgical training program designed to enhance the skills of medical professionals. It provides realistic simulations for practicing complex surgical procedures.
- Oculus, which is a subsidiary of Meta Platforms, has recently introduced ‘Oculus for Healthcare’. This new product is a suite of VR solutions specifically designed for medical and healthcare applications and includes VR tools for training, therapy, and patient engagement.
- In November 2021, XRHealth, which is a leader in the extended reality telehealth therapeutic market, announced the launch of a crowdfunding campaign offering stock in its pioneering Virtual Clinics. Through these clinics, the company provides at-home medical treatments through VR/AR and digital health technologies. The platform serves to integrate licensed clinicians and allows access to advanced data analytics.
- In 2020, AppliedVR introduced a virtual reality-based pain management platform that offers personalized therapy for chronic pain sufferers. It utilizes immersive VR experiences to help patients manage pain effectively.
Report Scope
Report Features Description Market Value (2022) USD 2.4 Bn Forecast Revenue (2032) USD 19.7 Bn CAGR (2023-2032) 24.1% Base Year for Estimation 2022 Historic Period 2016-2022 Forecast Period 2023-2032 Report Coverage Revenue Forecast, Market Dynamics, COVID-19 Impact, Competitive Landscape, Recent Developments Segments Covered By Application (Medical Training and Education, Pain Management and Therapy, Surgical Simulations, Patient Rehabilitation, Cognitive Rehabilitation), Technology (Augmented Reality [AR], Virtual Reality [VR], Mixed Reality [MR]), End-User (Hospitals and Clinics, Medical Schools and Institutions, Pharmaceutical Companies, Research and Development Centers, Rehabilitation Centers), Content Type (3D Models and Anatomy Visualization, Interactive Modules and Simulations, Therapeutic VR Programs, Diagnostic VR Tools, Training and Procedure Walkthroughs), Component (Hardware, Software, Services, Accessories, Maintenance and Support) Regional Analysis North America – The US, Canada, & Mexico; Western Europe – Germany, France, The UK, Spain, Italy, Portugal, Ireland, Austria, Switzerland, Benelux, Nordic, & Rest of Western Europe; Eastern Europe – Russia, Poland, The Czech Republic, Greece, & Rest of Eastern Europe; APAC – China, Japan, South Korea, India, Australia & New Zealand, Indonesia, Malaysia, Philippines, Singapore, Thailand, Vietnam, & Rest of APAC; Latin America – Brazil, Colombia, Chile, Argentina, Costa Rica, & Rest of Latin America; Middle East & Africa – Algeria, Egypt, Israel, Kuwait, Nigeria, Saudi Arabia, South Africa, Turkey, United Arab Emirates, & Rest of MEA Competitive Landscape Oculus VR, HTC Corporation, Sony Corporation, Samsung Electronics Co., Ltd., Google LLC, Medtronic plc, AppliedVR, Inc., Osso VR, Inc., ImmersiveTouch Inc., Surgical Theater, LLC, VirtaMed AG, Psious, Oculus Surgical, MindMaze, Firsthand Technology, Touch Surgery, FundamentalVR, XRHealth, Embodied Labs, Vicarious Surgical Customization Scope Customization for segments, region/country-level will be provided. Moreover, additional customization can be done based on the requirements. Purchase Options We have three licenses to opt for: Single User License, Multi-User License (Up to 5 Users), Corporate Use License (Unlimited User and Printable PDF) -
- 1. Executive Summary
- 1.1. Definition
- 1.2. Taxonomy
- 1.3. Research Scope
- 1.4. Key Analysis
- 1.5. Key Findings by Major Segments
- 1.6. Top strategies by Major Players
- 2. Global Virtual Reality (VR) In Healthcare Market Overview
- 2.1. Virtual Reality (VR) In Healthcare Market Dynamics
- 2.1.1. Drivers
- 2.1.2. Opportunities
- 2.1.3. Restraints
- 2.1.4. Challenges
- 2.2. Macro-economic Factors
- 2.3. Regulatory Framework
- 2.4. Market Investment Feasibility Index
- 2.5. PEST Analysis
- 2.6. PORTER’S Five Force Analysis
- 2.7. Drivers & Restraints Impact Analysis
- 2.8. Industry Chain Analysis
- 2.9. Cost Structure Analysis
- 2.10. Marketing Strategy
- 2.11. Russia-Ukraine War Impact Analysis
- 2.12. Opportunity Map Analysis
- 2.13. Market Competition Scenario Analysis
- 2.14. Product Life Cycle Analysis
- 2.15. Opportunity Orbits
- 2.16. Manufacturer Intensity Map
- 2.17. Major Companies sales by Value & Volume
- 2.1. Virtual Reality (VR) In Healthcare Market Dynamics
- 3. Global Virtual Reality (VR) In Healthcare Market Analysis, Opportunity and Forecast, 2016-2032
- 3.1. Global Virtual Reality (VR) In Healthcare Market Analysis, 2016-2021
- 3.2. Global Virtual Reality (VR) In Healthcare Market Opportunity and Forecast, 2023-2032
- 3.3. Global Virtual Reality (VR) In Healthcare Market Analysis, Opportunity and Forecast, By By Application, 2016-2032
- 3.3.1. Global Virtual Reality (VR) In Healthcare Market Analysis by By Application: Introduction
- 3.3.2. Market Size Absolute $ Opportunity Analysis and Forecast, By By Application, 2016-2032
- 3.3.3. Medical Training and Education
- 3.3.4. Pain Management and Therapy
- 3.3.5. Surgical Simulations
- 3.3.6. Patient Rehabilitation
- 3.3.7. Cognitive Rehabilitation
- 3.4. Global Virtual Reality (VR) In Healthcare Market Analysis, Opportunity and Forecast, By Technology, 2016-2032
- 3.4.1. Global Virtual Reality (VR) In Healthcare Market Analysis by Technology: Introduction
- 3.4.2. Market Size Absolute $ Opportunity Analysis and Forecast, By Technology, 2016-2032
- 3.4.3. Augmented Reality (AR)
- 3.4.4. Virtual Reality (VR)
- 3.4.5. Mixed Reality (MR)
- 3.5. Global Virtual Reality (VR) In Healthcare Market Analysis, Opportunity and Forecast, By End-User, 2016-2032
- 3.5.1. Global Virtual Reality (VR) In Healthcare Market Analysis by End-User: Introduction
- 3.5.2. Market Size Absolute $ Opportunity Analysis and Forecast, By End-User, 2016-2032
- 3.5.3. Hospitals and Clinics
- 3.5.4. Medical Schools and Institutions
- 3.5.5. Pharmaceutical Companies
- 3.5.6. Research and Development Centers
- 3.5.7. Rehabilitation Centers
- 3.6. Global Virtual Reality (VR) In Healthcare Market Analysis, Opportunity and Forecast, By Content Type, 2016-2032
- 3.6.1. Global Virtual Reality (VR) In Healthcare Market Analysis by Content Type: Introduction
- 3.6.2. Market Size Absolute $ Opportunity Analysis and Forecast, By Content Type, 2016-2032
- 3.6.3. 3D Models and Anatomy Visualization
- 3.6.4. Interactive Modules and Simulations
- 3.6.5. Therapeutic VR Programs
- 3.6.6. Diagnostic VR Tools
- 3.6.7. Training and Procedure Walkthroughs
- 3.7. Global Virtual Reality (VR) In Healthcare Market Analysis, Opportunity and Forecast, By Component, 2016-2032
- 3.7.1. Global Virtual Reality (VR) In Healthcare Market Analysis by Component: Introduction
- 3.7.2. Market Size Absolute $ Opportunity Analysis and Forecast, By Component, 2016-2032
- 3.7.3. Hardware
- 3.7.4. Software
- 3.7.5. Services
- 3.7.6. Accessories
- 3.7.7. Maintenance and Support
- 4. North America Virtual Reality (VR) In Healthcare Market Analysis, Opportunity and Forecast, 2016-2032
- 4.1. North America Virtual Reality (VR) In Healthcare Market Analysis, 2016-2021
- 4.2. North America Virtual Reality (VR) In Healthcare Market Opportunity and Forecast, 2023-2032
- 4.3. North America Virtual Reality (VR) In Healthcare Market Analysis, Opportunity and Forecast, By By Application, 2016-2032
- 4.3.1. North America Virtual Reality (VR) In Healthcare Market Analysis by By Application: Introduction
- 4.3.2. Market Size Absolute $ Opportunity Analysis and Forecast, By By Application, 2016-2032
- 4.3.3. Medical Training and Education
- 4.3.4. Pain Management and Therapy
- 4.3.5. Surgical Simulations
- 4.3.6. Patient Rehabilitation
- 4.3.7. Cognitive Rehabilitation
- 4.4. North America Virtual Reality (VR) In Healthcare Market Analysis, Opportunity and Forecast, By Technology, 2016-2032
- 4.4.1. North America Virtual Reality (VR) In Healthcare Market Analysis by Technology: Introduction
- 4.4.2. Market Size Absolute $ Opportunity Analysis and Forecast, By Technology, 2016-2032
- 4.4.3. Augmented Reality (AR)
- 4.4.4. Virtual Reality (VR)
- 4.4.5. Mixed Reality (MR)
- 4.5. North America Virtual Reality (VR) In Healthcare Market Analysis, Opportunity and Forecast, By End-User, 2016-2032
- 4.5.1. North America Virtual Reality (VR) In Healthcare Market Analysis by End-User: Introduction
- 4.5.2. Market Size Absolute $ Opportunity Analysis and Forecast, By End-User, 2016-2032
- 4.5.3. Hospitals and Clinics
- 4.5.4. Medical Schools and Institutions
- 4.5.5. Pharmaceutical Companies
- 4.5.6. Research and Development Centers
- 4.5.7. Rehabilitation Centers
- 4.6. North America Virtual Reality (VR) In Healthcare Market Analysis, Opportunity and Forecast, By Content Type, 2016-2032
- 4.6.1. North America Virtual Reality (VR) In Healthcare Market Analysis by Content Type: Introduction
- 4.6.2. Market Size Absolute $ Opportunity Analysis and Forecast, By Content Type, 2016-2032
- 4.6.3. 3D Models and Anatomy Visualization
- 4.6.4. Interactive Modules and Simulations
- 4.6.5. Therapeutic VR Programs
- 4.6.6. Diagnostic VR Tools
- 4.6.7. Training and Procedure Walkthroughs
- 4.7. North America Virtual Reality (VR) In Healthcare Market Analysis, Opportunity and Forecast, By Component, 2016-2032
- 4.7.1. North America Virtual Reality (VR) In Healthcare Market Analysis by Component: Introduction
- 4.7.2. Market Size Absolute $ Opportunity Analysis and Forecast, By Component, 2016-2032
- 4.7.3. Hardware
- 4.7.4. Software
- 4.7.5. Services
- 4.7.6. Accessories
- 4.7.7. Maintenance and Support
- 4.8. North America Virtual Reality (VR) In Healthcare Market Analysis, Opportunity and Forecast, By Country , 2016-2032
- 4.8.1. North America Virtual Reality (VR) In Healthcare Market Analysis by Country : Introduction
- 4.8.2. Market Size Absolute $ Opportunity Analysis and Forecast, Country , 2016-2032
- 4.8.2.1. The US
- 4.8.2.2. Canada
- 4.8.2.3. Mexico
- 5. Western Europe Virtual Reality (VR) In Healthcare Market Analysis, Opportunity and Forecast, 2016-2032
- 5.1. Western Europe Virtual Reality (VR) In Healthcare Market Analysis, 2016-2021
- 5.2. Western Europe Virtual Reality (VR) In Healthcare Market Opportunity and Forecast, 2023-2032
- 5.3. Western Europe Virtual Reality (VR) In Healthcare Market Analysis, Opportunity and Forecast, By By Application, 2016-2032
- 5.3.1. Western Europe Virtual Reality (VR) In Healthcare Market Analysis by By Application: Introduction
- 5.3.2. Market Size Absolute $ Opportunity Analysis and Forecast, By By Application, 2016-2032
- 5.3.3. Medical Training and Education
- 5.3.4. Pain Management and Therapy
- 5.3.5. Surgical Simulations
- 5.3.6. Patient Rehabilitation
- 5.3.7. Cognitive Rehabilitation
- 5.4. Western Europe Virtual Reality (VR) In Healthcare Market Analysis, Opportunity and Forecast, By Technology, 2016-2032
- 5.4.1. Western Europe Virtual Reality (VR) In Healthcare Market Analysis by Technology: Introduction
- 5.4.2. Market Size Absolute $ Opportunity Analysis and Forecast, By Technology, 2016-2032
- 5.4.3. Augmented Reality (AR)
- 5.4.4. Virtual Reality (VR)
- 5.4.5. Mixed Reality (MR)
- 5.5. Western Europe Virtual Reality (VR) In Healthcare Market Analysis, Opportunity and Forecast, By End-User, 2016-2032
- 5.5.1. Western Europe Virtual Reality (VR) In Healthcare Market Analysis by End-User: Introduction
- 5.5.2. Market Size Absolute $ Opportunity Analysis and Forecast, By End-User, 2016-2032
- 5.5.3. Hospitals and Clinics
- 5.5.4. Medical Schools and Institutions
- 5.5.5. Pharmaceutical Companies
- 5.5.6. Research and Development Centers
- 5.5.7. Rehabilitation Centers
- 5.6. Western Europe Virtual Reality (VR) In Healthcare Market Analysis, Opportunity and Forecast, By Content Type, 2016-2032
- 5.6.1. Western Europe Virtual Reality (VR) In Healthcare Market Analysis by Content Type: Introduction
- 5.6.2. Market Size Absolute $ Opportunity Analysis and Forecast, By Content Type, 2016-2032
- 5.6.3. 3D Models and Anatomy Visualization
- 5.6.4. Interactive Modules and Simulations
- 5.6.5. Therapeutic VR Programs
- 5.6.6. Diagnostic VR Tools
- 5.6.7. Training and Procedure Walkthroughs
- 5.7. Western Europe Virtual Reality (VR) In Healthcare Market Analysis, Opportunity and Forecast, By Component, 2016-2032
- 5.7.1. Western Europe Virtual Reality (VR) In Healthcare Market Analysis by Component: Introduction
- 5.7.2. Market Size Absolute $ Opportunity Analysis and Forecast, By Component, 2016-2032
- 5.7.3. Hardware
- 5.7.4. Software
- 5.7.5. Services
- 5.7.6. Accessories
- 5.7.7. Maintenance and Support
- 5.8. Western Europe Virtual Reality (VR) In Healthcare Market Analysis, Opportunity and Forecast, By Country , 2016-2032
- 5.8.1. Western Europe Virtual Reality (VR) In Healthcare Market Analysis by Country : Introduction
- 5.8.2. Market Size Absolute $ Opportunity Analysis and Forecast, Country , 2016-2032
- 5.8.2.1. Germany
- 5.8.2.2. France
- 5.8.2.3. The UK
- 5.8.2.4. Spain
- 5.8.2.5. Italy
- 5.8.2.6. Portugal
- 5.8.2.7. Ireland
- 5.8.2.8. Austria
- 5.8.2.9. Switzerland
- 5.8.2.10. Benelux
- 5.8.2.11. Nordic
- 5.8.2.12. Rest of Western Europe
- 6. Eastern Europe Virtual Reality (VR) In Healthcare Market Analysis, Opportunity and Forecast, 2016-2032
- 6.1. Eastern Europe Virtual Reality (VR) In Healthcare Market Analysis, 2016-2021
- 6.2. Eastern Europe Virtual Reality (VR) In Healthcare Market Opportunity and Forecast, 2023-2032
- 6.3. Eastern Europe Virtual Reality (VR) In Healthcare Market Analysis, Opportunity and Forecast, By By Application, 2016-2032
- 6.3.1. Eastern Europe Virtual Reality (VR) In Healthcare Market Analysis by By Application: Introduction
- 6.3.2. Market Size Absolute $ Opportunity Analysis and Forecast, By By Application, 2016-2032
- 6.3.3. Medical Training and Education
- 6.3.4. Pain Management and Therapy
- 6.3.5. Surgical Simulations
- 6.3.6. Patient Rehabilitation
- 6.3.7. Cognitive Rehabilitation
- 6.4. Eastern Europe Virtual Reality (VR) In Healthcare Market Analysis, Opportunity and Forecast, By Technology, 2016-2032
- 6.4.1. Eastern Europe Virtual Reality (VR) In Healthcare Market Analysis by Technology: Introduction
- 6.4.2. Market Size Absolute $ Opportunity Analysis and Forecast, By Technology, 2016-2032
- 6.4.3. Augmented Reality (AR)
- 6.4.4. Virtual Reality (VR)
- 6.4.5. Mixed Reality (MR)
- 6.5. Eastern Europe Virtual Reality (VR) In Healthcare Market Analysis, Opportunity and Forecast, By End-User, 2016-2032
- 6.5.1. Eastern Europe Virtual Reality (VR) In Healthcare Market Analysis by End-User: Introduction
- 6.5.2. Market Size Absolute $ Opportunity Analysis and Forecast, By End-User, 2016-2032
- 6.5.3. Hospitals and Clinics
- 6.5.4. Medical Schools and Institutions
- 6.5.5. Pharmaceutical Companies
- 6.5.6. Research and Development Centers
- 6.5.7. Rehabilitation Centers
- 6.6. Eastern Europe Virtual Reality (VR) In Healthcare Market Analysis, Opportunity and Forecast, By Content Type, 2016-2032
- 6.6.1. Eastern Europe Virtual Reality (VR) In Healthcare Market Analysis by Content Type: Introduction
- 6.6.2. Market Size Absolute $ Opportunity Analysis and Forecast, By Content Type, 2016-2032
- 6.6.3. 3D Models and Anatomy Visualization
- 6.6.4. Interactive Modules and Simulations
- 6.6.5. Therapeutic VR Programs
- 6.6.6. Diagnostic VR Tools
- 6.6.7. Training and Procedure Walkthroughs
- 6.7. Eastern Europe Virtual Reality (VR) In Healthcare Market Analysis, Opportunity and Forecast, By Component, 2016-2032
- 6.7.1. Eastern Europe Virtual Reality (VR) In Healthcare Market Analysis by Component: Introduction
- 6.7.2. Market Size Absolute $ Opportunity Analysis and Forecast, By Component, 2016-2032
- 6.7.3. Hardware
- 6.7.4. Software
- 6.7.5. Services
- 6.7.6. Accessories
- 6.7.7. Maintenance and Support
- 6.8. Eastern Europe Virtual Reality (VR) In Healthcare Market Analysis, Opportunity and Forecast, By Country , 2016-2032
- 6.8.1. Eastern Europe Virtual Reality (VR) In Healthcare Market Analysis by Country : Introduction
- 6.8.2. Market Size Absolute $ Opportunity Analysis and Forecast, Country , 2016-2032
- 6.8.2.1. Russia
- 6.8.2.2. Poland
- 6.8.2.3. The Czech Republic
- 6.8.2.4. Greece
- 6.8.2.5. Rest of Eastern Europe
- 7. APAC Virtual Reality (VR) In Healthcare Market Analysis, Opportunity and Forecast, 2016-2032
- 7.1. APAC Virtual Reality (VR) In Healthcare Market Analysis, 2016-2021
- 7.2. APAC Virtual Reality (VR) In Healthcare Market Opportunity and Forecast, 2023-2032
- 7.3. APAC Virtual Reality (VR) In Healthcare Market Analysis, Opportunity and Forecast, By By Application, 2016-2032
- 7.3.1. APAC Virtual Reality (VR) In Healthcare Market Analysis by By Application: Introduction
- 7.3.2. Market Size Absolute $ Opportunity Analysis and Forecast, By By Application, 2016-2032
- 7.3.3. Medical Training and Education
- 7.3.4. Pain Management and Therapy
- 7.3.5. Surgical Simulations
- 7.3.6. Patient Rehabilitation
- 7.3.7. Cognitive Rehabilitation
- 7.4. APAC Virtual Reality (VR) In Healthcare Market Analysis, Opportunity and Forecast, By Technology, 2016-2032
- 7.4.1. APAC Virtual Reality (VR) In Healthcare Market Analysis by Technology: Introduction
- 7.4.2. Market Size Absolute $ Opportunity Analysis and Forecast, By Technology, 2016-2032
- 7.4.3. Augmented Reality (AR)
- 7.4.4. Virtual Reality (VR)
- 7.4.5. Mixed Reality (MR)
- 7.5. APAC Virtual Reality (VR) In Healthcare Market Analysis, Opportunity and Forecast, By End-User, 2016-2032
- 7.5.1. APAC Virtual Reality (VR) In Healthcare Market Analysis by End-User: Introduction
- 7.5.2. Market Size Absolute $ Opportunity Analysis and Forecast, By End-User, 2016-2032
- 7.5.3. Hospitals and Clinics
- 7.5.4. Medical Schools and Institutions
- 7.5.5. Pharmaceutical Companies
- 7.5.6. Research and Development Centers
- 7.5.7. Rehabilitation Centers
- 7.6. APAC Virtual Reality (VR) In Healthcare Market Analysis, Opportunity and Forecast, By Content Type, 2016-2032
- 7.6.1. APAC Virtual Reality (VR) In Healthcare Market Analysis by Content Type: Introduction
- 7.6.2. Market Size Absolute $ Opportunity Analysis and Forecast, By Content Type, 2016-2032
- 7.6.3. 3D Models and Anatomy Visualization
- 7.6.4. Interactive Modules and Simulations
- 7.6.5. Therapeutic VR Programs
- 7.6.6. Diagnostic VR Tools
- 7.6.7. Training and Procedure Walkthroughs
- 7.7. APAC Virtual Reality (VR) In Healthcare Market Analysis, Opportunity and Forecast, By Component, 2016-2032
- 7.7.1. APAC Virtual Reality (VR) In Healthcare Market Analysis by Component: Introduction
- 7.7.2. Market Size Absolute $ Opportunity Analysis and Forecast, By Component, 2016-2032
- 7.7.3. Hardware
- 7.7.4. Software
- 7.7.5. Services
- 7.7.6. Accessories
- 7.7.7. Maintenance and Support
- 7.8. APAC Virtual Reality (VR) In Healthcare Market Analysis, Opportunity and Forecast, By Country , 2016-2032
- 7.8.1. APAC Virtual Reality (VR) In Healthcare Market Analysis by Country : Introduction
- 7.8.2. Market Size Absolute $ Opportunity Analysis and Forecast, Country , 2016-2032
- 7.8.2.1. China
- 7.8.2.2. Japan
- 7.8.2.3. South Korea
- 7.8.2.4. India
- 7.8.2.5. Australia & New Zeland
- 7.8.2.6. Indonesia
- 7.8.2.7. Malaysia
- 7.8.2.8. Philippines
- 7.8.2.9. Singapore
- 7.8.2.10. Thailand
- 7.8.2.11. Vietnam
- 7.8.2.12. Rest of APAC
- 8. Latin America Virtual Reality (VR) In Healthcare Market Analysis, Opportunity and Forecast, 2016-2032
- 8.1. Latin America Virtual Reality (VR) In Healthcare Market Analysis, 2016-2021
- 8.2. Latin America Virtual Reality (VR) In Healthcare Market Opportunity and Forecast, 2023-2032
- 8.3. Latin America Virtual Reality (VR) In Healthcare Market Analysis, Opportunity and Forecast, By By Application, 2016-2032
- 8.3.1. Latin America Virtual Reality (VR) In Healthcare Market Analysis by By Application: Introduction
- 8.3.2. Market Size Absolute $ Opportunity Analysis and Forecast, By By Application, 2016-2032
- 8.3.3. Medical Training and Education
- 8.3.4. Pain Management and Therapy
- 8.3.5. Surgical Simulations
- 8.3.6. Patient Rehabilitation
- 8.3.7. Cognitive Rehabilitation
- 8.4. Latin America Virtual Reality (VR) In Healthcare Market Analysis, Opportunity and Forecast, By Technology, 2016-2032
- 8.4.1. Latin America Virtual Reality (VR) In Healthcare Market Analysis by Technology: Introduction
- 8.4.2. Market Size Absolute $ Opportunity Analysis and Forecast, By Technology, 2016-2032
- 8.4.3. Augmented Reality (AR)
- 8.4.4. Virtual Reality (VR)
- 8.4.5. Mixed Reality (MR)
- 8.5. Latin America Virtual Reality (VR) In Healthcare Market Analysis, Opportunity and Forecast, By End-User, 2016-2032
- 8.5.1. Latin America Virtual Reality (VR) In Healthcare Market Analysis by End-User: Introduction
- 8.5.2. Market Size Absolute $ Opportunity Analysis and Forecast, By End-User, 2016-2032
- 8.5.3. Hospitals and Clinics
- 8.5.4. Medical Schools and Institutions
- 8.5.5. Pharmaceutical Companies
- 8.5.6. Research and Development Centers
- 8.5.7. Rehabilitation Centers
- 8.6. Latin America Virtual Reality (VR) In Healthcare Market Analysis, Opportunity and Forecast, By Content Type, 2016-2032
- 8.6.1. Latin America Virtual Reality (VR) In Healthcare Market Analysis by Content Type: Introduction
- 8.6.2. Market Size Absolute $ Opportunity Analysis and Forecast, By Content Type, 2016-2032
- 8.6.3. 3D Models and Anatomy Visualization
- 8.6.4. Interactive Modules and Simulations
- 8.6.5. Therapeutic VR Programs
- 8.6.6. Diagnostic VR Tools
- 8.6.7. Training and Procedure Walkthroughs
- 8.7. Latin America Virtual Reality (VR) In Healthcare Market Analysis, Opportunity and Forecast, By Component, 2016-2032
- 8.7.1. Latin America Virtual Reality (VR) In Healthcare Market Analysis by Component: Introduction
- 8.7.2. Market Size Absolute $ Opportunity Analysis and Forecast, By Component, 2016-2032
- 8.7.3. Hardware
- 8.7.4. Software
- 8.7.5. Services
- 8.7.6. Accessories
- 8.7.7. Maintenance and Support
- 8.8. Latin America Virtual Reality (VR) In Healthcare Market Analysis, Opportunity and Forecast, By Country , 2016-2032
- 8.8.1. Latin America Virtual Reality (VR) In Healthcare Market Analysis by Country : Introduction
- 8.8.2. Market Size Absolute $ Opportunity Analysis and Forecast, Country , 2016-2032
- 8.8.2.1. Brazil
- 8.8.2.2. Colombia
- 8.8.2.3. Chile
- 8.8.2.4. Argentina
- 8.8.2.5. Costa Rica
- 8.8.2.6. Rest of Latin America
- 9. Middle East & Africa Virtual Reality (VR) In Healthcare Market Analysis, Opportunity and Forecast, 2016-2032
- 9.1. Middle East & Africa Virtual Reality (VR) In Healthcare Market Analysis, 2016-2021
- 9.2. Middle East & Africa Virtual Reality (VR) In Healthcare Market Opportunity and Forecast, 2023-2032
- 9.3. Middle East & Africa Virtual Reality (VR) In Healthcare Market Analysis, Opportunity and Forecast, By By Application, 2016-2032
- 9.3.1. Middle East & Africa Virtual Reality (VR) In Healthcare Market Analysis by By Application: Introduction
- 9.3.2. Market Size Absolute $ Opportunity Analysis and Forecast, By By Application, 2016-2032
- 9.3.3. Medical Training and Education
- 9.3.4. Pain Management and Therapy
- 9.3.5. Surgical Simulations
- 9.3.6. Patient Rehabilitation
- 9.3.7. Cognitive Rehabilitation
- 9.4. Middle East & Africa Virtual Reality (VR) In Healthcare Market Analysis, Opportunity and Forecast, By Technology, 2016-2032
- 9.4.1. Middle East & Africa Virtual Reality (VR) In Healthcare Market Analysis by Technology: Introduction
- 9.4.2. Market Size Absolute $ Opportunity Analysis and Forecast, By Technology, 2016-2032
- 9.4.3. Augmented Reality (AR)
- 9.4.4. Virtual Reality (VR)
- 9.4.5. Mixed Reality (MR)
- 9.5. Middle East & Africa Virtual Reality (VR) In Healthcare Market Analysis, Opportunity and Forecast, By End-User, 2016-2032
- 9.5.1. Middle East & Africa Virtual Reality (VR) In Healthcare Market Analysis by End-User: Introduction
- 9.5.2. Market Size Absolute $ Opportunity Analysis and Forecast, By End-User, 2016-2032
- 9.5.3. Hospitals and Clinics
- 9.5.4. Medical Schools and Institutions
- 9.5.5. Pharmaceutical Companies
- 9.5.6. Research and Development Centers
- 9.5.7. Rehabilitation Centers
- 9.6. Middle East & Africa Virtual Reality (VR) In Healthcare Market Analysis, Opportunity and Forecast, By Content Type, 2016-2032
- 9.6.1. Middle East & Africa Virtual Reality (VR) In Healthcare Market Analysis by Content Type: Introduction
- 9.6.2. Market Size Absolute $ Opportunity Analysis and Forecast, By Content Type, 2016-2032
- 9.6.3. 3D Models and Anatomy Visualization
- 9.6.4. Interactive Modules and Simulations
- 9.6.5. Therapeutic VR Programs
- 9.6.6. Diagnostic VR Tools
- 9.6.7. Training and Procedure Walkthroughs
- 9.7. Middle East & Africa Virtual Reality (VR) In Healthcare Market Analysis, Opportunity and Forecast, By Component, 2016-2032
- 9.7.1. Middle East & Africa Virtual Reality (VR) In Healthcare Market Analysis by Component: Introduction
- 9.7.2. Market Size Absolute $ Opportunity Analysis and Forecast, By Component, 2016-2032
- 9.7.3. Hardware
- 9.7.4. Software
- 9.7.5. Services
- 9.7.6. Accessories
- 9.7.7. Maintenance and Support
- 9.8. Middle East & Africa Virtual Reality (VR) In Healthcare Market Analysis, Opportunity and Forecast, By Country , 2016-2032
- 9.8.1. Middle East & Africa Virtual Reality (VR) In Healthcare Market Analysis by Country : Introduction
- 9.8.2. Market Size Absolute $ Opportunity Analysis and Forecast, Country , 2016-2032
- 9.8.2.1. Algeria
- 9.8.2.2. Egypt
- 9.8.2.3. Israel
- 9.8.2.4. Kuwait
- 9.8.2.5. Nigeria
- 9.8.2.6. Saudi Arabia
- 9.8.2.7. South Africa
- 9.8.2.8. Turkey
- 9.8.2.9. The UAE
- 9.8.2.10. Rest of MEA
- 10. Global Virtual Reality (VR) In Healthcare Market Analysis, Opportunity and Forecast, By Region , 2016-2032
- 10.1. Global Virtual Reality (VR) In Healthcare Market Analysis by Region : Introduction
- 10.2. Market Size Absolute $ Opportunity Analysis and Forecast, By Region , 2016-2032
- 10.2.1. North America
- 10.2.2. Western Europe
- 10.2.3. Eastern Europe
- 10.2.4. APAC
- 10.2.5. Latin America
- 10.2.6. Middle East & Africa
- 11. Global Virtual Reality (VR) In Healthcare Market Competitive Landscape, Market Share Analysis, and Company Profiles
- 11.1. Market Share Analysis
- 11.2. Company Profiles
- 11.3. Oculus VR
- 11.3.1. Company Overview
- 11.3.2. Financial Highlights
- 11.3.3. Product Portfolio
- 11.3.4. SWOT Analysis
- 11.3.5. Key Strategies and Developments
- 11.4. HTC Corporation
- 11.4.1. Company Overview
- 11.4.2. Financial Highlights
- 11.4.3. Product Portfolio
- 11.4.4. SWOT Analysis
- 11.4.5. Key Strategies and Developments
- 11.5. Sony Corporation
- 11.5.1. Company Overview
- 11.5.2. Financial Highlights
- 11.5.3. Product Portfolio
- 11.5.4. SWOT Analysis
- 11.5.5. Key Strategies and Developments
- 11.6. Samsung Electronics Co., Ltd.
- 11.6.1. Company Overview
- 11.6.2. Financial Highlights
- 11.6.3. Product Portfolio
- 11.6.4. SWOT Analysis
- 11.6.5. Key Strategies and Developments
- 11.7. Google LLC
- 11.7.1. Company Overview
- 11.7.2. Financial Highlights
- 11.7.3. Product Portfolio
- 11.7.4. SWOT Analysis
- 11.7.5. Key Strategies and Developments
- 11.8. Medtronic plc
- 11.8.1. Company Overview
- 11.8.2. Financial Highlights
- 11.8.3. Product Portfolio
- 11.8.4. SWOT Analysis
- 11.8.5. Key Strategies and Developments
- 11.9. AppliedVR, Inc.
- 11.9.1. Company Overview
- 11.9.2. Financial Highlights
- 11.9.3. Product Portfolio
- 11.9.4. SWOT Analysis
- 11.9.5. Key Strategies and Developments
- 11.10. Osso VR, Inc.
- 11.10.1. Company Overview
- 11.10.2. Financial Highlights
- 11.10.3. Product Portfolio
- 11.10.4. SWOT Analysis
- 11.10.5. Key Strategies and Developments
- 11.11. ImmersiveTouch Inc.
- 11.11.1. Company Overview
- 11.11.2. Financial Highlights
- 11.11.3. Product Portfolio
- 11.11.4. SWOT Analysis
- 11.11.5. Key Strategies and Developments
- 11.12. Surgical Theater, LLC
- 11.12.1. Company Overview
- 11.12.2. Financial Highlights
- 11.12.3. Product Portfolio
- 11.12.4. SWOT Analysis
- 11.12.5. Key Strategies and Developments
- 11.13. VirtaMed AG
- 11.13.1. Company Overview
- 11.13.2. Financial Highlights
- 11.13.3. Product Portfolio
- 11.13.4. SWOT Analysis
- 11.13.5. Key Strategies and Developments
- 11.14. Psious
- 11.14.1. Company Overview
- 11.14.2. Financial Highlights
- 11.14.3. Product Portfolio
- 11.14.4. SWOT Analysis
- 11.14.5. Key Strategies and Developments
- 11.15. Oculus Surgical
- 11.15.1. Company Overview
- 11.15.2. Financial Highlights
- 11.15.3. Product Portfolio
- 11.15.4. SWOT Analysis
- 11.15.5. Key Strategies and Developments
- 11.16. MindMaze
- 11.16.1. Company Overview
- 11.16.2. Financial Highlights
- 11.16.3. Product Portfolio
- 11.16.4. SWOT Analysis
- 11.16.5. Key Strategies and Developments
- 11.17. Firsthand Technology
- 11.17.1. Company Overview
- 11.17.2. Financial Highlights
- 11.17.3. Product Portfolio
- 11.17.4. SWOT Analysis
- 11.17.5. Key Strategies and Developments
- 11.18. Touch Surgery
- 11.18.1. Company Overview
- 11.18.2. Financial Highlights
- 11.18.3. Product Portfolio
- 11.18.4. SWOT Analysis
- 11.18.5. Key Strategies and Developments
- 11.19. FundamentalVR
- 11.19.1. Company Overview
- 11.19.2. Financial Highlights
- 11.19.3. Product Portfolio
- 11.19.4. SWOT Analysis
- 11.19.5. Key Strategies and Developments
- 11.20. XRHealth
- 11.20.1. Company Overview
- 11.20.2. Financial Highlights
- 11.20.3. Product Portfolio
- 11.20.4. SWOT Analysis
- 11.20.5. Key Strategies and Developments
- 11.21. Embodied Labs
- 11.21.1. Company Overview
- 11.21.2. Financial Highlights
- 11.21.3. Product Portfolio
- 11.21.4. SWOT Analysis
- 11.21.5. Key Strategies and Developments
- 11.22. Vicarious Surgical
- 11.22.1. Company Overview
- 11.22.2. Financial Highlights
- 11.22.3. Product Portfolio
- 11.22.4. SWOT Analysis
- 11.22.5. Key Strategies and Developments
- 12. Assumptions and Acronyms
- 13. Research Methodology
- 14. Contact
- List of Figures
- Figure 1: Global Virtual Reality (VR) In Healthcare Market Revenue (US$ Mn) Market Share by By Application in 2022
- Figure 2: Global Virtual Reality (VR) In Healthcare Market Attractiveness Analysis by By Application, 2016-2032
- Figure 3: Global Virtual Reality (VR) In Healthcare Market Revenue (US$ Mn) Market Share by Technologyin 2022
- Figure 4: Global Virtual Reality (VR) In Healthcare Market Attractiveness Analysis by Technology, 2016-2032
- Figure 5: Global Virtual Reality (VR) In Healthcare Market Revenue (US$ Mn) Market Share by End-Userin 2022
- Figure 6: Global Virtual Reality (VR) In Healthcare Market Attractiveness Analysis by End-User, 2016-2032
- Figure 7: Global Virtual Reality (VR) In Healthcare Market Revenue (US$ Mn) Market Share by Content Typein 2022
- Figure 8: Global Virtual Reality (VR) In Healthcare Market Attractiveness Analysis by Content Type, 2016-2032
- Figure 9: Global Virtual Reality (VR) In Healthcare Market Revenue (US$ Mn) Market Share by Componentin 2022
- Figure 10: Global Virtual Reality (VR) In Healthcare Market Attractiveness Analysis by Component, 2016-2032
- Figure 11: Global Virtual Reality (VR) In Healthcare Market Revenue (US$ Mn) Market Share by Region in 2022
- Figure 12: Global Virtual Reality (VR) In Healthcare Market Attractiveness Analysis by Region, 2016-2032
- Figure 13: Global Virtual Reality (VR) In Healthcare Market Revenue (US$ Mn) (2016-2032)
- Figure 14: Global Virtual Reality (VR) In Healthcare Market Revenue (US$ Mn) Comparison by Region (2016-2032)
- Figure 15: Global Virtual Reality (VR) In Healthcare Market Revenue (US$ Mn) Comparison by By Application (2016-2032)
- Figure 16: Global Virtual Reality (VR) In Healthcare Market Revenue (US$ Mn) Comparison by Technology (2016-2032)
- Figure 17: Global Virtual Reality (VR) In Healthcare Market Revenue (US$ Mn) Comparison by End-User (2016-2032)
- Figure 18: Global Virtual Reality (VR) In Healthcare Market Revenue (US$ Mn) Comparison by Content Type (2016-2032)
- Figure 19: Global Virtual Reality (VR) In Healthcare Market Revenue (US$ Mn) Comparison by Component (2016-2032)
- Figure 20: Global Virtual Reality (VR) In Healthcare Market Y-o-Y Growth Rate Comparison by Region (2016-2032)
- Figure 21: Global Virtual Reality (VR) In Healthcare Market Y-o-Y Growth Rate Comparison by By Application (2016-2032)
- Figure 22: Global Virtual Reality (VR) In Healthcare Market Y-o-Y Growth Rate Comparison by Technology (2016-2032)
- Figure 23: Global Virtual Reality (VR) In Healthcare Market Y-o-Y Growth Rate Comparison by End-User (2016-2032)
- Figure 24: Global Virtual Reality (VR) In Healthcare Market Y-o-Y Growth Rate Comparison by Content Type (2016-2032)
- Figure 25: Global Virtual Reality (VR) In Healthcare Market Y-o-Y Growth Rate Comparison by Component (2016-2032)
- Figure 26: Global Virtual Reality (VR) In Healthcare Market Share Comparison by Region (2016-2032)
- Figure 27: Global Virtual Reality (VR) In Healthcare Market Share Comparison by By Application (2016-2032)
- Figure 28: Global Virtual Reality (VR) In Healthcare Market Share Comparison by Technology (2016-2032)
- Figure 29: Global Virtual Reality (VR) In Healthcare Market Share Comparison by End-User (2016-2032)
- Figure 30: Global Virtual Reality (VR) In Healthcare Market Share Comparison by Content Type (2016-2032)
- Figure 31: Global Virtual Reality (VR) In Healthcare Market Share Comparison by Component (2016-2032)
- Figure 32: North America Virtual Reality (VR) In Healthcare Market Revenue (US$ Mn) Market Share by By Applicationin 2022
- Figure 33: North America Virtual Reality (VR) In Healthcare Market Attractiveness Analysis by By Application, 2016-2032
- Figure 34: North America Virtual Reality (VR) In Healthcare Market Revenue (US$ Mn) Market Share by Technologyin 2022
- Figure 35: North America Virtual Reality (VR) In Healthcare Market Attractiveness Analysis by Technology, 2016-2032
- Figure 36: North America Virtual Reality (VR) In Healthcare Market Revenue (US$ Mn) Market Share by End-Userin 2022
- Figure 37: North America Virtual Reality (VR) In Healthcare Market Attractiveness Analysis by End-User, 2016-2032
- Figure 38: North America Virtual Reality (VR) In Healthcare Market Revenue (US$ Mn) Market Share by Content Typein 2022
- Figure 39: North America Virtual Reality (VR) In Healthcare Market Attractiveness Analysis by Content Type, 2016-2032
- Figure 40: North America Virtual Reality (VR) In Healthcare Market Revenue (US$ Mn) Market Share by Componentin 2022
- Figure 41: North America Virtual Reality (VR) In Healthcare Market Attractiveness Analysis by Component, 2016-2032
- Figure 42: North America Virtual Reality (VR) In Healthcare Market Revenue (US$ Mn) Market Share by Country in 2022
- Figure 43: North America Virtual Reality (VR) In Healthcare Market Attractiveness Analysis by Country, 2016-2032
- Figure 44: North America Virtual Reality (VR) In Healthcare Market Revenue (US$ Mn) (2016-2032)
- Figure 45: North America Virtual Reality (VR) In Healthcare Market Revenue (US$ Mn) Comparison by Country (2016-2032)
- Figure 46: North America Virtual Reality (VR) In Healthcare Market Revenue (US$ Mn) Comparison by By Application (2016-2032)
- Figure 47: North America Virtual Reality (VR) In Healthcare Market Revenue (US$ Mn) Comparison by Technology (2016-2032)
- Figure 48: North America Virtual Reality (VR) In Healthcare Market Revenue (US$ Mn) Comparison by End-User (2016-2032)
- Figure 49: North America Virtual Reality (VR) In Healthcare Market Revenue (US$ Mn) Comparison by Content Type (2016-2032)
- Figure 50: North America Virtual Reality (VR) In Healthcare Market Revenue (US$ Mn) Comparison by Component (2016-2032)
- Figure 51: North America Virtual Reality (VR) In Healthcare Market Y-o-Y Growth Rate Comparison by Country (2016-2032)
- Figure 52: North America Virtual Reality (VR) In Healthcare Market Y-o-Y Growth Rate Comparison by By Application (2016-2032)
- Figure 53: North America Virtual Reality (VR) In Healthcare Market Y-o-Y Growth Rate Comparison by Technology (2016-2032)
- Figure 54: North America Virtual Reality (VR) In Healthcare Market Y-o-Y Growth Rate Comparison by End-User (2016-2032)
- Figure 55: North America Virtual Reality (VR) In Healthcare Market Y-o-Y Growth Rate Comparison by Content Type (2016-2032)
- Figure 56: North America Virtual Reality (VR) In Healthcare Market Y-o-Y Growth Rate Comparison by Component (2016-2032)
- Figure 57: North America Virtual Reality (VR) In Healthcare Market Share Comparison by Country (2016-2032)
- Figure 58: North America Virtual Reality (VR) In Healthcare Market Share Comparison by By Application (2016-2032)
- Figure 59: North America Virtual Reality (VR) In Healthcare Market Share Comparison by Technology (2016-2032)
- Figure 60: North America Virtual Reality (VR) In Healthcare Market Share Comparison by End-User (2016-2032)
- Figure 61: North America Virtual Reality (VR) In Healthcare Market Share Comparison by Content Type (2016-2032)
- Figure 62: North America Virtual Reality (VR) In Healthcare Market Share Comparison by Component (2016-2032)
- Figure 63: Western Europe Virtual Reality (VR) In Healthcare Market Revenue (US$ Mn) Market Share by By Applicationin 2022
- Figure 64: Western Europe Virtual Reality (VR) In Healthcare Market Attractiveness Analysis by By Application, 2016-2032
- Figure 65: Western Europe Virtual Reality (VR) In Healthcare Market Revenue (US$ Mn) Market Share by Technologyin 2022
- Figure 66: Western Europe Virtual Reality (VR) In Healthcare Market Attractiveness Analysis by Technology, 2016-2032
- Figure 67: Western Europe Virtual Reality (VR) In Healthcare Market Revenue (US$ Mn) Market Share by End-Userin 2022
- Figure 68: Western Europe Virtual Reality (VR) In Healthcare Market Attractiveness Analysis by End-User, 2016-2032
- Figure 69: Western Europe Virtual Reality (VR) In Healthcare Market Revenue (US$ Mn) Market Share by Content Typein 2022
- Figure 70: Western Europe Virtual Reality (VR) In Healthcare Market Attractiveness Analysis by Content Type, 2016-2032
- Figure 71: Western Europe Virtual Reality (VR) In Healthcare Market Revenue (US$ Mn) Market Share by Componentin 2022
- Figure 72: Western Europe Virtual Reality (VR) In Healthcare Market Attractiveness Analysis by Component, 2016-2032
- Figure 73: Western Europe Virtual Reality (VR) In Healthcare Market Revenue (US$ Mn) Market Share by Country in 2022
- Figure 74: Western Europe Virtual Reality (VR) In Healthcare Market Attractiveness Analysis by Country, 2016-2032
- Figure 75: Western Europe Virtual Reality (VR) In Healthcare Market Revenue (US$ Mn) (2016-2032)
- Figure 76: Western Europe Virtual Reality (VR) In Healthcare Market Revenue (US$ Mn) Comparison by Country (2016-2032)
- Figure 77: Western Europe Virtual Reality (VR) In Healthcare Market Revenue (US$ Mn) Comparison by By Application (2016-2032)
- Figure 78: Western Europe Virtual Reality (VR) In Healthcare Market Revenue (US$ Mn) Comparison by Technology (2016-2032)
- Figure 79: Western Europe Virtual Reality (VR) In Healthcare Market Revenue (US$ Mn) Comparison by End-User (2016-2032)
- Figure 80: Western Europe Virtual Reality (VR) In Healthcare Market Revenue (US$ Mn) Comparison by Content Type (2016-2032)
- Figure 81: Western Europe Virtual Reality (VR) In Healthcare Market Revenue (US$ Mn) Comparison by Component (2016-2032)
- Figure 82: Western Europe Virtual Reality (VR) In Healthcare Market Y-o-Y Growth Rate Comparison by Country (2016-2032)
- Figure 83: Western Europe Virtual Reality (VR) In Healthcare Market Y-o-Y Growth Rate Comparison by By Application (2016-2032)
- Figure 84: Western Europe Virtual Reality (VR) In Healthcare Market Y-o-Y Growth Rate Comparison by Technology (2016-2032)
- Figure 85: Western Europe Virtual Reality (VR) In Healthcare Market Y-o-Y Growth Rate Comparison by End-User (2016-2032)
- Figure 86: Western Europe Virtual Reality (VR) In Healthcare Market Y-o-Y Growth Rate Comparison by Content Type (2016-2032)
- Figure 87: Western Europe Virtual Reality (VR) In Healthcare Market Y-o-Y Growth Rate Comparison by Component (2016-2032)
- Figure 88: Western Europe Virtual Reality (VR) In Healthcare Market Share Comparison by Country (2016-2032)
- Figure 89: Western Europe Virtual Reality (VR) In Healthcare Market Share Comparison by By Application (2016-2032)
- Figure 90: Western Europe Virtual Reality (VR) In Healthcare Market Share Comparison by Technology (2016-2032)
- Figure 91: Western Europe Virtual Reality (VR) In Healthcare Market Share Comparison by End-User (2016-2032)
- Figure 92: Western Europe Virtual Reality (VR) In Healthcare Market Share Comparison by Content Type (2016-2032)
- Figure 93: Western Europe Virtual Reality (VR) In Healthcare Market Share Comparison by Component (2016-2032)
- Figure 94: Eastern Europe Virtual Reality (VR) In Healthcare Market Revenue (US$ Mn) Market Share by By Applicationin 2022
- Figure 95: Eastern Europe Virtual Reality (VR) In Healthcare Market Attractiveness Analysis by By Application, 2016-2032
- Figure 96: Eastern Europe Virtual Reality (VR) In Healthcare Market Revenue (US$ Mn) Market Share by Technologyin 2022
- Figure 97: Eastern Europe Virtual Reality (VR) In Healthcare Market Attractiveness Analysis by Technology, 2016-2032
- Figure 98: Eastern Europe Virtual Reality (VR) In Healthcare Market Revenue (US$ Mn) Market Share by End-Userin 2022
- Figure 99: Eastern Europe Virtual Reality (VR) In Healthcare Market Attractiveness Analysis by End-User, 2016-2032
- Figure 100: Eastern Europe Virtual Reality (VR) In Healthcare Market Revenue (US$ Mn) Market Share by Content Typein 2022
- Figure 101: Eastern Europe Virtual Reality (VR) In Healthcare Market Attractiveness Analysis by Content Type, 2016-2032
- Figure 102: Eastern Europe Virtual Reality (VR) In Healthcare Market Revenue (US$ Mn) Market Share by Componentin 2022
- Figure 103: Eastern Europe Virtual Reality (VR) In Healthcare Market Attractiveness Analysis by Component, 2016-2032
- Figure 104: Eastern Europe Virtual Reality (VR) In Healthcare Market Revenue (US$ Mn) Market Share by Country in 2022
- Figure 105: Eastern Europe Virtual Reality (VR) In Healthcare Market Attractiveness Analysis by Country, 2016-2032
- Figure 106: Eastern Europe Virtual Reality (VR) In Healthcare Market Revenue (US$ Mn) (2016-2032)
- Figure 107: Eastern Europe Virtual Reality (VR) In Healthcare Market Revenue (US$ Mn) Comparison by Country (2016-2032)
- Figure 108: Eastern Europe Virtual Reality (VR) In Healthcare Market Revenue (US$ Mn) Comparison by By Application (2016-2032)
- Figure 109: Eastern Europe Virtual Reality (VR) In Healthcare Market Revenue (US$ Mn) Comparison by Technology (2016-2032)
- Figure 110: Eastern Europe Virtual Reality (VR) In Healthcare Market Revenue (US$ Mn) Comparison by End-User (2016-2032)
- Figure 111: Eastern Europe Virtual Reality (VR) In Healthcare Market Revenue (US$ Mn) Comparison by Content Type (2016-2032)
- Figure 112: Eastern Europe Virtual Reality (VR) In Healthcare Market Revenue (US$ Mn) Comparison by Component (2016-2032)
- Figure 113: Eastern Europe Virtual Reality (VR) In Healthcare Market Y-o-Y Growth Rate Comparison by Country (2016-2032)
- Figure 114: Eastern Europe Virtual Reality (VR) In Healthcare Market Y-o-Y Growth Rate Comparison by By Application (2016-2032)
- Figure 115: Eastern Europe Virtual Reality (VR) In Healthcare Market Y-o-Y Growth Rate Comparison by Technology (2016-2032)
- Figure 116: Eastern Europe Virtual Reality (VR) In Healthcare Market Y-o-Y Growth Rate Comparison by End-User (2016-2032)
- Figure 117: Eastern Europe Virtual Reality (VR) In Healthcare Market Y-o-Y Growth Rate Comparison by Content Type (2016-2032)
- Figure 118: Eastern Europe Virtual Reality (VR) In Healthcare Market Y-o-Y Growth Rate Comparison by Component (2016-2032)
- Figure 119: Eastern Europe Virtual Reality (VR) In Healthcare Market Share Comparison by Country (2016-2032)
- Figure 120: Eastern Europe Virtual Reality (VR) In Healthcare Market Share Comparison by By Application (2016-2032)
- Figure 121: Eastern Europe Virtual Reality (VR) In Healthcare Market Share Comparison by Technology (2016-2032)
- Figure 122: Eastern Europe Virtual Reality (VR) In Healthcare Market Share Comparison by End-User (2016-2032)
- Figure 123: Eastern Europe Virtual Reality (VR) In Healthcare Market Share Comparison by Content Type (2016-2032)
- Figure 124: Eastern Europe Virtual Reality (VR) In Healthcare Market Share Comparison by Component (2016-2032)
- Figure 125: APAC Virtual Reality (VR) In Healthcare Market Revenue (US$ Mn) Market Share by By Applicationin 2022
- Figure 126: APAC Virtual Reality (VR) In Healthcare Market Attractiveness Analysis by By Application, 2016-2032
- Figure 127: APAC Virtual Reality (VR) In Healthcare Market Revenue (US$ Mn) Market Share by Technologyin 2022
- Figure 128: APAC Virtual Reality (VR) In Healthcare Market Attractiveness Analysis by Technology, 2016-2032
- Figure 129: APAC Virtual Reality (VR) In Healthcare Market Revenue (US$ Mn) Market Share by End-Userin 2022
- Figure 130: APAC Virtual Reality (VR) In Healthcare Market Attractiveness Analysis by End-User, 2016-2032
- Figure 131: APAC Virtual Reality (VR) In Healthcare Market Revenue (US$ Mn) Market Share by Content Typein 2022
- Figure 132: APAC Virtual Reality (VR) In Healthcare Market Attractiveness Analysis by Content Type, 2016-2032
- Figure 133: APAC Virtual Reality (VR) In Healthcare Market Revenue (US$ Mn) Market Share by Componentin 2022
- Figure 134: APAC Virtual Reality (VR) In Healthcare Market Attractiveness Analysis by Component, 2016-2032
- Figure 135: APAC Virtual Reality (VR) In Healthcare Market Revenue (US$ Mn) Market Share by Country in 2022
- Figure 136: APAC Virtual Reality (VR) In Healthcare Market Attractiveness Analysis by Country, 2016-2032
- Figure 137: APAC Virtual Reality (VR) In Healthcare Market Revenue (US$ Mn) (2016-2032)
- Figure 138: APAC Virtual Reality (VR) In Healthcare Market Revenue (US$ Mn) Comparison by Country (2016-2032)
- Figure 139: APAC Virtual Reality (VR) In Healthcare Market Revenue (US$ Mn) Comparison by By Application (2016-2032)
- Figure 140: APAC Virtual Reality (VR) In Healthcare Market Revenue (US$ Mn) Comparison by Technology (2016-2032)
- Figure 141: APAC Virtual Reality (VR) In Healthcare Market Revenue (US$ Mn) Comparison by End-User (2016-2032)
- Figure 142: APAC Virtual Reality (VR) In Healthcare Market Revenue (US$ Mn) Comparison by Content Type (2016-2032)
- Figure 143: APAC Virtual Reality (VR) In Healthcare Market Revenue (US$ Mn) Comparison by Component (2016-2032)
- Figure 144: APAC Virtual Reality (VR) In Healthcare Market Y-o-Y Growth Rate Comparison by Country (2016-2032)
- Figure 145: APAC Virtual Reality (VR) In Healthcare Market Y-o-Y Growth Rate Comparison by By Application (2016-2032)
- Figure 146: APAC Virtual Reality (VR) In Healthcare Market Y-o-Y Growth Rate Comparison by Technology (2016-2032)
- Figure 147: APAC Virtual Reality (VR) In Healthcare Market Y-o-Y Growth Rate Comparison by End-User (2016-2032)
- Figure 148: APAC Virtual Reality (VR) In Healthcare Market Y-o-Y Growth Rate Comparison by Content Type (2016-2032)
- Figure 149: APAC Virtual Reality (VR) In Healthcare Market Y-o-Y Growth Rate Comparison by Component (2016-2032)
- Figure 150: APAC Virtual Reality (VR) In Healthcare Market Share Comparison by Country (2016-2032)
- Figure 151: APAC Virtual Reality (VR) In Healthcare Market Share Comparison by By Application (2016-2032)
- Figure 152: APAC Virtual Reality (VR) In Healthcare Market Share Comparison by Technology (2016-2032)
- Figure 153: APAC Virtual Reality (VR) In Healthcare Market Share Comparison by End-User (2016-2032)
- Figure 154: APAC Virtual Reality (VR) In Healthcare Market Share Comparison by Content Type (2016-2032)
- Figure 155: APAC Virtual Reality (VR) In Healthcare Market Share Comparison by Component (2016-2032)
- Figure 156: Latin America Virtual Reality (VR) In Healthcare Market Revenue (US$ Mn) Market Share by By Applicationin 2022
- Figure 157: Latin America Virtual Reality (VR) In Healthcare Market Attractiveness Analysis by By Application, 2016-2032
- Figure 158: Latin America Virtual Reality (VR) In Healthcare Market Revenue (US$ Mn) Market Share by Technologyin 2022
- Figure 159: Latin America Virtual Reality (VR) In Healthcare Market Attractiveness Analysis by Technology, 2016-2032
- Figure 160: Latin America Virtual Reality (VR) In Healthcare Market Revenue (US$ Mn) Market Share by End-Userin 2022
- Figure 161: Latin America Virtual Reality (VR) In Healthcare Market Attractiveness Analysis by End-User, 2016-2032
- Figure 162: Latin America Virtual Reality (VR) In Healthcare Market Revenue (US$ Mn) Market Share by Content Typein 2022
- Figure 163: Latin America Virtual Reality (VR) In Healthcare Market Attractiveness Analysis by Content Type, 2016-2032
- Figure 164: Latin America Virtual Reality (VR) In Healthcare Market Revenue (US$ Mn) Market Share by Componentin 2022
- Figure 165: Latin America Virtual Reality (VR) In Healthcare Market Attractiveness Analysis by Component, 2016-2032
- Figure 166: Latin America Virtual Reality (VR) In Healthcare Market Revenue (US$ Mn) Market Share by Country in 2022
- Figure 167: Latin America Virtual Reality (VR) In Healthcare Market Attractiveness Analysis by Country, 2016-2032
- Figure 168: Latin America Virtual Reality (VR) In Healthcare Market Revenue (US$ Mn) (2016-2032)
- Figure 169: Latin America Virtual Reality (VR) In Healthcare Market Revenue (US$ Mn) Comparison by Country (2016-2032)
- Figure 170: Latin America Virtual Reality (VR) In Healthcare Market Revenue (US$ Mn) Comparison by By Application (2016-2032)
- Figure 171: Latin America Virtual Reality (VR) In Healthcare Market Revenue (US$ Mn) Comparison by Technology (2016-2032)
- Figure 172: Latin America Virtual Reality (VR) In Healthcare Market Revenue (US$ Mn) Comparison by End-User (2016-2032)
- Figure 173: Latin America Virtual Reality (VR) In Healthcare Market Revenue (US$ Mn) Comparison by Content Type (2016-2032)
- Figure 174: Latin America Virtual Reality (VR) In Healthcare Market Revenue (US$ Mn) Comparison by Component (2016-2032)
- Figure 175: Latin America Virtual Reality (VR) In Healthcare Market Y-o-Y Growth Rate Comparison by Country (2016-2032)
- Figure 176: Latin America Virtual Reality (VR) In Healthcare Market Y-o-Y Growth Rate Comparison by By Application (2016-2032)
- Figure 177: Latin America Virtual Reality (VR) In Healthcare Market Y-o-Y Growth Rate Comparison by Technology (2016-2032)
- Figure 178: Latin America Virtual Reality (VR) In Healthcare Market Y-o-Y Growth Rate Comparison by End-User (2016-2032)
- Figure 179: Latin America Virtual Reality (VR) In Healthcare Market Y-o-Y Growth Rate Comparison by Content Type (2016-2032)
- Figure 180: Latin America Virtual Reality (VR) In Healthcare Market Y-o-Y Growth Rate Comparison by Component (2016-2032)
- Figure 181: Latin America Virtual Reality (VR) In Healthcare Market Share Comparison by Country (2016-2032)
- Figure 182: Latin America Virtual Reality (VR) In Healthcare Market Share Comparison by By Application (2016-2032)
- Figure 183: Latin America Virtual Reality (VR) In Healthcare Market Share Comparison by Technology (2016-2032)
- Figure 184: Latin America Virtual Reality (VR) In Healthcare Market Share Comparison by End-User (2016-2032)
- Figure 185: Latin America Virtual Reality (VR) In Healthcare Market Share Comparison by Content Type (2016-2032)
- Figure 186: Latin America Virtual Reality (VR) In Healthcare Market Share Comparison by Component (2016-2032)
- Figure 187: Middle East & Africa Virtual Reality (VR) In Healthcare Market Revenue (US$ Mn) Market Share by By Applicationin 2022
- Figure 188: Middle East & Africa Virtual Reality (VR) In Healthcare Market Attractiveness Analysis by By Application, 2016-2032
- Figure 189: Middle East & Africa Virtual Reality (VR) In Healthcare Market Revenue (US$ Mn) Market Share by Technologyin 2022
- Figure 190: Middle East & Africa Virtual Reality (VR) In Healthcare Market Attractiveness Analysis by Technology, 2016-2032
- Figure 191: Middle East & Africa Virtual Reality (VR) In Healthcare Market Revenue (US$ Mn) Market Share by End-Userin 2022
- Figure 192: Middle East & Africa Virtual Reality (VR) In Healthcare Market Attractiveness Analysis by End-User, 2016-2032
- Figure 193: Middle East & Africa Virtual Reality (VR) In Healthcare Market Revenue (US$ Mn) Market Share by Content Typein 2022
- Figure 194: Middle East & Africa Virtual Reality (VR) In Healthcare Market Attractiveness Analysis by Content Type, 2016-2032
- Figure 195: Middle East & Africa Virtual Reality (VR) In Healthcare Market Revenue (US$ Mn) Market Share by Componentin 2022
- Figure 196: Middle East & Africa Virtual Reality (VR) In Healthcare Market Attractiveness Analysis by Component, 2016-2032
- Figure 197: Middle East & Africa Virtual Reality (VR) In Healthcare Market Revenue (US$ Mn) Market Share by Country in 2022
- Figure 198: Middle East & Africa Virtual Reality (VR) In Healthcare Market Attractiveness Analysis by Country, 2016-2032
- Figure 199: Middle East & Africa Virtual Reality (VR) In Healthcare Market Revenue (US$ Mn) (2016-2032)
- Figure 200: Middle East & Africa Virtual Reality (VR) In Healthcare Market Revenue (US$ Mn) Comparison by Country (2016-2032)
- Figure 201: Middle East & Africa Virtual Reality (VR) In Healthcare Market Revenue (US$ Mn) Comparison by By Application (2016-2032)
- Figure 202: Middle East & Africa Virtual Reality (VR) In Healthcare Market Revenue (US$ Mn) Comparison by Technology (2016-2032)
- Figure 203: Middle East & Africa Virtual Reality (VR) In Healthcare Market Revenue (US$ Mn) Comparison by End-User (2016-2032)
- Figure 204: Middle East & Africa Virtual Reality (VR) In Healthcare Market Revenue (US$ Mn) Comparison by Content Type (2016-2032)
- Figure 205: Middle East & Africa Virtual Reality (VR) In Healthcare Market Revenue (US$ Mn) Comparison by Component (2016-2032)
- Figure 206: Middle East & Africa Virtual Reality (VR) In Healthcare Market Y-o-Y Growth Rate Comparison by Country (2016-2032)
- Figure 207: Middle East & Africa Virtual Reality (VR) In Healthcare Market Y-o-Y Growth Rate Comparison by By Application (2016-2032)
- Figure 208: Middle East & Africa Virtual Reality (VR) In Healthcare Market Y-o-Y Growth Rate Comparison by Technology (2016-2032)
- Figure 209: Middle East & Africa Virtual Reality (VR) In Healthcare Market Y-o-Y Growth Rate Comparison by End-User (2016-2032)
- Figure 210: Middle East & Africa Virtual Reality (VR) In Healthcare Market Y-o-Y Growth Rate Comparison by Content Type (2016-2032)
- Figure 211: Middle East & Africa Virtual Reality (VR) In Healthcare Market Y-o-Y Growth Rate Comparison by Component (2016-2032)
- Figure 212: Middle East & Africa Virtual Reality (VR) In Healthcare Market Share Comparison by Country (2016-2032)
- Figure 213: Middle East & Africa Virtual Reality (VR) In Healthcare Market Share Comparison by By Application (2016-2032)
- Figure 214: Middle East & Africa Virtual Reality (VR) In Healthcare Market Share Comparison by Technology (2016-2032)
- Figure 215: Middle East & Africa Virtual Reality (VR) In Healthcare Market Share Comparison by End-User (2016-2032)
- Figure 216: Middle East & Africa Virtual Reality (VR) In Healthcare Market Share Comparison by Content Type (2016-2032)
- Figure 217: Middle East & Africa Virtual Reality (VR) In Healthcare Market Share Comparison by Component (2016-2032)
"
- List of Tables
- "
- Table 1: Global Virtual Reality (VR) In Healthcare Market Comparison by Application (2016-2032)
- Table 2: Global Virtual Reality (VR) In Healthcare Market Comparison by Technology (2016-2032)
- Table 3: Global Virtual Reality (VR) In Healthcare Market Comparison by End-User (2016-2032)
- Table 4: Global Virtual Reality (VR) In Healthcare Market Comparison by Content Type (2016-2032)
- Table 5: Global Virtual Reality (VR) In Healthcare Market Comparison by Component (2016-2032)
- Table 6: Global Virtual Reality (VR) In Healthcare Market Revenue (US$ Mn) Comparison by Region (2016-2032)
- Table 7: Global Virtual Reality (VR) In Healthcare Market Revenue (US$ Mn) (2016-2032)
- Table 8: Global Virtual Reality (VR) In Healthcare Market Revenue (US$ Mn) Comparison by Region (2016-2032)
- Table 9: Global Virtual Reality (VR) In Healthcare Market Revenue (US$ Mn) Comparison by Application (2016-2032)
- Table 10: Global Virtual Reality (VR) In Healthcare Market Revenue (US$ Mn) Comparison by Technology (2016-2032)
- Table 11: Global Virtual Reality (VR) In Healthcare Market Revenue (US$ Mn) Comparison by End-User (2016-2032)
- Table 12: Global Virtual Reality (VR) In Healthcare Market Revenue (US$ Mn) Comparison by Content Type (2016-2032)
- Table 13: Global Virtual Reality (VR) In Healthcare Market Revenue (US$ Mn) Comparison by Component (2016-2032)
- Table 14: Global Virtual Reality (VR) In Healthcare Market Y-o-Y Growth Rate Comparison by Region (2016-2032)
- Table 15: Global Virtual Reality (VR) In Healthcare Market Y-o-Y Growth Rate Comparison by Application (2016-2032)
- Table 16: Global Virtual Reality (VR) In Healthcare Market Y-o-Y Growth Rate Comparison by Technology (2016-2032)
- Table 17: Global Virtual Reality (VR) In Healthcare Market Y-o-Y Growth Rate Comparison by End-User (2016-2032)
- Table 18: Global Virtual Reality (VR) In Healthcare Market Y-o-Y Growth Rate Comparison by Content Type (2016-2032)
- Table 19: Global Virtual Reality (VR) In Healthcare Market Y-o-Y Growth Rate Comparison by Component (2016-2032)
- Table 20: Global Virtual Reality (VR) In Healthcare Market Share Comparison by Region (2016-2032)
- Table 21: Global Virtual Reality (VR) In Healthcare Market Share Comparison by Application (2016-2032)
- Table 22: Global Virtual Reality (VR) In Healthcare Market Share Comparison by Technology (2016-2032)
- Table 23: Global Virtual Reality (VR) In Healthcare Market Share Comparison by End-User (2016-2032)
- Table 24: Global Virtual Reality (VR) In Healthcare Market Share Comparison by Content Type (2016-2032)
- Table 25: Global Virtual Reality (VR) In Healthcare Market Share Comparison by Component (2016-2032)
- Table 26: North America Virtual Reality (VR) In Healthcare Market Comparison by Technology (2016-2032)
- Table 27: North America Virtual Reality (VR) In Healthcare Market Comparison by End-User (2016-2032)
- Table 28: North America Virtual Reality (VR) In Healthcare Market Comparison by Content Type (2016-2032)
- Table 29: North America Virtual Reality (VR) In Healthcare Market Comparison by Component (2016-2032)
- Table 30: North America Virtual Reality (VR) In Healthcare Market Revenue (US$ Mn) Comparison by Country (2016-2032)
- Table 31: North America Virtual Reality (VR) In Healthcare Market Revenue (US$ Mn) (2016-2032)
- Table 32: North America Virtual Reality (VR) In Healthcare Market Revenue (US$ Mn) Comparison by Country (2016-2032)
- Table 33: North America Virtual Reality (VR) In Healthcare Market Revenue (US$ Mn) Comparison by Application (2016-2032)
- Table 34: North America Virtual Reality (VR) In Healthcare Market Revenue (US$ Mn) Comparison by Technology (2016-2032)
- Table 35: North America Virtual Reality (VR) In Healthcare Market Revenue (US$ Mn) Comparison by End-User (2016-2032)
- Table 36: North America Virtual Reality (VR) In Healthcare Market Revenue (US$ Mn) Comparison by Content Type (2016-2032)
- Table 37: North America Virtual Reality (VR) In Healthcare Market Revenue (US$ Mn) Comparison by Component (2016-2032)
- Table 38: North America Virtual Reality (VR) In Healthcare Market Y-o-Y Growth Rate Comparison by Country (2016-2032)
- Table 39: North America Virtual Reality (VR) In Healthcare Market Y-o-Y Growth Rate Comparison by Application (2016-2032)
- Table 40: North America Virtual Reality (VR) In Healthcare Market Y-o-Y Growth Rate Comparison by Technology (2016-2032)
- Table 41: North America Virtual Reality (VR) In Healthcare Market Y-o-Y Growth Rate Comparison by End-User (2016-2032)
- Table 42: North America Virtual Reality (VR) In Healthcare Market Y-o-Y Growth Rate Comparison by Content Type (2016-2032)
- Table 43: North America Virtual Reality (VR) In Healthcare Market Y-o-Y Growth Rate Comparison by Component (2016-2032)
- Table 44: North America Virtual Reality (VR) In Healthcare Market Share Comparison by Country (2016-2032)
- Table 45: North America Virtual Reality (VR) In Healthcare Market Share Comparison by Application (2016-2032)
- Table 46: North America Virtual Reality (VR) In Healthcare Market Share Comparison by Technology (2016-2032)
- Table 47: North America Virtual Reality (VR) In Healthcare Market Share Comparison by End-User (2016-2032)
- Table 48: North America Virtual Reality (VR) In Healthcare Market Share Comparison by Content Type (2016-2032)
- Table 49: North America Virtual Reality (VR) In Healthcare Market Share Comparison by Component (2016-2032)
- Table 50: Western Europe Virtual Reality (VR) In Healthcare Market Comparison by Application (2016-2032)
- Table 51: Western Europe Virtual Reality (VR) In Healthcare Market Comparison by Technology (2016-2032)
- Table 52: Western Europe Virtual Reality (VR) In Healthcare Market Comparison by End-User (2016-2032)
- Table 53: Western Europe Virtual Reality (VR) In Healthcare Market Comparison by Content Type (2016-2032)
- Table 54: Western Europe Virtual Reality (VR) In Healthcare Market Comparison by Component (2016-2032)
- Table 55: Western Europe Virtual Reality (VR) In Healthcare Market Revenue (US$ Mn) Comparison by Country (2016-2032)
- Table 56: Western Europe Virtual Reality (VR) In Healthcare Market Revenue (US$ Mn) (2016-2032)
- Table 57: Western Europe Virtual Reality (VR) In Healthcare Market Revenue (US$ Mn) Comparison by Country (2016-2032)
- Table 58: Western Europe Virtual Reality (VR) In Healthcare Market Revenue (US$ Mn) Comparison by Application (2016-2032)
- Table 59: Western Europe Virtual Reality (VR) In Healthcare Market Revenue (US$ Mn) Comparison by Technology (2016-2032)
- Table 60: Western Europe Virtual Reality (VR) In Healthcare Market Revenue (US$ Mn) Comparison by End-User (2016-2032)
- Table 61: Western Europe Virtual Reality (VR) In Healthcare Market Revenue (US$ Mn) Comparison by Content Type (2016-2032)
- Table 62: Western Europe Virtual Reality (VR) In Healthcare Market Revenue (US$ Mn) Comparison by Component (2016-2032)
- Table 63: Western Europe Virtual Reality (VR) In Healthcare Market Y-o-Y Growth Rate Comparison by Country (2016-2032)
- Table 64: Western Europe Virtual Reality (VR) In Healthcare Market Y-o-Y Growth Rate Comparison by Application (2016-2032)
- Table 65: Western Europe Virtual Reality (VR) In Healthcare Market Y-o-Y Growth Rate Comparison by Technology (2016-2032)
- Table 66: Western Europe Virtual Reality (VR) In Healthcare Market Y-o-Y Growth Rate Comparison by End-User (2016-2032)
- Table 67: Western Europe Virtual Reality (VR) In Healthcare Market Y-o-Y Growth Rate Comparison by Content Type (2016-2032)
- Table 68: Western Europe Virtual Reality (VR) In Healthcare Market Y-o-Y Growth Rate Comparison by Component (2016-2032)
- Table 69: Western Europe Virtual Reality (VR) In Healthcare Market Share Comparison by Country (2016-2032)
- Table 70: Western Europe Virtual Reality (VR) In Healthcare Market Share Comparison by Application (2016-2032)
- Table 71: Western Europe Virtual Reality (VR) In Healthcare Market Share Comparison by Technology (2016-2032)
- Table 72: Western Europe Virtual Reality (VR) In Healthcare Market Share Comparison by End-User (2016-2032)
- Table 73: Western Europe Virtual Reality (VR) In Healthcare Market Share Comparison by Content Type (2016-2032)
- Table 74: Western Europe Virtual Reality (VR) In Healthcare Market Share Comparison by Component (2016-2032)
- Table 75: Eastern Europe Virtual Reality (VR) In Healthcare Market Comparison by Application (2016-2032)
- Table 76: Eastern Europe Virtual Reality (VR) In Healthcare Market Comparison by Technology (2016-2032)
- Table 77: Eastern Europe Virtual Reality (VR) In Healthcare Market Comparison by End-User (2016-2032)
- Table 78: Eastern Europe Virtual Reality (VR) In Healthcare Market Comparison by Content Type (2016-2032)
- Table 79: Eastern Europe Virtual Reality (VR) In Healthcare Market Comparison by Component (2016-2032)
- Table 80: Eastern Europe Virtual Reality (VR) In Healthcare Market Revenue (US$ Mn) Comparison by Country (2016-2032)
- Table 81: Eastern Europe Virtual Reality (VR) In Healthcare Market Revenue (US$ Mn) (2016-2032)
- Table 82: Eastern Europe Virtual Reality (VR) In Healthcare Market Revenue (US$ Mn) Comparison by Country (2016-2032)
- Table 83: Eastern Europe Virtual Reality (VR) In Healthcare Market Revenue (US$ Mn) Comparison by Application (2016-2032)
- Table 84: Eastern Europe Virtual Reality (VR) In Healthcare Market Revenue (US$ Mn) Comparison by Technology (2016-2032)
- Table 85: Eastern Europe Virtual Reality (VR) In Healthcare Market Revenue (US$ Mn) Comparison by End-User (2016-2032)
- Table 86: Eastern Europe Virtual Reality (VR) In Healthcare Market Revenue (US$ Mn) Comparison by Content Type (2016-2032)
- Table 87: Eastern Europe Virtual Reality (VR) In Healthcare Market Revenue (US$ Mn) Comparison by Component (2016-2032)
- Table 88: Eastern Europe Virtual Reality (VR) In Healthcare Market Y-o-Y Growth Rate Comparison by Country (2016-2032)
- Table 89: Eastern Europe Virtual Reality (VR) In Healthcare Market Y-o-Y Growth Rate Comparison by Application (2016-2032)
- Table 90: Eastern Europe Virtual Reality (VR) In Healthcare Market Y-o-Y Growth Rate Comparison by Technology (2016-2032)
- Table 91: Eastern Europe Virtual Reality (VR) In Healthcare Market Y-o-Y Growth Rate Comparison by End-User (2016-2032)
- Table 92: Eastern Europe Virtual Reality (VR) In Healthcare Market Y-o-Y Growth Rate Comparison by Content Type (2016-2032)
- Table 93: Eastern Europe Virtual Reality (VR) In Healthcare Market Y-o-Y Growth Rate Comparison by Component (2016-2032)
- Table 94: Eastern Europe Virtual Reality (VR) In Healthcare Market Share Comparison by Country (2016-2032)
- Table 95: Eastern Europe Virtual Reality (VR) In Healthcare Market Share Comparison by Application (2016-2032)
- Table 96: Eastern Europe Virtual Reality (VR) In Healthcare Market Share Comparison by Technology (2016-2032)
- Table 97: Eastern Europe Virtual Reality (VR) In Healthcare Market Share Comparison by End-User (2016-2032)
- Table 98: Eastern Europe Virtual Reality (VR) In Healthcare Market Share Comparison by Content Type (2016-2032)
- Table 99: Eastern Europe Virtual Reality (VR) In Healthcare Market Share Comparison by Component (2016-2032)
- Table 100: APAC Virtual Reality (VR) In Healthcare Market Comparison by Application (2016-2032)
- Table 101: APAC Virtual Reality (VR) In Healthcare Market Comparison by Technology (2016-2032)
- Table 102: APAC Virtual Reality (VR) In Healthcare Market Comparison by End-User (2016-2032)
- Table 103: APAC Virtual Reality (VR) In Healthcare Market Comparison by Content Type (2016-2032)
- Table 104: APAC Virtual Reality (VR) In Healthcare Market Comparison by Component (2016-2032)
- Table 105: APAC Virtual Reality (VR) In Healthcare Market Revenue (US$ Mn) Comparison by Country (2016-2032)
- Table 106: APAC Virtual Reality (VR) In Healthcare Market Revenue (US$ Mn) (2016-2032)
- Table 107: APAC Virtual Reality (VR) In Healthcare Market Revenue (US$ Mn) Comparison by Country (2016-2032)
- Table 108: APAC Virtual Reality (VR) In Healthcare Market Revenue (US$ Mn) Comparison by Application (2016-2032)
- Table 109: APAC Virtual Reality (VR) In Healthcare Market Revenue (US$ Mn) Comparison by Technology (2016-2032)
- Table 110: APAC Virtual Reality (VR) In Healthcare Market Revenue (US$ Mn) Comparison by End-User (2016-2032)
- Table 111: APAC Virtual Reality (VR) In Healthcare Market Revenue (US$ Mn) Comparison by Content Type (2016-2032)
- Table 112: APAC Virtual Reality (VR) In Healthcare Market Revenue (US$ Mn) Comparison by Component (2016-2032)
- Table 113: APAC Virtual Reality (VR) In Healthcare Market Y-o-Y Growth Rate Comparison by Country (2016-2032)
- Table 114: APAC Virtual Reality (VR) In Healthcare Market Y-o-Y Growth Rate Comparison by Application (2016-2032)
- Table 115: APAC Virtual Reality (VR) In Healthcare Market Y-o-Y Growth Rate Comparison by Technology (2016-2032)
- Table 116: APAC Virtual Reality (VR) In Healthcare Market Y-o-Y Growth Rate Comparison by End-User (2016-2032)
- Table 117: APAC Virtual Reality (VR) In Healthcare Market Y-o-Y Growth Rate Comparison by Content Type (2016-2032)
- Table 118: APAC Virtual Reality (VR) In Healthcare Market Y-o-Y Growth Rate Comparison by Component (2016-2032)
- Table 119: APAC Virtual Reality (VR) In Healthcare Market Share Comparison by Country (2016-2032)
- Table 120: APAC Virtual Reality (VR) In Healthcare Market Share Comparison by Application (2016-2032)
- Table 121: APAC Virtual Reality (VR) In Healthcare Market Share Comparison by Technology (2016-2032)
- Table 122: APAC Virtual Reality (VR) In Healthcare Market Share Comparison by End-User (2016-2032)
- Table 123: APAC Virtual Reality (VR) In Healthcare Market Share Comparison by Content Type (2016-2032)
- Table 124: APAC Virtual Reality (VR) In Healthcare Market Share Comparison by Component (2016-2032)
- Table 125: Latin America Virtual Reality (VR) In Healthcare Market Comparison by Application (2016-2032)
- Table 126: Latin America Virtual Reality (VR) In Healthcare Market Comparison by Technology (2016-2032)
- Table 127: Latin America Virtual Reality (VR) In Healthcare Market Comparison by End-User (2016-2032)
- Table 128: Latin America Virtual Reality (VR) In Healthcare Market Comparison by Content Type (2016-2032)
- Table 129: Latin America Virtual Reality (VR) In Healthcare Market Comparison by Component (2016-2032)
- Table 130: Latin America Virtual Reality (VR) In Healthcare Market Revenue (US$ Mn) Comparison by Country (2016-2032)
- Table 131: Latin America Virtual Reality (VR) In Healthcare Market Revenue (US$ Mn) (2016-2032)
- Table 132: Latin America Virtual Reality (VR) In Healthcare Market Revenue (US$ Mn) Comparison by Country (2016-2032)
- Table 133: Latin America Virtual Reality (VR) In Healthcare Market Revenue (US$ Mn) Comparison by Application (2016-2032)
- Table 134: Latin America Virtual Reality (VR) In Healthcare Market Revenue (US$ Mn) Comparison by Technology (2016-2032)
- Table 135: Latin America Virtual Reality (VR) In Healthcare Market Revenue (US$ Mn) Comparison by End-User (2016-2032)
- Table 136: Latin America Virtual Reality (VR) In Healthcare Market Revenue (US$ Mn) Comparison by Content Type (2016-2032)
- Table 137: Latin America Virtual Reality (VR) In Healthcare Market Revenue (US$ Mn) Comparison by Component (2016-2032)
- Table 138: Latin America Virtual Reality (VR) In Healthcare Market Y-o-Y Growth Rate Comparison by Country (2016-2032)
- Table 139: Latin America Virtual Reality (VR) In Healthcare Market Y-o-Y Growth Rate Comparison by Application (2016-2032)
- Table 140: Latin America Virtual Reality (VR) In Healthcare Market Y-o-Y Growth Rate Comparison by Technology (2016-2032)
- Table 141: Latin America Virtual Reality (VR) In Healthcare Market Y-o-Y Growth Rate Comparison by End-User (2016-2032)
- Table 142: Latin America Virtual Reality (VR) In Healthcare Market Y-o-Y Growth Rate Comparison by Content Type (2016-2032)
- Table 143: Latin America Virtual Reality (VR) In Healthcare Market Y-o-Y Growth Rate Comparison by Component (2016-2032)
- Table 144: Latin America Virtual Reality (VR) In Healthcare Market Share Comparison by Country (2016-2032)
- Table 145: Latin America Virtual Reality (VR) In Healthcare Market Share Comparison by Application (2016-2032)
- Table 146: Latin America Virtual Reality (VR) In Healthcare Market Share Comparison by Technology (2016-2032)
- Table 147: Latin America Virtual Reality (VR) In Healthcare Market Share Comparison by End-User (2016-2032)
- Table 148: Latin America Virtual Reality (VR) In Healthcare Market Share Comparison by Content Type (2016-2032)
- Table 149: Latin America Virtual Reality (VR) In Healthcare Market Share Comparison by Component (2016-2032)
- Table 150: Middle East & Africa Virtual Reality (VR) In Healthcare Market Comparison by Application (2016-2032)
- Table 151: Middle East & Africa Virtual Reality (VR) In Healthcare Market Comparison by Technology (2016-2032)
- Table 152: Middle East & Africa Virtual Reality (VR) In Healthcare Market Comparison by End-User (2016-2032)
- Table 153: Middle East & Africa Virtual Reality (VR) In Healthcare Market Comparison by Content Type (2016-2032)
- Table 154: Middle East & Africa Virtual Reality (VR) In Healthcare Market Comparison by Component (2016-2032)
- Table 155: Middle East & Africa Virtual Reality (VR) In Healthcare Market Revenue (US$ Mn) Comparison by Country (2016-2032)
- Table 156: Middle East & Africa Virtual Reality (VR) In Healthcare Market Revenue (US$ Mn) (2016-2032)
- Table 157: Middle East & Africa Virtual Reality (VR) In Healthcare Market Revenue (US$ Mn) Comparison by Country (2016-2032)
- Table 158: Middle East & Africa Virtual Reality (VR) In Healthcare Market Revenue (US$ Mn) Comparison by Application (2016-2032)
- Table 159: Middle East & Africa Virtual Reality (VR) In Healthcare Market Revenue (US$ Mn) Comparison by Technology (2016-2032)
- Table 160: Middle East & Africa Virtual Reality (VR) In Healthcare Market Revenue (US$ Mn) Comparison by End-User (2016-2032)
- Table 161: Middle East & Africa Virtual Reality (VR) In Healthcare Market Revenue (US$ Mn) Comparison by Content Type (2016-2032)
- Table 162: Middle East & Africa Virtual Reality (VR) In Healthcare Market Revenue (US$ Mn) Comparison by Component (2016-2032)
- Table 163: Middle East & Africa Virtual Reality (VR) In Healthcare Market Y-o-Y Growth Rate Comparison by Country (2016-2032)
- Table 164: Middle East & Africa Virtual Reality (VR) In Healthcare Market Y-o-Y Growth Rate Comparison by Application (2016-2032)
- Table 165: Middle East & Africa Virtual Reality (VR) In Healthcare Market Y-o-Y Growth Rate Comparison by Technology (2016-2032)
- Table 166: Middle East & Africa Virtual Reality (VR) In Healthcare Market Y-o-Y Growth Rate Comparison by End-User (2016-2032)
- Table 167: Middle East & Africa Virtual Reality (VR) In Healthcare Market Y-o-Y Growth Rate Comparison by Content Type (2016-2032)
- Table 168: Middle East & Africa Virtual Reality (VR) In Healthcare Market Y-o-Y Growth Rate Comparison by Component (2016-2032)
- Table 169: Middle East & Africa Virtual Reality (VR) In Healthcare Market Share Comparison by Country (2016-2032)
- Table 170: Middle East & Africa Virtual Reality (VR) In Healthcare Market Share Comparison by Application (2016-2032)
- Table 171: Middle East & Africa Virtual Reality (VR) In Healthcare Market Share Comparison by Technology (2016-2032)
- Table 172: Middle East & Africa Virtual Reality (VR) In Healthcare Market Share Comparison by End-User (2016-2032)
- Table 173: Middle East & Africa Virtual Reality (VR) In Healthcare Market Share Comparison by Content Type (2016-2032)
- Table 174: Middle East & Africa Virtual Reality (VR) In Healthcare Market Share Comparison by Component (2016-2032)
- 1. Executive Summary
-
- Oculus VR
- HTC Corporation
- Sony Corporation
- Samsung Electronics Co., Ltd.
- Google LLC
- Medtronic plc
- AppliedVR, Inc.
- Osso VR, Inc.
- ImmersiveTouch Inc.
- Surgical Theater, LLC
- VirtaMed AG
- Psious
- Oculus Surgical
- MindMaze
- Firsthand Technology
- Touch Surgery
- FundamentalVR
- XRHealth
- Embodied Labs
- Vicarious Surgical
Our Clients


View Our Licence Options
