Tonic Water Market Report By Type (Regular Tonic Water, Diet/Low-Calorie Tonic Water, Flavored Tonic Water, Organic Tonic Water, Others), By Packaging Type (Glass Bottles, Cans, Plastic Bottles, Others), By Distribution Channel (Supermarkets/Hypermarkets, Convenience Stores, Specialty Stores, Online Retail, Others), By Region and Companies - Industry Segment Outlook, Market Assessment, Competition Scenario, Trends and Forecast 2024-2033
-
4715
-
May 2024
-
325
-


-
This report was compiled by Shreyas Rokade Shreyas Rokade is a seasoned Research Analyst with CMFE, bringing extensive expertise in market research and consulting, with a strong background in Chemical Engineering. Correspondence Team Lead-CMFE Linkedin | Detailed Market research Methodology Our methodology involves a mix of primary research, including interviews with leading mental health experts, and secondary research from reputable medical journals and databases. View Detailed Methodology Page
-
Quick Navigation
Report Overview
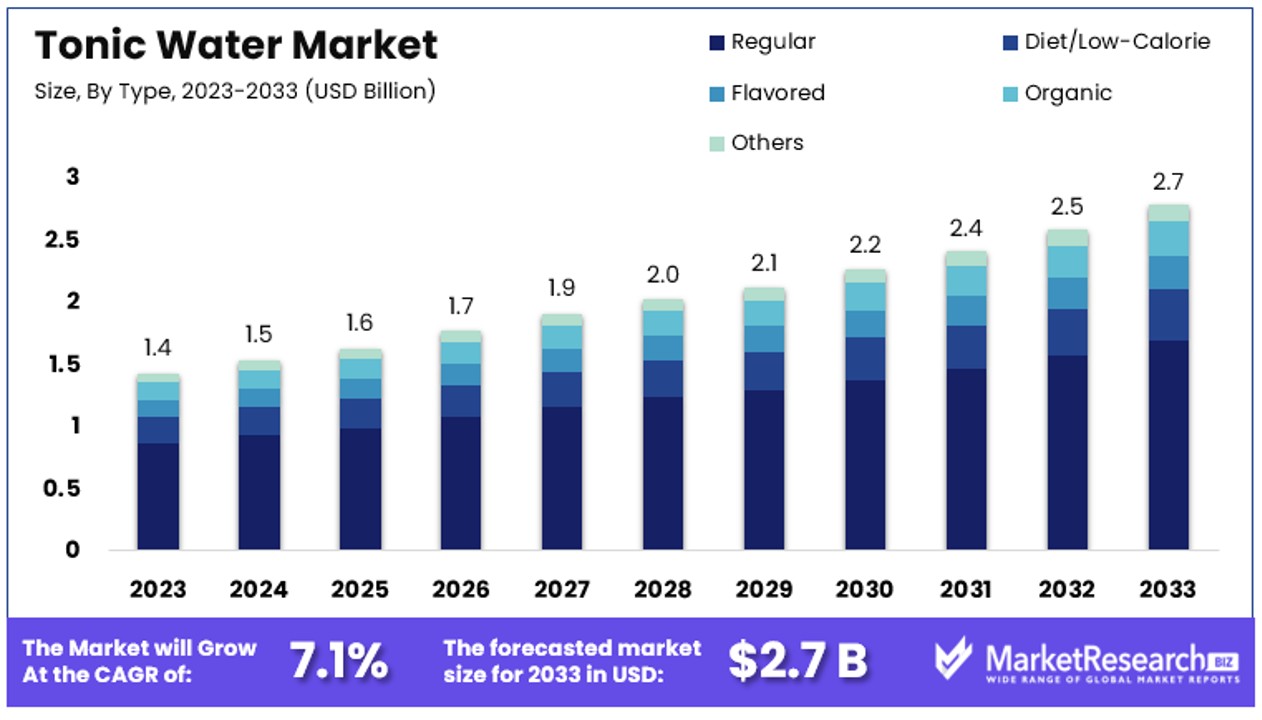
The Global Tonic Water Market size is expected to be worth around USD 2.7 Billion by 2033, from USD 1.4 Billion in 2023, growing at a CAGR of 7.1% during the forecast period from 2024 to 2033.
The Tonic Water Market comprises the global sales and distribution of tonic water, a carbonated soft drink flavored primarily with quinine. This market caters to beverage manufacturers, retail sectors, and end consumers seeking mixer solutions for alcoholic beverages, notably gin.
The market's growth is driven by rising demand for premium mixers and the expanding cocktail culture globally. Key players include global beverage brands and regional producers. Trends influencing this market include the introduction of low-sugar and flavored variants, catering to health-conscious consumers and diversifying consumer preferences. Strategic insights into this market can aid stakeholders in decision-making and positioning for growth.
The Tonic Water Market presents a significant opportunity within the beverage industry, particularly in the context of rising cocktail consumption. Data from the bar industry reveals that 40% of Americans aged 35 to 44 consume cocktails at least half the time they dine out, underscoring a robust demand for mixed beverages. This consumer behavior is a driving force behind the growth in the tonic water market, as tonic water is a fundamental component in many popular cocktails, such as the classic gin and tonic.
The market is experiencing an evolution with the introduction of premium and artisanal tonic water brands, which cater to a growing segment of consumers seeking high-quality, unique beverage experiences. These premium products often feature natural ingredients and come in a variety of flavors, appealing to both health-conscious consumers and those with discerning tastes. Furthermore, the trend towards health and wellness has prompted manufacturers to innovate by reducing sugar content and introducing organic and natural alternatives, expanding the market's appeal.
The strategic positioning of tonic water as both a mixer and a standalone soft drink allows it to tap into diverse consumer segments. This versatility is critical in leveraging the broader trends within the beverage industry, where versatility and quality are increasingly prized by consumers.
For stakeholders, including beverage manufacturers, marketers, and distributors, understanding these dynamics is crucial for capitalizing on the market’s growth potential and navigating the competitive landscape effectively. The ongoing expansion of the cocktail culture globally, coupled with consumer shifts towards more sophisticated and health-conscious drinking habits, indicates a positive growth trajectory for the tonic water market.
Key Takeaways
- Market Value: The Global Tonic Water Market size is expected to be worth around USD 2.7 Billion by 2033, from USD 1.4 Billion in 2023, growing at a CAGR of 7.1% during the forecast period from 2024 to 2033.
- Type: Regular Tonic Water dominates with 62.4% due to its traditional appeal and widespread availability.
- Packaging Type: Glass Bottles dominate the market, offering premium appeal and better flavor preservation.
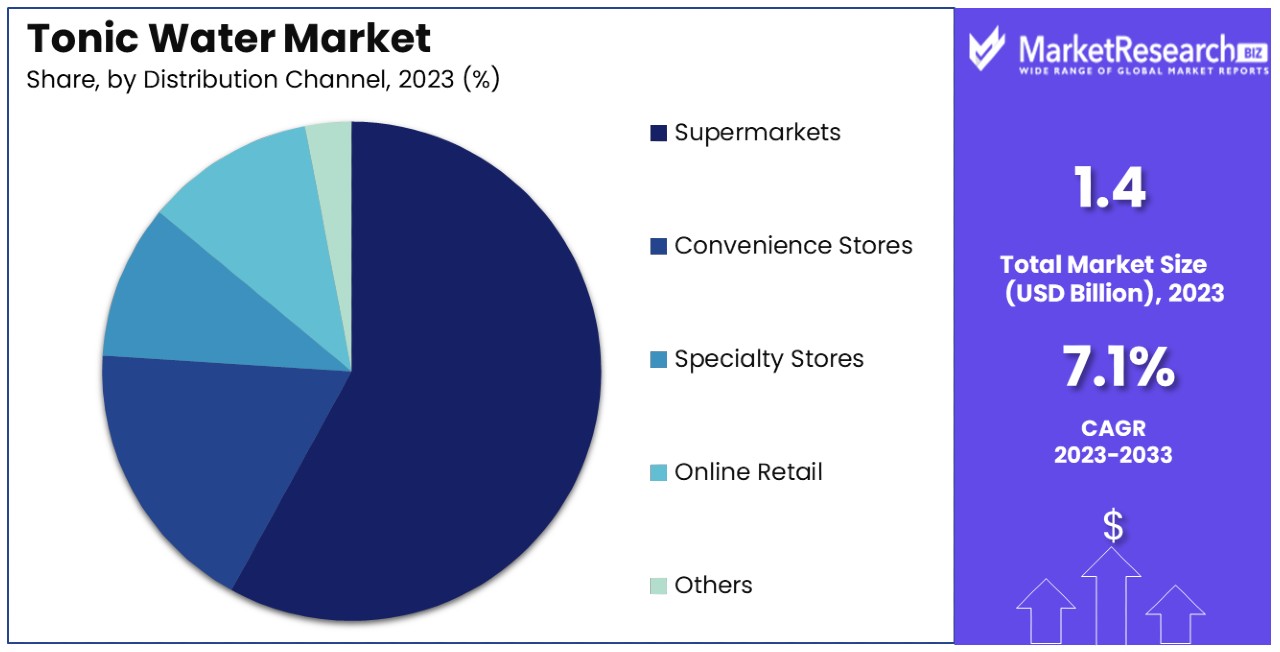
- Distribution Channel: Supermarkets/Hypermarkets lead with 53% due to their wide availability of assorted tonic water brands.
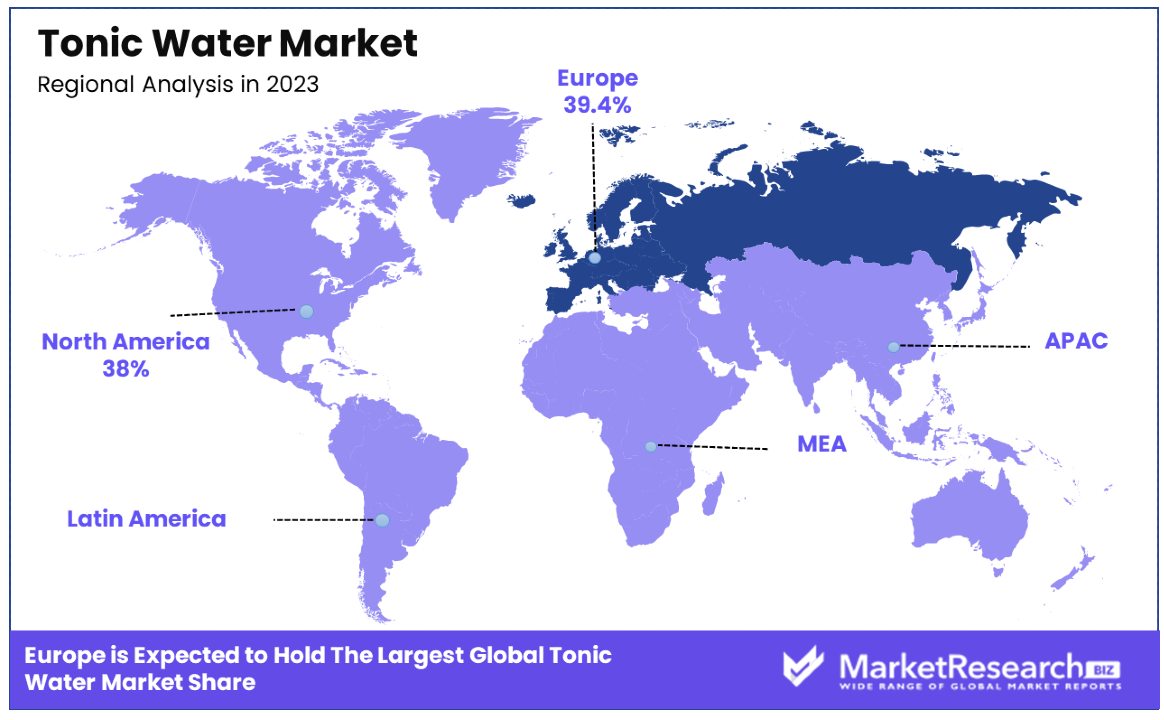
- Europe: Dominates with 39.4% market share, driven by a strong tradition of tonic water consumption and high demand for premium and flavored varieties.
- North America: Holds a market share of 27.8%, supported by a growing interest in cocktails and mixed beverages, particularly in urban areas.
- Analyst Viewpoint: Analysts view the Tonic Water Market as a dynamic and expanding sector, fueled by trends in health consciousness, premiumization, and the rising popularity of mixed beverages. The market’s growth is expected to be sustained by continuous product innovation and expanding distribution networks.
Driving Factors
Increasing Demand for Premium Mixers Drives Market Growth
The tonic water market is significantly buoyed by the increasing consumer inclination towards premium mixers. This trend is largely driven by a rising appreciation for artisanal and high-quality cocktail experiences, particularly among consumers who frequent upscale bars and restaurants. Brands like Fever-Tree and Q Tonic have successfully capitalized on this trend by offering tonic waters that feature unique botanical flavors and reduced sugar content, catering to health-conscious and flavor-seeking consumers.
The premiumization of mixers has not only expanded the consumer base but also allowed manufacturers to command higher price points, boosting market profitability. Additionally, the premium mixer trend intersects with the health and wellness movement, as consumers prefer products with natural ingredients and fewer additives. This convergence amplifies the market’s growth, as more consumers are drawn to products that satisfy both their taste and health preferences.
Rising Popularity of Craft Cocktail Culture Fuels Market Expansion
The burgeoning craft cocktail culture has had a profound impact on the tonic water market. As consumers become more adventurous and educated about various cocktails, their demand for high-quality mixers like tonic water intensifies.
This cultural shift has encouraged bartenders and mixologists to explore more diverse and sophisticated cocktail recipes, which often include premium tonic water as a key ingredient. The demand for mixers that can enhance and complement the complex flavors of craft spirits is driving innovation and variety in the tonic water market. This cultural trend promotes an ecosystem where premium products thrive, further propelling the market's growth.
Growth of the Ready-to-Drink (RTD) Beverage Segment Accelerates Market Dynamics
The RTD beverage segment's expansion significantly impacts the tonic water market. The convenience, portability, and consistent quality of RTD cocktails cater to the busy lifestyles of modern consumers, leading to increased popularity and consumption. Major beverage brands like Gordons and Tanqueray have tapped into this trend by launching canned or bottled gin and tonic products, which has spurred further growth in the tonic water sector.
This segment’s growth is also indicative of broader consumer trends towards convenience and quality, pushing tonic water brands to innovate in packaging and product offerings. The RTD trend complements the increase in home consumption of cocktails, particularly in contexts where consumers seek bar-quality beverages without the complexity of crafting a drink from scratch.
Restraining Factors
Competition from Alternative Mixers Restrains Market Growth
The tonic water market faces considerable challenges from the rising popularity of alternative mixers such as club soda, ginger beer, and flavored seltzers. These alternatives provide diverse flavor profiles and health-centric options that cater to a broad consumer base, potentially diverting demand away from traditional tonic water.
As consumers explore different taste experiences and beverage innovations, tonic water's share in the mixer segment may be diluted. This competition not only splits consumer preference but also intensifies market rivalry, requiring tonic water brands to continually innovate and differentiate their offerings to maintain consumer interest and market share.
Health Concerns Related to Sugar Content Limit Market Expansion
Health concerns surrounding the sugar content in tonic water significantly restrict its market growth. Despite the availability of low-calorie and sugar-free variants, the perception of tonic water as a high-sugar mixer persists, deterring health-conscious consumers. This demographic is increasingly opting for beverages that offer minimal or no added sugars, aligning with broader trends towards healthier lifestyle choices.
The cautiousness about sugar intake affects consumer purchasing decisions, particularly among those actively managing their dietary sugar consumption, and thus, poses a barrier to the growth of the traditional tonic water segment. This health-driven restraint highlights the need for market players to enhance their product formulations to appeal to health-conscious consumers without compromising on taste.
Type Analysis
Regular Tonic Water dominates with 62.4% due to its traditional appeal and widespread availability.
The Tonic Water Market can be segmented by type, with Regular Tonic Water leading the market, holding a substantial 62.4% share. This dominance is largely attributed to its traditional use in cocktails and long-standing presence in the beverage industry, making it a familiar choice for consumers. Regular tonic water is favored for its classic flavor, which pairs well with a variety of spirits, especially gin, thereby supporting its strong position in bars and restaurants as well as in home consumption.
The Diet/Low-Calorie Tonic Water segment, although smaller, shows a promising growth trajectory with a compound annual growth rate (CAGR) of 6.7%. This growth is driven by increasing health consciousness among consumers, particularly those looking to reduce sugar intake without sacrificing their consumption of mixed beverages.
Flavored Tonic Water is another significant sub-segment, gaining traction due to consumer demand for varied and unique taste profiles. This segment broadens the market’s appeal by offering choices beyond the traditional taste, thereby attracting a younger demographic and those interested in experimenting with new and exotic flavors.
Organic Tonic Water and other niche types, such as tonic syrups or tonic water with added vitamins, represent emerging trends that cater to specific consumer preferences for organic and health-oriented products. These segments, while currently smaller, contribute to the market’s overall diversity and growth potential by appealing to environmentally conscious and health-focused consumers.
Packaging Type Analysis
Glass Bottles dominate the market, offering premium appeal and better flavor preservation.
In terms of packaging, Glass Bottles are the preferred choice in the Tonic Water Market. This preference can be attributed to the perception of glass as a premium packaging material that preserves flavor better than other materials. Glass bottles are also more environmentally friendly, which appeals to the growing segment of consumers concerned with sustainable packaging solutions.
Cans are another popular packaging option, especially in the ready-to-drink (RTD) market segment. They offer convenience, portability, and an increasing appeal among younger consumers who prioritize ease of use and recyclability. The innovation in can design and functionality continues to propel this segment's growth, aligning with the lifestyle of consumers who enjoy outdoor activities and social gatherings.
Plastic Bottles hold a significant share as well, favored for their durability and lower cost. However, the shift towards more sustainable options may impact the growth potential of this segment unless innovations in biodegradable and recyclable plastics are implemented.
Other packaging types, such as tetra packs or bulk dispensers, are niche but growing, driven by specific use cases in food service and institutional settings where large volume and cost-efficiency are prioritized.
Distribution Channel Analysis
Supermarkets/Hypermarkets lead with 53% due to their wide availability of assorted tonic water brands.
Distribution channels play a critical role in the accessibility and sales of tonic water. Supermarkets and Hypermarkets dominate this segment, accounting for 53% of sales. Their broad geographic footprint and ability to stock a wide range of brands and product types—from premium to budget options—make them crucial to the tonic water market. The one-stop shopping experience offered by these retailers appeals to a large consumer base looking to combine their grocery shopping with the purchase of alcoholic and non-alcoholic beverages.
Convenience Stores are also important, offering quick and easy access to tonic water for impromptu gatherings or immediate consumption needs. Their strategic locations and extended operating hours cater to consumers seeking convenience.
Specialty Stores, which include liquor and gourmet shops, provide a curated selection of high-end tonic waters and cater to a more discerning clientele. These stores often offer exotic or imported brands that are not available in mainstream outlets, thus serving a niche market segment.
Online Retail has seen significant growth, especially influenced by the shift in consumer buying behaviors post-pandemic. The ability to shop a wide array of tonic water brands from home and have them delivered is a significant convenience, especially for consumers who value a broad selection and competitive pricing.
The "Others" category includes direct sales from manufacturers and bulk purchases by hospitality businesses, which, although smaller in scale, are vital for targeting specific market segments directly without intermediary mark-ups.
Key Market Segments
By Type
- Regular Tonic Water
- Diet/Low-Calorie Tonic Water
- Flavored Tonic Water
- Organic Tonic Water
- Others
By Packaging Type
- Glass Bottles
- Cans
- Plastic Bottles
- Others
By Distribution Channel
- Supermarkets/Hypermarkets
- Convenience Stores
- Specialty Stores
- Online Retail
- Others
Growth Opportunities
Premiumization and Flavor Innovation Offers Growth Opportunity
The drive towards premiumization and flavor innovation opens vast opportunities within the Tonic Water Market. Consumers increasingly crave unique and sophisticated beverage options, which can be met by introducing premium tonic waters that incorporate exotic botanicals, fruits, and aromatic spices.
Brands like Fever-Tree have set a benchmark with offerings such as Elderflower Tonic Water and Mediterranean Tonic Water, successfully tapping into the consumer desire for distinct and elevated flavor profiles. This trend not only attracts a more discerning clientele but also allows manufacturers to command higher prices for these artisanal products. By continuously innovating and expanding their flavor portfolios, tonic water brands can enhance their market appeal and stimulate further growth.
Expansion into New Geographical Markets Offers Growth Opportunity
The potential for geographic expansion represents a significant growth opportunity for the Tonic Water Market. While tonic water enjoys popularity in Western markets, emerging regions such as Asia-Pacific are ripe for exploration. Increasing disposable incomes, coupled with a growing interest in Western-style cocktails, make countries like China and India ideal targets for market penetration.
Promoting tonic water-based cocktails and leveraging local trends in these regions can facilitate market entry and expansion. As cocktail culture continues to evolve globally, strategically entering underpenetrated markets with targeted marketing and distribution strategies can substantially increase the global footprint and profitability of tonic water brands.
Trending Factors
Sustainability and Eco-Friendly Packaging Are Trending Factors
The focus on sustainability and eco-friendly packaging is becoming a pivotal trend within the Tonic Water Market. As consumers grow more environmentally aware, they are increasingly favoring brands that demonstrate a commitment to ecological responsibility. Tonic water brands that incorporate recycled or biodegradable materials in their packaging not only meet this consumer demand but also enhance their brand image and market competitiveness.
This trend is reinforced by broader societal shifts towards sustainability, driving brands to innovate in their packaging solutions to minimize environmental impact. By aligning with these eco-friendly practices, tonic water brands can attract a segment of consumers who make purchasing decisions based on environmental considerations, thereby securing a loyal customer base committed to ecological values.
Clean and Natural Ingredients Are Trending Factors
The increasing consumer demand for transparency and clean labels has made the use of clean and natural ingredients a significant trend in the Tonic Water Market. Brands that prominently use natural ingredients like quinine, citrus, and various botanicals are gaining traction among health-conscious consumers. These consumers seek products that are not only enjoyable but also offer health benefits or at least assurance of minimal processing and no artificial additives.
The trend towards natural and clean ingredients is not just a passing fad but a reflection of a deeper, more enduring shift towards healthier and more sustainable consumption. Tonic water brands that highlight and prioritize these qualities can differentiate themselves in a crowded market, appealing to a broad audience that values authenticity and purity in their food and beverage choices.
Regional Analysis
Europe Dominates with 39.4% Market Share
Europe holds a significant 39.4% share of the Tonic Water Market, attributed to a robust cocktail culture and a high preference for premium beverages. Factors driving this dominance include the established presence of key tonic water brands, a deep-rooted tradition of mixed drinks especially gin and tonics, and consumer willingness to experiment with new flavors and premium products. The region's strong regulatory framework supporting quality and sustainability also plays a crucial role in fostering trust and quality in European tonic water products.
Europe's market dynamics are shaped by a mature beverage industry and a consumer base that values tradition as well as innovation. The proliferation of craft bars and upscale restaurants fuels the demand for high-quality tonic water. Moreover, the growing trend towards health-consciousness has led to increased demand for low-calorie and natural ingredient tonic water options in the region.
Regional Market Shares:
North America: With a market share of 27.8%, North America’s market is driven by a strong cocktail culture in the U.S. and Canada, coupled with high consumer spending power and an increasing trend towards premiumization in beverages.
Asia Pacific: Asia Pacific is rapidly growing with a CAGR of 5.6%, influenced by rising disposable incomes and the westernization of dietary habits, particularly in China and India, where consumers are increasingly adopting Western-style cocktails.
Middle East & Africa: This region holds a smaller market share at 4.3%, but is expected to grow due to increasing urbanization and a young population adapting to global consumption trends.
Latin America: Accounting for 8.5% of the market, Latin America is seeing growth driven by an increase in local production and the rising popularity of cocktail culture, particularly in countries like Brazil and Mexico.
Key Regions and Countries
- North America
- The US
- Canada
- Mexico
- Western Europe
- Germany
- France
- The UK
- Spain
- Italy
- Portugal
- Ireland
- Austria
- Switzerland
- Benelux
- Nordic
- Rest of Western Europe
- Eastern Europe
- Russia
- Poland
- The Czech Republic
- Greece
- Rest of Eastern Europe
- APAC
- China
- Japan
- South Korea
- India
- Australia & New Zealand
- Indonesia
- Malaysia
- Philippines
- Singapore
- Thailand
- Vietnam
- Rest of APAC
- Latin America
- Brazil
- Colombia
- Chile
- Argentina
- Costa Rica
- Rest of Latin America
- Middle East & Africa
- Algeria
- Egypt
- Israel
- Kuwait
- Nigeria
- Saudi Arabia
- South Africa
- Turkey
- United Arab Emirates
- Rest of MEA
Key Players Analysis
The Tonic Water Market features a mix of major players, each with unique strengths and market strategies.
Coca-Cola Company and Keurig Dr Pepper Inc. dominate with their strong brand recognition and vast distribution networks. They leverage their established presence to reach a wide audience, ensuring significant market influence.
Fevertree Drinks Plc and Fentimans Ltd. focus on premium, high-quality products. Their strategy centers on offering artisanal and natural ingredients, appealing to health-conscious consumers and those seeking luxury beverages.
East Imperial Beverage Corporation and London Essence Company also target the premium segment but with a stronger emphasis on sophisticated flavors and mixology. They are popular in upscale bars and restaurants, reinforcing their market position through exclusive partnerships.
Asahi Group Holdings Ltd. and Monster Beverage Corporation use their extensive product portfolios to diversify offerings in the tonic water market. Their strategy includes innovative flavors and marketing campaigns aimed at younger consumers.
Franklin & Sons Ltd. and Thomas Henry Gmbh & Co. focus on blending traditional recipes with modern twists, appealing to a wide range of consumers. Their balanced approach allows them to maintain a steady market presence.
Overall, these companies shape the tonic water market through a mix of brand power, product quality, innovation, and strategic market positioning. Their combined efforts drive market growth and set trends in the beverage industry.
Market Key Players
- Coca-Cola Company
- Fevertree Drinks Plc
- East Imperial Beverage Corporation
- Fentimans Ltd.
- London Essence Company
- Keurig Dr Pepper Inc.
- Asahi Group Holdings Ltd.
- Franklin & Sons Ltd.
- Thomas Henry Gmbh &
- Monster Beverage Corporation
- Bradley's Tonic Co.
- JACK RUDY COCKTAIL CO
- Seagram Company Ltd.
- Fever-Tree Drinks PLC
Recent Developments
- It was reported that pink tonic water, known as Aromatic Tonic Water, had been introduced by Fever Tree. This unique twist on the classic mixer includes angostura bark, cardamom, pimento berry, and ginger, offering a blend of gentle spices and fresh citrus flavors
- In a collaboration with SVAMI, the Singapore Tourism Board aimed to enhance the visitor experience by offering a range of premium mixers, including tonic waters, to elevate the cocktail scene in Singapore. This partnership sought to provide tourists with a unique and memorable culinary experience during their visit
- Double Dutch unveiled its Elderflower Tonic Water, adding a floral and fragrant touch to the tonic water market. This new product aimed to cater to consumers looking for innovative and sophisticated beverage options, combining the classic tonic water with the delicate essence of elderflower for a refreshing twist.
Report Scope
Report Features Description Market Value (2023) USD 1.4 Billion Forecast Revenue (2033) USD 2.7 Billion CAGR (2024-2033) 7.1% Base Year for Estimation 2023 Historic Period 2018-2023 Forecast Period 2024-2033 Report Coverage Revenue Forecast, Market Dynamics, Competitive Landscape, Recent Developments Segments Covered By Type (Regular Tonic Water, Diet/Low-Calorie Tonic Water, Flavored Tonic Water, Organic Tonic Water, Others), By Packaging Type (Glass Bottles, Cans, Plastic Bottles, Others), By Distribution Channel (Supermarkets/Hypermarkets, Convenience Stores, Specialty Stores, Online Retail, Others) Regional Analysis North America - The US, Canada, & Mexico; Western Europe - Germany, France, The UK, Spain, Italy, Portugal, Ireland, Austria, Switzerland, Benelux, Nordic, & Rest of Western Europe; Eastern Europe - Russia, Poland, The Czech Republic, Greece, & Rest of Eastern Europe; APAC - China, Japan, South Korea, India, Australia & New Zealand, Indonesia, Malaysia, Philippines, Singapore, Thailand, Vietnam, & Rest of APAC; Latin America - Brazil, Colombia, Chile, Argentina, Costa Rica, & Rest of Latin America; Middle East & Africa - Algeria, Egypt, Israel, Kuwait, Nigeria, Saudi Arabia, South Africa, Turkey, United Arab Emirates, & Rest of MEA Competitive Landscape Coca-Cola Company, Fevertree Drinks Plc, East Imperial Beverage Corporation, Fentimans Ltd., London Essence Company, Keurig Dr Pepper Inc., Asahi Group Holdings Ltd., Franklin & Sons Ltd., Thomas Henry Gmbh &, Monster Beverage Corporation, Bradley's Tonic Co., JACK RUDY COCKTAIL CO, Seagram Company Ltd., Fever-Tree Drinks PLC Customization Scope Customization for segments, region/country-level will be provided. Moreover, additional customization can be done based on the requirements. Purchase Options We have three licenses to opt for: Single User License, Multi-User License (Up to 5 Users), Corporate Use License (Unlimited User and Printable PDF) -
- 1. Executive Summary
- 1.1. Definition
- 1.2. Taxonomy
- 1.3. Research Scope
- 1.4. Key Analysis
- 1.5. Key Findings by Major Segments
- 1.6. Top strategies by Major Players
- 2. Global Tonic Water Market Overview
- 2.1. Tonic Water Market Dynamics
- 2.1.1. Drivers
- 2.1.2. Opportunities
- 2.1.3. Restraints
- 2.1.4. Challenges
- 2.2. Macro-economic Factors
- 2.3. Regulatory Framework
- 2.4. Market Investment Feasibility Index
- 2.5. PEST Analysis
- 2.6. PORTER’S Five Force Analysis
- 2.7. Drivers & Restraints Impact Analysis
- 2.8. Industry Chain Analysis
- 2.9. Cost Structure Analysis
- 2.10. Marketing Strategy
- 2.11. Russia-Ukraine War Impact Analysis
- 2.12. Opportunity Map Analysis
- 2.13. Market Competition Scenario Analysis
- 2.14. Product Life Cycle Analysis
- 2.15. Opportunity Orbits
- 2.16. Manufacturer Intensity Map
- 2.17. Major Companies sales by Value & Volume
- 2.1. Tonic Water Market Dynamics
- 3. Global Tonic Water Market Analysis, Opportunity and Forecast, 2016-2032
- 3.1. Global Tonic Water Market Analysis, 2016-2021
- 3.2. Global Tonic Water Market Opportunity and Forecast, 2023-2032
- 3.3. Global Tonic Water Market Analysis, Opportunity and Forecast, By Type, 2016-2032
- 3.3.1. Global Tonic Water Market Analysis by Type: Introduction
- 3.3.2. Market Size Absolute $ Opportunity Analysis and Forecast, By Type, 2016-2032
- 3.3.3. Regular Tonic Water
- 3.3.4. Diet/Low-Calorie Tonic Water
- 3.3.5. Flavored Tonic Water
- 3.3.6. Organic Tonic Water
- 3.3.7. Others
- 3.4. Global Tonic Water Market Analysis, Opportunity and Forecast, By Packaging Type, 2016-2032
- 3.4.1. Global Tonic Water Market Analysis by Packaging Type: Introduction
- 3.4.2. Market Size Absolute $ Opportunity Analysis and Forecast, By Packaging Type, 2016-2032
- 3.4.3. Glass Bottles
- 3.4.4. Cans
- 3.4.5. Plastic Bottles
- 3.4.6. Others
- 3.5. Global Tonic Water Market Analysis, Opportunity and Forecast, By Distribution Channel, 2016-2032
- 3.5.1. Global Tonic Water Market Analysis by Distribution Channel: Introduction
- 3.5.2. Market Size Absolute $ Opportunity Analysis and Forecast, By Distribution Channel, 2016-2032
- 3.5.3. Supermarkets/Hypermarkets
- 3.5.4. Convenience Stores
- 3.5.5. Specialty Stores
- 3.5.6. Online Retail
- 3.5.7. Others
- 4. North America Tonic Water Market Analysis, Opportunity and Forecast, 2016-2032
- 4.1. North America Tonic Water Market Analysis, 2016-2021
- 4.2. North America Tonic Water Market Opportunity and Forecast, 2023-2032
- 4.3. North America Tonic Water Market Analysis, Opportunity and Forecast, By Type, 2016-2032
- 4.3.1. North America Tonic Water Market Analysis by Type: Introduction
- 4.3.2. Market Size Absolute $ Opportunity Analysis and Forecast, By Type, 2016-2032
- 4.3.3. Regular Tonic Water
- 4.3.4. Diet/Low-Calorie Tonic Water
- 4.3.5. Flavored Tonic Water
- 4.3.6. Organic Tonic Water
- 4.3.7. Others
- 4.4. North America Tonic Water Market Analysis, Opportunity and Forecast, By Packaging Type, 2016-2032
- 4.4.1. North America Tonic Water Market Analysis by Packaging Type: Introduction
- 4.4.2. Market Size Absolute $ Opportunity Analysis and Forecast, By Packaging Type, 2016-2032
- 4.4.3. Glass Bottles
- 4.4.4. Cans
- 4.4.5. Plastic Bottles
- 4.4.6. Others
- 4.5. North America Tonic Water Market Analysis, Opportunity and Forecast, By Distribution Channel, 2016-2032
- 4.5.1. North America Tonic Water Market Analysis by Distribution Channel: Introduction
- 4.5.2. Market Size Absolute $ Opportunity Analysis and Forecast, By Distribution Channel, 2016-2032
- 4.5.3. Supermarkets/Hypermarkets
- 4.5.4. Convenience Stores
- 4.5.5. Specialty Stores
- 4.5.6. Online Retail
- 4.5.7. Others
- 4.6. North America Tonic Water Market Analysis, Opportunity and Forecast, By Country , 2016-2032
- 4.6.1. North America Tonic Water Market Analysis by Country : Introduction
- 4.6.2. Market Size Absolute $ Opportunity Analysis and Forecast, Country , 2016-2032
- 4.6.2.1. The US
- 4.6.2.2. Canada
- 4.6.2.3. Mexico
- 5. Western Europe Tonic Water Market Analysis, Opportunity and Forecast, 2016-2032
- 5.1. Western Europe Tonic Water Market Analysis, 2016-2021
- 5.2. Western Europe Tonic Water Market Opportunity and Forecast, 2023-2032
- 5.3. Western Europe Tonic Water Market Analysis, Opportunity and Forecast, By Type, 2016-2032
- 5.3.1. Western Europe Tonic Water Market Analysis by Type: Introduction
- 5.3.2. Market Size Absolute $ Opportunity Analysis and Forecast, By Type, 2016-2032
- 5.3.3. Regular Tonic Water
- 5.3.4. Diet/Low-Calorie Tonic Water
- 5.3.5. Flavored Tonic Water
- 5.3.6. Organic Tonic Water
- 5.3.7. Others
- 5.4. Western Europe Tonic Water Market Analysis, Opportunity and Forecast, By Packaging Type, 2016-2032
- 5.4.1. Western Europe Tonic Water Market Analysis by Packaging Type: Introduction
- 5.4.2. Market Size Absolute $ Opportunity Analysis and Forecast, By Packaging Type, 2016-2032
- 5.4.3. Glass Bottles
- 5.4.4. Cans
- 5.4.5. Plastic Bottles
- 5.4.6. Others
- 5.5. Western Europe Tonic Water Market Analysis, Opportunity and Forecast, By Distribution Channel, 2016-2032
- 5.5.1. Western Europe Tonic Water Market Analysis by Distribution Channel: Introduction
- 5.5.2. Market Size Absolute $ Opportunity Analysis and Forecast, By Distribution Channel, 2016-2032
- 5.5.3. Supermarkets/Hypermarkets
- 5.5.4. Convenience Stores
- 5.5.5. Specialty Stores
- 5.5.6. Online Retail
- 5.5.7. Others
- 5.6. Western Europe Tonic Water Market Analysis, Opportunity and Forecast, By Country , 2016-2032
- 5.6.1. Western Europe Tonic Water Market Analysis by Country : Introduction
- 5.6.2. Market Size Absolute $ Opportunity Analysis and Forecast, Country , 2016-2032
- 5.6.2.1. Germany
- 5.6.2.2. France
- 5.6.2.3. The UK
- 5.6.2.4. Spain
- 5.6.2.5. Italy
- 5.6.2.6. Portugal
- 5.6.2.7. Ireland
- 5.6.2.8. Austria
- 5.6.2.9. Switzerland
- 5.6.2.10. Benelux
- 5.6.2.11. Nordic
- 5.6.2.12. Rest of Western Europe
- 6. Eastern Europe Tonic Water Market Analysis, Opportunity and Forecast, 2016-2032
- 6.1. Eastern Europe Tonic Water Market Analysis, 2016-2021
- 6.2. Eastern Europe Tonic Water Market Opportunity and Forecast, 2023-2032
- 6.3. Eastern Europe Tonic Water Market Analysis, Opportunity and Forecast, By Type, 2016-2032
- 6.3.1. Eastern Europe Tonic Water Market Analysis by Type: Introduction
- 6.3.2. Market Size Absolute $ Opportunity Analysis and Forecast, By Type, 2016-2032
- 6.3.3. Regular Tonic Water
- 6.3.4. Diet/Low-Calorie Tonic Water
- 6.3.5. Flavored Tonic Water
- 6.3.6. Organic Tonic Water
- 6.3.7. Others
- 6.4. Eastern Europe Tonic Water Market Analysis, Opportunity and Forecast, By Packaging Type, 2016-2032
- 6.4.1. Eastern Europe Tonic Water Market Analysis by Packaging Type: Introduction
- 6.4.2. Market Size Absolute $ Opportunity Analysis and Forecast, By Packaging Type, 2016-2032
- 6.4.3. Glass Bottles
- 6.4.4. Cans
- 6.4.5. Plastic Bottles
- 6.4.6. Others
- 6.5. Eastern Europe Tonic Water Market Analysis, Opportunity and Forecast, By Distribution Channel, 2016-2032
- 6.5.1. Eastern Europe Tonic Water Market Analysis by Distribution Channel: Introduction
- 6.5.2. Market Size Absolute $ Opportunity Analysis and Forecast, By Distribution Channel, 2016-2032
- 6.5.3. Supermarkets/Hypermarkets
- 6.5.4. Convenience Stores
- 6.5.5. Specialty Stores
- 6.5.6. Online Retail
- 6.5.7. Others
- 6.6. Eastern Europe Tonic Water Market Analysis, Opportunity and Forecast, By Country , 2016-2032
- 6.6.1. Eastern Europe Tonic Water Market Analysis by Country : Introduction
- 6.6.2. Market Size Absolute $ Opportunity Analysis and Forecast, Country , 2016-2032
- 6.6.2.1. Russia
- 6.6.2.2. Poland
- 6.6.2.3. The Czech Republic
- 6.6.2.4. Greece
- 6.6.2.5. Rest of Eastern Europe
- 7. APAC Tonic Water Market Analysis, Opportunity and Forecast, 2016-2032
- 7.1. APAC Tonic Water Market Analysis, 2016-2021
- 7.2. APAC Tonic Water Market Opportunity and Forecast, 2023-2032
- 7.3. APAC Tonic Water Market Analysis, Opportunity and Forecast, By Type, 2016-2032
- 7.3.1. APAC Tonic Water Market Analysis by Type: Introduction
- 7.3.2. Market Size Absolute $ Opportunity Analysis and Forecast, By Type, 2016-2032
- 7.3.3. Regular Tonic Water
- 7.3.4. Diet/Low-Calorie Tonic Water
- 7.3.5. Flavored Tonic Water
- 7.3.6. Organic Tonic Water
- 7.3.7. Others
- 7.4. APAC Tonic Water Market Analysis, Opportunity and Forecast, By Packaging Type, 2016-2032
- 7.4.1. APAC Tonic Water Market Analysis by Packaging Type: Introduction
- 7.4.2. Market Size Absolute $ Opportunity Analysis and Forecast, By Packaging Type, 2016-2032
- 7.4.3. Glass Bottles
- 7.4.4. Cans
- 7.4.5. Plastic Bottles
- 7.4.6. Others
- 7.5. APAC Tonic Water Market Analysis, Opportunity and Forecast, By Distribution Channel, 2016-2032
- 7.5.1. APAC Tonic Water Market Analysis by Distribution Channel: Introduction
- 7.5.2. Market Size Absolute $ Opportunity Analysis and Forecast, By Distribution Channel, 2016-2032
- 7.5.3. Supermarkets/Hypermarkets
- 7.5.4. Convenience Stores
- 7.5.5. Specialty Stores
- 7.5.6. Online Retail
- 7.5.7. Others
- 7.6. APAC Tonic Water Market Analysis, Opportunity and Forecast, By Country , 2016-2032
- 7.6.1. APAC Tonic Water Market Analysis by Country : Introduction
- 7.6.2. Market Size Absolute $ Opportunity Analysis and Forecast, Country , 2016-2032
- 7.6.2.1. China
- 7.6.2.2. Japan
- 7.6.2.3. South Korea
- 7.6.2.4. India
- 7.6.2.5. Australia & New Zeland
- 7.6.2.6. Indonesia
- 7.6.2.7. Malaysia
- 7.6.2.8. Philippines
- 7.6.2.9. Singapore
- 7.6.2.10. Thailand
- 7.6.2.11. Vietnam
- 7.6.2.12. Rest of APAC
- 8. Latin America Tonic Water Market Analysis, Opportunity and Forecast, 2016-2032
- 8.1. Latin America Tonic Water Market Analysis, 2016-2021
- 8.2. Latin America Tonic Water Market Opportunity and Forecast, 2023-2032
- 8.3. Latin America Tonic Water Market Analysis, Opportunity and Forecast, By Type, 2016-2032
- 8.3.1. Latin America Tonic Water Market Analysis by Type: Introduction
- 8.3.2. Market Size Absolute $ Opportunity Analysis and Forecast, By Type, 2016-2032
- 8.3.3. Regular Tonic Water
- 8.3.4. Diet/Low-Calorie Tonic Water
- 8.3.5. Flavored Tonic Water
- 8.3.6. Organic Tonic Water
- 8.3.7. Others
- 8.4. Latin America Tonic Water Market Analysis, Opportunity and Forecast, By Packaging Type, 2016-2032
- 8.4.1. Latin America Tonic Water Market Analysis by Packaging Type: Introduction
- 8.4.2. Market Size Absolute $ Opportunity Analysis and Forecast, By Packaging Type, 2016-2032
- 8.4.3. Glass Bottles
- 8.4.4. Cans
- 8.4.5. Plastic Bottles
- 8.4.6. Others
- 8.5. Latin America Tonic Water Market Analysis, Opportunity and Forecast, By Distribution Channel, 2016-2032
- 8.5.1. Latin America Tonic Water Market Analysis by Distribution Channel: Introduction
- 8.5.2. Market Size Absolute $ Opportunity Analysis and Forecast, By Distribution Channel, 2016-2032
- 8.5.3. Supermarkets/Hypermarkets
- 8.5.4. Convenience Stores
- 8.5.5. Specialty Stores
- 8.5.6. Online Retail
- 8.5.7. Others
- 8.6. Latin America Tonic Water Market Analysis, Opportunity and Forecast, By Country , 2016-2032
- 8.6.1. Latin America Tonic Water Market Analysis by Country : Introduction
- 8.6.2. Market Size Absolute $ Opportunity Analysis and Forecast, Country , 2016-2032
- 8.6.2.1. Brazil
- 8.6.2.2. Colombia
- 8.6.2.3. Chile
- 8.6.2.4. Argentina
- 8.6.2.5. Costa Rica
- 8.6.2.6. Rest of Latin America
- 9. Middle East & Africa Tonic Water Market Analysis, Opportunity and Forecast, 2016-2032
- 9.1. Middle East & Africa Tonic Water Market Analysis, 2016-2021
- 9.2. Middle East & Africa Tonic Water Market Opportunity and Forecast, 2023-2032
- 9.3. Middle East & Africa Tonic Water Market Analysis, Opportunity and Forecast, By Type, 2016-2032
- 9.3.1. Middle East & Africa Tonic Water Market Analysis by Type: Introduction
- 9.3.2. Market Size Absolute $ Opportunity Analysis and Forecast, By Type, 2016-2032
- 9.3.3. Regular Tonic Water
- 9.3.4. Diet/Low-Calorie Tonic Water
- 9.3.5. Flavored Tonic Water
- 9.3.6. Organic Tonic Water
- 9.3.7. Others
- 9.4. Middle East & Africa Tonic Water Market Analysis, Opportunity and Forecast, By Packaging Type, 2016-2032
- 9.4.1. Middle East & Africa Tonic Water Market Analysis by Packaging Type: Introduction
- 9.4.2. Market Size Absolute $ Opportunity Analysis and Forecast, By Packaging Type, 2016-2032
- 9.4.3. Glass Bottles
- 9.4.4. Cans
- 9.4.5. Plastic Bottles
- 9.4.6. Others
- 9.5. Middle East & Africa Tonic Water Market Analysis, Opportunity and Forecast, By Distribution Channel, 2016-2032
- 9.5.1. Middle East & Africa Tonic Water Market Analysis by Distribution Channel: Introduction
- 9.5.2. Market Size Absolute $ Opportunity Analysis and Forecast, By Distribution Channel, 2016-2032
- 9.5.3. Supermarkets/Hypermarkets
- 9.5.4. Convenience Stores
- 9.5.5. Specialty Stores
- 9.5.6. Online Retail
- 9.5.7. Others
- 9.6. Middle East & Africa Tonic Water Market Analysis, Opportunity and Forecast, By Country , 2016-2032
- 9.6.1. Middle East & Africa Tonic Water Market Analysis by Country : Introduction
- 9.6.2. Market Size Absolute $ Opportunity Analysis and Forecast, Country , 2016-2032
- 9.6.2.1. Algeria
- 9.6.2.2. Egypt
- 9.6.2.3. Israel
- 9.6.2.4. Kuwait
- 9.6.2.5. Nigeria
- 9.6.2.6. Saudi Arabia
- 9.6.2.7. South Africa
- 9.6.2.8. Turkey
- 9.6.2.9. The UAE
- 9.6.2.10. Rest of MEA
- 10. Global Tonic Water Market Analysis, Opportunity and Forecast, By Region , 2016-2032
- 10.1. Global Tonic Water Market Analysis by Region : Introduction
- 10.2. Market Size Absolute $ Opportunity Analysis and Forecast, By Region , 2016-2032
- 10.2.1. North America
- 10.2.2. Western Europe
- 10.2.3. Eastern Europe
- 10.2.4. APAC
- 10.2.5. Latin America
- 10.2.6. Middle East & Africa
- 11. Global Tonic Water Market Competitive Landscape, Market Share Analysis, and Company Profiles
- 11.1. Market Share Analysis
- 11.2. Company Profiles
- 11.3. Coca-Cola Company
- 11.3.1. Company Overview
- 11.3.2. Financial Highlights
- 11.3.3. Product Portfolio
- 11.3.4. SWOT Analysis
- 11.3.5. Key Strategies and Developments
- 11.4. Fevertree Drinks Plc
- 11.4.1. Company Overview
- 11.4.2. Financial Highlights
- 11.4.3. Product Portfolio
- 11.4.4. SWOT Analysis
- 11.4.5. Key Strategies and Developments
- 11.5. East Imperial Beverage Corporation
- 11.5.1. Company Overview
- 11.5.2. Financial Highlights
- 11.5.3. Product Portfolio
- 11.5.4. SWOT Analysis
- 11.5.5. Key Strategies and Developments
- 11.6. Fentimans Ltd.
- 11.6.1. Company Overview
- 11.6.2. Financial Highlights
- 11.6.3. Product Portfolio
- 11.6.4. SWOT Analysis
- 11.6.5. Key Strategies and Developments
- 11.7. London Essence Company
- 11.7.1. Company Overview
- 11.7.2. Financial Highlights
- 11.7.3. Product Portfolio
- 11.7.4. SWOT Analysis
- 11.7.5. Key Strategies and Developments
- 11.8. Keurig Dr Pepper Inc.
- 11.8.1. Company Overview
- 11.8.2. Financial Highlights
- 11.8.3. Product Portfolio
- 11.8.4. SWOT Analysis
- 11.8.5. Key Strategies and Developments
- 11.9. Asahi Group Holdings Ltd.
- 11.9.1. Company Overview
- 11.9.2. Financial Highlights
- 11.9.3. Product Portfolio
- 11.9.4. SWOT Analysis
- 11.9.5. Key Strategies and Developments
- 11.10. Franklin & Sons Ltd.
- 11.10.1. Company Overview
- 11.10.2. Financial Highlights
- 11.10.3. Product Portfolio
- 11.10.4. SWOT Analysis
- 11.10.5. Key Strategies and Developments
- 11.11. Thomas Henry Gmbh &
- 11.11.1. Company Overview
- 11.11.2. Financial Highlights
- 11.11.3. Product Portfolio
- 11.11.4. SWOT Analysis
- 11.11.5. Key Strategies and Developments
- 11.12. Monster Beverage Corporation
- 11.12.1. Company Overview
- 11.12.2. Financial Highlights
- 11.12.3. Product Portfolio
- 11.12.4. SWOT Analysis
- 11.12.5. Key Strategies and Developments
- 11.13.1. Company Overview
- 11.13.2. Financial Highlights
- 11.13.3. Product Portfolio
- 11.13.4. SWOT Analysis
- 11.13.5. Key Strategies and Developments
- 11.14. Bradley's Tonic Co.
- 11.14.1. Company Overview
- 11.14.2. Financial Highlights
- 11.14.3. Product Portfolio
- 11.14.4. SWOT Analysis
- 11.14.5. Key Strategies and Developments
- 11.15. Seagram Company Ltd.
- 11.15.1. Company Overview
- 11.15.2. Financial Highlights
- 11.15.3. Product Portfolio
- 11.15.4. SWOT Analysis
- 11.15.5. Key Strategies and Developments
- 11.16. Fever-Tree Drinks PLC
- 11.16.1. Company Overview
- 11.16.2. Financial Highlights
- 11.16.3. Product Portfolio
- 11.16.4. SWOT Analysis
- 11.16.5. Key Strategies and Developments
- 12. Assumptions and Acronyms
- 13. Research Methodology
- 14. Contact
- List of Figures
- Figure 1: Global Tonic Water Market Revenue (US$ Mn) Market Share by Type in 2022
- Figure 2: Global Tonic Water Market Attractiveness Analysis by Type, 2016-2032
- Figure 3: Global Tonic Water Market Revenue (US$ Mn) Market Share by Packaging Typein 2022
- Figure 4: Global Tonic Water Market Attractiveness Analysis by Packaging Type, 2016-2032
- Figure 5: Global Tonic Water Market Revenue (US$ Mn) Market Share by Distribution Channelin 2022
- Figure 6: Global Tonic Water Market Attractiveness Analysis by Distribution Channel, 2016-2032
- Figure 7: Global Tonic Water Market Revenue (US$ Mn) Market Share by Region in 2022
- Figure 8: Global Tonic Water Market Attractiveness Analysis by Region, 2016-2032
- Figure 9: Global Tonic Water Market Revenue (US$ Mn) (2016-2032)
- Figure 10: Global Tonic Water Market Revenue (US$ Mn) Comparison by Region (2016-2032)
- Figure 11: Global Tonic Water Market Revenue (US$ Mn) Comparison by Type (2016-2032)
- Figure 12: Global Tonic Water Market Revenue (US$ Mn) Comparison by Packaging Type (2016-2032)
- Figure 13: Global Tonic Water Market Revenue (US$ Mn) Comparison by Distribution Channel (2016-2032)
- Figure 14: Global Tonic Water Market Y-o-Y Growth Rate Comparison by Region (2016-2032)
- Figure 15: Global Tonic Water Market Y-o-Y Growth Rate Comparison by Type (2016-2032)
- Figure 16: Global Tonic Water Market Y-o-Y Growth Rate Comparison by Packaging Type (2016-2032)
- Figure 17: Global Tonic Water Market Y-o-Y Growth Rate Comparison by Distribution Channel (2016-2032)
- Figure 18: Global Tonic Water Market Share Comparison by Region (2016-2032)
- Figure 19: Global Tonic Water Market Share Comparison by Type (2016-2032)
- Figure 20: Global Tonic Water Market Share Comparison by Packaging Type (2016-2032)
- Figure 21: Global Tonic Water Market Share Comparison by Distribution Channel (2016-2032)
- Figure 22: North America Tonic Water Market Revenue (US$ Mn) Market Share by Typein 2022
- Figure 23: North America Tonic Water Market Attractiveness Analysis by Type, 2016-2032
- Figure 24: North America Tonic Water Market Revenue (US$ Mn) Market Share by Packaging Typein 2022
- Figure 25: North America Tonic Water Market Attractiveness Analysis by Packaging Type, 2016-2032
- Figure 26: North America Tonic Water Market Revenue (US$ Mn) Market Share by Distribution Channelin 2022
- Figure 27: North America Tonic Water Market Attractiveness Analysis by Distribution Channel, 2016-2032
- Figure 28: North America Tonic Water Market Revenue (US$ Mn) Market Share by Country in 2022
- Figure 29: North America Tonic Water Market Attractiveness Analysis by Country, 2016-2032
- Figure 30: North America Tonic Water Market Revenue (US$ Mn) (2016-2032)
- Figure 31: North America Tonic Water Market Revenue (US$ Mn) Comparison by Country (2016-2032)
- Figure 32: North America Tonic Water Market Revenue (US$ Mn) Comparison by Type (2016-2032)
- Figure 33: North America Tonic Water Market Revenue (US$ Mn) Comparison by Packaging Type (2016-2032)
- Figure 34: North America Tonic Water Market Revenue (US$ Mn) Comparison by Distribution Channel (2016-2032)
- Figure 35: North America Tonic Water Market Y-o-Y Growth Rate Comparison by Country (2016-2032)
- Figure 36: North America Tonic Water Market Y-o-Y Growth Rate Comparison by Type (2016-2032)
- Figure 37: North America Tonic Water Market Y-o-Y Growth Rate Comparison by Packaging Type (2016-2032)
- Figure 38: North America Tonic Water Market Y-o-Y Growth Rate Comparison by Distribution Channel (2016-2032)
- Figure 39: North America Tonic Water Market Share Comparison by Country (2016-2032)
- Figure 40: North America Tonic Water Market Share Comparison by Type (2016-2032)
- Figure 41: North America Tonic Water Market Share Comparison by Packaging Type (2016-2032)
- Figure 42: North America Tonic Water Market Share Comparison by Distribution Channel (2016-2032)
- Figure 43: Western Europe Tonic Water Market Revenue (US$ Mn) Market Share by Typein 2022
- Figure 44: Western Europe Tonic Water Market Attractiveness Analysis by Type, 2016-2032
- Figure 45: Western Europe Tonic Water Market Revenue (US$ Mn) Market Share by Packaging Typein 2022
- Figure 46: Western Europe Tonic Water Market Attractiveness Analysis by Packaging Type, 2016-2032
- Figure 47: Western Europe Tonic Water Market Revenue (US$ Mn) Market Share by Distribution Channelin 2022
- Figure 48: Western Europe Tonic Water Market Attractiveness Analysis by Distribution Channel, 2016-2032
- Figure 49: Western Europe Tonic Water Market Revenue (US$ Mn) Market Share by Country in 2022
- Figure 50: Western Europe Tonic Water Market Attractiveness Analysis by Country, 2016-2032
- Figure 51: Western Europe Tonic Water Market Revenue (US$ Mn) (2016-2032)
- Figure 52: Western Europe Tonic Water Market Revenue (US$ Mn) Comparison by Country (2016-2032)
- Figure 53: Western Europe Tonic Water Market Revenue (US$ Mn) Comparison by Type (2016-2032)
- Figure 54: Western Europe Tonic Water Market Revenue (US$ Mn) Comparison by Packaging Type (2016-2032)
- Figure 55: Western Europe Tonic Water Market Revenue (US$ Mn) Comparison by Distribution Channel (2016-2032)
- Figure 56: Western Europe Tonic Water Market Y-o-Y Growth Rate Comparison by Country (2016-2032)
- Figure 57: Western Europe Tonic Water Market Y-o-Y Growth Rate Comparison by Type (2016-2032)
- Figure 58: Western Europe Tonic Water Market Y-o-Y Growth Rate Comparison by Packaging Type (2016-2032)
- Figure 59: Western Europe Tonic Water Market Y-o-Y Growth Rate Comparison by Distribution Channel (2016-2032)
- Figure 60: Western Europe Tonic Water Market Share Comparison by Country (2016-2032)
- Figure 61: Western Europe Tonic Water Market Share Comparison by Type (2016-2032)
- Figure 62: Western Europe Tonic Water Market Share Comparison by Packaging Type (2016-2032)
- Figure 63: Western Europe Tonic Water Market Share Comparison by Distribution Channel (2016-2032)
- Figure 64: Eastern Europe Tonic Water Market Revenue (US$ Mn) Market Share by Typein 2022
- Figure 65: Eastern Europe Tonic Water Market Attractiveness Analysis by Type, 2016-2032
- Figure 66: Eastern Europe Tonic Water Market Revenue (US$ Mn) Market Share by Packaging Typein 2022
- Figure 67: Eastern Europe Tonic Water Market Attractiveness Analysis by Packaging Type, 2016-2032
- Figure 68: Eastern Europe Tonic Water Market Revenue (US$ Mn) Market Share by Distribution Channelin 2022
- Figure 69: Eastern Europe Tonic Water Market Attractiveness Analysis by Distribution Channel, 2016-2032
- Figure 70: Eastern Europe Tonic Water Market Revenue (US$ Mn) Market Share by Country in 2022
- Figure 71: Eastern Europe Tonic Water Market Attractiveness Analysis by Country, 2016-2032
- Figure 72: Eastern Europe Tonic Water Market Revenue (US$ Mn) (2016-2032)
- Figure 73: Eastern Europe Tonic Water Market Revenue (US$ Mn) Comparison by Country (2016-2032)
- Figure 74: Eastern Europe Tonic Water Market Revenue (US$ Mn) Comparison by Type (2016-2032)
- Figure 75: Eastern Europe Tonic Water Market Revenue (US$ Mn) Comparison by Packaging Type (2016-2032)
- Figure 76: Eastern Europe Tonic Water Market Revenue (US$ Mn) Comparison by Distribution Channel (2016-2032)
- Figure 77: Eastern Europe Tonic Water Market Y-o-Y Growth Rate Comparison by Country (2016-2032)
- Figure 78: Eastern Europe Tonic Water Market Y-o-Y Growth Rate Comparison by Type (2016-2032)
- Figure 79: Eastern Europe Tonic Water Market Y-o-Y Growth Rate Comparison by Packaging Type (2016-2032)
- Figure 80: Eastern Europe Tonic Water Market Y-o-Y Growth Rate Comparison by Distribution Channel (2016-2032)
- Figure 81: Eastern Europe Tonic Water Market Share Comparison by Country (2016-2032)
- Figure 82: Eastern Europe Tonic Water Market Share Comparison by Type (2016-2032)
- Figure 83: Eastern Europe Tonic Water Market Share Comparison by Packaging Type (2016-2032)
- Figure 84: Eastern Europe Tonic Water Market Share Comparison by Distribution Channel (2016-2032)
- Figure 85: APAC Tonic Water Market Revenue (US$ Mn) Market Share by Typein 2022
- Figure 86: APAC Tonic Water Market Attractiveness Analysis by Type, 2016-2032
- Figure 87: APAC Tonic Water Market Revenue (US$ Mn) Market Share by Packaging Typein 2022
- Figure 88: APAC Tonic Water Market Attractiveness Analysis by Packaging Type, 2016-2032
- Figure 89: APAC Tonic Water Market Revenue (US$ Mn) Market Share by Distribution Channelin 2022
- Figure 90: APAC Tonic Water Market Attractiveness Analysis by Distribution Channel, 2016-2032
- Figure 91: APAC Tonic Water Market Revenue (US$ Mn) Market Share by Country in 2022
- Figure 92: APAC Tonic Water Market Attractiveness Analysis by Country, 2016-2032
- Figure 93: APAC Tonic Water Market Revenue (US$ Mn) (2016-2032)
- Figure 94: APAC Tonic Water Market Revenue (US$ Mn) Comparison by Country (2016-2032)
- Figure 95: APAC Tonic Water Market Revenue (US$ Mn) Comparison by Type (2016-2032)
- Figure 96: APAC Tonic Water Market Revenue (US$ Mn) Comparison by Packaging Type (2016-2032)
- Figure 97: APAC Tonic Water Market Revenue (US$ Mn) Comparison by Distribution Channel (2016-2032)
- Figure 98: APAC Tonic Water Market Y-o-Y Growth Rate Comparison by Country (2016-2032)
- Figure 99: APAC Tonic Water Market Y-o-Y Growth Rate Comparison by Type (2016-2032)
- Figure 100: APAC Tonic Water Market Y-o-Y Growth Rate Comparison by Packaging Type (2016-2032)
- Figure 101: APAC Tonic Water Market Y-o-Y Growth Rate Comparison by Distribution Channel (2016-2032)
- Figure 102: APAC Tonic Water Market Share Comparison by Country (2016-2032)
- Figure 103: APAC Tonic Water Market Share Comparison by Type (2016-2032)
- Figure 104: APAC Tonic Water Market Share Comparison by Packaging Type (2016-2032)
- Figure 105: APAC Tonic Water Market Share Comparison by Distribution Channel (2016-2032)
- Figure 106: Latin America Tonic Water Market Revenue (US$ Mn) Market Share by Typein 2022
- Figure 107: Latin America Tonic Water Market Attractiveness Analysis by Type, 2016-2032
- Figure 108: Latin America Tonic Water Market Revenue (US$ Mn) Market Share by Packaging Typein 2022
- Figure 109: Latin America Tonic Water Market Attractiveness Analysis by Packaging Type, 2016-2032
- Figure 110: Latin America Tonic Water Market Revenue (US$ Mn) Market Share by Distribution Channelin 2022
- Figure 111: Latin America Tonic Water Market Attractiveness Analysis by Distribution Channel, 2016-2032
- Figure 112: Latin America Tonic Water Market Revenue (US$ Mn) Market Share by Country in 2022
- Figure 113: Latin America Tonic Water Market Attractiveness Analysis by Country, 2016-2032
- Figure 114: Latin America Tonic Water Market Revenue (US$ Mn) (2016-2032)
- Figure 115: Latin America Tonic Water Market Revenue (US$ Mn) Comparison by Country (2016-2032)
- Figure 116: Latin America Tonic Water Market Revenue (US$ Mn) Comparison by Type (2016-2032)
- Figure 117: Latin America Tonic Water Market Revenue (US$ Mn) Comparison by Packaging Type (2016-2032)
- Figure 118: Latin America Tonic Water Market Revenue (US$ Mn) Comparison by Distribution Channel (2016-2032)
- Figure 119: Latin America Tonic Water Market Y-o-Y Growth Rate Comparison by Country (2016-2032)
- Figure 120: Latin America Tonic Water Market Y-o-Y Growth Rate Comparison by Type (2016-2032)
- Figure 121: Latin America Tonic Water Market Y-o-Y Growth Rate Comparison by Packaging Type (2016-2032)
- Figure 122: Latin America Tonic Water Market Y-o-Y Growth Rate Comparison by Distribution Channel (2016-2032)
- Figure 123: Latin America Tonic Water Market Share Comparison by Country (2016-2032)
- Figure 124: Latin America Tonic Water Market Share Comparison by Type (2016-2032)
- Figure 125: Latin America Tonic Water Market Share Comparison by Packaging Type (2016-2032)
- Figure 126: Latin America Tonic Water Market Share Comparison by Distribution Channel (2016-2032)
- Figure 127: Middle East & Africa Tonic Water Market Revenue (US$ Mn) Market Share by Typein 2022
- Figure 128: Middle East & Africa Tonic Water Market Attractiveness Analysis by Type, 2016-2032
- Figure 129: Middle East & Africa Tonic Water Market Revenue (US$ Mn) Market Share by Packaging Typein 2022
- Figure 130: Middle East & Africa Tonic Water Market Attractiveness Analysis by Packaging Type, 2016-2032
- Figure 131: Middle East & Africa Tonic Water Market Revenue (US$ Mn) Market Share by Distribution Channelin 2022
- Figure 132: Middle East & Africa Tonic Water Market Attractiveness Analysis by Distribution Channel, 2016-2032
- Figure 133: Middle East & Africa Tonic Water Market Revenue (US$ Mn) Market Share by Country in 2022
- Figure 134: Middle East & Africa Tonic Water Market Attractiveness Analysis by Country, 2016-2032
- Figure 135: Middle East & Africa Tonic Water Market Revenue (US$ Mn) (2016-2032)
- Figure 136: Middle East & Africa Tonic Water Market Revenue (US$ Mn) Comparison by Country (2016-2032)
- Figure 137: Middle East & Africa Tonic Water Market Revenue (US$ Mn) Comparison by Type (2016-2032)
- Figure 138: Middle East & Africa Tonic Water Market Revenue (US$ Mn) Comparison by Packaging Type (2016-2032)
- Figure 139: Middle East & Africa Tonic Water Market Revenue (US$ Mn) Comparison by Distribution Channel (2016-2032)
- Figure 140: Middle East & Africa Tonic Water Market Y-o-Y Growth Rate Comparison by Country (2016-2032)
- Figure 141: Middle East & Africa Tonic Water Market Y-o-Y Growth Rate Comparison by Type (2016-2032)
- Figure 142: Middle East & Africa Tonic Water Market Y-o-Y Growth Rate Comparison by Packaging Type (2016-2032)
- Figure 143: Middle East & Africa Tonic Water Market Y-o-Y Growth Rate Comparison by Distribution Channel (2016-2032)
- Figure 144: Middle East & Africa Tonic Water Market Share Comparison by Country (2016-2032)
- Figure 145: Middle East & Africa Tonic Water Market Share Comparison by Type (2016-2032)
- Figure 146: Middle East & Africa Tonic Water Market Share Comparison by Packaging Type (2016-2032)
- Figure 147: Middle East & Africa Tonic Water Market Share Comparison by Distribution Channel (2016-2032)
- List of Tables
- Table 1: Global Tonic Water Market Comparison by Type (2016-2032)
- Table 2: Global Tonic Water Market Comparison by Packaging Type (2016-2032)
- Table 3: Global Tonic Water Market Comparison by Distribution Channel (2016-2032)
- Table 4: Global Tonic Water Market Revenue (US$ Mn) Comparison by Region (2016-2032)
- Table 5: Global Tonic Water Market Revenue (US$ Mn) (2016-2032)
- Table 6: Global Tonic Water Market Revenue (US$ Mn) Comparison by Region (2016-2032)
- Table 7: Global Tonic Water Market Revenue (US$ Mn) Comparison by Type (2016-2032)
- Table 8: Global Tonic Water Market Revenue (US$ Mn) Comparison by Packaging Type (2016-2032)
- Table 9: Global Tonic Water Market Revenue (US$ Mn) Comparison by Distribution Channel (2016-2032)
- Table 10: Global Tonic Water Market Y-o-Y Growth Rate Comparison by Region (2016-2032)
- Table 11: Global Tonic Water Market Y-o-Y Growth Rate Comparison by Type (2016-2032)
- Table 12: Global Tonic Water Market Y-o-Y Growth Rate Comparison by Packaging Type (2016-2032)
- Table 13: Global Tonic Water Market Y-o-Y Growth Rate Comparison by Distribution Channel (2016-2032)
- Table 14: Global Tonic Water Market Share Comparison by Region (2016-2032)
- Table 15: Global Tonic Water Market Share Comparison by Type (2016-2032)
- Table 16: Global Tonic Water Market Share Comparison by Packaging Type (2016-2032)
- Table 17: Global Tonic Water Market Share Comparison by Distribution Channel (2016-2032)
- Table 18: North America Tonic Water Market Comparison by Packaging Type (2016-2032)
- Table 19: North America Tonic Water Market Comparison by Distribution Channel (2016-2032)
- Table 20: North America Tonic Water Market Revenue (US$ Mn) Comparison by Country (2016-2032)
- Table 21: North America Tonic Water Market Revenue (US$ Mn) (2016-2032)
- Table 22: North America Tonic Water Market Revenue (US$ Mn) Comparison by Country (2016-2032)
- Table 23: North America Tonic Water Market Revenue (US$ Mn) Comparison by Type (2016-2032)
- Table 24: North America Tonic Water Market Revenue (US$ Mn) Comparison by Packaging Type (2016-2032)
- Table 25: North America Tonic Water Market Revenue (US$ Mn) Comparison by Distribution Channel (2016-2032)
- Table 26: North America Tonic Water Market Y-o-Y Growth Rate Comparison by Country (2016-2032)
- Table 27: North America Tonic Water Market Y-o-Y Growth Rate Comparison by Type (2016-2032)
- Table 28: North America Tonic Water Market Y-o-Y Growth Rate Comparison by Packaging Type (2016-2032)
- Table 29: North America Tonic Water Market Y-o-Y Growth Rate Comparison by Distribution Channel (2016-2032)
- Table 30: North America Tonic Water Market Share Comparison by Country (2016-2032)
- Table 31: North America Tonic Water Market Share Comparison by Type (2016-2032)
- Table 32: North America Tonic Water Market Share Comparison by Packaging Type (2016-2032)
- Table 33: North America Tonic Water Market Share Comparison by Distribution Channel (2016-2032)
- Table 34: Western Europe Tonic Water Market Comparison by Type (2016-2032)
- Table 35: Western Europe Tonic Water Market Comparison by Packaging Type (2016-2032)
- Table 36: Western Europe Tonic Water Market Comparison by Distribution Channel (2016-2032)
- Table 37: Western Europe Tonic Water Market Revenue (US$ Mn) Comparison by Country (2016-2032)
- Table 38: Western Europe Tonic Water Market Revenue (US$ Mn) (2016-2032)
- Table 39: Western Europe Tonic Water Market Revenue (US$ Mn) Comparison by Country (2016-2032)
- Table 40: Western Europe Tonic Water Market Revenue (US$ Mn) Comparison by Type (2016-2032)
- Table 41: Western Europe Tonic Water Market Revenue (US$ Mn) Comparison by Packaging Type (2016-2032)
- Table 42: Western Europe Tonic Water Market Revenue (US$ Mn) Comparison by Distribution Channel (2016-2032)
- Table 43: Western Europe Tonic Water Market Y-o-Y Growth Rate Comparison by Country (2016-2032)
- Table 44: Western Europe Tonic Water Market Y-o-Y Growth Rate Comparison by Type (2016-2032)
- Table 45: Western Europe Tonic Water Market Y-o-Y Growth Rate Comparison by Packaging Type (2016-2032)
- Table 46: Western Europe Tonic Water Market Y-o-Y Growth Rate Comparison by Distribution Channel (2016-2032)
- Table 47: Western Europe Tonic Water Market Share Comparison by Country (2016-2032)
- Table 48: Western Europe Tonic Water Market Share Comparison by Type (2016-2032)
- Table 49: Western Europe Tonic Water Market Share Comparison by Packaging Type (2016-2032)
- Table 50: Western Europe Tonic Water Market Share Comparison by Distribution Channel (2016-2032)
- Table 51: Eastern Europe Tonic Water Market Comparison by Type (2016-2032)
- Table 52: Eastern Europe Tonic Water Market Comparison by Packaging Type (2016-2032)
- Table 53: Eastern Europe Tonic Water Market Comparison by Distribution Channel (2016-2032)
- Table 54: Eastern Europe Tonic Water Market Revenue (US$ Mn) Comparison by Country (2016-2032)
- Table 55: Eastern Europe Tonic Water Market Revenue (US$ Mn) (2016-2032)
- Table 56: Eastern Europe Tonic Water Market Revenue (US$ Mn) Comparison by Country (2016-2032)
- Table 57: Eastern Europe Tonic Water Market Revenue (US$ Mn) Comparison by Type (2016-2032)
- Table 58: Eastern Europe Tonic Water Market Revenue (US$ Mn) Comparison by Packaging Type (2016-2032)
- Table 59: Eastern Europe Tonic Water Market Revenue (US$ Mn) Comparison by Distribution Channel (2016-2032)
- Table 60: Eastern Europe Tonic Water Market Y-o-Y Growth Rate Comparison by Country (2016-2032)
- Table 61: Eastern Europe Tonic Water Market Y-o-Y Growth Rate Comparison by Type (2016-2032)
- Table 62: Eastern Europe Tonic Water Market Y-o-Y Growth Rate Comparison by Packaging Type (2016-2032)
- Table 63: Eastern Europe Tonic Water Market Y-o-Y Growth Rate Comparison by Distribution Channel (2016-2032)
- Table 64: Eastern Europe Tonic Water Market Share Comparison by Country (2016-2032)
- Table 65: Eastern Europe Tonic Water Market Share Comparison by Type (2016-2032)
- Table 66: Eastern Europe Tonic Water Market Share Comparison by Packaging Type (2016-2032)
- Table 67: Eastern Europe Tonic Water Market Share Comparison by Distribution Channel (2016-2032)
- Table 68: APAC Tonic Water Market Comparison by Type (2016-2032)
- Table 69: APAC Tonic Water Market Comparison by Packaging Type (2016-2032)
- Table 70: APAC Tonic Water Market Comparison by Distribution Channel (2016-2032)
- Table 71: APAC Tonic Water Market Revenue (US$ Mn) Comparison by Country (2016-2032)
- Table 72: APAC Tonic Water Market Revenue (US$ Mn) (2016-2032)
- Table 73: APAC Tonic Water Market Revenue (US$ Mn) Comparison by Country (2016-2032)
- Table 74: APAC Tonic Water Market Revenue (US$ Mn) Comparison by Type (2016-2032)
- Table 75: APAC Tonic Water Market Revenue (US$ Mn) Comparison by Packaging Type (2016-2032)
- Table 76: APAC Tonic Water Market Revenue (US$ Mn) Comparison by Distribution Channel (2016-2032)
- Table 77: APAC Tonic Water Market Y-o-Y Growth Rate Comparison by Country (2016-2032)
- Table 78: APAC Tonic Water Market Y-o-Y Growth Rate Comparison by Type (2016-2032)
- Table 79: APAC Tonic Water Market Y-o-Y Growth Rate Comparison by Packaging Type (2016-2032)
- Table 80: APAC Tonic Water Market Y-o-Y Growth Rate Comparison by Distribution Channel (2016-2032)
- Table 81: APAC Tonic Water Market Share Comparison by Country (2016-2032)
- Table 82: APAC Tonic Water Market Share Comparison by Type (2016-2032)
- Table 83: APAC Tonic Water Market Share Comparison by Packaging Type (2016-2032)
- Table 84: APAC Tonic Water Market Share Comparison by Distribution Channel (2016-2032)
- Table 85: Latin America Tonic Water Market Comparison by Type (2016-2032)
- Table 86: Latin America Tonic Water Market Comparison by Packaging Type (2016-2032)
- Table 87: Latin America Tonic Water Market Comparison by Distribution Channel (2016-2032)
- Table 88: Latin America Tonic Water Market Revenue (US$ Mn) Comparison by Country (2016-2032)
- Table 89: Latin America Tonic Water Market Revenue (US$ Mn) (2016-2032)
- Table 90: Latin America Tonic Water Market Revenue (US$ Mn) Comparison by Country (2016-2032)
- Table 91: Latin America Tonic Water Market Revenue (US$ Mn) Comparison by Type (2016-2032)
- Table 92: Latin America Tonic Water Market Revenue (US$ Mn) Comparison by Packaging Type (2016-2032)
- Table 93: Latin America Tonic Water Market Revenue (US$ Mn) Comparison by Distribution Channel (2016-2032)
- Table 94: Latin America Tonic Water Market Y-o-Y Growth Rate Comparison by Country (2016-2032)
- Table 95: Latin America Tonic Water Market Y-o-Y Growth Rate Comparison by Type (2016-2032)
- Table 96: Latin America Tonic Water Market Y-o-Y Growth Rate Comparison by Packaging Type (2016-2032)
- Table 97: Latin America Tonic Water Market Y-o-Y Growth Rate Comparison by Distribution Channel (2016-2032)
- Table 98: Latin America Tonic Water Market Share Comparison by Country (2016-2032)
- Table 99: Latin America Tonic Water Market Share Comparison by Type (2016-2032)
- Table 100: Latin America Tonic Water Market Share Comparison by Packaging Type (2016-2032)
- Table 101: Latin America Tonic Water Market Share Comparison by Distribution Channel (2016-2032)
- Table 102: Middle East & Africa Tonic Water Market Comparison by Type (2016-2032)
- Table 103: Middle East & Africa Tonic Water Market Comparison by Packaging Type (2016-2032)
- Table 104: Middle East & Africa Tonic Water Market Comparison by Distribution Channel (2016-2032)
- Table 105: Middle East & Africa Tonic Water Market Revenue (US$ Mn) Comparison by Country (2016-2032)
- Table 106: Middle East & Africa Tonic Water Market Revenue (US$ Mn) (2016-2032)
- Table 107: Middle East & Africa Tonic Water Market Revenue (US$ Mn) Comparison by Country (2016-2032)
- Table 108: Middle East & Africa Tonic Water Market Revenue (US$ Mn) Comparison by Type (2016-2032)
- Table 109: Middle East & Africa Tonic Water Market Revenue (US$ Mn) Comparison by Packaging Type (2016-2032)
- Table 110: Middle East & Africa Tonic Water Market Revenue (US$ Mn) Comparison by Distribution Channel (2016-2032)
- Table 111: Middle East & Africa Tonic Water Market Y-o-Y Growth Rate Comparison by Country (2016-2032)
- Table 112: Middle East & Africa Tonic Water Market Y-o-Y Growth Rate Comparison by Type (2016-2032)
- Table 113: Middle East & Africa Tonic Water Market Y-o-Y Growth Rate Comparison by Packaging Type (2016-2032)
- Table 114: Middle East & Africa Tonic Water Market Y-o-Y Growth Rate Comparison by Distribution Channel (2016-2032)
- Table 115: Middle East & Africa Tonic Water Market Share Comparison by Country (2016-2032)
- Table 116: Middle East & Africa Tonic Water Market Share Comparison by Type (2016-2032)
- Table 117: Middle East & Africa Tonic Water Market Share Comparison by Packaging Type (2016-2032)
- Table 118: Middle East & Africa Tonic Water Market Share Comparison by Distribution Channel (2016-2032)
- 1. Executive Summary
-
- Coca-Cola Company
- Fevertree Drinks Plc
- East Imperial Beverage Corporation
- Fentimans Ltd.
- London Essence Company
- Keurig Dr Pepper Inc.
- Asahi Group Holdings Ltd.
- Franklin & Sons Ltd.
- Thomas Henry Gmbh &
- Monster Beverage Corporation
- Bradley's Tonic Co.
- JACK RUDY COCKTAIL CO
- Seagram Company Ltd.
- Fever-Tree Drinks PLC
Our Clients


View Our Licence Options
