
Flavored Water Market By Packaging Type Analysis (Bottles, Cans), By Distribution Channel Analysis (Supermarkets/Hypermarkets, Convenience Stores, Online, Other), By Region And Companies - Industry Segment Outlook, Market Assessment, Competition Scenario, Trends, And Forecast 2023-2032
-
28643
-
May 2023
-
155
-


-
This report was compiled by Shreyas Rokade Shreyas Rokade is a seasoned Research Analyst with CMFE, bringing extensive expertise in market research and consulting, with a strong background in Chemical Engineering. Correspondence Team Lead-CMFE Linkedin | Detailed Market research Methodology Our methodology involves a mix of primary research, including interviews with leading mental health experts, and secondary research from reputable medical journals and databases. View Detailed Methodology Page
-
Quick Navigation
Report Overview
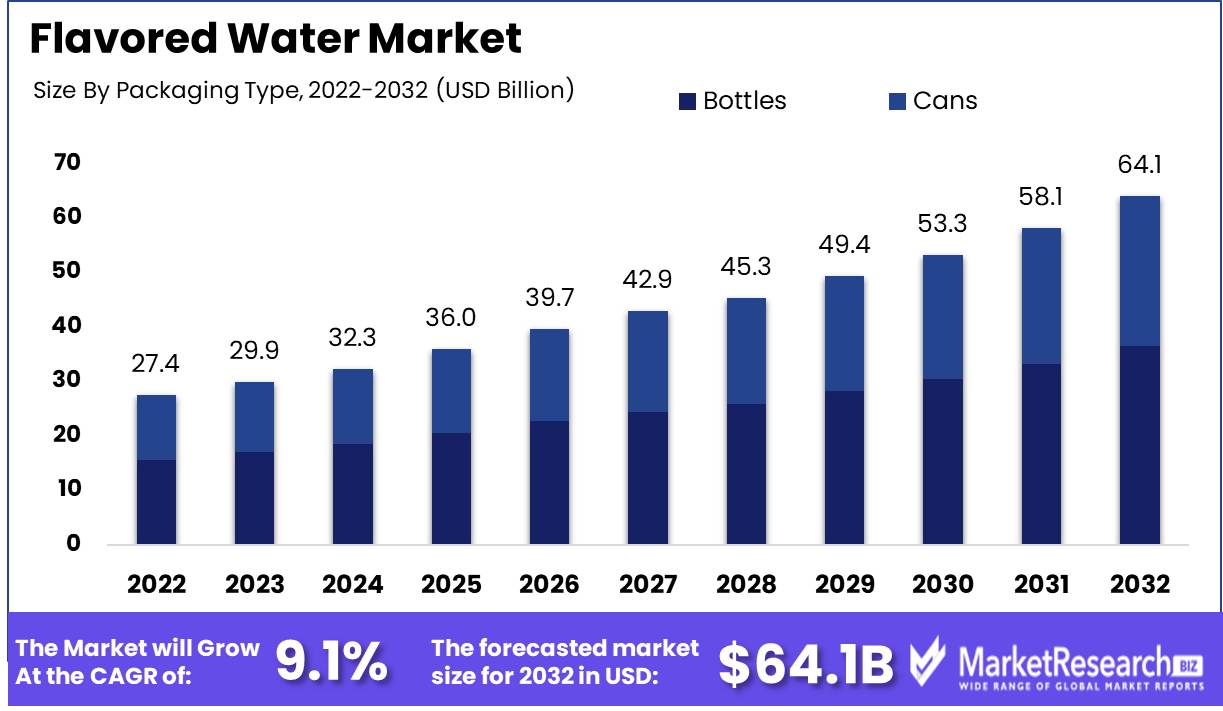
Flavored Water Market size is expected to be worth around USD 64.1 Bn by 2032 from USD 27.4 Bn in 2022, growing at a CAGR of 9.1% during the forecast period from 2023 to 2032.
Flavored water, a tantalizing elixir that tantalizes the taste receptors, is a mysterious beverage infused with a symphony of natural or artificial flavors that defies the conventions of traditional refreshments. Its appeal resides in its ability to enchant health-conscious individuals seeking freedom from sugar-laden beverages. With its lack of added carbohydrates, calories, and artificial sweeteners, flavored water has become the beverage of choice for health-conscious consumers in their quest for hydration.
Plain water has long been the steadfast companion of parched throats, but now flavored water has ascended to claim its rightful throne, offering an alluring alternative that satisfies the senses. The infused water market is poised to transcend its current boundaries and propel itself to astronomical heights as health consciousness surges across the country.
In the realm of flavored water, innovation takes on a variety of forms, weaving a complex tapestry of flavors and formulations. Sparkling water is a symphony of effervescence that dazzles the palate, while infused water constructs ethereal concoctions infused with nature's bounty. The harmonious union of herbs and water results in herb-infused water, a tantalizing elixir that transports one to a wellness sanctuary. Even more astonishing are the elixirs fortified with nutrients and minerals, which bestow unwavering vitality on the drinker.
Observe the transformation of the market for infused water as it embraces a verdant path, embracing the essence of the earth. In this era of the botanical renaissance, plant-based alternatives are on the rise, capturing the hearts of the health-seeking masses. Watch as brands combine the allure of plant-based ingredients with the poetry of natural extracts, birthing a new era of flavored water formulations.
In the midst of this realm of liquid innovation, PepsiCo and Coca-Cola, two beverage industry titans, gaze at the horizon with investment-laden eyes. The market for flavored water is flooded with capital, ushering in a tide of transformative opportunities. The provision of infused water as a benevolent gesture to those traversing the globe has emerged as an unprecedented trend in the realms of flights and accommodations.
Intriguingly, industries from all over the world are drawn to the flavored water market by its promise of innovation. The world of epicureanism intersects with the pharmaceutical and cosmetic domains, birthing a tapestry in which flavored water is interwoven with goods and services. As the fitness industry, a symbol of physical devotion, endeavors to quench the thirst of its customers, flavored water has assumed the role of post-workout hydration, revitalizing the souls of gym enthusiasts.
The presence of artificial flavors and sweeteners casts a shadow over the waters, which are otherwise pure. As a result, a new era of enlightenment dawns as companies advocate transparency and demand comprehension and accountability from flavored water providers. Natural ingredients take center stage, displacing synthetic interlopers, and formulations become readily digestible prose for discerning consumers.
The flavored water market, a phantasmagorical world where confusion and vivacity intertwine, embarks on a never-ending odyssey, entrancing spirits with its diverse flavors and kaleidoscopic narratives. The quest for healthier and more tantalizing alcoholic beverages drives innovation and responsibility in this realm.
Driving factors
The Surge in Demand for Flavored Water Market Rises
The market for flavored water is experiencing a surge in demand as a result of a number of factors with profound roots in consumer preferences and behavior. In recent years, rising health consciousness and concerns about the high sugar content of carbonated beverages have been major market drivers for flavored water. Consumers are now willing to spend money on healthful alternatives and are becoming more aware of the advantages of a reduced sugar intake, resulting in a shift toward flavored water.
Increasing Demand for Natural and Organic Flavored Water
Increasing demand for natural and organic options is also contributing to the growing popularity of flavored water. As consumers become increasingly concerned about the use of artificial additives and preservatives in their food and beverages, there has been a rise in demand for natural and organic flavored water. In the future years, there is expected to be a rise in demand for brands that offer organic products or use organic ingredients.
Innovations Drive Market Expansion for Flavored Water
Innovations and the introduction of new products by major participants in the flavored water market also contribute to its expansion. Companies now offer flavored water with added functionality and value, such as vitamin-enhanced and electrolyte-infused varieties. These products cater to specific consumer requirements and preferences and are expected to drive market expansion.
Flavored Water Demand Is Increased by Convenience
Additionally, the convenience and portability of flavored water packaged for on-the-go consumption have been major factor in driving demand. As consumers increasingly choose grab-and-go options, on-the-go packaging is becoming increasingly essential in the market for flavored water. In the food service industry, flavored water has become a popular alternative to sugary beverages due to the growing popularity of functional and value-added flavored water and the expanding availability of flavored water in a variety of flavors and sizes.
Regulation Threatens Flavored Water Market
A tighter restriction on the use of sweeteners in beverages is one potential change to regulation that could have an impact on the flavored water market. If stricter regulations were implemented, it might be necessary for brands to reformulate their products to meet regulatory requirements, which could have an effect on the competitive environment.
Restraining Factors
Flavored Water's Benefits
Despite its many benefits, flavored water can be less pleasurable than fizzy beverages. Carbonated drinks are more refreshing and thirst-quenching, which explains this perception. This perception is incorrect. When cold, flavored water is as refreshing as fizzy drinks. Flavored water is calorie- and sugar-free. Therefore, manufacturers need to educate customers about the benefits of flavored water and highlight its unique benefits to change this perception.
Flavored Water Challenges Consistency
The flavor and quality of flavored water might vary between brands, resulting in a lack of variety. Some brands and varieties have too much or too little flavor. Inconsistency can cause client unhappiness and a lack of product confidence. To address this issue, manufacturers need to ensure consistency in flavor and quality across all products. To maintain flavor standards throughout production, they need to invest in comprehensive quality control.
Overcoming Flavored Water's Scarcity
Despite the rise of the flavored water sector, several locations and markets still have limited availability. Lack of demand, restricted resources, or distribution methods cause this. Thus, consumers may not have access to their preferred brands or products. Manufacturers need to cooperate with local distributors and merchants to boost the availability of their products in diverse areas to address this issue. They need to invest in marketing to raise awareness and demand in these regions.
Costing Flavored Water
The high cost of premium or value-added flavored water varieties compared to tap water or other non-flavored water options is another restraint on the flavored water business. Packaging, manufacturing, and marketing add to the high cost. Manufacturers need to cut production costs while maintaining quality requirements to address this challenge. To cut costs, they can use biodegradable or refillable packaging.
Sustainable Solutions Flavored Water Eco-Packaging
Plastic packaging pollutes and wastes. The flavored water sector is demanding sustainable alternatives to plastic packaging. Manufacturers need to invest in sustainable packaging. Glass, metal, and biodegradable packaging are options. This reduces environmental impact and boosts brand perception.
Packaging Type Analysis
The bottle subsegment dominates the market for flavored water. Its popularity has been influenced by the convenience it provides in terms of portability, ease of use, and storage. In addition, rising environmental concerns among consumers have increased the demand for eco-friendly packaging options, which has further fuelled the bottle segment's growth.
Economic Development in Emerging Economies has played a significant role in driving the market's adoption of the bottles segment. In these economies, the popularity of bottled flavored water has been driven by the expanding demand for convenience and ease of use.
Consumer behavior and trends toward the bottle segment have also contributed to its growth. The adoption of bottled flavored water has resulted from the increasing demand for on-the-go options and the need to remain hydrated throughout the day.
Due to its convenience and the trend toward eco-friendly packaging options, the bottles segment of the market for flavored water is anticipated to register the quickest growth rate over the next few years.
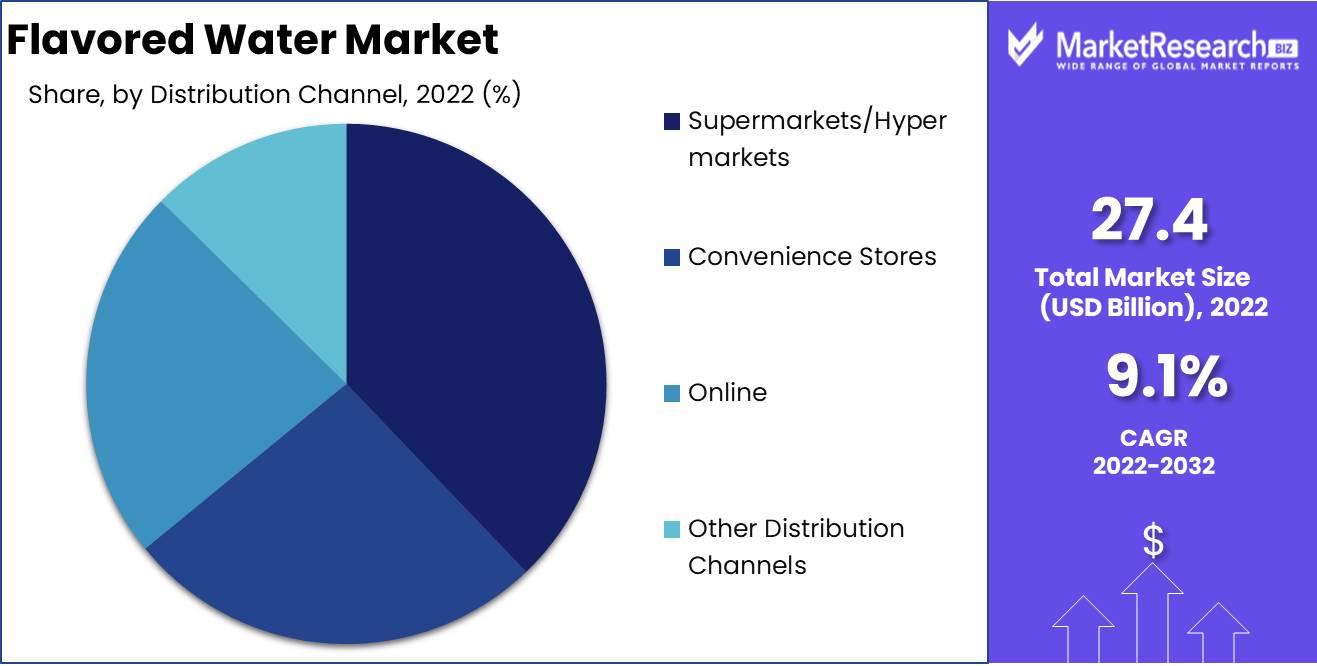
Distribution Channel Analysis
The hypermarkets and supermarkets segment dominates the market for flavored water. The availability of a large selection of products at competitive prices and the convenience of purchasing under one roof has contributed to the stores' popularity.
Economic Development in Emerging Economies has played a significant role in driving the market adoption of hypermarkets and supermarkets. In these economies, the popularity of these stores has been driven by the rising demand for convenience and the necessity of a one-stop shop.
Consumer behavior and market trends toward hypermarkets and supermarkets have also contributed to their growth. Consumers prefer these stores over other channels due to the trend of finding a convenient method to shop and the availability of a wide range of products.
Due to the convenience and availability of a vast selection of options, the hypermarkets/supermarkets segment of the flavored water market is anticipated to register the quickest growth rate in the coming years.
Key Market Segments
By Packaging Type Analysis
- Bottles
- Cans
By Distribution Channel Analysis
- Supermarkets/Hypermarkets
- Convenience Stores
- Online
- Other Distribution Channels
Growth Opportunity
Flavored Water Expanding Markets
As the global demand for flavored water continues to rise, the industry has witnessed a substantial increase in its potential for growth. In response to rising consumer demand for healthier and more invigorating beverage options, the flavored water industry has expanded its reach beyond the traditional bottled water market to encompass a vast array of niches, including sports and functional beverages.
Innovative Packaging Solutions
The expansion into new markets and regions with a growing demand for flavored water is one of the primary factors driving the market's exponential growth. As consumer preferences continue to adjust, many nations have witnessed a substantial shift from carbonated soft drinks to healthier beverages such as flavored water. In recent years, regions such as Asia-Pacific have witnessed an increase in the demand for flavored water, driven by increasing health concerns and the rising demand for premium and clean-label products.
Innovative Flavors Drive Growth
The development of sustainable packaging options to address environmental concerns is another factor propelling the growth potential of the flavored water market. As consumers become more aware of the environmental impact of plastic bottles, the demand for environmentally responsible packaging solutions has increased. In response to this demand, the industry has introduced innovative packaging options such as biodegradable bottles, paper-based cartons, and reusable containers.
Marketing increases brand recognition
In order to remain competitive, the industry has focused on the development of novel and innovative flavor profiles to attract new consumer segments. The market for flavored water has witnessed numerous flavor innovations, including tropical fruits, floral flavors, and even savory flavors. In an effort to appeal to health-conscious consumers, the industry has also witnessed a rise in the use of natural and organic ingredients.
Functional Water Offers Additional Advantages
In response to the increasing demand for health and wellness products, the market for flavored water has focused on providing functional and value-added varieties. As consumers become more health conscious, they search for products that provide additional health benefits in addition to hydration. This has resulted in the incorporation of functional ingredients, such as vitamins, minerals, and electrolytes, which offer additional health benefits and appeal to a broader spectrum of consumers.
Social Media Influence
In order to maintain its long-term growth potential, the market for flavored water has prioritized marketing and promotion in an effort to increase brand recognition and consumer loyalty. The industry has witnessed a variety of marketing campaigns designed to appeal to distinct consumer segments and to target various occasions. The use of social media and influencer marketing has also become an integral part of the marketing strategies of the flavored water industry, making it simpler for brands to reach a larger audience and develop loyal customers.
Latest Trends
Changing Trend for Premium and Organic Flavored Water
In recent years, the demand for premium and organic flavored water varieties, functional and value-added options, and unique and exotic flavor profiles that cater to diverse consumer preferences has increased dramatically. In tandem with the expansion of distribution channels, particularly online retail, there is a growing emphasis on sustainable packaging and environmental responsibility.
Health-Aware Shift Organic Water Explosion
Consumers are becoming increasingly aware of the environmental and health advantages of their beverage choices. As a result, there has been an increase in demand for premium and organic flavored water options, which offer a healthier and more sustainable alternative to conventional carbonated beverages. Additionally, health-conscious consumers are willing to pay a premium for water that does not contain artificial flavors, preservatives, or hues.
Growing Popularity Effective Waters Rise
Flavored water options with added functionality and value are becoming increasingly popular. These waters are fortified with vitamins, minerals, electrolytes, and other natural additives, making them more appealing to health-conscious consumers. Athletes and fitness enthusiasts who require an energy boost after an exercise also favor them.
Sustainable Packaging's Environmental Allure
Environmental sustainability and corporate social responsibility are becoming increasingly scrutinized by the public. Consequently, manufacturers are under pressure to provide packaging that is sustainable, reduces waste, and contributes to the circular economy. Many companies are introducing recyclable and biodegradable packaging that customers can dispose of responsibly, thereby making their business practices more appealing to environmentally conscious consumers.
Online Boom Flavored Water Goes Digital
Online retail has become an increasingly popular distribution channel for flavored water manufacturers since the introduction of e-commerce. Online retailers can provide customers with simple access to a vast selection of products and even make personalized suggestions based on past purchases. In addition, companies can bypass intermediaries and sell their products directly to end consumers, resulting in decreased distribution costs and increased profits.
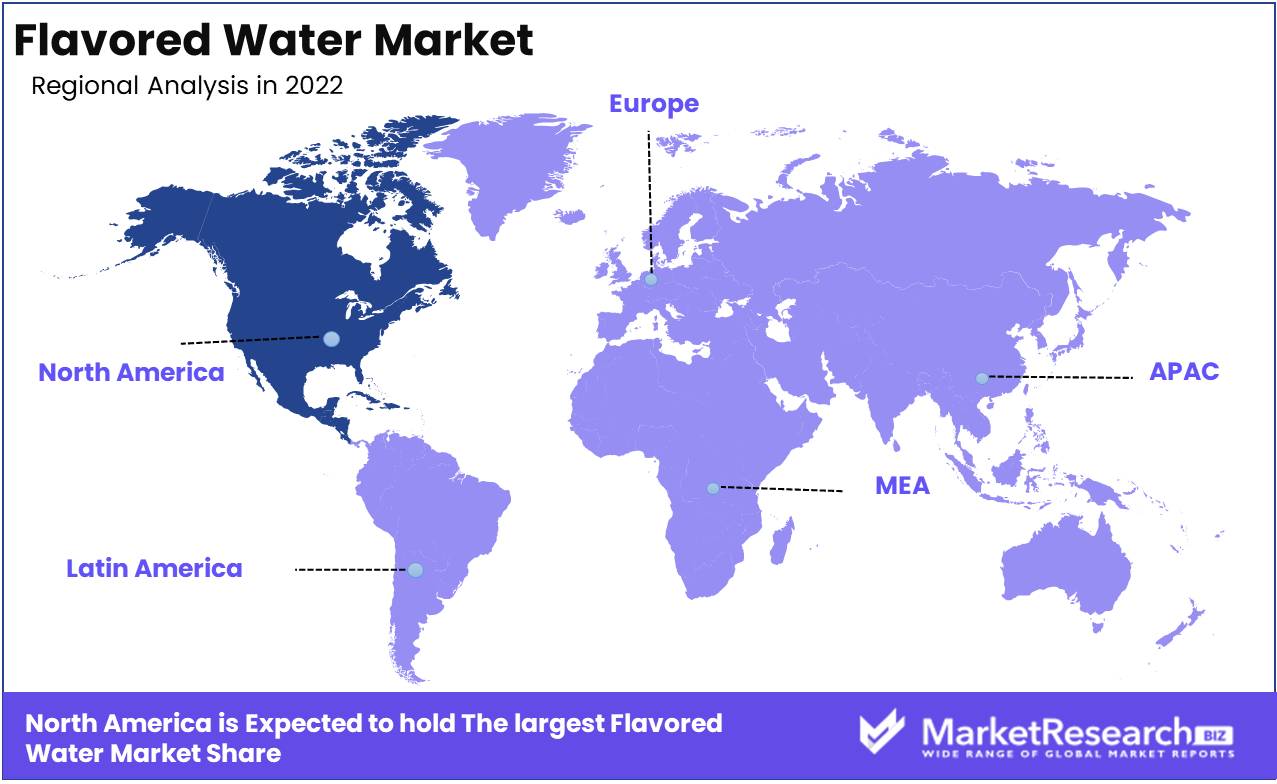
Regional Analysis
The North American market for this form of water is expanding, with the United States being of particular interest. We are witnessing a significant shift in how individuals perceive their health and wellness. This trend will continue to increase as more and more people become aware of additives and preservatives in their daily diet. Given that water is an essential component of a healthy diet, an increasing number of individuals are searching for functional and organic flavored water.
A healthful substitute for regular water is functional and organic flavored water. It is devoid of artificial sweeteners, preservatives, and colors, making it a safe option for consumers concerned with their health. Organic flavored water is derived from natural springs or wells, and its flavor is derived from organic fruits and herbs. It is a soothing method of quenching thirst while nourishing the body.
The functional aspect of flavored water refers to the additional advantages it offers in addition to hydration. Numerous glasses of functional water contain vitamins, minerals, and other nutrients that promote health. Some functional flavored water options are even infused with herbs and botanicals that assist digestion and promote relaxation, thereby reducing the body's stress levels.
Functional and organic flavored water is not a new trend, but it has garnered significant momentum in recent years. As consumers become more cognizant of the potential adverse effects of additives and preservatives, they seek natural alternatives. In the coming years, the market for functional and organic flavored water is anticipated to expand rapidly.
The United States retains the largest market share for functional and organic flavored water in North America. The trend of consumers seeking out functional and organic beverages, such as flavored water, is influenced by the increasing demand for healthful beverages. In the future years, the market for flavored water in the United States is anticipated to reach billions of dollars.
Key Regions and Countries
North America
- US
- Canada
- Mexico
Western Europe
- Germany
- France
- The UK
- Spain
- Italy
- Portugal
- Ireland
- Austria
- Switzerland
- Benelux
- Nordic
- Rest of Western Europe
Eastern Europe
- Russia
- Poland
- The Czech Republic
- Greece
- Rest of Eastern Europe
APAC
- China
- Japan
- South Korea
- India
- Australia & New Zealand
- Indonesia
- Malaysia
- Philippines
- Singapore
- Thailand
- Vietnam
- Rest of APAC
Latin America
- Brazil
- Colombia
- Chile
- Argentina
- Costa Rica
- Rest of Latin America
Middle East & Africa
- Algeria
- Egypt
- Israel
- Kuwait
- Nigeria
- Saudi Arabia
- South Africa
- Turkey
- United Arab Emirates
- Rest of MEA
Key Players Analysis
For health-conscious consumers who are wary of the sugary and toxic drinks on the market, flavored water has become a popular beverage of choice. In recent years, the market for infused water has expanded significantly due to the rising popularity of natural and healthy hydration options.
Nestle S.A., The Coca-Cola Company, PepsiCo, Inc., Danone S.A., Dr. Pepper Snapple Group, Inc., Hint, Inc., Talking Rain Beverage Company, Inc., The Alkaline Water Company, Inc., and The Wonderful Company LLC are some of the main players in the flavored water market.
With prominent brands such as Nestle Pure Life and Poland Spring, Nestle S.A. dominates the global flavored water market. With Aquafina, Dasani, Bubly, and Lifewtr, The Coca-Cola Company and PepsiCo, Inc. have made significant investments in the flavored water market.
Dr. Pepper Snapple Group, Inc. offers options like Bai and Core Hydration, while Danone S.A. has carved out a niche in the flavored water market with brands like Evian and Volvic.
The Alkaline Water Company, Inc. specializes in alkaline water with varieties like peach, raspberry, and lemon. Hint, Inc. is well-known for its natural fruit-flavored water options, whereas The Wonderful Company LLC's FIJI Water provides premium water with naturally occurring electrolytes.
Top Key Players in Flavored Water Market
- Nestlé
- Danone S.A.
- Talking Rain
- PepsiCo Inc.
- The Coca-Cola Company
- Hint Inc.
- Spindrift
- National Beverage Corp.
- Sanpellegrino S.P.A.
- KeurigDr Pepper Inc.
- Saratoga Spring Water Company
- Other players
Recent Development
- In 2023, Flavored Water Manufacturers started utilizing smart packaging technologies and personalization to improve consumer experiences.
- In 2022, Initiatives for Sustainable Packaging Concerns regarding plastic waste and environmental stewardship prompted flavored water manufacturers to prioritize eco-friendly packaging options.
- In 2021, Flavored water manufacturers started incorporating functional ingredients into their products. Vitamins, minerals, electrolytes, and other beneficial compounds are added to functional flavored waters to provide additional health benefits.
- In 2020, Consumer demand for natural and healthier beverage alternatives increased. In response to this trend, manufacturers of flavored water began emphasizing natural ingredients and reducing or eliminating artificial additives, flavors, and sweeteners.
- In 2019, The industry of flavored water experienced an explosion of new flavor varieties. In order to appeal to a variety of consumer tastes, manufacturers began introducing novel and exotic flavors.
Report Scope:
Report Features Description Market Value (2022) USD 27.4 Bn Forecast Revenue (2032) USD 64.1 Bn CAGR (2023-2032) 9.1% Base Year for Estimation 2022 Historic Period 2016-2022 Forecast Period 2023-2032 Report Coverage Revenue Forecast, Market Dynamics, COVID-19 Impact, Competitive Landscape, Recent Developments Segments Covered By Packaging Type Analysis (Bottles, Cans), By Distribution Channel Analysis (Supermarkets/Hypermarkets, Convenience Stores, Online, Other Distribution Channels) Regional Analysis North America – The US, Canada, & Mexico; Western Europe – Germany, France, The UK, Spain, Italy, Portugal, Ireland, Austria, Switzerland, Benelux, Nordic, & Rest of Western Europe; Eastern Europe – Russia, Poland, The Czech Republic, Greece, & Rest of Eastern Europe; APAC – China, Japan, South Korea, India, Australia & New Zealand, Indonesia, Malaysia, Philippines, Singapore, Thailand, Vietnam, & Rest of APAC; Latin America – Brazil, Colombia, Chile, Argentina, Costa Rica, & Rest of Latin America; Middle East & Africa – Algeria, Egypt, Israel, Kuwait, Nigeria, Saudi Arabia, South Africa, Turkey, United Arab Emirates, & Rest of MEA Competitive Landscape Nestlé, Danone S.A., Talking Rain, PepsiCo Inc., The Coca-Cola Company, Hint Inc., Spindrift, National Beverage Corp., Sanpellegrino S.P.A., KeurigDr Pepper Inc., Saratoga Spring Water Company, Other players Customization Scope Customization for segments, region/country-level will be provided. Moreover, additional customization can be done based on the requirements. Purchase Options We have three licenses to opt for: Single User License, Multi-User License (Up to 5 Users), Corporate Use License (Unlimited User and Printable PDF) -
-
- Nestlé
- Danone S.A.
- Talking Rain
- PepsiCo Inc.
- The Coca-Cola Company
- Hint Inc.
- Spindrift
- National Beverage Corp.
- Sanpellegrino S.P.A.
- KeurigDr Pepper Inc.
- Saratoga Spring Water Company
- Other players
Our Clients


View Our Licence Options
