
Thermal Interface Material Market By Material Type (Tapes and films, Elastomeric pads, Greases and adhesives, Phase change materials, Metal-based materials), By Application (Telecommunication, Computer, Medical devices, Industrial machinery, Consumer durables, Automotive electronics, Others), By Chemistry (Silicone, Epoxy, Polyimide), By Region and Companies - Industry Segment Outlook, Market Assessment, Competition Scenario, Trends, and Forecast 2023-2032
-
49730
-
July 2024
-
300
-


-
This report was compiled by Shreyas Rokade Shreyas Rokade is a seasoned Research Analyst with CMFE, bringing extensive expertise in market research and consulting, with a strong background in Chemical Engineering. Correspondence Team Lead-CMFE Linkedin | Detailed Market research Methodology Our methodology involves a mix of primary research, including interviews with leading mental health experts, and secondary research from reputable medical journals and databases. View Detailed Methodology Page
-
Quick Navigation
Report Overview
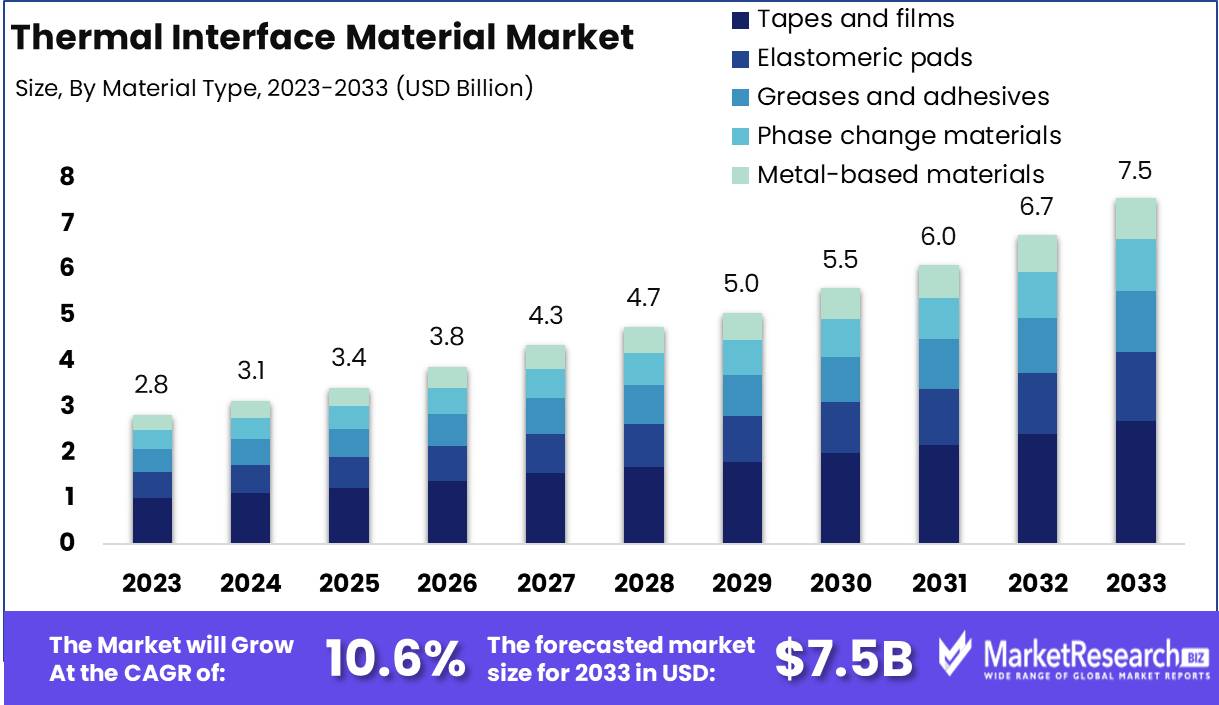
The Thermal Interface Material Market was valued at USD 2.8 billion in 2023. It is expected to reach USD 7.5 billion by 2033, with a CAGR of 10.6% during the forecast period from 2024 to 2033.
The Thermal Interface Material (TIM) Market encompasses a range of materials designed to enhance thermal conductivity between electronic components and heat sinks. These materials, which include thermal pastes, pads, and tapes, play a critical role in managing heat dissipation in electronic devices, ensuring optimal performance and longevity. The market's growth is driven by the increasing demand for high-performance electronic devices, advancements in miniaturization, and the proliferation of data centers.
The Thermal Interface Material (TIM) market is experiencing substantial growth, driven primarily by the increased demand for miniaturized and high-performance electronic devices. The proliferation of smartphones, tablets, and other compact electronic gadgets necessitates efficient heat dissipation solutions, propelling the adoption of advanced TIMs.
Additionally, the automotive sector's growing embrace of electric vehicles (EVs) and the continuous advancements in automotive electronics are further fueling market expansion. EVs require efficient thermal management systems to ensure optimal performance and longevity, thus elevating the importance of high-quality TIMs. However, the market faces challenges, notably the high cost of advanced materials and the complexity of manufacturing processes. These factors could potentially hinder the rapid adoption of cutting-edge TIM solutions, especially among cost-sensitive manufacturers.
Moreover, advancements in material science are playing a pivotal role in the development of next-generation TIMs, enhancing their thermal conductivity and reliability. The market is poised to benefit from ongoing research and development efforts aimed at improving the performance and cost-efficiency of these materials. As manufacturers strive to meet the growing demand for miniaturized electronic devices, the innovation in TIMs is expected to accelerate. The integration of novel materials and manufacturing techniques promises to address current limitations, paving the way for broader applications across various industries. In conclusion, while the TIM market holds significant growth potential, stakeholders must navigate the challenges of high costs and manufacturing complexities to fully capitalize on emerging opportunities.
Key Takeaways
- Market Growth: The Thermal Interface Material Market was valued at USD 2.8 billion in 2023. It is expected to reach USD 7.5 billion by 2033, with a CAGR of 10.6% during the forecast period from 2024 to 2033.
- By Material Type: Tapes and Films dominated the Thermal Interface Material Market segments.
- By Application: Telecommunication dominated the Thermal Interface Material Market applications.
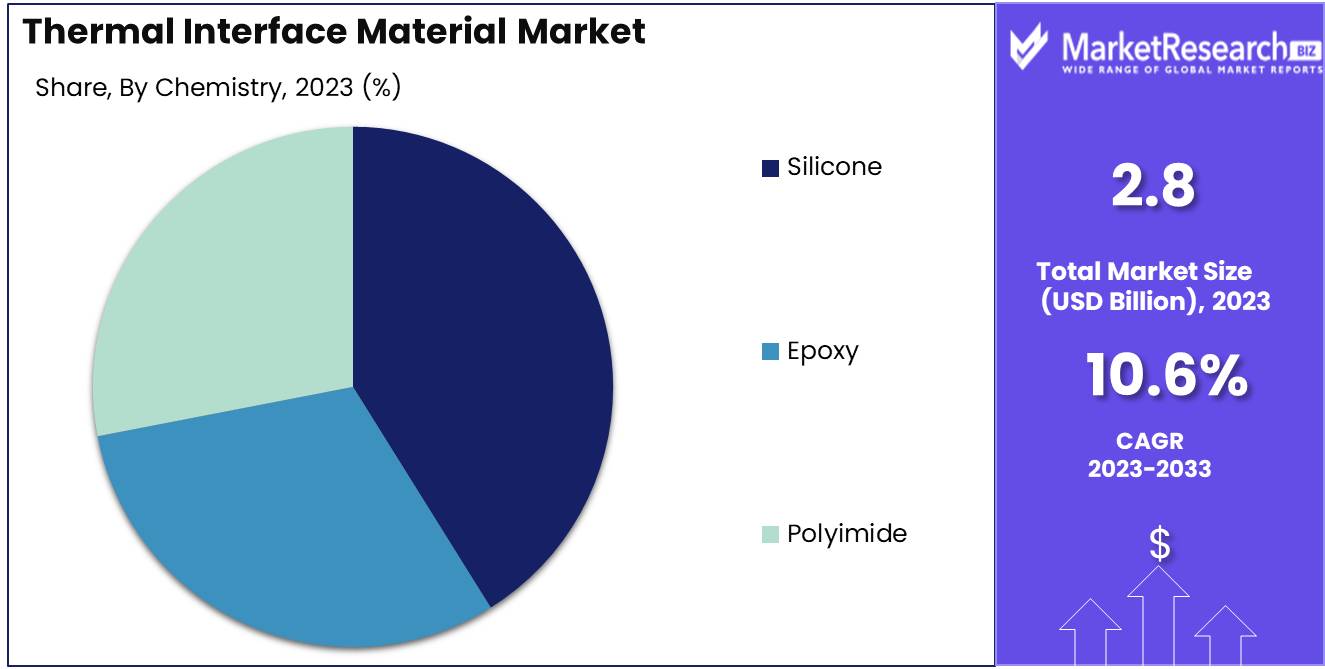
- By Chemistry: Silicone dominated the Thermal Interface Material Market chemistry segment.
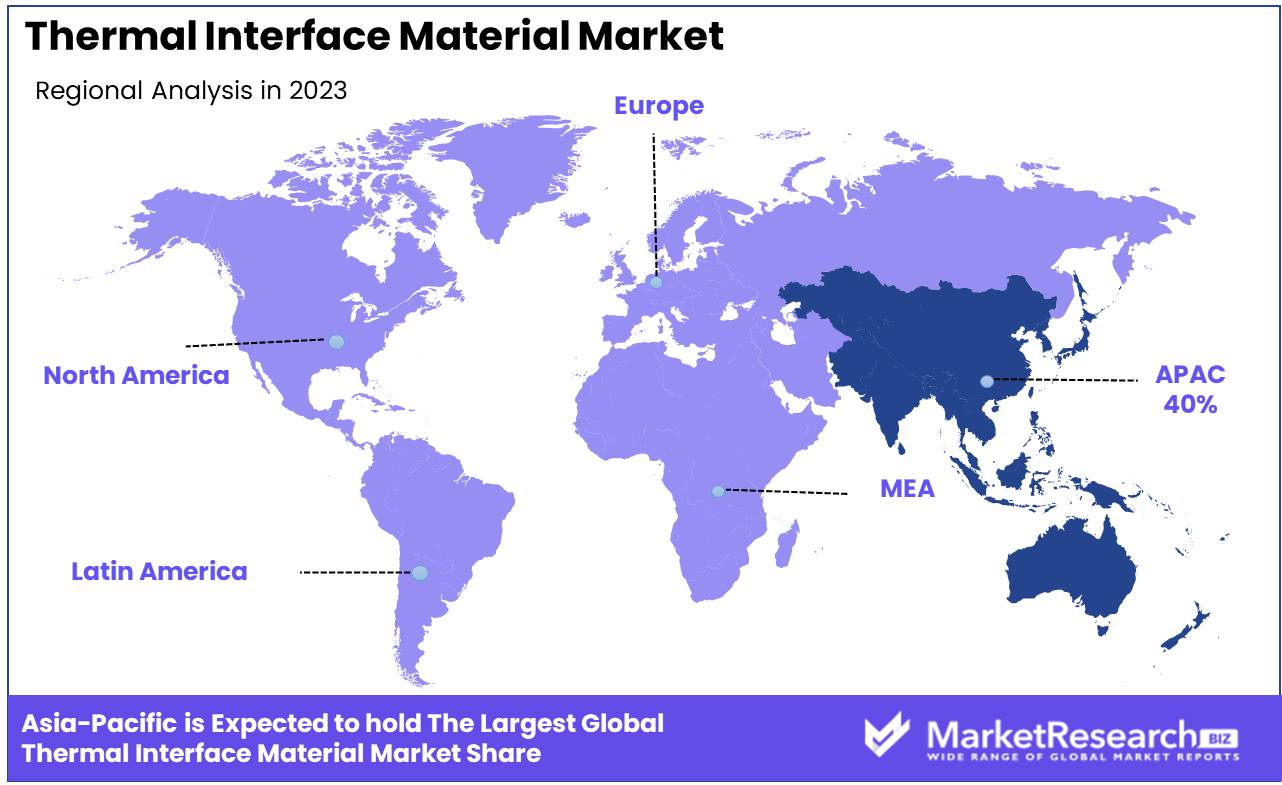
- Regional Dominance: Asia Pacific dominates the TIM market with a 40% largest share.
- Growth Opportunity: The global Thermal Interface Material market is poised for significant growth driven by the electrification of the transportation industry and the development of high-performance materials with nanodiamonds.
Driving factors
The Impact of Electronic Device Miniaturization on the Thermal Interface Material Market
The increasing demand for the miniaturization of electronic devices is a crucial driver for the Thermal Interface Material (TIM) market. As electronic devices become smaller and more compact, they generate more heat in constrained spaces. This escalation in heat production necessitates efficient heat management solutions to maintain device reliability and performance. Thermal interface materials play a pivotal role by enhancing heat dissipation between components, such as between processors and heat sinks.
The demand for high-performance TIMs grows as manufacturers aim to prevent overheating in smaller devices, thereby extending their operational life and efficiency. This trend is reflected in the market's growth projections, which are expected to rise in alignment with the surge in the production of compact electronics.
Expansion of the LED Market: A Bright Spot for Thermal Interface Materials
The burgeoning LED market significantly contributes to the growth of the thermal interface materials sector. LEDs, known for their energy efficiency and long lifespan, are increasingly used in automotive lighting, displays, and large-scale lighting installations. However, LEDs also generate substantial heat during operation, which can degrade their performance and shorten their lifespan. Efficient heat management through TIMs is critical to maintain the functionality and reliability of LED systems. As the adoption of LED technology accelerates, so does the demand for thermal interface materials that can sustain the performance of LEDs by effectively managing heat. This correlation underscores the symbiotic growth between LED advancements and TIM innovations.
Electrification of Vehicles: Fueling the Demand for Advanced Thermal Management
The electrification of vehicles is another significant growth lever for the Thermal Interface Material market. Electric vehicles (EVs), including hybrid and fully electric models, require robust thermal management systems to regulate battery temperatures and ensure optimal performance and safety. Thermal interface materials are essential in these applications, providing effective heat conduction pathways within battery management systems and between other critical electronic components. The push towards electric mobility, driven by global efforts to reduce carbon emissions, has led to increased production and adoption of EVs, thereby amplifying the demand for high-quality TIMs. The integration of advanced thermal solutions in electric vehicles illustrates the direct impact of automotive electrification on the expansion of the TIM market.
Restraining Factors
Performance Limitations: Impact on Market Expansion and Technological Adoption
The growth of the Thermal Interface Material (TIM) market is significantly restrained by performance limitations associated with current products. These materials, crucial for managing heat in electronic devices, must continuously evolve to handle higher thermal loads in increasingly compact spaces. The limitations in thermal conductivity, durability, and operational temperature range can impede their adoption in high-performance sectors such as automotive electronics, aerospace, and high-powered computing systems.
Without substantial improvements, these performance bottlenecks may deter potential users from integrating advanced TIM solutions, potentially slowing down market growth rates. While specific statistics detailing the extent of this impact are not provided, industry trends suggest a direct correlation between the enhancement of material properties and market adoption rates.
Volatility in Raw Material Prices: Creating Cost Uncertainties and Impacting Market Stability
Fluctuations in the prices of raw materials essential for manufacturing thermal interface materials, such as silicones, paraffin, and graphite, pose another significant challenge. Volatility in raw material costs can lead to inconsistent pricing of TIM products, making budget planning difficult for manufacturers and end-users. This unpredictability can restrain the market as manufacturers may pass increased costs onto consumers, potentially reducing demand.
Furthermore, companies might hesitate to invest in new production capacities or technological advancements during periods of high material cost uncertainty, which could slow down innovation and market growth. Although exact statistical impacts are not specified, the historical data from related markets suggests that raw material price stability is pivotal for sustaining growth and encouraging investment in the TIM sector.
By Material Type Analysis
In 2023, Tapes and Films dominated the Thermal Interface Material Market segments.
In 2023, Tapes and Films held a dominant market position in the "By Material Type" segment of the Thermal Interface Material Market, which includes various materials such as elastomeric pads, greases and adhesives, phase change materials, and metal-based materials. Tapes and films were preferred for their ease of application and effective thermal conductivity, making them ideal for use in electronic cooling, particularly in compact and high-performance devices. Elastomeric pads, known for their compressibility and flexibility, also captured a significant market share, favored in applications requiring minimal thermal resistance and robust physical properties.
Greases and adhesives, while offering superior thermal conduction and lower thermal resistance, were widely utilized for their ability to fill air gaps, enhancing the overall thermal management system. Phase change materials emerged as a crucial component in temperature regulation, leveraging their ability to absorb and release heat at specific temperatures.
Lastly, metal-based materials were acknowledged for their high thermal conductivity and durability, primarily used in demanding environments where high heat flux management is critical. Collectively, these materials underscore the diverse approaches to optimizing thermal performance across various applications in the electronics sector.
By Application Analysis
In 2023, Telecommunication dominated the Thermal Interface Material Market applications.
In 2023, Telecommunication held a dominant market position in the "By Application" segment of the Thermal Interface Material Market, reflecting its pivotal role in enhancing connectivity and network infrastructure. The demand in this sector is primarily driven by the ongoing expansion of 5G technologies and the increasing need for high-performance thermal management solutions in communication equipment.
The Computer segment also showcased significant growth, propelled by the surge in cloud computing and advanced computing technologies, which require efficient heat dissipation to maintain system performance and reliability. In the realm of Medical devices, thermal interface materials are critical for ensuring the operational integrity of sensitive medical equipment, including imaging devices and patient monitoring systems, where precise temperature control is crucial.
Industrial machinery applications of thermal interface materials focus on maintaining machinery efficiency and safety in high-temperature environments, thus preventing equipment failure. Consumer durables, including household electronics, benefit from these materials by enhancing the longevity and performance reliability of devices.
In Automotive electronics, thermal interface materials are essential for managing the heat in increasingly complex and compact electronic systems, such as those found in electric vehicles, which are integral to vehicle safety and performance. Lastly, the "Others" category, which includes various niche applications, continues to explore the adaptability of thermal interface materials to new technological environments, underscoring their versatility across a broad spectrum of industries.
By Chemistry Analysis
In 2023, Silicone dominated the Thermal Interface Material Market chemistry segment.
In 2023, Silicone held a dominant market position in the "By Chemistry" segment of the Thermal Interface Material Market. Renowned for its excellent thermal conductivity and flexibility, silicone materials accounted for a significant market share, driven by their extensive application in electronics and automotive industries. Silicone's superior thermal management capabilities, coupled with its durability and resistance to environmental factors, solidified its market dominance.
Epoxy, another critical segment, demonstrated substantial growth due to its robust adhesive properties and high thermal performance. Epoxy-based thermal interface materials are extensively utilized in applications requiring strong bonding and thermal stability, particularly in aerospace and high-performance computing sectors.
Polyimide, known for its exceptional heat resistance and mechanical strength, also contributed notably to the market. This material is preferred in high-temperature environments, such as semiconductor manufacturing and advanced electronic devices. Its ability to maintain performance under extreme conditions makes polyimide a valuable component in the thermal interface material landscape.
Key Market Segments
By Material Type
- Tapes and films
- Elastomeric pads
- Greases and adhesives
- Phase change materials
- Metal-based materials
By Application
- Telecommunication
- Computer
- Medical devices
- Industrial machinery
- Consumer durables
- Automotive electronics
- Others
By Chemistry
- Silicone
- Epoxy
- Polyimide
Growth Opportunity
Electrification in the Transportation Industry
The ongoing electrification of the transportation industry presents a significant growth opportunity for the global Thermal Interface Materials Market. As electric vehicles (EVs) continue to gain traction, the demand for efficient thermal management solutions has surged. Thermal interface materials are critical in managing the heat generated by EV batteries and power electronics, ensuring optimal performance and longevity. This shift towards electric mobility is expected to drive substantial growth in the TIM market, as manufacturers seek advanced materials that can enhance thermal conductivity and reliability. The rising investment in EV infrastructure and the increasing consumer adoption of electric vehicles further underscore the potential for TIM market expansion.
High-Performance Thermal Interface Materials with Nanodiamonds
The development of high-performance thermal interface materials incorporating nanodiamonds represents a transformative innovation in the TIM market. Nanodiamonds, known for their exceptional thermal conductivity and mechanical strength, offer a significant enhancement in the performance of thermal interface materials. These advanced materials provide superior heat dissipation, enabling electronic devices to operate at higher efficiencies and with greater reliability.
The integration of nanodiamonds into TIMs addresses the growing demand for high-performance thermal management solutions in various applications, including consumer electronics, data centers, and renewable energy systems. This technological advancement is poised to create lucrative opportunities for market players, driving the adoption of nanodiamond-enhanced TIMs across diverse industries.
Latest Trends
Phase Change Materials Leading Growth
The thermal interface materials market is expected to witness significant advancements, with phase change materials (PCMs) playing a pivotal role in driving growth. PCMs, known for their superior heat management properties, are increasingly being integrated into various applications due to their ability to absorb, store, and release thermal energy. This trend is particularly prominent in the electronics sector, where efficient heat dissipation is critical for maintaining the performance and longevity of devices. The adoption of PCMs is anticipated to accelerate as industries seek innovative solutions to enhance thermal management systems, thereby ensuring optimal operation of high-performance electronic components.
Impact of Electric Vehicles
The burgeoning electric vehicle (EV) industry is another major factor influencing the thermal interface material market. As the demand for EVs escalates, the need for advanced thermal management systems becomes imperative to ensure battery efficiency and safety. TIMs are essential in managing the heat generated by EV batteries and power electronics, thereby enhancing overall vehicle performance. The focus on improving battery thermal management systems has spurred investments in the development of high-performance TIMs, which can effectively mitigate overheating issues. This trend is expected to propel market growth, as manufacturers prioritize innovative materials to meet the stringent thermal requirements of next-generation EVs.
Regional Analysis
Asia Pacific dominates the TIM market with a 40% largest share.
The Thermal Interface Materials Market is segmented into several key regions, including North America, Europe, Asia Pacific, Middle East & Africa, and Latin America. North America, driven by significant advancements in electronics and semiconductor industries, holds a substantial market share, contributing to a robust demand for high-performance thermal management solutions. The region's market is characterized by increased investments in research and development, aiming at innovative TIM applications.
Europe follows closely, with a strong presence in the automotive and aerospace sectors, further propelling the market. Stringent regulatory standards regarding electronic component efficiency have bolstered the demand in this region.
Asia Pacific emerges as the dominant region, accounting for the largest market share of approximately 40%. This dominance is attributed to the rapid industrialization and urbanization in countries like China, Japan, and South Korea, which are major hubs for consumer electronics and automotive manufacturing. The presence of leading market players and extensive production facilities significantly enhances the market's growth prospects in this region.
Meanwhile, the Middle East & Africa, and Latin America are experiencing steady growth, driven by increasing investments in infrastructure and technological advancements in various industries. The TIM market in these regions is anticipated to witness gradual growth, supported by emerging applications and expanding end-use industries.
Key Regions and Countries
North America
- The US
- Canada
- Rest of North America
Europe
- Germany
- France
- The UK
- Spain
- Netherlands
- Russia
- Italy
- Rest of Europe
Asia-Pacific
- China
- Japan
- Singapore
- Thailand
- South Korea
- Vietnam
- India
- New Zealand
- Rest of Asia Pacific
Latin America
- Mexico
- Brazil
- Rest of Latin America
Middle East & Africa
- Saudi Arabia
- South Africa
- UAE
- Rest of the Middle East & Africa
Key Players Analysis
The global Thermal Interface Material (TIM) market in 2024 is expected to exhibit significant growth, driven by increasing demand across various sectors such as electronics, automotive, and telecommunications. Key players in the market are leveraging their technological advancements and extensive product portfolios to maintain competitive advantage and meet the rising demand for efficient heat dissipation solutions.
Henkel Corporation and its subsidiary, Bergquist Company, continue to lead the market with innovative thermal management materials that cater to high-performance electronics and industrial applications. Indium Corporation and Parker Chomerics are also notable for their cutting-edge thermal interface materials, which address the stringent requirements of modern electronic devices.
Dow Corning Corporation, now part of Dow, offers advanced silicone-based TIMs that are widely adopted in automotive and consumer electronics. Laird Technologies Inc. and Momentive Performance Materials Inc. are recognized for their versatile and high-performing thermal management solutions, contributing significantly to market growth.
Zalman Tech Corporation Limited and 3M Company focus on providing reliable and efficient thermal interface solutions, reinforcing their strong market presence. Shin-Etsu Chemical Co., Ltd., Wakefield-Vette, Inc., and Panasonic Corporation are key players known for their comprehensive TIM product ranges catering to diverse industry needs.
Arctic Silver, Inc., Fujipoly America Corporation, Master Bond Inc., and Honeywell International Inc. are also instrumental in driving market innovation with their specialized thermal interface products. These companies' strategic initiatives, such as product development and expansion into emerging markets, are expected to propel the global TIM market forward in 2024.
Market Key Players
- Henkel Corporation
- Bergquist Company
- Indium Corporation
- Parker Chomerics
- Dow Corning Corporation
- Laird Technologies Inc.
- Momentive Performance Materials Inc
- Zalman Tech Corporation Limited.
- 3M Company
- Shin-Etsu Chemical Co., Ltd.
- Wakefield-Vette, Inc.
- Panasonic CorporationArctic Silver, Inc.
- Fujipoly America Corporation
- Master Bond Inc.
- Honeywell International Inc.
Recent Development
- In May 2024, Parker Hannifin announced the development of a novel hybrid TIM that combines the benefits of phase change materials and thermal greases. This hybrid solution offers enhanced thermal performance and ease of application, particularly suited for telecommunications and consumer electronics. The innovation reflects the ongoing trend towards multifunctional materials that simplify manufacturing processes while improving thermal management.
- In March 2024, 3M launched an advanced series of gap filler pads tailored for high-power computing applications. These new TIMs provide superior thermal conductivity and mechanical compliance, which are critical for maintaining the reliability and efficiency of data centers and high-performance computing systems. The product release underscores 3M's commitment to supporting the evolving needs of the IT and data management industries.
- In January 2024, Henkel introduced a new range of high-performance liquid TIMs aimed at the electric vehicle (EV) market. These materials are designed to enhance the thermal management of battery packs, ensuring better performance and longevity of EVs. This innovation addresses the growing need for efficient thermal management solutions in the rapidly expanding EV sector.
Report Scope
Report Features Description Market Value (2023) USD 2.8 Billion Forecast Revenue (2033) USD 7.5 Billion CAGR (2024-2032) 10.6% Base Year for Estimation 2023 Historic Period 2016-2023 Forecast Period 2024-2033 Report Coverage Revenue Forecast, Market Dynamics, COVID-19 Impact, Competitive Landscape, Recent Developments Segments Covered By Material Type (Tapes and films, Elastomeric pads, Greases and adhesives, Phase change materials, Metal-based materials), By Application (Telecommunication, Computer, Medical devices, Industrial Machinery, Consumer durables, Automotive electronics, Others), By Chemistry (Silicone, Epoxy, Polyimide) Regional Analysis North America - The US, Canada, Rest of North America, Europe - Germany, France, The UK, Spain, Italy, Russia, Netherlands, Rest of Europe, Asia-Pacific - China, Japan, South Korea, India, New Zealand, Singapore, Thailand, Vietnam, Rest of Asia Pacific, Latin America - Brazil, Mexico, Rest of Latin America, Middle East & Africa - South Africa, Saudi Arabia, UAE, Rest of Middle East & Africa Competitive Landscape Henkel Corporation, Bergquist Company, Indium Corporation, Parker Chomerics, Dow Corning Corporation, Laird Technologies Inc., Momentive Performance Materials Inc., Zalman Tech Corporation Limited., 3M Company, Shin-Etsu Chemical Co., Ltd., Wakefield-Vette, Inc., Panasonic Corporation, Arctic Silver, Inc., Fujipoly America Corporation, Master Bond Inc., Honeywell International Inc. Customization Scope Customization for segments, region/country-level will be provided. Moreover, additional customization can be done based on the requirements. Purchase Options We have three licenses to opt for Single User License, Multi-User License (Up to 5 Users), Corporate Use License (Unlimited User and Printable PDF) -
- 1. Executive Summary
- 1.1. Definition
- 1.2. Taxonomy
- 1.3. Research Scope
- 1.4. Key Analysis
- 1.5. Key Findings by Major Segments
- 1.6. Top strategies by Major Players
- 2. Global Thermal Interface Material Market Overview
- 2.1. Thermal Interface Material Market Dynamics
- 2.1.1. Drivers
- 2.1.2. Opportunities
- 2.1.3. Restraints
- 2.1.4. Challenges
- 2.2. Macro-economic Factors
- 2.3. Regulatory Framework
- 2.4. Market Investment Feasibility Index
- 2.5. PEST Analysis
- 2.6. PORTER’S Five Force Analysis
- 2.7. Drivers & Restraints Impact Analysis
- 2.8. Industry Chain Analysis
- 2.9. Cost Structure Analysis
- 2.10. Marketing Strategy
- 2.11. Russia-Ukraine War Impact Analysis
- 2.12. Opportunity Map Analysis
- 2.13. Market Competition Scenario Analysis
- 2.14. Product Life Cycle Analysis
- 2.15. Opportunity Orbits
- 2.16. Manufacturer Intensity Map
- 2.17. Major Companies sales by Value & Volume
- 2.1. Thermal Interface Material Market Dynamics
- 3. Global Thermal Interface Material Market Analysis, Opportunity and Forecast, 2016-2032
- 3.1. Global Thermal Interface Material Market Analysis, 2016-2021
- 3.2. Global Thermal Interface Material Market Opportunity and Forecast, 2023-2032
- 3.3. Global Thermal Interface Material Market Analysis, Opportunity and Forecast, By Material Type, 2016-2032
- 3.3.1. Global Thermal Interface Material Market Analysis by Material Type: Introduction
- 3.3.2. Market Size Absolute $ Opportunity Analysis and Forecast, By Material Type, 2016-2032
- 3.3.3. Tapes and films
- 3.3.4. Elastomeric pads
- 3.3.5. Greases and adhesives
- 3.3.6. Phase change materials
- 3.3.7. Metal-based materials
- 3.4. Global Thermal Interface Material Market Analysis, Opportunity and Forecast, By Application, 2016-2032
- 3.4.1. Global Thermal Interface Material Market Analysis by Application: Introduction
- 3.4.2. Market Size Absolute $ Opportunity Analysis and Forecast, By Application, 2016-2032
- 3.4.3. Telecommunication
- 3.4.4. Computer
- 3.4.5. Medical devices
- 3.4.6. Industrial machinery
- 3.4.7. Consumer durables
- 3.4.8. Automotive electronics
- 3.4.9. Others
- 3.5. Global Thermal Interface Material Market Analysis, Opportunity and Forecast, By Chemistry, 2016-2032
- 3.5.1. Global Thermal Interface Material Market Analysis by Chemistry: Introduction
- 3.5.2. Market Size Absolute $ Opportunity Analysis and Forecast, By Chemistry, 2016-2032
- 3.5.3. Silicone
- 3.5.4. Epoxy
- 3.5.5. Polyimide
- 4. North America Thermal Interface Material Market Analysis, Opportunity and Forecast, 2016-2032
- 4.1. North America Thermal Interface Material Market Analysis, 2016-2021
- 4.2. North America Thermal Interface Material Market Opportunity and Forecast, 2023-2032
- 4.3. North America Thermal Interface Material Market Analysis, Opportunity and Forecast, By Material Type, 2016-2032
- 4.3.1. North America Thermal Interface Material Market Analysis by Material Type: Introduction
- 4.3.2. Market Size Absolute $ Opportunity Analysis and Forecast, By Material Type, 2016-2032
- 4.3.3. Tapes and films
- 4.3.4. Elastomeric pads
- 4.3.5. Greases and adhesives
- 4.3.6. Phase change materials
- 4.3.7. Metal-based materials
- 4.4. North America Thermal Interface Material Market Analysis, Opportunity and Forecast, By Application, 2016-2032
- 4.4.1. North America Thermal Interface Material Market Analysis by Application: Introduction
- 4.4.2. Market Size Absolute $ Opportunity Analysis and Forecast, By Application, 2016-2032
- 4.4.3. Telecommunication
- 4.4.4. Computer
- 4.4.5. Medical devices
- 4.4.6. Industrial machinery
- 4.4.7. Consumer durables
- 4.4.8. Automotive electronics
- 4.4.9. Others
- 4.5. North America Thermal Interface Material Market Analysis, Opportunity and Forecast, By Chemistry, 2016-2032
- 4.5.1. North America Thermal Interface Material Market Analysis by Chemistry: Introduction
- 4.5.2. Market Size Absolute $ Opportunity Analysis and Forecast, By Chemistry, 2016-2032
- 4.5.3. Silicone
- 4.5.4. Epoxy
- 4.5.5. Polyimide
- 4.6. North America Thermal Interface Material Market Analysis, Opportunity and Forecast, By Country , 2016-2032
- 4.6.1. North America Thermal Interface Material Market Analysis by Country : Introduction
- 4.6.2. Market Size Absolute $ Opportunity Analysis and Forecast, Country , 2016-2032
- 4.6.2.1. The US
- 4.6.2.2. Canada
- 4.6.2.3. Mexico
- 5. Western Europe Thermal Interface Material Market Analysis, Opportunity and Forecast, 2016-2032
- 5.1. Western Europe Thermal Interface Material Market Analysis, 2016-2021
- 5.2. Western Europe Thermal Interface Material Market Opportunity and Forecast, 2023-2032
- 5.3. Western Europe Thermal Interface Material Market Analysis, Opportunity and Forecast, By Material Type, 2016-2032
- 5.3.1. Western Europe Thermal Interface Material Market Analysis by Material Type: Introduction
- 5.3.2. Market Size Absolute $ Opportunity Analysis and Forecast, By Material Type, 2016-2032
- 5.3.3. Tapes and films
- 5.3.4. Elastomeric pads
- 5.3.5. Greases and adhesives
- 5.3.6. Phase change materials
- 5.3.7. Metal-based materials
- 5.4. Western Europe Thermal Interface Material Market Analysis, Opportunity and Forecast, By Application, 2016-2032
- 5.4.1. Western Europe Thermal Interface Material Market Analysis by Application: Introduction
- 5.4.2. Market Size Absolute $ Opportunity Analysis and Forecast, By Application, 2016-2032
- 5.4.3. Telecommunication
- 5.4.4. Computer
- 5.4.5. Medical devices
- 5.4.6. Industrial machinery
- 5.4.7. Consumer durables
- 5.4.8. Automotive electronics
- 5.4.9. Others
- 5.5. Western Europe Thermal Interface Material Market Analysis, Opportunity and Forecast, By Chemistry, 2016-2032
- 5.5.1. Western Europe Thermal Interface Material Market Analysis by Chemistry: Introduction
- 5.5.2. Market Size Absolute $ Opportunity Analysis and Forecast, By Chemistry, 2016-2032
- 5.5.3. Silicone
- 5.5.4. Epoxy
- 5.5.5. Polyimide
- 5.6. Western Europe Thermal Interface Material Market Analysis, Opportunity and Forecast, By Country , 2016-2032
- 5.6.1. Western Europe Thermal Interface Material Market Analysis by Country : Introduction
- 5.6.2. Market Size Absolute $ Opportunity Analysis and Forecast, Country , 2016-2032
- 5.6.2.1. Germany
- 5.6.2.2. France
- 5.6.2.3. The UK
- 5.6.2.4. Spain
- 5.6.2.5. Italy
- 5.6.2.6. Portugal
- 5.6.2.7. Ireland
- 5.6.2.8. Austria
- 5.6.2.9. Switzerland
- 5.6.2.10. Benelux
- 5.6.2.11. Nordic
- 5.6.2.12. Rest of Western Europe
- 6. Eastern Europe Thermal Interface Material Market Analysis, Opportunity and Forecast, 2016-2032
- 6.1. Eastern Europe Thermal Interface Material Market Analysis, 2016-2021
- 6.2. Eastern Europe Thermal Interface Material Market Opportunity and Forecast, 2023-2032
- 6.3. Eastern Europe Thermal Interface Material Market Analysis, Opportunity and Forecast, By Material Type, 2016-2032
- 6.3.1. Eastern Europe Thermal Interface Material Market Analysis by Material Type: Introduction
- 6.3.2. Market Size Absolute $ Opportunity Analysis and Forecast, By Material Type, 2016-2032
- 6.3.3. Tapes and films
- 6.3.4. Elastomeric pads
- 6.3.5. Greases and adhesives
- 6.3.6. Phase change materials
- 6.3.7. Metal-based materials
- 6.4. Eastern Europe Thermal Interface Material Market Analysis, Opportunity and Forecast, By Application, 2016-2032
- 6.4.1. Eastern Europe Thermal Interface Material Market Analysis by Application: Introduction
- 6.4.2. Market Size Absolute $ Opportunity Analysis and Forecast, By Application, 2016-2032
- 6.4.3. Telecommunication
- 6.4.4. Computer
- 6.4.5. Medical devices
- 6.4.6. Industrial machinery
- 6.4.7. Consumer durables
- 6.4.8. Automotive electronics
- 6.4.9. Others
- 6.5. Eastern Europe Thermal Interface Material Market Analysis, Opportunity and Forecast, By Chemistry, 2016-2032
- 6.5.1. Eastern Europe Thermal Interface Material Market Analysis by Chemistry: Introduction
- 6.5.2. Market Size Absolute $ Opportunity Analysis and Forecast, By Chemistry, 2016-2032
- 6.5.3. Silicone
- 6.5.4. Epoxy
- 6.5.5. Polyimide
- 6.6. Eastern Europe Thermal Interface Material Market Analysis, Opportunity and Forecast, By Country , 2016-2032
- 6.6.1. Eastern Europe Thermal Interface Material Market Analysis by Country : Introduction
- 6.6.2. Market Size Absolute $ Opportunity Analysis and Forecast, Country , 2016-2032
- 6.6.2.1. Russia
- 6.6.2.2. Poland
- 6.6.2.3. The Czech Republic
- 6.6.2.4. Greece
- 6.6.2.5. Rest of Eastern Europe
- 7. APAC Thermal Interface Material Market Analysis, Opportunity and Forecast, 2016-2032
- 7.1. APAC Thermal Interface Material Market Analysis, 2016-2021
- 7.2. APAC Thermal Interface Material Market Opportunity and Forecast, 2023-2032
- 7.3. APAC Thermal Interface Material Market Analysis, Opportunity and Forecast, By Material Type, 2016-2032
- 7.3.1. APAC Thermal Interface Material Market Analysis by Material Type: Introduction
- 7.3.2. Market Size Absolute $ Opportunity Analysis and Forecast, By Material Type, 2016-2032
- 7.3.3. Tapes and films
- 7.3.4. Elastomeric pads
- 7.3.5. Greases and adhesives
- 7.3.6. Phase change materials
- 7.3.7. Metal-based materials
- 7.4. APAC Thermal Interface Material Market Analysis, Opportunity and Forecast, By Application, 2016-2032
- 7.4.1. APAC Thermal Interface Material Market Analysis by Application: Introduction
- 7.4.2. Market Size Absolute $ Opportunity Analysis and Forecast, By Application, 2016-2032
- 7.4.3. Telecommunication
- 7.4.4. Computer
- 7.4.5. Medical devices
- 7.4.6. Industrial machinery
- 7.4.7. Consumer durables
- 7.4.8. Automotive electronics
- 7.4.9. Others
- 7.5. APAC Thermal Interface Material Market Analysis, Opportunity and Forecast, By Chemistry, 2016-2032
- 7.5.1. APAC Thermal Interface Material Market Analysis by Chemistry: Introduction
- 7.5.2. Market Size Absolute $ Opportunity Analysis and Forecast, By Chemistry, 2016-2032
- 7.5.3. Silicone
- 7.5.4. Epoxy
- 7.5.5. Polyimide
- 7.6. APAC Thermal Interface Material Market Analysis, Opportunity and Forecast, By Country , 2016-2032
- 7.6.1. APAC Thermal Interface Material Market Analysis by Country : Introduction
- 7.6.2. Market Size Absolute $ Opportunity Analysis and Forecast, Country , 2016-2032
- 7.6.2.1. China
- 7.6.2.2. Japan
- 7.6.2.3. South Korea
- 7.6.2.4. India
- 7.6.2.5. Australia & New Zeland
- 7.6.2.6. Indonesia
- 7.6.2.7. Malaysia
- 7.6.2.8. Philippines
- 7.6.2.9. Singapore
- 7.6.2.10. Thailand
- 7.6.2.11. Vietnam
- 7.6.2.12. Rest of APAC
- 8. Latin America Thermal Interface Material Market Analysis, Opportunity and Forecast, 2016-2032
- 8.1. Latin America Thermal Interface Material Market Analysis, 2016-2021
- 8.2. Latin America Thermal Interface Material Market Opportunity and Forecast, 2023-2032
- 8.3. Latin America Thermal Interface Material Market Analysis, Opportunity and Forecast, By Material Type, 2016-2032
- 8.3.1. Latin America Thermal Interface Material Market Analysis by Material Type: Introduction
- 8.3.2. Market Size Absolute $ Opportunity Analysis and Forecast, By Material Type, 2016-2032
- 8.3.3. Tapes and films
- 8.3.4. Elastomeric pads
- 8.3.5. Greases and adhesives
- 8.3.6. Phase change materials
- 8.3.7. Metal-based materials
- 8.4. Latin America Thermal Interface Material Market Analysis, Opportunity and Forecast, By Application, 2016-2032
- 8.4.1. Latin America Thermal Interface Material Market Analysis by Application: Introduction
- 8.4.2. Market Size Absolute $ Opportunity Analysis and Forecast, By Application, 2016-2032
- 8.4.3. Telecommunication
- 8.4.4. Computer
- 8.4.5. Medical devices
- 8.4.6. Industrial machinery
- 8.4.7. Consumer durables
- 8.4.8. Automotive electronics
- 8.4.9. Others
- 8.5. Latin America Thermal Interface Material Market Analysis, Opportunity and Forecast, By Chemistry, 2016-2032
- 8.5.1. Latin America Thermal Interface Material Market Analysis by Chemistry: Introduction
- 8.5.2. Market Size Absolute $ Opportunity Analysis and Forecast, By Chemistry, 2016-2032
- 8.5.3. Silicone
- 8.5.4. Epoxy
- 8.5.5. Polyimide
- 8.6. Latin America Thermal Interface Material Market Analysis, Opportunity and Forecast, By Country , 2016-2032
- 8.6.1. Latin America Thermal Interface Material Market Analysis by Country : Introduction
- 8.6.2. Market Size Absolute $ Opportunity Analysis and Forecast, Country , 2016-2032
- 8.6.2.1. Brazil
- 8.6.2.2. Colombia
- 8.6.2.3. Chile
- 8.6.2.4. Argentina
- 8.6.2.5. Costa Rica
- 8.6.2.6. Rest of Latin America
- 9. Middle East & Africa Thermal Interface Material Market Analysis, Opportunity and Forecast, 2016-2032
- 9.1. Middle East & Africa Thermal Interface Material Market Analysis, 2016-2021
- 9.2. Middle East & Africa Thermal Interface Material Market Opportunity and Forecast, 2023-2032
- 9.3. Middle East & Africa Thermal Interface Material Market Analysis, Opportunity and Forecast, By Material Type, 2016-2032
- 9.3.1. Middle East & Africa Thermal Interface Material Market Analysis by Material Type: Introduction
- 9.3.2. Market Size Absolute $ Opportunity Analysis and Forecast, By Material Type, 2016-2032
- 9.3.3. Tapes and films
- 9.3.4. Elastomeric pads
- 9.3.5. Greases and adhesives
- 9.3.6. Phase change materials
- 9.3.7. Metal-based materials
- 9.4. Middle East & Africa Thermal Interface Material Market Analysis, Opportunity and Forecast, By Application, 2016-2032
- 9.4.1. Middle East & Africa Thermal Interface Material Market Analysis by Application: Introduction
- 9.4.2. Market Size Absolute $ Opportunity Analysis and Forecast, By Application, 2016-2032
- 9.4.3. Telecommunication
- 9.4.4. Computer
- 9.4.5. Medical devices
- 9.4.6. Industrial machinery
- 9.4.7. Consumer durables
- 9.4.8. Automotive electronics
- 9.4.9. Others
- 9.5. Middle East & Africa Thermal Interface Material Market Analysis, Opportunity and Forecast, By Chemistry, 2016-2032
- 9.5.1. Middle East & Africa Thermal Interface Material Market Analysis by Chemistry: Introduction
- 9.5.2. Market Size Absolute $ Opportunity Analysis and Forecast, By Chemistry, 2016-2032
- 9.5.3. Silicone
- 9.5.4. Epoxy
- 9.5.5. Polyimide
- 9.6. Middle East & Africa Thermal Interface Material Market Analysis, Opportunity and Forecast, By Country , 2016-2032
- 9.6.1. Middle East & Africa Thermal Interface Material Market Analysis by Country : Introduction
- 9.6.2. Market Size Absolute $ Opportunity Analysis and Forecast, Country , 2016-2032
- 9.6.2.1. Algeria
- 9.6.2.2. Egypt
- 9.6.2.3. Israel
- 9.6.2.4. Kuwait
- 9.6.2.5. Nigeria
- 9.6.2.6. Saudi Arabia
- 9.6.2.7. South Africa
- 9.6.2.8. Turkey
- 9.6.2.9. The UAE
- 9.6.2.10. Rest of MEA
- 10. Global Thermal Interface Material Market Analysis, Opportunity and Forecast, By Region , 2016-2032
- 10.1. Global Thermal Interface Material Market Analysis by Region : Introduction
- 10.2. Market Size Absolute $ Opportunity Analysis and Forecast, By Region , 2016-2032
- 10.2.1. North America
- 10.2.2. Western Europe
- 10.2.3. Eastern Europe
- 10.2.4. APAC
- 10.2.5. Latin America
- 10.2.6. Middle East & Africa
- 11. Global Thermal Interface Material Market Competitive Landscape, Market Share Analysis, and Company Profiles
- 11.1. Market Share Analysis
- 11.2. Company Profiles
- 11.3. Henkel Corporation
- 11.3.1. Company Overview
- 11.3.2. Financial Highlights
- 11.3.3. Product Portfolio
- 11.3.4. SWOT Analysis
- 11.3.5. Key Strategies and Developments
- 11.4. Bergquist Company
- 11.4.1. Company Overview
- 11.4.2. Financial Highlights
- 11.4.3. Product Portfolio
- 11.4.4. SWOT Analysis
- 11.4.5. Key Strategies and Developments
- 11.5. Indium Corporation
- 11.5.1. Company Overview
- 11.5.2. Financial Highlights
- 11.5.3. Product Portfolio
- 11.5.4. SWOT Analysis
- 11.5.5. Key Strategies and Developments
- 11.6. Parker Chomerics
- 11.6.1. Company Overview
- 11.6.2. Financial Highlights
- 11.6.3. Product Portfolio
- 11.6.4. SWOT Analysis
- 11.6.5. Key Strategies and Developments
- 11.7. Dow Corning Corporation
- 11.7.1. Company Overview
- 11.7.2. Financial Highlights
- 11.7.3. Product Portfolio
- 11.7.4. SWOT Analysis
- 11.7.5. Key Strategies and Developments
- 11.8. Laird Technologies Inc.
- 11.8.1. Company Overview
- 11.8.2. Financial Highlights
- 11.8.3. Product Portfolio
- 11.8.4. SWOT Analysis
- 11.8.5. Key Strategies and Developments
- 11.9. Momentive Performance Materials Inc
- 11.9.1. Company Overview
- 11.9.2. Financial Highlights
- 11.9.3. Product Portfolio
- 11.9.4. SWOT Analysis
- 11.9.5. Key Strategies and Developments
- 11.10. Zalman Tech Corporation Limited.
- 11.10.1. Company Overview
- 11.10.2. Financial Highlights
- 11.10.3. Product Portfolio
- 11.10.4. SWOT Analysis
- 11.10.5. Key Strategies and Developments
- 11.11. 3M Company
- 11.11.1. Company Overview
- 11.11.2. Financial Highlights
- 11.11.3. Product Portfolio
- 11.11.4. SWOT Analysis
- 11.11.5. Key Strategies and Developments
- 11.12. Shin-Etsu Chemical Co., Ltd.
- 11.12.1. Company Overview
- 11.12.2. Financial Highlights
- 11.12.3. Product Portfolio
- 11.12.4. SWOT Analysis
- 11.12.5. Key Strategies and Developments
- 11.13.1. Company Overview
- 11.13.2. Financial Highlights
- 11.13.3. Product Portfolio
- 11.13.4. SWOT Analysis
- 11.13.5. Key Strategies and Developments
- 11.14. Wakefield-Vette, Inc.
- 11.14.1. Company Overview
- 11.14.2. Financial Highlights
- 11.14.3. Product Portfolio
- 11.14.4. SWOT Analysis
- 11.14.5. Key Strategies and Developments
- 11.15. Fujipoly America Corporation
- 11.15.1. Company Overview
- 11.15.2. Financial Highlights
- 11.15.3. Product Portfolio
- 11.15.4. SWOT Analysis
- 11.15.5. Key Strategies and Developments
- 11.16. Master Bond Inc.
- 11.16.1. Company Overview
- 11.16.2. Financial Highlights
- 11.16.3. Product Portfolio
- 11.16.4. SWOT Analysis
- 11.16.5. Key Strategies and Developments
- 11.17. Honeywell International Inc.
- 11.17.1. Company Overview
- 11.17.2. Financial Highlights
- 11.17.3. Product Portfolio
- 11.17.4. SWOT Analysis
- 11.17.5. Key Strategies and Developments
- 12. Assumptions and Acronyms
- 13. Research Methodology
- 14. Contact
"
- List of Figures
- "
- Figure 1: Global Thermal Interface Material Market Revenue (US$ Mn) Market Share by Material Type in 2022
- Figure 2: Global Thermal Interface Material Market Market Attractiveness Analysis by Material Type, 2016-2032
- Figure 3: Global Thermal Interface Material Market Revenue (US$ Mn) Market Share by Applicationin 2022
- Figure 4: Global Thermal Interface Material Market Market Attractiveness Analysis by Application, 2016-2032
- Figure 5: Global Thermal Interface Material Market Revenue (US$ Mn) Market Share by Chemistryin 2022
- Figure 6: Global Thermal Interface Material Market Market Attractiveness Analysis by Chemistry, 2016-2032
- Figure 7: Global Thermal Interface Material Market Revenue (US$ Mn) Market Share by Region in 2022
- Figure 8: Global Thermal Interface Material Market Market Attractiveness Analysis by Region, 2016-2032
- Figure 9: Global Thermal Interface Material Market Market Revenue (US$ Mn) (2016-2032)
- Figure 10: Global Thermal Interface Material Market Market Revenue (US$ Mn) Comparison by Region (2016-2032)
- Figure 11: Global Thermal Interface Material Market Market Revenue (US$ Mn) Comparison by Material Type (2016-2032)
- Figure 12: Global Thermal Interface Material Market Market Revenue (US$ Mn) Comparison by Application (2016-2032)
- Figure 13: Global Thermal Interface Material Market Market Revenue (US$ Mn) Comparison by Chemistry (2016-2032)
- Figure 14: Global Thermal Interface Material Market Market Y-o-Y Growth Rate Comparison by Region (2016-2032)
- Figure 15: Global Thermal Interface Material Market Market Y-o-Y Growth Rate Comparison by Material Type (2016-2032)
- Figure 16: Global Thermal Interface Material Market Market Y-o-Y Growth Rate Comparison by Application (2016-2032)
- Figure 17: Global Thermal Interface Material Market Market Y-o-Y Growth Rate Comparison by Chemistry (2016-2032)
- Figure 18: Global Thermal Interface Material Market Market Share Comparison by Region (2016-2032)
- Figure 19: Global Thermal Interface Material Market Market Share Comparison by Material Type (2016-2032)
- Figure 20: Global Thermal Interface Material Market Market Share Comparison by Application (2016-2032)
- Figure 21: Global Thermal Interface Material Market Market Share Comparison by Chemistry (2016-2032)
- Figure 22: North America Thermal Interface Material Market Revenue (US$ Mn) Market Share by Material Typein 2022
- Figure 23: North America Thermal Interface Material Market Market Attractiveness Analysis by Material Type, 2016-2032
- Figure 24: North America Thermal Interface Material Market Revenue (US$ Mn) Market Share by Applicationin 2022
- Figure 25: North America Thermal Interface Material Market Market Attractiveness Analysis by Application, 2016-2032
- Figure 26: North America Thermal Interface Material Market Revenue (US$ Mn) Market Share by Chemistryin 2022
- Figure 27: North America Thermal Interface Material Market Market Attractiveness Analysis by Chemistry, 2016-2032
- Figure 28: North America Thermal Interface Material Market Revenue (US$ Mn) Market Share by Country in 2022
- Figure 29: North America Thermal Interface Material Market Market Attractiveness Analysis by Country, 2016-2032
- Figure 30: North America Thermal Interface Material Market Market Revenue (US$ Mn) (2016-2032)
- Figure 31: North America Thermal Interface Material Market Market Revenue (US$ Mn) Comparison by Country (2016-2032)
- Figure 32: North America Thermal Interface Material Market Market Revenue (US$ Mn) Comparison by Material Type (2016-2032)
- Figure 33: North America Thermal Interface Material Market Market Revenue (US$ Mn) Comparison by Application (2016-2032)
- Figure 34: North America Thermal Interface Material Market Market Revenue (US$ Mn) Comparison by Chemistry (2016-2032)
- Figure 35: North America Thermal Interface Material Market Market Y-o-Y Growth Rate Comparison by Country (2016-2032)
- Figure 36: North America Thermal Interface Material Market Market Y-o-Y Growth Rate Comparison by Material Type (2016-2032)
- Figure 37: North America Thermal Interface Material Market Market Y-o-Y Growth Rate Comparison by Application (2016-2032)
- Figure 38: North America Thermal Interface Material Market Market Y-o-Y Growth Rate Comparison by Chemistry (2016-2032)
- Figure 39: North America Thermal Interface Material Market Market Share Comparison by Country (2016-2032)
- Figure 40: North America Thermal Interface Material Market Market Share Comparison by Material Type (2016-2032)
- Figure 41: North America Thermal Interface Material Market Market Share Comparison by Application (2016-2032)
- Figure 42: North America Thermal Interface Material Market Market Share Comparison by Chemistry (2016-2032)
- Figure 43: Western Europe Thermal Interface Material Market Revenue (US$ Mn) Market Share by Material Typein 2022
- Figure 44: Western Europe Thermal Interface Material Market Market Attractiveness Analysis by Material Type, 2016-2032
- Figure 45: Western Europe Thermal Interface Material Market Revenue (US$ Mn) Market Share by Applicationin 2022
- Figure 46: Western Europe Thermal Interface Material Market Market Attractiveness Analysis by Application, 2016-2032
- Figure 47: Western Europe Thermal Interface Material Market Revenue (US$ Mn) Market Share by Chemistryin 2022
- Figure 48: Western Europe Thermal Interface Material Market Market Attractiveness Analysis by Chemistry, 2016-2032
- Figure 49: Western Europe Thermal Interface Material Market Revenue (US$ Mn) Market Share by Country in 2022
- Figure 50: Western Europe Thermal Interface Material Market Market Attractiveness Analysis by Country, 2016-2032
- Figure 51: Western Europe Thermal Interface Material Market Market Revenue (US$ Mn) (2016-2032)
- Figure 52: Western Europe Thermal Interface Material Market Market Revenue (US$ Mn) Comparison by Country (2016-2032)
- Figure 53: Western Europe Thermal Interface Material Market Market Revenue (US$ Mn) Comparison by Material Type (2016-2032)
- Figure 54: Western Europe Thermal Interface Material Market Market Revenue (US$ Mn) Comparison by Application (2016-2032)
- Figure 55: Western Europe Thermal Interface Material Market Market Revenue (US$ Mn) Comparison by Chemistry (2016-2032)
- Figure 56: Western Europe Thermal Interface Material Market Market Y-o-Y Growth Rate Comparison by Country (2016-2032)
- Figure 57: Western Europe Thermal Interface Material Market Market Y-o-Y Growth Rate Comparison by Material Type (2016-2032)
- Figure 58: Western Europe Thermal Interface Material Market Market Y-o-Y Growth Rate Comparison by Application (2016-2032)
- Figure 59: Western Europe Thermal Interface Material Market Market Y-o-Y Growth Rate Comparison by Chemistry (2016-2032)
- Figure 60: Western Europe Thermal Interface Material Market Market Share Comparison by Country (2016-2032)
- Figure 61: Western Europe Thermal Interface Material Market Market Share Comparison by Material Type (2016-2032)
- Figure 62: Western Europe Thermal Interface Material Market Market Share Comparison by Application (2016-2032)
- Figure 63: Western Europe Thermal Interface Material Market Market Share Comparison by Chemistry (2016-2032)
- Figure 64: Eastern Europe Thermal Interface Material Market Revenue (US$ Mn) Market Share by Material Typein 2022
- Figure 65: Eastern Europe Thermal Interface Material Market Market Attractiveness Analysis by Material Type, 2016-2032
- Figure 66: Eastern Europe Thermal Interface Material Market Revenue (US$ Mn) Market Share by Applicationin 2022
- Figure 67: Eastern Europe Thermal Interface Material Market Market Attractiveness Analysis by Application, 2016-2032
- Figure 68: Eastern Europe Thermal Interface Material Market Revenue (US$ Mn) Market Share by Chemistryin 2022
- Figure 69: Eastern Europe Thermal Interface Material Market Market Attractiveness Analysis by Chemistry, 2016-2032
- Figure 70: Eastern Europe Thermal Interface Material Market Revenue (US$ Mn) Market Share by Country in 2022
- Figure 71: Eastern Europe Thermal Interface Material Market Market Attractiveness Analysis by Country, 2016-2032
- Figure 72: Eastern Europe Thermal Interface Material Market Market Revenue (US$ Mn) (2016-2032)
- Figure 73: Eastern Europe Thermal Interface Material Market Market Revenue (US$ Mn) Comparison by Country (2016-2032)
- Figure 74: Eastern Europe Thermal Interface Material Market Market Revenue (US$ Mn) Comparison by Material Type (2016-2032)
- Figure 75: Eastern Europe Thermal Interface Material Market Market Revenue (US$ Mn) Comparison by Application (2016-2032)
- Figure 76: Eastern Europe Thermal Interface Material Market Market Revenue (US$ Mn) Comparison by Chemistry (2016-2032)
- Figure 77: Eastern Europe Thermal Interface Material Market Market Y-o-Y Growth Rate Comparison by Country (2016-2032)
- Figure 78: Eastern Europe Thermal Interface Material Market Market Y-o-Y Growth Rate Comparison by Material Type (2016-2032)
- Figure 79: Eastern Europe Thermal Interface Material Market Market Y-o-Y Growth Rate Comparison by Application (2016-2032)
- Figure 80: Eastern Europe Thermal Interface Material Market Market Y-o-Y Growth Rate Comparison by Chemistry (2016-2032)
- Figure 81: Eastern Europe Thermal Interface Material Market Market Share Comparison by Country (2016-2032)
- Figure 82: Eastern Europe Thermal Interface Material Market Market Share Comparison by Material Type (2016-2032)
- Figure 83: Eastern Europe Thermal Interface Material Market Market Share Comparison by Application (2016-2032)
- Figure 84: Eastern Europe Thermal Interface Material Market Market Share Comparison by Chemistry (2016-2032)
- Figure 85: APAC Thermal Interface Material Market Revenue (US$ Mn) Market Share by Material Typein 2022
- Figure 86: APAC Thermal Interface Material Market Market Attractiveness Analysis by Material Type, 2016-2032
- Figure 87: APAC Thermal Interface Material Market Revenue (US$ Mn) Market Share by Applicationin 2022
- Figure 88: APAC Thermal Interface Material Market Market Attractiveness Analysis by Application, 2016-2032
- Figure 89: APAC Thermal Interface Material Market Revenue (US$ Mn) Market Share by Chemistryin 2022
- Figure 90: APAC Thermal Interface Material Market Market Attractiveness Analysis by Chemistry, 2016-2032
- Figure 91: APAC Thermal Interface Material Market Revenue (US$ Mn) Market Share by Country in 2022
- Figure 92: APAC Thermal Interface Material Market Market Attractiveness Analysis by Country, 2016-2032
- Figure 93: APAC Thermal Interface Material Market Market Revenue (US$ Mn) (2016-2032)
- Figure 94: APAC Thermal Interface Material Market Market Revenue (US$ Mn) Comparison by Country (2016-2032)
- Figure 95: APAC Thermal Interface Material Market Market Revenue (US$ Mn) Comparison by Material Type (2016-2032)
- Figure 96: APAC Thermal Interface Material Market Market Revenue (US$ Mn) Comparison by Application (2016-2032)
- Figure 97: APAC Thermal Interface Material Market Market Revenue (US$ Mn) Comparison by Chemistry (2016-2032)
- Figure 98: APAC Thermal Interface Material Market Market Y-o-Y Growth Rate Comparison by Country (2016-2032)
- Figure 99: APAC Thermal Interface Material Market Market Y-o-Y Growth Rate Comparison by Material Type (2016-2032)
- Figure 100: APAC Thermal Interface Material Market Market Y-o-Y Growth Rate Comparison by Application (2016-2032)
- Figure 101: APAC Thermal Interface Material Market Market Y-o-Y Growth Rate Comparison by Chemistry (2016-2032)
- Figure 102: APAC Thermal Interface Material Market Market Share Comparison by Country (2016-2032)
- Figure 103: APAC Thermal Interface Material Market Market Share Comparison by Material Type (2016-2032)
- Figure 104: APAC Thermal Interface Material Market Market Share Comparison by Application (2016-2032)
- Figure 105: APAC Thermal Interface Material Market Market Share Comparison by Chemistry (2016-2032)
- Figure 106: Latin America Thermal Interface Material Market Revenue (US$ Mn) Market Share by Material Typein 2022
- Figure 107: Latin America Thermal Interface Material Market Market Attractiveness Analysis by Material Type, 2016-2032
- Figure 108: Latin America Thermal Interface Material Market Revenue (US$ Mn) Market Share by Applicationin 2022
- Figure 109: Latin America Thermal Interface Material Market Market Attractiveness Analysis by Application, 2016-2032
- Figure 110: Latin America Thermal Interface Material Market Revenue (US$ Mn) Market Share by Chemistryin 2022
- Figure 111: Latin America Thermal Interface Material Market Market Attractiveness Analysis by Chemistry, 2016-2032
- Figure 112: Latin America Thermal Interface Material Market Revenue (US$ Mn) Market Share by Country in 2022
- Figure 113: Latin America Thermal Interface Material Market Market Attractiveness Analysis by Country, 2016-2032
- Figure 114: Latin America Thermal Interface Material Market Market Revenue (US$ Mn) (2016-2032)
- Figure 115: Latin America Thermal Interface Material Market Market Revenue (US$ Mn) Comparison by Country (2016-2032)
- Figure 116: Latin America Thermal Interface Material Market Market Revenue (US$ Mn) Comparison by Material Type (2016-2032)
- Figure 117: Latin America Thermal Interface Material Market Market Revenue (US$ Mn) Comparison by Application (2016-2032)
- Figure 118: Latin America Thermal Interface Material Market Market Revenue (US$ Mn) Comparison by Chemistry (2016-2032)
- Figure 119: Latin America Thermal Interface Material Market Market Y-o-Y Growth Rate Comparison by Country (2016-2032)
- Figure 120: Latin America Thermal Interface Material Market Market Y-o-Y Growth Rate Comparison by Material Type (2016-2032)
- Figure 121: Latin America Thermal Interface Material Market Market Y-o-Y Growth Rate Comparison by Application (2016-2032)
- Figure 122: Latin America Thermal Interface Material Market Market Y-o-Y Growth Rate Comparison by Chemistry (2016-2032)
- Figure 123: Latin America Thermal Interface Material Market Market Share Comparison by Country (2016-2032)
- Figure 124: Latin America Thermal Interface Material Market Market Share Comparison by Material Type (2016-2032)
- Figure 125: Latin America Thermal Interface Material Market Market Share Comparison by Application (2016-2032)
- Figure 126: Latin America Thermal Interface Material Market Market Share Comparison by Chemistry (2016-2032)
- Figure 127: Middle East & Africa Thermal Interface Material Market Revenue (US$ Mn) Market Share by Material Typein 2022
- Figure 128: Middle East & Africa Thermal Interface Material Market Market Attractiveness Analysis by Material Type, 2016-2032
- Figure 129: Middle East & Africa Thermal Interface Material Market Revenue (US$ Mn) Market Share by Applicationin 2022
- Figure 130: Middle East & Africa Thermal Interface Material Market Market Attractiveness Analysis by Application, 2016-2032
- Figure 131: Middle East & Africa Thermal Interface Material Market Revenue (US$ Mn) Market Share by Chemistryin 2022
- Figure 132: Middle East & Africa Thermal Interface Material Market Market Attractiveness Analysis by Chemistry, 2016-2032
- Figure 133: Middle East & Africa Thermal Interface Material Market Revenue (US$ Mn) Market Share by Country in 2022
- Figure 134: Middle East & Africa Thermal Interface Material Market Market Attractiveness Analysis by Country, 2016-2032
- Figure 135: Middle East & Africa Thermal Interface Material Market Market Revenue (US$ Mn) (2016-2032)
- Figure 136: Middle East & Africa Thermal Interface Material Market Market Revenue (US$ Mn) Comparison by Country (2016-2032)
- Figure 137: Middle East & Africa Thermal Interface Material Market Market Revenue (US$ Mn) Comparison by Material Type (2016-2032)
- Figure 138: Middle East & Africa Thermal Interface Material Market Market Revenue (US$ Mn) Comparison by Application (2016-2032)
- Figure 139: Middle East & Africa Thermal Interface Material Market Market Revenue (US$ Mn) Comparison by Chemistry (2016-2032)
- Figure 140: Middle East & Africa Thermal Interface Material Market Market Y-o-Y Growth Rate Comparison by Country (2016-2032)
- Figure 141: Middle East & Africa Thermal Interface Material Market Market Y-o-Y Growth Rate Comparison by Material Type (2016-2032)
- Figure 142: Middle East & Africa Thermal Interface Material Market Market Y-o-Y Growth Rate Comparison by Application (2016-2032)
- Figure 143: Middle East & Africa Thermal Interface Material Market Market Y-o-Y Growth Rate Comparison by Chemistry (2016-2032)
- Figure 144: Middle East & Africa Thermal Interface Material Market Market Share Comparison by Country (2016-2032)
- Figure 145: Middle East & Africa Thermal Interface Material Market Market Share Comparison by Material Type (2016-2032)
- Figure 146: Middle East & Africa Thermal Interface Material Market Market Share Comparison by Application (2016-2032)
- Figure 147: Middle East & Africa Thermal Interface Material Market Market Share Comparison by Chemistry (2016-2032)
"
- List of Tables
- "
- Table 1: Global Thermal Interface Material Market Market Comparison by Material Type (2016-2032)
- Table 2: Global Thermal Interface Material Market Market Comparison by Application (2016-2032)
- Table 3: Global Thermal Interface Material Market Market Comparison by Chemistry (2016-2032)
- Table 4: Global Thermal Interface Material Market Revenue (US$ Mn) Comparison by Region (2016-2032)
- Table 5: Global Thermal Interface Material Market Market Revenue (US$ Mn) (2016-2032)
- Table 6: Global Thermal Interface Material Market Market Revenue (US$ Mn) Comparison by Region (2016-2032)
- Table 7: Global Thermal Interface Material Market Market Revenue (US$ Mn) Comparison by Material Type (2016-2032)
- Table 8: Global Thermal Interface Material Market Market Revenue (US$ Mn) Comparison by Application (2016-2032)
- Table 9: Global Thermal Interface Material Market Market Revenue (US$ Mn) Comparison by Chemistry (2016-2032)
- Table 10: Global Thermal Interface Material Market Market Y-o-Y Growth Rate Comparison by Region (2016-2032)
- Table 11: Global Thermal Interface Material Market Market Y-o-Y Growth Rate Comparison by Material Type (2016-2032)
- Table 12: Global Thermal Interface Material Market Market Y-o-Y Growth Rate Comparison by Application (2016-2032)
- Table 13: Global Thermal Interface Material Market Market Y-o-Y Growth Rate Comparison by Chemistry (2016-2032)
- Table 14: Global Thermal Interface Material Market Market Share Comparison by Region (2016-2032)
- Table 15: Global Thermal Interface Material Market Market Share Comparison by Material Type (2016-2032)
- Table 16: Global Thermal Interface Material Market Market Share Comparison by Application (2016-2032)
- Table 17: Global Thermal Interface Material Market Market Share Comparison by Chemistry (2016-2032)
- Table 18: North America Thermal Interface Material Market Market Comparison by Application (2016-2032)
- Table 19: North America Thermal Interface Material Market Market Comparison by Chemistry (2016-2032)
- Table 20: North America Thermal Interface Material Market Revenue (US$ Mn) Comparison by Country (2016-2032)
- Table 21: North America Thermal Interface Material Market Market Revenue (US$ Mn) (2016-2032)
- Table 22: North America Thermal Interface Material Market Market Revenue (US$ Mn) Comparison by Country (2016-2032)
- Table 23: North America Thermal Interface Material Market Market Revenue (US$ Mn) Comparison by Material Type (2016-2032)
- Table 24: North America Thermal Interface Material Market Market Revenue (US$ Mn) Comparison by Application (2016-2032)
- Table 25: North America Thermal Interface Material Market Market Revenue (US$ Mn) Comparison by Chemistry (2016-2032)
- Table 26: North America Thermal Interface Material Market Market Y-o-Y Growth Rate Comparison by Country (2016-2032)
- Table 27: North America Thermal Interface Material Market Market Y-o-Y Growth Rate Comparison by Material Type (2016-2032)
- Table 28: North America Thermal Interface Material Market Market Y-o-Y Growth Rate Comparison by Application (2016-2032)
- Table 29: North America Thermal Interface Material Market Market Y-o-Y Growth Rate Comparison by Chemistry (2016-2032)
- Table 30: North America Thermal Interface Material Market Market Share Comparison by Country (2016-2032)
- Table 31: North America Thermal Interface Material Market Market Share Comparison by Material Type (2016-2032)
- Table 32: North America Thermal Interface Material Market Market Share Comparison by Application (2016-2032)
- Table 33: North America Thermal Interface Material Market Market Share Comparison by Chemistry (2016-2032)
- Table 34: Western Europe Thermal Interface Material Market Market Comparison by Material Type (2016-2032)
- Table 35: Western Europe Thermal Interface Material Market Market Comparison by Application (2016-2032)
- Table 36: Western Europe Thermal Interface Material Market Market Comparison by Chemistry (2016-2032)
- Table 37: Western Europe Thermal Interface Material Market Revenue (US$ Mn) Comparison by Country (2016-2032)
- Table 38: Western Europe Thermal Interface Material Market Market Revenue (US$ Mn) (2016-2032)
- Table 39: Western Europe Thermal Interface Material Market Market Revenue (US$ Mn) Comparison by Country (2016-2032)
- Table 40: Western Europe Thermal Interface Material Market Market Revenue (US$ Mn) Comparison by Material Type (2016-2032)
- Table 41: Western Europe Thermal Interface Material Market Market Revenue (US$ Mn) Comparison by Application (2016-2032)
- Table 42: Western Europe Thermal Interface Material Market Market Revenue (US$ Mn) Comparison by Chemistry (2016-2032)
- Table 43: Western Europe Thermal Interface Material Market Market Y-o-Y Growth Rate Comparison by Country (2016-2032)
- Table 44: Western Europe Thermal Interface Material Market Market Y-o-Y Growth Rate Comparison by Material Type (2016-2032)
- Table 45: Western Europe Thermal Interface Material Market Market Y-o-Y Growth Rate Comparison by Application (2016-2032)
- Table 46: Western Europe Thermal Interface Material Market Market Y-o-Y Growth Rate Comparison by Chemistry (2016-2032)
- Table 47: Western Europe Thermal Interface Material Market Market Share Comparison by Country (2016-2032)
- Table 48: Western Europe Thermal Interface Material Market Market Share Comparison by Material Type (2016-2032)
- Table 49: Western Europe Thermal Interface Material Market Market Share Comparison by Application (2016-2032)
- Table 50: Western Europe Thermal Interface Material Market Market Share Comparison by Chemistry (2016-2032)
- Table 51: Eastern Europe Thermal Interface Material Market Market Comparison by Material Type (2016-2032)
- Table 52: Eastern Europe Thermal Interface Material Market Market Comparison by Application (2016-2032)
- Table 53: Eastern Europe Thermal Interface Material Market Market Comparison by Chemistry (2016-2032)
- Table 54: Eastern Europe Thermal Interface Material Market Revenue (US$ Mn) Comparison by Country (2016-2032)
- Table 55: Eastern Europe Thermal Interface Material Market Market Revenue (US$ Mn) (2016-2032)
- Table 56: Eastern Europe Thermal Interface Material Market Market Revenue (US$ Mn) Comparison by Country (2016-2032)
- Table 57: Eastern Europe Thermal Interface Material Market Market Revenue (US$ Mn) Comparison by Material Type (2016-2032)
- Table 58: Eastern Europe Thermal Interface Material Market Market Revenue (US$ Mn) Comparison by Application (2016-2032)
- Table 59: Eastern Europe Thermal Interface Material Market Market Revenue (US$ Mn) Comparison by Chemistry (2016-2032)
- Table 60: Eastern Europe Thermal Interface Material Market Market Y-o-Y Growth Rate Comparison by Country (2016-2032)
- Table 61: Eastern Europe Thermal Interface Material Market Market Y-o-Y Growth Rate Comparison by Material Type (2016-2032)
- Table 62: Eastern Europe Thermal Interface Material Market Market Y-o-Y Growth Rate Comparison by Application (2016-2032)
- Table 63: Eastern Europe Thermal Interface Material Market Market Y-o-Y Growth Rate Comparison by Chemistry (2016-2032)
- Table 64: Eastern Europe Thermal Interface Material Market Market Share Comparison by Country (2016-2032)
- Table 65: Eastern Europe Thermal Interface Material Market Market Share Comparison by Material Type (2016-2032)
- Table 66: Eastern Europe Thermal Interface Material Market Market Share Comparison by Application (2016-2032)
- Table 67: Eastern Europe Thermal Interface Material Market Market Share Comparison by Chemistry (2016-2032)
- Table 68: APAC Thermal Interface Material Market Market Comparison by Material Type (2016-2032)
- Table 69: APAC Thermal Interface Material Market Market Comparison by Application (2016-2032)
- Table 70: APAC Thermal Interface Material Market Market Comparison by Chemistry (2016-2032)
- Table 71: APAC Thermal Interface Material Market Revenue (US$ Mn) Comparison by Country (2016-2032)
- Table 72: APAC Thermal Interface Material Market Market Revenue (US$ Mn) (2016-2032)
- Table 73: APAC Thermal Interface Material Market Market Revenue (US$ Mn) Comparison by Country (2016-2032)
- Table 74: APAC Thermal Interface Material Market Market Revenue (US$ Mn) Comparison by Material Type (2016-2032)
- Table 75: APAC Thermal Interface Material Market Market Revenue (US$ Mn) Comparison by Application (2016-2032)
- Table 76: APAC Thermal Interface Material Market Market Revenue (US$ Mn) Comparison by Chemistry (2016-2032)
- Table 77: APAC Thermal Interface Material Market Market Y-o-Y Growth Rate Comparison by Country (2016-2032)
- Table 78: APAC Thermal Interface Material Market Market Y-o-Y Growth Rate Comparison by Material Type (2016-2032)
- Table 79: APAC Thermal Interface Material Market Market Y-o-Y Growth Rate Comparison by Application (2016-2032)
- Table 80: APAC Thermal Interface Material Market Market Y-o-Y Growth Rate Comparison by Chemistry (2016-2032)
- Table 81: APAC Thermal Interface Material Market Market Share Comparison by Country (2016-2032)
- Table 82: APAC Thermal Interface Material Market Market Share Comparison by Material Type (2016-2032)
- Table 83: APAC Thermal Interface Material Market Market Share Comparison by Application (2016-2032)
- Table 84: APAC Thermal Interface Material Market Market Share Comparison by Chemistry (2016-2032)
- Table 85: Latin America Thermal Interface Material Market Market Comparison by Material Type (2016-2032)
- Table 86: Latin America Thermal Interface Material Market Market Comparison by Application (2016-2032)
- Table 87: Latin America Thermal Interface Material Market Market Comparison by Chemistry (2016-2032)
- Table 88: Latin America Thermal Interface Material Market Revenue (US$ Mn) Comparison by Country (2016-2032)
- Table 89: Latin America Thermal Interface Material Market Market Revenue (US$ Mn) (2016-2032)
- Table 90: Latin America Thermal Interface Material Market Market Revenue (US$ Mn) Comparison by Country (2016-2032)
- Table 91: Latin America Thermal Interface Material Market Market Revenue (US$ Mn) Comparison by Material Type (2016-2032)
- Table 92: Latin America Thermal Interface Material Market Market Revenue (US$ Mn) Comparison by Application (2016-2032)
- Table 93: Latin America Thermal Interface Material Market Market Revenue (US$ Mn) Comparison by Chemistry (2016-2032)
- Table 94: Latin America Thermal Interface Material Market Market Y-o-Y Growth Rate Comparison by Country (2016-2032)
- Table 95: Latin America Thermal Interface Material Market Market Y-o-Y Growth Rate Comparison by Material Type (2016-2032)
- Table 96: Latin America Thermal Interface Material Market Market Y-o-Y Growth Rate Comparison by Application (2016-2032)
- Table 97: Latin America Thermal Interface Material Market Market Y-o-Y Growth Rate Comparison by Chemistry (2016-2032)
- Table 98: Latin America Thermal Interface Material Market Market Share Comparison by Country (2016-2032)
- Table 99: Latin America Thermal Interface Material Market Market Share Comparison by Material Type (2016-2032)
- Table 100: Latin America Thermal Interface Material Market Market Share Comparison by Application (2016-2032)
- Table 101: Latin America Thermal Interface Material Market Market Share Comparison by Chemistry (2016-2032)
- Table 102: Middle East & Africa Thermal Interface Material Market Market Comparison by Material Type (2016-2032)
- Table 103: Middle East & Africa Thermal Interface Material Market Market Comparison by Application (2016-2032)
- Table 104: Middle East & Africa Thermal Interface Material Market Market Comparison by Chemistry (2016-2032)
- Table 105: Middle East & Africa Thermal Interface Material Market Revenue (US$ Mn) Comparison by Country (2016-2032)
- Table 106: Middle East & Africa Thermal Interface Material Market Market Revenue (US$ Mn) (2016-2032)
- Table 107: Middle East & Africa Thermal Interface Material Market Market Revenue (US$ Mn) Comparison by Country (2016-2032)
- Table 108: Middle East & Africa Thermal Interface Material Market Market Revenue (US$ Mn) Comparison by Material Type (2016-2032)
- Table 109: Middle East & Africa Thermal Interface Material Market Market Revenue (US$ Mn) Comparison by Application (2016-2032)
- Table 110: Middle East & Africa Thermal Interface Material Market Market Revenue (US$ Mn) Comparison by Chemistry (2016-2032)
- Table 111: Middle East & Africa Thermal Interface Material Market Market Y-o-Y Growth Rate Comparison by Country (2016-2032)
- Table 112: Middle East & Africa Thermal Interface Material Market Market Y-o-Y Growth Rate Comparison by Material Type (2016-2032)
- Table 113: Middle East & Africa Thermal Interface Material Market Market Y-o-Y Growth Rate Comparison by Application (2016-2032)
- Table 114: Middle East & Africa Thermal Interface Material Market Market Y-o-Y Growth Rate Comparison by Chemistry (2016-2032)
- Table 115: Middle East & Africa Thermal Interface Material Market Market Share Comparison by Country (2016-2032)
- Table 116: Middle East & Africa Thermal Interface Material Market Market Share Comparison by Material Type (2016-2032)
- Table 117: Middle East & Africa Thermal Interface Material Market Market Share Comparison by Application (2016-2032)
- Table 118: Middle East & Africa Thermal Interface Material Market Market Share Comparison by Chemistry (2016-2032)
- 1. Executive Summary
-
- Henkel Corporation
- Bergquist Company
- Indium Corporation
- Parker Chomerics
- Dow Corning Corporation
- Laird Technologies Inc.
- Momentive Performance Materials Inc
- Zalman Tech Corporation Limited.
- 3M Company
- Shin-Etsu Chemical Co., Ltd.
- Wakefield-Vette, Inc.
- Panasonic CorporationArctic Silver, Inc.
- Fujipoly America Corporation
- Master Bond Inc.
- Honeywell International Inc.
Our Clients


View Our Licence Options
