Sulfamic Acid Market Report By Form (Crystals & Powder, Liquid, Tablets), By Application Type (Cleaning Agents, Water Treatment, Electroplating, Dye and Pigment Manufacturing, Paper and Pulp Industry, Pharmaceuticals, and Others)By Region and Companies - Industry Segment Outlook, Market Assessment, Competition Scenario, Trends and Forecast 2024-2033
-
26681
-
Feb 2024
-
177
-


-
This report was compiled by Shreyas Rokade Shreyas Rokade is a seasoned Research Analyst with CMFE, bringing extensive expertise in market research and consulting, with a strong background in Chemical Engineering. Correspondence Team Lead-CMFE Linkedin | Detailed Market research Methodology Our methodology involves a mix of primary research, including interviews with leading mental health experts, and secondary research from reputable medical journals and databases. View Detailed Methodology Page
-
Quick Navigation
Report Overview
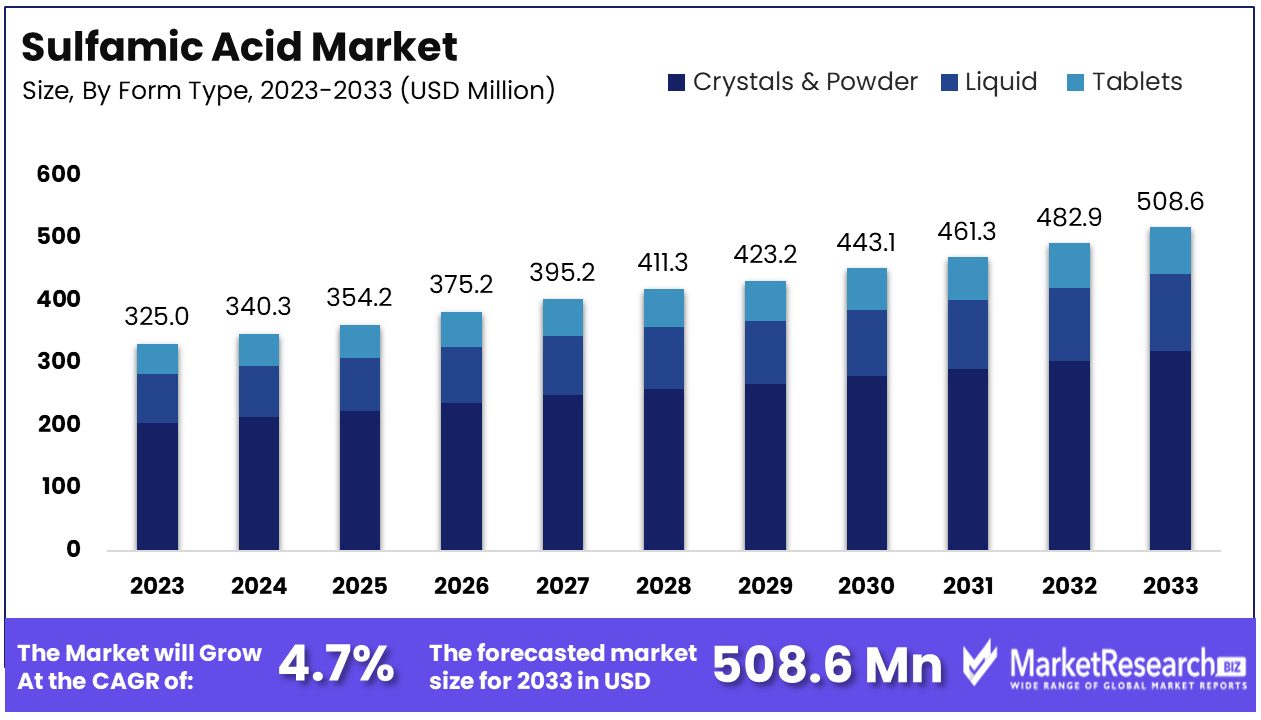
The Global Sulfamic Acid Market size is expected to be worth around USD 508.6 Million by 2033, from USD 325 Million in 2023, growing at a CAGR of 4.70% during the forecast period from 2024 to 2033.
The Sulfamic Acid Market revolves around the production and distribution of sulfamic acid, a versatile compound widely used across various industries.
Primarily recognized for its application as a cleaning agent in household and industrial settings, sulfamic acid is also crucial in the manufacturing of dyes, sweeteners, and pharmaceuticals. Its effectiveness in descaling and cleaning, especially in water treatment and dairy industries, positions it as a vital chemical solution.
The Sulfamic Acid Market is experiencing significant growth, driven by its extensive application across multiple sectors. This compound, known for its descaling and cleaning properties, is indispensable in industries such as water treatment, pulp and paper, and dairy processing.
Furthermore, its role in the production of dyes, pharmaceuticals, and sweeteners underscores its versatility and essential nature. The market's expansion is further supported by the rising demand for efficient, environmentally friendly cleaning agents, particularly in the context of increasing environmental regulations and sustainability goals.
Innovations in product application and development are key factors propelling the market forward. Companies are investing in research to broaden sulfamic acid's utility, enhancing its effectiveness and safety profile. This, coupled with growing industrialization and the subsequent need for water treatment solutions in emerging economies, presents substantial opportunities for market players.
Strategic investments in production efficiency, coupled with efforts to expand applications in eco-friendly products, will likely drive the market's expansion. Staying abreast of technological advancements, regulatory changes, and market demand shifts will be crucial for capitalizing on the opportunities within the sulfamic acid market.
Key Takeaways
- Market Growth: The sulfamic acid market is projected to reach USD 508.6 million by 2033, with a CAGR of 4.70% from 2024 to 2033.
- Preferred Forms: Crystals and powders are the most used forms due to their ease of handling and precise dosage control.
- Diverse Applications: Sulfamic acid is utilized in cleaning agents, water treatment, electroplating, dye manufacturing, pharmaceuticals, and more.
- Regional Dominance: Asia Pacific holds a 36% market share, driven by industrialization and key players in the region.
- Key Players: BASF SE, The Chemours Company, and others lead the market with innovations and R&D investments.
- Commitment to R&D: Companies focus on developing sulfamic acid formulations to meet evolving market demands.
- Diverse Market Landscape: The market features a mix of global giants and specialized firms, fostering innovation and competition.
Driving Factors
Growing Demand from Water Treatment Industry Drives Market Growth
The water treatment industry's anticipated growth, projected to reach significant value by 2032, underscores the increasing demand for sulfamic acid as a critical descaling agent. This compound's effectiveness in maintaining the efficiency of boilers, cooling towers, and other industrial equipment by preventing scale formation and corrosion positions it as indispensable in water treatment processes.
Stringent regulations on industrial wastewater discharge further amplify this demand, as industries seek compliant, efficient solutions for water purification and equipment maintenance. The synergistic effect of these regulations with the compound's properties facilitates market expansion, aligning with global efforts towards environmental sustainability and industrial efficiency.
Expansion in Food and Beverage Sector Fuels Demand
The food and beverage sector's expansion, particularly in the realm of packaged foods and beverages, represents a significant driver for the sulfamic acid market. Utilized for its acid cleaning and disinfectant properties, sulfamic acid ensures the hygiene and safety of food processing equipment, directly impacting product quality and compliance with health standards.
This growing sector's requirements for stringent cleanliness contribute to the rising demand for effective, safe cleaning agents, propelling sulfamic acid's adoption in food and beverage applications.
Increase in Mining Activities Propels Market Growth
Rising mining activities, especially in emerging economies, are pivotal in driving the demand for sulfamic acid. Its application in ore flotation and mineral processing highlights its role in enhancing the efficiency and sustainability of mining operations.
As the mining sector expands, driven by global demand for minerals and metals, the need for effective processing chemicals follows suit. Sulfamic acid's contribution to this sector not only supports operational efficiency but also aligns with environmental conservation efforts, marking it as a critical component in the industry's growth factors.
Growing Use in Household Cleaners Elevates Market Potential
The expanding middle-class demographics globally lead to an increased adoption of household cleaners, thereby boosting the demand for sulfamic acid. Known for its efficacy and relatively lower toxicity, sulfamic acid is becoming a preferred ingredient in detergents, toilet bowl cleaners, and stain removers.
This trend reflects the broader consumer shift towards safer, more effective cleaning solutions, underpinning the growing market for household applications of sulfamic acid. The convergence of consumer preferences for efficiency and safety with the compound's beneficial properties catalyzes market growth, highlighting the intertwined relationship between societal trends and chemical industry dynamics.
Restraining Factors
Competition from Other Acids Restrains Market Growth
The preference for organic acids such as glycolic acid and citric acid over sulfamic acid in cleaning formulations and cosmetics is emerging as a significant challenge. These organic acids are perceived to have lower toxicity, making them more appealing for use in household cleaners and personal care sector. Glycolic acid, in particular, is gaining ground as a chemical exfoliant in cosmetics, displacing sulfamic acid in these applications.
This shift in preference is limiting the adoption of sulfamic acid, as manufacturers and consumers opt for alternatives that promise similar efficacy with reduced health risks. The competition from these acids is thus directly impacting the market potential for sulfamic acid, as its applications become more restricted in the face of safer, more environmentally friendly options.
Health and Environmental Concerns Hamper Market Expansion
Health and environmental concerns associated with sulfamic acid, particularly regarding its handling and disposal, pose substantial barriers to sulfamic acid market growth. Prolonged occupational exposure to sulfamic acid can lead to irritation of the eyes, skin, and respiratory tract, raising safety issues for workers in industries where sulfamic acid is used extensively.
Moreover, environmental worries about the improper disposal of sulfamic acid contribute to its negative perception, prompting regulatory bodies to impose stricter guidelines on its use and disposal. These regulations further complicate its widespread adoption, as industries must navigate complex compliance landscapes, potentially opting for less regulated alternatives.
Form Analysis
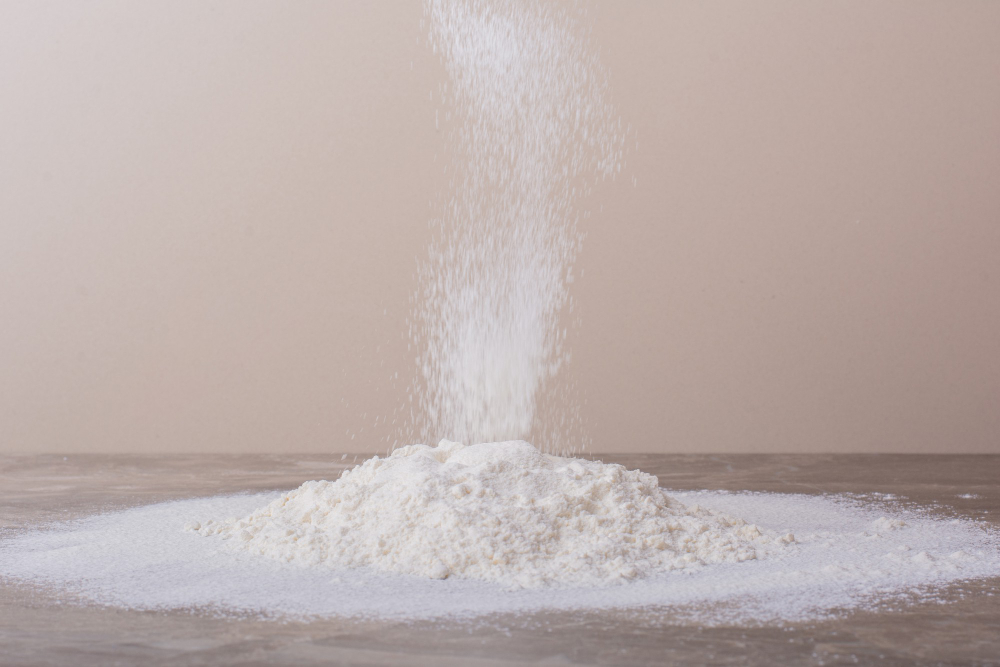
In the Sulfamic Acid Market, the form of the acid plays a crucial role in its applicability and market dominance. Among the forms—crystals, powder, liquid, and tablets—crystals and powders are the most commonly used due to their ease of handling, storage, and application in various industrial processes.
Crystalline and powdered forms of sulfamic acid offer precise dosage control and are preferred for applications requiring direct application or solution preparation. This preference is driven by the need for efficiency and effectiveness in cleaning agents, water treatment, and descaling operations, where the solid forms' solubility and reactivity are advantageous.
Liquid sulfamic acid, though less prevalent, is essential for specific applications requiring immediate application without dissolution, such as certain cleaning and descaling tasks. Tablets form, on the other hand, offers convenience and safety, reducing direct exposure risks and simplifying dosage for household and small-scale industrial applications.
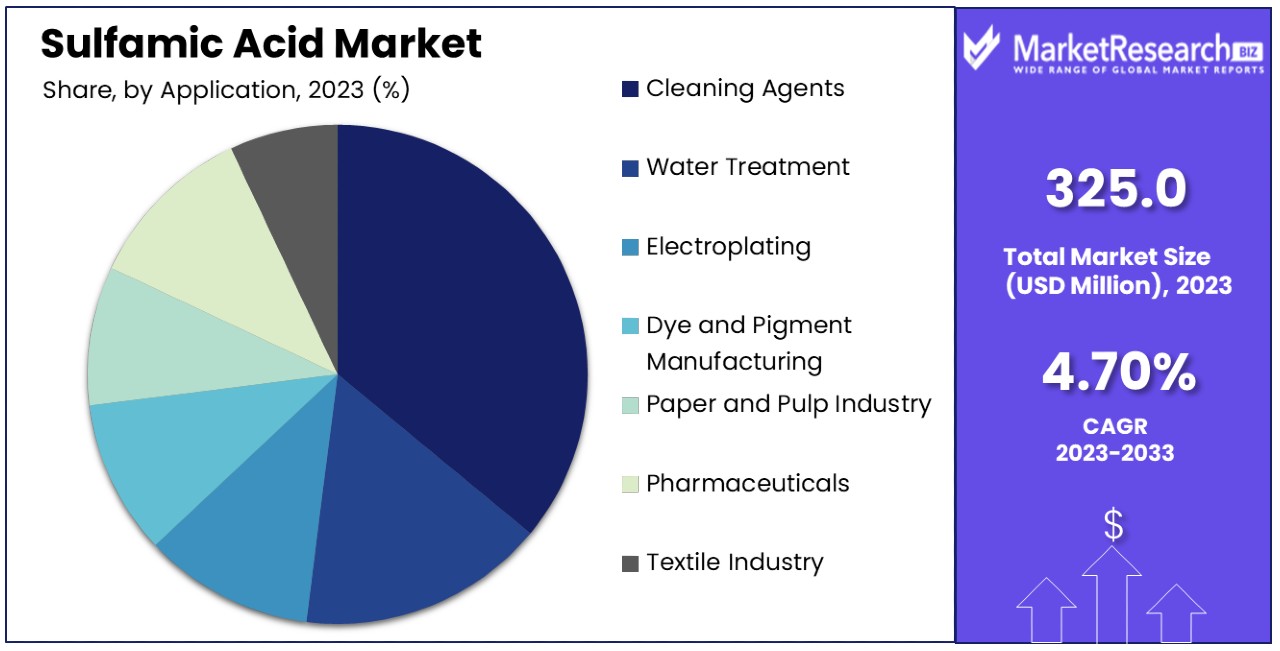
Application Type Analysis
The application of sulfamic acid spans various industries, with cleaning agents and water treatment being the dominant sub-segments. Its efficacy as a descaler and cleaner makes it invaluable in maintaining industrial equipment, household appliances, and water systems. The demand in these areas is propelled by the ongoing need for efficient, environmentally friendly cleaning solutions that comply with stringent regulatory standards.
Other significant applications include electroplating, dye and pigment manufacturing, and the paper manufacturing industry, where sulfamic acid's properties facilitate processes like metal surface treatment, colorant production, and pulp bleaching. The pharmaceutical and textile industries leverage sulfamic acid for synthesis and fabric treatment processes, highlighting its versatility.
In chemical synthesis and industrial descaling, sulfamic acid's role is expanding, driven by innovations and research finding new uses and improving existing processes. Each application segment contributes to the market's growth factors , reflecting the diverse industrial demand for sulfamic acid's unique properties.
Key Market Segments
By Form
- Crystals & Powder
- Liquid
- Tablets
By Application Type
- Cleaning Agents
- Water Treatment
- Electroplating
- Dye and Pigment Manufacturing
- Paper and Pulp Industry
- Pharmaceuticals
- Textile Industry
- Chemical Synthesis
- Industrial Descaling
Growth Opportunities
Growing Adoption in Developing Regions Offers Growth Opportunity
The rapid industrialization, mining activities, and increasing demand for cleaning products in developing regions such as Asia Pacific, Latin America, and the Middle East & Africa are creating lucrative opportunities for the Sulfamic Acid Market. These regions are witnessing significant economic growth, leading to a surge in industrial and domestic applications of sulfamic acid.
By focusing on localization strategies and forming partnerships with local entities, market players can tap into the expanding markets, addressing the specific needs and regulatory landscapes of these regions. Tailoring products and services to meet the unique demands of these diverse markets can drive significant growth, making developing regions a key area for strategic expansion in the sulfamic acid sector.
Rising Applications in Additive Manufacturing Offers Growth Opportunity
Sulfamic acid's utilization in the additive manufacturing sector, specifically in 3D printing resin formulas and sintering metal powders, is presenting new growth avenues. Its strong etching properties make it an ideal component for these applications, enhancing the quality and precision of 3D printed materials.
As the adoption of 3D printing technology continues to escalate across various industries—including automotive, aerospace, and personal care sector—the demand for sulfamic acid in this segment is expected to rise. This trend not only broadens the market for sulfamic acid but also aligns with the technological advancements and innovation in manufacturing processes, offering promising growth factors for market players.
Trending Factors
Growing Consumption in Electronics Industry Are Trending Factors
The increasing consumption of sulfamic acid in the electronics industry, especially as a pickling agent for copper etching in the production of Printed Circuit Boards (PCBs) and as a cleaning agent for electronic components, is driving significant demand. This trend is fueled by the continuous growth of the electronics sector, including the rising need for more sophisticated and miniaturized electronic devices.
Sulfamic acid's effectiveness in ensuring clean, precise etchings on copper surfaces makes it indispensable in manufacturing high-quality PCBs, which are critical components of virtually all electronic devices. As the electronics industry evolves with technological advancements, the demand for reliable and efficient materials like sulfamic acid is expected to surge, marking it as a trending factor in the market.
Product Development for Cold Cleaning Are Trending Factors
The introduction of sulfamic acid-based formulations suitable for cold cleaning of metals, particularly those with high lead content, is opening new market opportunities. This innovation is partly driven by the regulatory push for cleaners that have low or no Volatile Organic Compounds (VOCs), addressing environmental and health concerns associated with traditional cleaning agents.
Cold cleaning solutions featuring sulfamic acid not only meet these regulatory requirements but also offer an effective cleaning alternative for sensitive metal components. This development reflects the market's response to the growing demand for safer, more sustainable cleaning solutions, establishing product development for cold cleaning as a key trending factor in the sulfamic acid market.
Regional Analysis
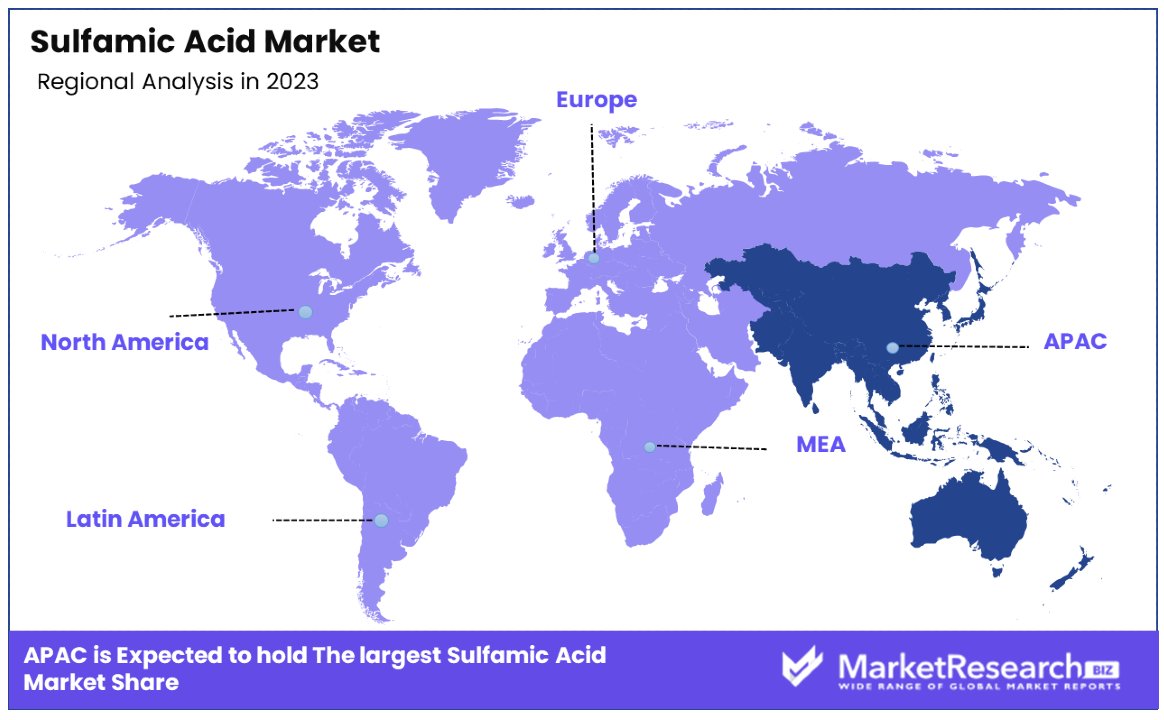
Asia Pacific Dominates with 36% Market Share
The Asia Pacific region's dominance in the Sulfamic Acid Market, holding a 36% share, is largely attributed to rapid industrialization, significant investments in infrastructure, and the expansion of the electronics manufacturing sector.
Countries like China, India, and South Korea are pivotal, with their robust electronics industries demanding high volumes of sulfamic acid for PCB manufacturing and component cleaning. Additionally, the region's growing focus on water treatment and environmental sustainability has spurred the use of sulfamic acid in various applications, from industrial cleaning to mining operations.
The regional characteristics of Asia Pacific, including its large manufacturing base, extensive mining activities, and pressing need for efficient water management solutions, significantly impact the sulfamic acid industry's performance.
The region's commitment to environmental regulations further drives the demand for eco-friendly and efficient cleaning agents, positioning sulfamic acid as a preferred choice. The diverse industrial landscape of Asia Pacific provides a fertile ground for the growth of the sulfamic acid market.
Other Regions' Market Share and Growth Rate
- North America: This region, with a focus on advanced manufacturing and stringent environmental standards, sees a steady demand for sulfamic acid, particularly in cleaning and electronics applications.
- Europe: Europe's market share is bolstered by its emphasis on sustainability and high standards for water treatment and industrial processes, driving the demand for effective cleaning agents like sulfamic acid.
- Middle East & Africa: With growing industrialization and the need for water conservation in arid regions, MEA presents emerging opportunities for the sulfamic acid market.
- Latin America: Rapid industrial growth and increasing regulations on pollution control are gradually boosting the demand for sulfamic acid in Latin America, marking it as a region with potential growth in the market.
Key Regions and Countries
- North America
- The US
- Canada
- Mexico
- Western Europe
- Germany
- France
- The UK
- Spain
- Italy
- Portugal
- Ireland
- Austria
- Switzerland
- Benelux
- Nordic
- Rest of Western Europe
- Eastern Europe
- Russia
- Poland
- The Czech Republic
- Greece
- Rest of Eastern Europe
- APAC
- China
- Japan
- South Korea
- India
- Australia & New Zealand
- Indonesia
- Malaysia
- Philippines
- Singapore
- Thailand
- Vietnam
- Rest of APAC
- Latin America
- Brazil
- Colombia
- Chile
- Argentina
- Costa Rica
- Rest of Latin America
- Middle East & Africa
- Algeria
- Egypt
- Israel
- Kuwait
- Nigeria
- Saudi Arabia
- South Africa
- Turkey
- United Arab Emirates
- Rest of MEA
Key Players Analysis
In the Sulfamic Acid Market, a diverse array of companies ranging from global giants like BASF SE and The Chemours Company to specialized firms such as Nissan Chemical Corporation and Merck KGaA (through Sigma-Aldrich Corporation) play pivotal roles. These major players significantly influence market dynamics through their strategic positioning, innovative product offerings, and extensive distribution networks.
Companies like BASF SE and The Chemours Company leverage their vast resources and global reach to set industry standards, driving advancements in product quality and application. Meanwhile, specialized players like Nissan Chemical and Merck KGaA focus on niche applications, enhancing the market's technological landscape.
The strategic positioning of these companies is also evident in their commitment to R&D, enabling the development of sulfamic acid formulations that meet evolving market demands, such as enhanced safety and environmental compliance. Their influence extends beyond product innovation to shaping regulatory standards and sustainable practices within the industry.
Collectively, these key players contribute to the competitive landscape of the Sulfamic Acid Market, driving growth through a combination of innovation, strategic market expansion, and adherence to regulatory requirements. Their efforts not only serve current market needs but also lay the groundwork for future developments in the industry.
Market Key Players
- BASF SE
- The Chemours Company
- Sigma-Aldrich Corporation (Merck KGaA)
- Nissan Chemical Corporation
- Shree Sulphamic Chemicals
- Ronas Chemicals Ind. Co. Ltd.
- Aditya Birla Chemicals
- Raviraj Group
- Spectrum Chemical Manufacturing Corp.
- Laizhou Jinxing Chemical Co. Ltd.
- Nanjing Jinzhang Industrial Co., Ltd.
- Shandong Mingda Chemical Technology Co., Ltd.
- Yantai Sanding Chemical Co. Ltd.
- Banty Chemicals Ltd.
- Huaqing Chemical Group
- Shanghai Huaxin Chemical Co., Ltd.
- Sulfamic Acid Corporation
- Dongying Shuntong Imp. & Exp. Co., Ltd.
- Zhonglan Industry Co., Ltd.
- Hubei Xingfa Chemicals Group Co., Ltd.
Recent Developments
- On January 2024, the Kamoa-Kakula Copper Complex, a joint venture between Ivanhoe Mines, Zijin Mining Group, and the government of the Democratic Republic of Congo (DRC), announced a partnership with Elessent Clean Technologies to install a new 2,500 metric tonne per day (MTPD) smelter off-gas MECS® sulfuric acid plant as part of its Phase 3 expansion.
- On August 2023, researchers at the Leibniz Institute for Tropospheric Research (TROPOS) demonstrated a groundbreaking discovery regarding the direct formation of sulfuric acid in the atmosphere without the presence of sulfur dioxide (SO2).
Report Scope
Report Features Description Market Value (2023) USD 325 Million Forecast Revenue (2033) USD 508.6 Million CAGR (2024-2033) 4.70% Base Year for Estimation 2023 Historic Period 2018-2023 Forecast Period 2024-2033 Report Coverage Revenue Forecast, Market Dynamics, Competitive Landscape, Recent Developments Segments Covered By Form (Crystals & Powder, Liquid, Tablets), By Application Type (Cleaning Agents, Water Treatment, Electroplating, Dye and Pigment Manufacturing, Paper and Pulp Industry, Pharmaceuticals, Textile Industry, Chemical Synthesis, Industrial Descaling) Regional Analysis North America - The US, Canada, & Mexico; Western Europe - Germany, France, The UK, Spain, Italy, Portugal, Ireland, Austria, Switzerland, Benelux, Nordic, & Rest of Western Europe; Eastern Europe - Russia, Poland, The Czech Republic, Greece, & Rest of Eastern Europe; APAC - China, Japan, South Korea, India, Australia & New Zealand, Indonesia, Malaysia, Philippines, Singapore, Thailand, Vietnam, & Rest of APAC; Latin America - Brazil, Colombia, Chile, Argentina, Costa Rica, & Rest of Latin America; Middle East & Africa - Algeria, Egypt, Israel, Kuwait, Nigeria, Saudi Arabia, South Africa, Turkey, United Arab Emirates, & Rest of MEA Competitive Landscape BASF SE, The Chemours Company, Sigma-Aldrich Corporation (Merck KGaA), Nissan Chemical Corporation, IRO Group Inc., Ronas Chemicals Ind. Co. Ltd., Aditya Birla Chemicals, Yash Chemicals, Laizhou Jinxing Chemical Co. Ltd., Nanjing Jinzhang Industrial Co., Ltd., Shandong Mingda Chemical Technology Co., Ltd., Yantai Sanding Chemical Co. Ltd., Banty Chemicals Ltd., Huaqing Chemical Group, Shanghai Huaxin Chemical Co., Ltd., Sulfamic Acid Corporation, Dongying Shuntong Imp. & Exp. Co., Ltd., Zhonglan Industry Co., Ltd., Hubei Xingfa Chemicals Group Co., Ltd. Customization Scope Customization for segments, region/country-level will be provided. Moreover, additional customization can be done based on the requirements. Purchase Options We have three licenses to opt for: Single User License, Multi-User License (Up to 5 Users), Corporate Use License (Unlimited User and Printable PDF) -
- 1. Executive Summary
- 1.1. Definition
- 1.2. Taxonomy
- 1.3. Research Scope
- 1.4. Key Analysis
- 1.5. Key Findings by Major Segments
- 1.6. Top strategies by Major Players
- 2. Global Sulfamic Acid Market Overview
- 2.1. Sulfamic Acid Market Dynamics
- 2.1.1. Drivers
- 2.1.2. Opportunities
- 2.1.3. Restraints
- 2.1.4. Challenges
- 2.2. Macro-economic Factors
- 2.3. Regulatory Framework
- 2.4. Market Investment Feasibility Index
- 2.5. PEST Analysis
- 2.6. PORTER’S Five Force Analysis
- 2.7. Drivers & Restraints Impact Analysis
- 2.8. Industry Chain Analysis
- 2.9. Cost Structure Analysis
- 2.10. Marketing Strategy
- 2.11. Russia-Ukraine War Impact Analysis
- 2.12. Opportunity Map Analysis
- 2.13. Market Competition Scenario Analysis
- 2.14. Product Life Cycle Analysis
- 2.15. Opportunity Orbits
- 2.16. Manufacturer Intensity Map
- 2.17. Major Companies sales by Value & Volume
- 2.1. Sulfamic Acid Market Dynamics
- 3. Global Sulfamic Acid Market Analysis, Opportunity and Forecast, 2018-2033
- 3.1. Global Sulfamic Acid Market Analysis, 2018-2021
- 3.2. Global Sulfamic Acid Market Opportunity and Forecast, 2023-2033
- 3.3. Global Sulfamic Acid Market Analysis, Opportunity and Forecast, By Form, 2018-2033
- 3.3.1. Global Sulfamic Acid Market Analysis by Form: Introduction
- 3.3.2. Market Size Absolute $ Opportunity Analysis and Forecast, By Form, 2018-2033
- 3.3.3. Crystals & Powder
- 3.3.4. Liquid
- 3.3.5. Tablets
- 3.4. Global Sulfamic Acid Market Analysis, Opportunity and Forecast, By Application Type, 2018-2033
- 3.4.1. Global Sulfamic Acid Market Analysis by Application Type: Introduction
- 3.4.2. Market Size Absolute $ Opportunity Analysis and Forecast, By Application Type, 2018-2033
- 3.4.3. Cleaning Agents
- 3.4.4. Water Treatment
- 3.4.5. Electroplating
- 3.4.6. Dye and Pigment Manufacturing
- 3.4.7. Paper and Pulp Industry
- 3.4.8. Pharmaceuticals
- 3.4.9. Textile Industry
- 3.4.10. Chemical Synthesis
- 3.4.11. Industrial Descaling
- 4. North America Sulfamic Acid Market Analysis, Opportunity and Forecast, 2018-2033
- 4.1. North America Sulfamic Acid Market Analysis, 2018-2021
- 4.2. North America Sulfamic Acid Market Opportunity and Forecast, 2023-2033
- 4.3. North America Sulfamic Acid Market Analysis, Opportunity and Forecast, By Form, 2018-2033
- 4.3.1. North America Sulfamic Acid Market Analysis by Form: Introduction
- 4.3.2. Market Size Absolute $ Opportunity Analysis and Forecast, By Form, 2018-2033
- 4.3.3. Crystals & Powder
- 4.3.4. Liquid
- 4.3.5. Tablets
- 4.4. North America Sulfamic Acid Market Analysis, Opportunity and Forecast, By Application Type, 2018-2033
- 4.4.1. North America Sulfamic Acid Market Analysis by Application Type: Introduction
- 4.4.2. Market Size Absolute $ Opportunity Analysis and Forecast, By Application Type, 2018-2033
- 4.4.3. Cleaning Agents
- 4.4.4. Water Treatment
- 4.4.5. Electroplating
- 4.4.6. Dye and Pigment Manufacturing
- 4.4.7. Paper and Pulp Industry
- 4.4.8. Pharmaceuticals
- 4.4.9. Textile Industry
- 4.4.10. Chemical Synthesis
- 4.4.11. Industrial Descaling
- 4.5. North America Sulfamic Acid Market Analysis, Opportunity and Forecast, By Country , 2018-2033
- 4.5.1. North America Sulfamic Acid Market Analysis by Country : Introduction
- 4.5.2. Market Size Absolute $ Opportunity Analysis and Forecast, Country , 2018-2033
- 4.5.2.1. The US
- 4.5.2.2. Canada
- 4.5.2.3. Mexico
- 5. Western Europe Sulfamic Acid Market Analysis, Opportunity and Forecast, 2018-2033
- 5.1. Western Europe Sulfamic Acid Market Analysis, 2018-2021
- 5.2. Western Europe Sulfamic Acid Market Opportunity and Forecast, 2023-2033
- 5.3. Western Europe Sulfamic Acid Market Analysis, Opportunity and Forecast, By Form, 2018-2033
- 5.3.1. Western Europe Sulfamic Acid Market Analysis by Form: Introduction
- 5.3.2. Market Size Absolute $ Opportunity Analysis and Forecast, By Form, 2018-2033
- 5.3.3. Crystals & Powder
- 5.3.4. Liquid
- 5.3.5. Tablets
- 5.4. Western Europe Sulfamic Acid Market Analysis, Opportunity and Forecast, By Application Type, 2018-2033
- 5.4.1. Western Europe Sulfamic Acid Market Analysis by Application Type: Introduction
- 5.4.2. Market Size Absolute $ Opportunity Analysis and Forecast, By Application Type, 2018-2033
- 5.4.3. Cleaning Agents
- 5.4.4. Water Treatment
- 5.4.5. Electroplating
- 5.4.6. Dye and Pigment Manufacturing
- 5.4.7. Paper and Pulp Industry
- 5.4.8. Pharmaceuticals
- 5.4.9. Textile Industry
- 5.4.10. Chemical Synthesis
- 5.4.11. Industrial Descaling
- 5.5. Western Europe Sulfamic Acid Market Analysis, Opportunity and Forecast, By Country , 2018-2033
- 5.5.1. Western Europe Sulfamic Acid Market Analysis by Country : Introduction
- 5.5.2. Market Size Absolute $ Opportunity Analysis and Forecast, Country , 2018-2033
- 5.5.2.1. Germany
- 5.5.2.2. France
- 5.5.2.3. The UK
- 5.5.2.4. Spain
- 5.5.2.5. Italy
- 5.5.2.6. Portugal
- 5.5.2.7. Ireland
- 5.5.2.8. Austria
- 5.5.2.9. Switzerland
- 5.5.2.10. Benelux
- 5.5.2.11. Nordic
- 5.5.2.12. Rest of Western Europe
- 6. Eastern Europe Sulfamic Acid Market Analysis, Opportunity and Forecast, 2018-2033
- 6.1. Eastern Europe Sulfamic Acid Market Analysis, 2018-2021
- 6.2. Eastern Europe Sulfamic Acid Market Opportunity and Forecast, 2023-2033
- 6.3. Eastern Europe Sulfamic Acid Market Analysis, Opportunity and Forecast, By Form, 2018-2033
- 6.3.1. Eastern Europe Sulfamic Acid Market Analysis by Form: Introduction
- 6.3.2. Market Size Absolute $ Opportunity Analysis and Forecast, By Form, 2018-2033
- 6.3.3. Crystals & Powder
- 6.3.4. Liquid
- 6.3.5. Tablets
- 6.4. Eastern Europe Sulfamic Acid Market Analysis, Opportunity and Forecast, By Application Type, 2018-2033
- 6.4.1. Eastern Europe Sulfamic Acid Market Analysis by Application Type: Introduction
- 6.4.2. Market Size Absolute $ Opportunity Analysis and Forecast, By Application Type, 2018-2033
- 6.4.3. Cleaning Agents
- 6.4.4. Water Treatment
- 6.4.5. Electroplating
- 6.4.6. Dye and Pigment Manufacturing
- 6.4.7. Paper and Pulp Industry
- 6.4.8. Pharmaceuticals
- 6.4.9. Textile Industry
- 6.4.10. Chemical Synthesis
- 6.4.11. Industrial Descaling
- 6.5. Eastern Europe Sulfamic Acid Market Analysis, Opportunity and Forecast, By Country , 2018-2033
- 6.5.1. Eastern Europe Sulfamic Acid Market Analysis by Country : Introduction
- 6.5.2. Market Size Absolute $ Opportunity Analysis and Forecast, Country , 2018-2033
- 6.5.2.1. Russia
- 6.5.2.2. Poland
- 6.5.2.3. The Czech Republic
- 6.5.2.4. Greece
- 6.5.2.5. Rest of Eastern Europe
- 7. APAC Sulfamic Acid Market Analysis, Opportunity and Forecast, 2018-2033
- 7.1. APAC Sulfamic Acid Market Analysis, 2018-2021
- 7.2. APAC Sulfamic Acid Market Opportunity and Forecast, 2023-2033
- 7.3. APAC Sulfamic Acid Market Analysis, Opportunity and Forecast, By Form, 2018-2033
- 7.3.1. APAC Sulfamic Acid Market Analysis by Form: Introduction
- 7.3.2. Market Size Absolute $ Opportunity Analysis and Forecast, By Form, 2018-2033
- 7.3.3. Crystals & Powder
- 7.3.4. Liquid
- 7.3.5. Tablets
- 7.4. APAC Sulfamic Acid Market Analysis, Opportunity and Forecast, By Application Type, 2018-2033
- 7.4.1. APAC Sulfamic Acid Market Analysis by Application Type: Introduction
- 7.4.2. Market Size Absolute $ Opportunity Analysis and Forecast, By Application Type, 2018-2033
- 7.4.3. Cleaning Agents
- 7.4.4. Water Treatment
- 7.4.5. Electroplating
- 7.4.6. Dye and Pigment Manufacturing
- 7.4.7. Paper and Pulp Industry
- 7.4.8. Pharmaceuticals
- 7.4.9. Textile Industry
- 7.4.10. Chemical Synthesis
- 7.4.11. Industrial Descaling
- 7.5. APAC Sulfamic Acid Market Analysis, Opportunity and Forecast, By Country , 2018-2033
- 7.5.1. APAC Sulfamic Acid Market Analysis by Country : Introduction
- 7.5.2. Market Size Absolute $ Opportunity Analysis and Forecast, Country , 2018-2033
- 7.5.2.1. China
- 7.5.2.2. Japan
- 7.5.2.3. South Korea
- 7.5.2.4. India
- 7.5.2.5. Australia & New Zeland
- 7.5.2.6. Indonesia
- 7.5.2.7. Malaysia
- 7.5.2.8. Philippines
- 7.5.2.9. Singapore
- 7.5.2.10. Thailand
- 7.5.2.11. Vietnam
- 7.5.2.12. Rest of APAC
- 8. Latin America Sulfamic Acid Market Analysis, Opportunity and Forecast, 2018-2033
- 8.1. Latin America Sulfamic Acid Market Analysis, 2018-2021
- 8.2. Latin America Sulfamic Acid Market Opportunity and Forecast, 2023-2033
- 8.3. Latin America Sulfamic Acid Market Analysis, Opportunity and Forecast, By Form, 2018-2033
- 8.3.1. Latin America Sulfamic Acid Market Analysis by Form: Introduction
- 8.3.2. Market Size Absolute $ Opportunity Analysis and Forecast, By Form, 2018-2033
- 8.3.3. Crystals & Powder
- 8.3.4. Liquid
- 8.3.5. Tablets
- 8.4. Latin America Sulfamic Acid Market Analysis, Opportunity and Forecast, By Application Type, 2018-2033
- 8.4.1. Latin America Sulfamic Acid Market Analysis by Application Type: Introduction
- 8.4.2. Market Size Absolute $ Opportunity Analysis and Forecast, By Application Type, 2018-2033
- 8.4.3. Cleaning Agents
- 8.4.4. Water Treatment
- 8.4.5. Electroplating
- 8.4.6. Dye and Pigment Manufacturing
- 8.4.7. Paper and Pulp Industry
- 8.4.8. Pharmaceuticals
- 8.4.9. Textile Industry
- 8.4.10. Chemical Synthesis
- 8.4.11. Industrial Descaling
- 8.5. Latin America Sulfamic Acid Market Analysis, Opportunity and Forecast, By Country , 2018-2033
- 8.5.1. Latin America Sulfamic Acid Market Analysis by Country : Introduction
- 8.5.2. Market Size Absolute $ Opportunity Analysis and Forecast, Country , 2018-2033
- 8.5.2.1. Brazil
- 8.5.2.2. Colombia
- 8.5.2.3. Chile
- 8.5.2.4. Argentina
- 8.5.2.5. Costa Rica
- 8.5.2.6. Rest of Latin America
- 9. Middle East & Africa Sulfamic Acid Market Analysis, Opportunity and Forecast, 2018-2033
- 9.1. Middle East & Africa Sulfamic Acid Market Analysis, 2018-2021
- 9.2. Middle East & Africa Sulfamic Acid Market Opportunity and Forecast, 2023-2033
- 9.3. Middle East & Africa Sulfamic Acid Market Analysis, Opportunity and Forecast, By Form, 2018-2033
- 9.3.1. Middle East & Africa Sulfamic Acid Market Analysis by Form: Introduction
- 9.3.2. Market Size Absolute $ Opportunity Analysis and Forecast, By Form, 2018-2033
- 9.3.3. Crystals & Powder
- 9.3.4. Liquid
- 9.3.5. Tablets
- 9.4. Middle East & Africa Sulfamic Acid Market Analysis, Opportunity and Forecast, By Application Type, 2018-2033
- 9.4.1. Middle East & Africa Sulfamic Acid Market Analysis by Application Type: Introduction
- 9.4.2. Market Size Absolute $ Opportunity Analysis and Forecast, By Application Type, 2018-2033
- 9.4.3. Cleaning Agents
- 9.4.4. Water Treatment
- 9.4.5. Electroplating
- 9.4.6. Dye and Pigment Manufacturing
- 9.4.7. Paper and Pulp Industry
- 9.4.8. Pharmaceuticals
- 9.4.9. Textile Industry
- 9.4.10. Chemical Synthesis
- 9.4.11. Industrial Descaling
- 9.5. Middle East & Africa Sulfamic Acid Market Analysis, Opportunity and Forecast, By Country , 2018-2033
- 9.5.1. Middle East & Africa Sulfamic Acid Market Analysis by Country : Introduction
- 9.5.2. Market Size Absolute $ Opportunity Analysis and Forecast, Country , 2018-2033
- 9.5.2.1. Algeria
- 9.5.2.2. Egypt
- 9.5.2.3. Israel
- 9.5.2.4. Kuwait
- 9.5.2.5. Nigeria
- 9.5.2.6. Saudi Arabia
- 9.5.2.7. South Africa
- 9.5.2.8. Turkey
- 9.5.2.9. The UAE
- 9.5.2.10. Rest of MEA
- 10. Global Sulfamic Acid Market Analysis, Opportunity and Forecast, By Region , 2018-2033
- 10.1. Global Sulfamic Acid Market Analysis by Region : Introduction
- 10.2. Market Size Absolute $ Opportunity Analysis and Forecast, By Region , 2018-2033
- 10.2.1. North America
- 10.2.2. Western Europe
- 10.2.3. Eastern Europe
- 10.2.4. APAC
- 10.2.5. Latin America
- 10.2.6. Middle East & Africa
- 11. Global Sulfamic Acid Market Competitive Landscape, Market Share Analysis, and Company Profiles
- 11.1. Market Share Analysis
- 11.2. Company Profiles
- 11.3. BASF SE
- 11.3.1. Company Overview
- 11.3.2. Financial Highlights
- 11.3.3. Product Portfolio
- 11.3.4. SWOT Analysis
- 11.3.5. Key Strategies and Developments
- 11.4. The Chemours Company
- 11.4.1. Company Overview
- 11.4.2. Financial Highlights
- 11.4.3. Product Portfolio
- 11.4.4. SWOT Analysis
- 11.4.5. Key Strategies and Developments
- 11.5. Sigma-Aldrich Corporation (Merck KGaA)
- 11.5.1. Company Overview
- 11.5.2. Financial Highlights
- 11.5.3. Product Portfolio
- 11.5.4. SWOT Analysis
- 11.5.5. Key Strategies and Developments
- 11.6. Nissan Chemical Corporation
- 11.6.1. Company Overview
- 11.6.2. Financial Highlights
- 11.6.3. Product Portfolio
- 11.6.4. SWOT Analysis
- 11.6.5. Key Strategies and Developments
- 11.7. IRO Group Inc.
- 11.7.1. Company Overview
- 11.7.2. Financial Highlights
- 11.7.3. Product Portfolio
- 11.7.4. SWOT Analysis
- 11.7.5. Key Strategies and Developments
- 11.8. Ronas Chemicals Ind. Co. Ltd.
- 11.8.1. Company Overview
- 11.8.2. Financial Highlights
- 11.8.3. Product Portfolio
- 11.8.4. SWOT Analysis
- 11.8.5. Key Strategies and Developments
- 11.9. Aditya Birla Chemicals
- 11.9.1. Company Overview
- 11.9.2. Financial Highlights
- 11.9.3. Product Portfolio
- 11.9.4. SWOT Analysis
- 11.9.5. Key Strategies and Developments
- 11.10. Yash Chemicals
- 11.10.1. Company Overview
- 11.10.2. Financial Highlights
- 11.10.3. Product Portfolio
- 11.10.4. SWOT Analysis
- 11.10.5. Key Strategies and Developments
- 11.11. Laizhou Jinxing Chemical Co. Ltd.
- 11.11.1. Company Overview
- 11.11.2. Financial Highlights
- 11.11.3. Product Portfolio
- 11.11.4. SWOT Analysis
- 11.11.5. Key Strategies and Developments
- 11.12. Nanjing Jinzhang Industrial Co., Ltd.
- 11.12.1. Company Overview
- 11.12.2. Financial Highlights
- 11.12.3. Product Portfolio
- 11.12.4. SWOT Analysis
- 11.12.5. Key Strategies and Developments
- 11.13.1. Company Overview
- 11.13.2. Financial Highlights
- 11.13.3. Product Portfolio
- 11.13.4. SWOT Analysis
- 11.13.5. Key Strategies and Developments
- 11.14. Shandong Mingda Chemical Technology Co., Ltd.
- 11.14.1. Company Overview
- 11.14.2. Financial Highlights
- 11.14.3. Product Portfolio
- 11.14.4. SWOT Analysis
- 11.14.5. Key Strategies and Developments
- 11.15. Banty Chemicals Ltd.
- 11.15.1. Company Overview
- 11.15.2. Financial Highlights
- 11.15.3. Product Portfolio
- 11.15.4. SWOT Analysis
- 11.15.5. Key Strategies and Developments
- 11.16. Huaqing Chemical Group
- 11.16.1. Company Overview
- 11.16.2. Financial Highlights
- 11.16.3. Product Portfolio
- 11.16.4. SWOT Analysis
- 11.16.5. Key Strategies and Developments
- 11.17. Shanghai Huaxin Chemical Co., Ltd.
- 11.17.1. Company Overview
- 11.17.2. Financial Highlights
- 11.17.3. Product Portfolio
- 11.17.4. SWOT Analysis
- 11.17.5. Key Strategies and Developments
- 11.18. Sulfamic Acid Corporation
- 11.18.1. Company Overview
- 11.18.2. Financial Highlights
- 11.18.3. Product Portfolio
- 11.18.4. SWOT Analysis
- 11.18.5. Key Strategies and Developments
- 11.19. Dongying Shuntong Imp. & Exp. Co., Ltd.
- 11.19.1. Company Overview
- 11.19.2. Financial Highlights
- 11.19.3. Product Portfolio
- 11.19.4. SWOT Analysis
- 11.19.5. Key Strategies and Developments
- 11.20. Zhonglan Industry Co., Ltd.
- 11.20.1. Company Overview
- 11.20.2. Financial Highlights
- 11.20.3. Product Portfolio
- 11.20.4. SWOT Analysis
- 11.20.5. Key Strategies and Developments
- 11.21. Hubei Xingfa Chemicals Group Co., Ltd.
- 11.21.1. Company Overview
- 11.21.2. Financial Highlights
- 11.21.3. Product Portfolio
- 11.21.4. SWOT Analysis
- 11.21.5. Key Strategies and Developments
- 12. Assumptions and Acronyms
- 13. Research Methodology
- 14. Contact
- List of Figures
- Figure 1: Global Sulfamic Acid Market Revenue (US$ Mn) Market Share by Form in 2022
- Figure 2: Global Sulfamic Acid Market Attractiveness Analysis by Form, 2018-2033
- Figure 3: Global Sulfamic Acid Market Revenue (US$ Mn) Market Share by Application Typein 2022
- Figure 4: Global Sulfamic Acid Market Attractiveness Analysis by Application Type, 2018-2033
- Figure 5: Global Sulfamic Acid Market Revenue (US$ Mn) Market Share by Region in 2022
- Figure 6: Global Sulfamic Acid Market Attractiveness Analysis by Region, 2018-2033
- Figure 7: Global Sulfamic Acid Market Revenue (US$ Mn) (2018-2033)
- Figure 8: Global Sulfamic Acid Market Revenue (US$ Mn) Comparison by Region (2018-2033)
- Figure 9: Global Sulfamic Acid Market Revenue (US$ Mn) Comparison by Form (2018-2033)
- Figure 10: Global Sulfamic Acid Market Revenue (US$ Mn) Comparison by Application Type (2018-2033)
- Figure 11: Global Sulfamic Acid Market Y-o-Y Growth Rate Comparison by Region (2018-2033)
- Figure 12: Global Sulfamic Acid Market Y-o-Y Growth Rate Comparison by Form (2018-2033)
- Figure 13: Global Sulfamic Acid Market Y-o-Y Growth Rate Comparison by Application Type (2018-2033)
- Figure 14: Global Sulfamic Acid Market Share Comparison by Region (2018-2033)
- Figure 15: Global Sulfamic Acid Market Share Comparison by Form (2018-2033)
- Figure 16: Global Sulfamic Acid Market Share Comparison by Application Type (2018-2033)
- Figure 17: North America Sulfamic Acid Market Revenue (US$ Mn) Market Share by Formin 2022
- Figure 18: North America Sulfamic Acid Market Attractiveness Analysis by Form, 2018-2033
- Figure 19: North America Sulfamic Acid Market Revenue (US$ Mn) Market Share by Application Typein 2022
- Figure 20: North America Sulfamic Acid Market Attractiveness Analysis by Application Type, 2018-2033
- Figure 21: North America Sulfamic Acid Market Revenue (US$ Mn) Market Share by Country in 2022
- Figure 22: North America Sulfamic Acid Market Attractiveness Analysis by Country, 2018-2033
- Figure 23: North America Sulfamic Acid Market Revenue (US$ Mn) (2018-2033)
- Figure 24: North America Sulfamic Acid Market Revenue (US$ Mn) Comparison by Country (2018-2033)
- Figure 25: North America Sulfamic Acid Market Revenue (US$ Mn) Comparison by Form (2018-2033)
- Figure 26: North America Sulfamic Acid Market Revenue (US$ Mn) Comparison by Application Type (2018-2033)
- Figure 27: North America Sulfamic Acid Market Y-o-Y Growth Rate Comparison by Country (2018-2033)
- Figure 28: North America Sulfamic Acid Market Y-o-Y Growth Rate Comparison by Form (2018-2033)
- Figure 29: North America Sulfamic Acid Market Y-o-Y Growth Rate Comparison by Application Type (2018-2033)
- Figure 30: North America Sulfamic Acid Market Share Comparison by Country (2018-2033)
- Figure 31: North America Sulfamic Acid Market Share Comparison by Form (2018-2033)
- Figure 32: North America Sulfamic Acid Market Share Comparison by Application Type (2018-2033)
- Figure 33: Western Europe Sulfamic Acid Market Revenue (US$ Mn) Market Share by Formin 2022
- Figure 34: Western Europe Sulfamic Acid Market Attractiveness Analysis by Form, 2018-2033
- Figure 35: Western Europe Sulfamic Acid Market Revenue (US$ Mn) Market Share by Application Typein 2022
- Figure 36: Western Europe Sulfamic Acid Market Attractiveness Analysis by Application Type, 2018-2033
- Figure 37: Western Europe Sulfamic Acid Market Revenue (US$ Mn) Market Share by Country in 2022
- Figure 38: Western Europe Sulfamic Acid Market Attractiveness Analysis by Country, 2018-2033
- Figure 39: Western Europe Sulfamic Acid Market Revenue (US$ Mn) (2018-2033)
- Figure 40: Western Europe Sulfamic Acid Market Revenue (US$ Mn) Comparison by Country (2018-2033)
- Figure 41: Western Europe Sulfamic Acid Market Revenue (US$ Mn) Comparison by Form (2018-2033)
- Figure 42: Western Europe Sulfamic Acid Market Revenue (US$ Mn) Comparison by Application Type (2018-2033)
- Figure 43: Western Europe Sulfamic Acid Market Y-o-Y Growth Rate Comparison by Country (2018-2033)
- Figure 44: Western Europe Sulfamic Acid Market Y-o-Y Growth Rate Comparison by Form (2018-2033)
- Figure 45: Western Europe Sulfamic Acid Market Y-o-Y Growth Rate Comparison by Application Type (2018-2033)
- Figure 46: Western Europe Sulfamic Acid Market Share Comparison by Country (2018-2033)
- Figure 47: Western Europe Sulfamic Acid Market Share Comparison by Form (2018-2033)
- Figure 48: Western Europe Sulfamic Acid Market Share Comparison by Application Type (2018-2033)
- Figure 49: Eastern Europe Sulfamic Acid Market Revenue (US$ Mn) Market Share by Formin 2022
- Figure 50: Eastern Europe Sulfamic Acid Market Attractiveness Analysis by Form, 2018-2033
- Figure 51: Eastern Europe Sulfamic Acid Market Revenue (US$ Mn) Market Share by Application Typein 2022
- Figure 52: Eastern Europe Sulfamic Acid Market Attractiveness Analysis by Application Type, 2018-2033
- Figure 53: Eastern Europe Sulfamic Acid Market Revenue (US$ Mn) Market Share by Country in 2022
- Figure 54: Eastern Europe Sulfamic Acid Market Attractiveness Analysis by Country, 2018-2033
- Figure 55: Eastern Europe Sulfamic Acid Market Revenue (US$ Mn) (2018-2033)
- Figure 56: Eastern Europe Sulfamic Acid Market Revenue (US$ Mn) Comparison by Country (2018-2033)
- Figure 57: Eastern Europe Sulfamic Acid Market Revenue (US$ Mn) Comparison by Form (2018-2033)
- Figure 58: Eastern Europe Sulfamic Acid Market Revenue (US$ Mn) Comparison by Application Type (2018-2033)
- Figure 59: Eastern Europe Sulfamic Acid Market Y-o-Y Growth Rate Comparison by Country (2018-2033)
- Figure 60: Eastern Europe Sulfamic Acid Market Y-o-Y Growth Rate Comparison by Form (2018-2033)
- Figure 61: Eastern Europe Sulfamic Acid Market Y-o-Y Growth Rate Comparison by Application Type (2018-2033)
- Figure 62: Eastern Europe Sulfamic Acid Market Share Comparison by Country (2018-2033)
- Figure 63: Eastern Europe Sulfamic Acid Market Share Comparison by Form (2018-2033)
- Figure 64: Eastern Europe Sulfamic Acid Market Share Comparison by Application Type (2018-2033)
- Figure 65: APAC Sulfamic Acid Market Revenue (US$ Mn) Market Share by Formin 2022
- Figure 66: APAC Sulfamic Acid Market Attractiveness Analysis by Form, 2018-2033
- Figure 67: APAC Sulfamic Acid Market Revenue (US$ Mn) Market Share by Application Typein 2022
- Figure 68: APAC Sulfamic Acid Market Attractiveness Analysis by Application Type, 2018-2033
- Figure 69: APAC Sulfamic Acid Market Revenue (US$ Mn) Market Share by Country in 2022
- Figure 70: APAC Sulfamic Acid Market Attractiveness Analysis by Country, 2018-2033
- Figure 71: APAC Sulfamic Acid Market Revenue (US$ Mn) (2018-2033)
- Figure 72: APAC Sulfamic Acid Market Revenue (US$ Mn) Comparison by Country (2018-2033)
- Figure 73: APAC Sulfamic Acid Market Revenue (US$ Mn) Comparison by Form (2018-2033)
- Figure 74: APAC Sulfamic Acid Market Revenue (US$ Mn) Comparison by Application Type (2018-2033)
- Figure 75: APAC Sulfamic Acid Market Y-o-Y Growth Rate Comparison by Country (2018-2033)
- Figure 76: APAC Sulfamic Acid Market Y-o-Y Growth Rate Comparison by Form (2018-2033)
- Figure 77: APAC Sulfamic Acid Market Y-o-Y Growth Rate Comparison by Application Type (2018-2033)
- Figure 78: APAC Sulfamic Acid Market Share Comparison by Country (2018-2033)
- Figure 79: APAC Sulfamic Acid Market Share Comparison by Form (2018-2033)
- Figure 80: APAC Sulfamic Acid Market Share Comparison by Application Type (2018-2033)
- Figure 81: Latin America Sulfamic Acid Market Revenue (US$ Mn) Market Share by Formin 2022
- Figure 82: Latin America Sulfamic Acid Market Attractiveness Analysis by Form, 2018-2033
- Figure 83: Latin America Sulfamic Acid Market Revenue (US$ Mn) Market Share by Application Typein 2022
- Figure 84: Latin America Sulfamic Acid Market Attractiveness Analysis by Application Type, 2018-2033
- Figure 85: Latin America Sulfamic Acid Market Revenue (US$ Mn) Market Share by Country in 2022
- Figure 86: Latin America Sulfamic Acid Market Attractiveness Analysis by Country, 2018-2033
- Figure 87: Latin America Sulfamic Acid Market Revenue (US$ Mn) (2018-2033)
- Figure 88: Latin America Sulfamic Acid Market Revenue (US$ Mn) Comparison by Country (2018-2033)
- Figure 89: Latin America Sulfamic Acid Market Revenue (US$ Mn) Comparison by Form (2018-2033)
- Figure 90: Latin America Sulfamic Acid Market Revenue (US$ Mn) Comparison by Application Type (2018-2033)
- Figure 91: Latin America Sulfamic Acid Market Y-o-Y Growth Rate Comparison by Country (2018-2033)
- Figure 92: Latin America Sulfamic Acid Market Y-o-Y Growth Rate Comparison by Form (2018-2033)
- Figure 93: Latin America Sulfamic Acid Market Y-o-Y Growth Rate Comparison by Application Type (2018-2033)
- Figure 94: Latin America Sulfamic Acid Market Share Comparison by Country (2018-2033)
- Figure 95: Latin America Sulfamic Acid Market Share Comparison by Form (2018-2033)
- Figure 96: Latin America Sulfamic Acid Market Share Comparison by Application Type (2018-2033)
- Figure 97: Middle East & Africa Sulfamic Acid Market Revenue (US$ Mn) Market Share by Formin 2022
- Figure 98: Middle East & Africa Sulfamic Acid Market Attractiveness Analysis by Form, 2018-2033
- Figure 99: Middle East & Africa Sulfamic Acid Market Revenue (US$ Mn) Market Share by Application Typein 2022
- Figure 100: Middle East & Africa Sulfamic Acid Market Attractiveness Analysis by Application Type, 2018-2033
- Figure 101: Middle East & Africa Sulfamic Acid Market Revenue (US$ Mn) Market Share by Country in 2022
- Figure 102: Middle East & Africa Sulfamic Acid Market Attractiveness Analysis by Country, 2018-2033
- Figure 103: Middle East & Africa Sulfamic Acid Market Revenue (US$ Mn) (2018-2033)
- Figure 104: Middle East & Africa Sulfamic Acid Market Revenue (US$ Mn) Comparison by Country (2018-2033)
- Figure 105: Middle East & Africa Sulfamic Acid Market Revenue (US$ Mn) Comparison by Form (2018-2033)
- Figure 106: Middle East & Africa Sulfamic Acid Market Revenue (US$ Mn) Comparison by Application Type (2018-2033)
- Figure 107: Middle East & Africa Sulfamic Acid Market Y-o-Y Growth Rate Comparison by Country (2018-2033)
- Figure 108: Middle East & Africa Sulfamic Acid Market Y-o-Y Growth Rate Comparison by Form (2018-2033)
- Figure 109: Middle East & Africa Sulfamic Acid Market Y-o-Y Growth Rate Comparison by Application Type (2018-2033)
- Figure 110: Middle East & Africa Sulfamic Acid Market Share Comparison by Country (2018-2033)
- Figure 111: Middle East & Africa Sulfamic Acid Market Share Comparison by Form (2018-2033)
- Figure 112: Middle East & Africa Sulfamic Acid Market Share Comparison by Application Type (2018-2033)
- List of Tables
- Table 1: Global Sulfamic Acid Market Comparison by Form (2018-2033)
- Table 2: Global Sulfamic Acid Market Comparison by Application Type (2018-2033)
- Table 3: Global Sulfamic Acid Market Revenue (US$ Mn) Comparison by Region (2018-2033)
- Table 4: Global Sulfamic Acid Market Revenue (US$ Mn) (2018-2033)
- Table 5: Global Sulfamic Acid Market Revenue (US$ Mn) Comparison by Region (2018-2033)
- Table 6: Global Sulfamic Acid Market Revenue (US$ Mn) Comparison by Form (2018-2033)
- Table 7: Global Sulfamic Acid Market Revenue (US$ Mn) Comparison by Application Type (2018-2033)
- Table 8: Global Sulfamic Acid Market Y-o-Y Growth Rate Comparison by Region (2018-2033)
- Table 9: Global Sulfamic Acid Market Y-o-Y Growth Rate Comparison by Form (2018-2033)
- Table 10: Global Sulfamic Acid Market Y-o-Y Growth Rate Comparison by Application Type (2018-2033)
- Table 11: Global Sulfamic Acid Market Share Comparison by Region (2018-2033)
- Table 12: Global Sulfamic Acid Market Share Comparison by Form (2018-2033)
- Table 13: Global Sulfamic Acid Market Share Comparison by Application Type (2018-2033)
- Table 14: North America Sulfamic Acid Market Comparison by Application Type (2018-2033)
- Table 15: North America Sulfamic Acid Market Revenue (US$ Mn) Comparison by Country (2018-2033)
- Table 16: North America Sulfamic Acid Market Revenue (US$ Mn) (2018-2033)
- Table 17: North America Sulfamic Acid Market Revenue (US$ Mn) Comparison by Country (2018-2033)
- Table 18: North America Sulfamic Acid Market Revenue (US$ Mn) Comparison by Form (2018-2033)
- Table 19: North America Sulfamic Acid Market Revenue (US$ Mn) Comparison by Application Type (2018-2033)
- Table 20: North America Sulfamic Acid Market Y-o-Y Growth Rate Comparison by Country (2018-2033)
- Table 21: North America Sulfamic Acid Market Y-o-Y Growth Rate Comparison by Form (2018-2033)
- Table 22: North America Sulfamic Acid Market Y-o-Y Growth Rate Comparison by Application Type (2018-2033)
- Table 23: North America Sulfamic Acid Market Share Comparison by Country (2018-2033)
- Table 24: North America Sulfamic Acid Market Share Comparison by Form (2018-2033)
- Table 25: North America Sulfamic Acid Market Share Comparison by Application Type (2018-2033)
- Table 26: Western Europe Sulfamic Acid Market Comparison by Form (2018-2033)
- Table 27: Western Europe Sulfamic Acid Market Comparison by Application Type (2018-2033)
- Table 28: Western Europe Sulfamic Acid Market Revenue (US$ Mn) Comparison by Country (2018-2033)
- Table 29: Western Europe Sulfamic Acid Market Revenue (US$ Mn) (2018-2033)
- Table 30: Western Europe Sulfamic Acid Market Revenue (US$ Mn) Comparison by Country (2018-2033)
- Table 31: Western Europe Sulfamic Acid Market Revenue (US$ Mn) Comparison by Form (2018-2033)
- Table 32: Western Europe Sulfamic Acid Market Revenue (US$ Mn) Comparison by Application Type (2018-2033)
- Table 33: Western Europe Sulfamic Acid Market Y-o-Y Growth Rate Comparison by Country (2018-2033)
- Table 34: Western Europe Sulfamic Acid Market Y-o-Y Growth Rate Comparison by Form (2018-2033)
- Table 35: Western Europe Sulfamic Acid Market Y-o-Y Growth Rate Comparison by Application Type (2018-2033)
- Table 36: Western Europe Sulfamic Acid Market Share Comparison by Country (2018-2033)
- Table 37: Western Europe Sulfamic Acid Market Share Comparison by Form (2018-2033)
- Table 38: Western Europe Sulfamic Acid Market Share Comparison by Application Type (2018-2033)
- Table 39: Eastern Europe Sulfamic Acid Market Comparison by Form (2018-2033)
- Table 40: Eastern Europe Sulfamic Acid Market Comparison by Application Type (2018-2033)
- Table 41: Eastern Europe Sulfamic Acid Market Revenue (US$ Mn) Comparison by Country (2018-2033)
- Table 42: Eastern Europe Sulfamic Acid Market Revenue (US$ Mn) (2018-2033)
- Table 43: Eastern Europe Sulfamic Acid Market Revenue (US$ Mn) Comparison by Country (2018-2033)
- Table 44: Eastern Europe Sulfamic Acid Market Revenue (US$ Mn) Comparison by Form (2018-2033)
- Table 45: Eastern Europe Sulfamic Acid Market Revenue (US$ Mn) Comparison by Application Type (2018-2033)
- Table 46: Eastern Europe Sulfamic Acid Market Y-o-Y Growth Rate Comparison by Country (2018-2033)
- Table 47: Eastern Europe Sulfamic Acid Market Y-o-Y Growth Rate Comparison by Form (2018-2033)
- Table 48: Eastern Europe Sulfamic Acid Market Y-o-Y Growth Rate Comparison by Application Type (2018-2033)
- Table 49: Eastern Europe Sulfamic Acid Market Share Comparison by Country (2018-2033)
- Table 50: Eastern Europe Sulfamic Acid Market Share Comparison by Form (2018-2033)
- Table 51: Eastern Europe Sulfamic Acid Market Share Comparison by Application Type (2018-2033)
- Table 52: APAC Sulfamic Acid Market Comparison by Form (2018-2033)
- Table 53: APAC Sulfamic Acid Market Comparison by Application Type (2018-2033)
- Table 54: APAC Sulfamic Acid Market Revenue (US$ Mn) Comparison by Country (2018-2033)
- Table 55: APAC Sulfamic Acid Market Revenue (US$ Mn) (2018-2033)
- Table 56: APAC Sulfamic Acid Market Revenue (US$ Mn) Comparison by Country (2018-2033)
- Table 57: APAC Sulfamic Acid Market Revenue (US$ Mn) Comparison by Form (2018-2033)
- Table 58: APAC Sulfamic Acid Market Revenue (US$ Mn) Comparison by Application Type (2018-2033)
- Table 59: APAC Sulfamic Acid Market Y-o-Y Growth Rate Comparison by Country (2018-2033)
- Table 60: APAC Sulfamic Acid Market Y-o-Y Growth Rate Comparison by Form (2018-2033)
- Table 61: APAC Sulfamic Acid Market Y-o-Y Growth Rate Comparison by Application Type (2018-2033)
- Table 62: APAC Sulfamic Acid Market Share Comparison by Country (2018-2033)
- Table 63: APAC Sulfamic Acid Market Share Comparison by Form (2018-2033)
- Table 64: APAC Sulfamic Acid Market Share Comparison by Application Type (2018-2033)
- Table 65: Latin America Sulfamic Acid Market Comparison by Form (2018-2033)
- Table 66: Latin America Sulfamic Acid Market Comparison by Application Type (2018-2033)
- Table 67: Latin America Sulfamic Acid Market Revenue (US$ Mn) Comparison by Country (2018-2033)
- Table 68: Latin America Sulfamic Acid Market Revenue (US$ Mn) (2018-2033)
- Table 69: Latin America Sulfamic Acid Market Revenue (US$ Mn) Comparison by Country (2018-2033)
- Table 70: Latin America Sulfamic Acid Market Revenue (US$ Mn) Comparison by Form (2018-2033)
- Table 71: Latin America Sulfamic Acid Market Revenue (US$ Mn) Comparison by Application Type (2018-2033)
- Table 72: Latin America Sulfamic Acid Market Y-o-Y Growth Rate Comparison by Country (2018-2033)
- Table 73: Latin America Sulfamic Acid Market Y-o-Y Growth Rate Comparison by Form (2018-2033)
- Table 74: Latin America Sulfamic Acid Market Y-o-Y Growth Rate Comparison by Application Type (2018-2033)
- Table 75: Latin America Sulfamic Acid Market Share Comparison by Country (2018-2033)
- Table 76: Latin America Sulfamic Acid Market Share Comparison by Form (2018-2033)
- Table 77: Latin America Sulfamic Acid Market Share Comparison by Application Type (2018-2033)
- Table 78: Middle East & Africa Sulfamic Acid Market Comparison by Form (2018-2033)
- Table 79: Middle East & Africa Sulfamic Acid Market Comparison by Application Type (2018-2033)
- Table 80: Middle East & Africa Sulfamic Acid Market Revenue (US$ Mn) Comparison by Country (2018-2033)
- Table 81: Middle East & Africa Sulfamic Acid Market Revenue (US$ Mn) (2018-2033)
- Table 82: Middle East & Africa Sulfamic Acid Market Revenue (US$ Mn) Comparison by Country (2018-2033)
- Table 83: Middle East & Africa Sulfamic Acid Market Revenue (US$ Mn) Comparison by Form (2018-2033)
- Table 84: Middle East & Africa Sulfamic Acid Market Revenue (US$ Mn) Comparison by Application Type (2018-2033)
- Table 85: Middle East & Africa Sulfamic Acid Market Y-o-Y Growth Rate Comparison by Country (2018-2033)
- Table 86: Middle East & Africa Sulfamic Acid Market Y-o-Y Growth Rate Comparison by Form (2018-2033)
- Table 87: Middle East & Africa Sulfamic Acid Market Y-o-Y Growth Rate Comparison by Application Type (2018-2033)
- Table 88: Middle East & Africa Sulfamic Acid Market Share Comparison by Country (2018-2033)
- Table 89: Middle East & Africa Sulfamic Acid Market Share Comparison by Form (2018-2033)
- Table 90: Middle East & Africa Sulfamic Acid Market Share Comparison by Application Type (2016-2032)
- 1. Executive Summary
-
- Raviraj Chemicals
- Mingda Chemical
- Laizhou Jinxing
- Nanjing Jinzhang
- Jiangsu Yazhong
- Nissan Chemical
- Palm Commodities
- Yantai Sanding
- Shandong Xingda
- Laizhou Guangcheng
- others
Our Clients


View Our Licence Options
