
Submarine Fiber Cable Market By Application(Submarine Power Cables, Submarine Communication Cables), By Voltage(High Voltage, Medium Voltage, Others), By Region And Companies - Industry Segment Outlook, Market Assessment, Competition Scenario, Trends, And Forecast 2023-2032
12578
Jul 2023
185
Report Overview
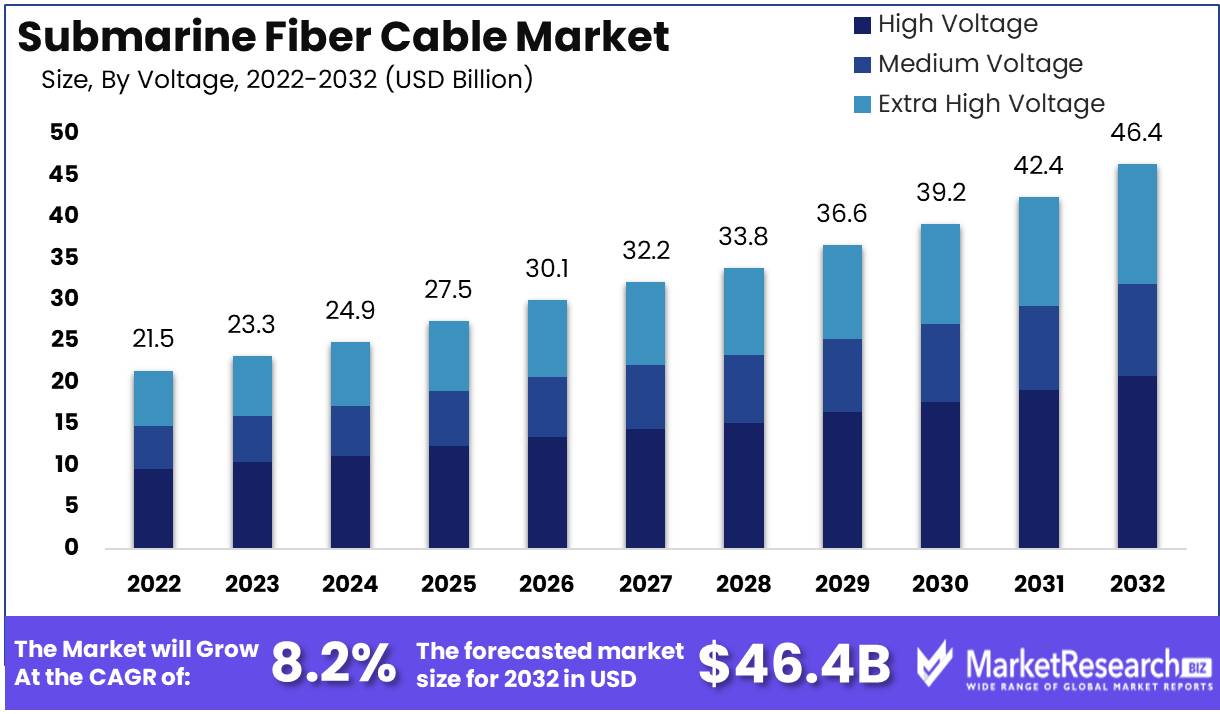
Submarine Fiber Cable Market size is expected to be worth around USD 46.4 Bn by 2032 from USD 21.5 Bn in 2022, growing at a CAGR of 8.2% during the forecast period from 2023 to 2032.
Submarine fiber cables are fiber-optic cables that are buried beneath the ocean floor for telecommunications purposes. The Internet is supported by these cables, which enable data transmission across oceans and continents. Submarine fiber optic cables are used to connect countries, data centers, and servers, allowing for the transmission of data quickly and reliably. The market for submarine fiber cables is expanding rapidly, driven by the rising demand for high-speed internet connectivity and cloud services.
Submarine fiber optic cable networks are essential to the global economy because they connect businesses and individuals from all over the globe. These networks provide the essential infrastructure for data transmission, enabling businesses to function efficiently and effectively.
Faster Internet connectivity, dependable data transmission, and minimal latency are all advantages of submarine fiber cables used for data transmission. Additionally, submarine fiber optic cables are more efficient than satellite connections, allowing for greater bandwidth and quicker transfer rates.
In terms of cable design, installation methods, and network configurations, the submarine fiber cable market is undergoing a number of innovations. Using submarine cable systems for subsea power transmission is one of the most significant innovations. These cables allow offshore wind farms to transmit renewable energy to the mainland. Using hybrid fiber-optic and power cables reduces the cost of constructing separate cables for data transmission and power transmission.
Governments and private companies are investing heavily in the submarine fiber cable market. To support their cloud services, companies such as Google, Amazon, and Facebook are investing billions of dollars in submarine fiber cable networks. Governments are also investing in submarine fiber cables to improve their connectivity with foreign nations and boost their economies' competitiveness.
Driving factors
International Data Transmission Demand
International data transmission demand is expanding at an exponential rate. Governments, corporations, and individuals all require rapid and dependable global data transmission. The internet has transformed the way we live, and we rely on it more and more each day. This has necessitated more dependable and rapid data transmission networks, which submarine fiber cables provide.
Bandwidth Requirements
As the demand for international data transmission increases, so does the need for more bandwidth. Submarine fiber cables provide high-speed and dependable connectivity across the oceans of the globe and are the backbone of the Internet. They provide sufficient bandwidth to support current and future data transmission service demands. Due to technological advancements, the capacity of submarine fiber cables has drastically increased, with some cables offering up to 100 Tbps of bandwidth.
Cable Advancements
Innovations in submarine fiber cable technology are fueling market demand and expansion. Manufacturers are continuously developing new technologies and materials to improve the performance and capabilities of these cables. New materials, such as carbon nanotubes, which offer stronger and more durable cables, are being evaluated for market use.
In addition, there are advancements in the design of these cables, such as the use of optical fibers for quicker data transmission and the development of new cable laying techniques that allow for faster and less expensive installation.
Restraining Factors
Installation and Maintenance Costs
Compared to other transmission mediums such as satellite, microwave, or copper wire cables, submarine fiber cable systems have higher installation and maintenance costs. Submarine fiber cable deployment is expensive because it necessitates specialized vessels and apparatus. In addition, the maintenance cost is high, as the cable's optimal operation requires skilled personnel and frequent monitoring.
To overcome these obstacles, inventiveness and cost-cutting measures are required. Alternative installation methods, such as Horizontal Directional Drilling (HDD) and Micro-Trenching, can aid in reducing installation costs. Additionally, opting for long-term service contracts with reputable vendors can reduce maintenance expenses.
Regulatory Challenges
Due to concerns about national security and territorial disputes, the submarine fiber cable industry is heavily regulated. Regulatory issues such as procuring permits and licenses, adhering to environmental regulations, and adhering to data protection laws add another layer of complexity to the installation of submarine fiber cables.
To surmount regulatory challenges, it is essential to identify and engage early on with relevant regulatory bodies. Understanding regulatory frameworks and offering solutions to resolve regulatory constraints can also facilitate streamlined deployment processes.
Application Analysis
Due to its broad variety of applications, the Submarine Power Cables Segment dominates the Submarine Fiber Cable Market. Submarine power cables are utilized to transmit electricity across oceans and seas, linking outlying regions to the main electrical grid. These cables are also utilized to connect offshore wind farms to the main electrical grid. In addition, they are utilized to connect offshore oil and gas facilities to renewable energy sources.
The Submarine Power Cables Segment is being propelled by economic growth in emerging economies. Countries like China and India are rapidly expanding and developing their electrical infrastructure, necessitating the installation of power cables. In addition, countries in Southeast Asia and Africa are experiencing an increase in electricity demand, resulting in a rise in the use of submarine power cables.
The trend and consumer behavior toward the Submarine Power Cables Segment is driven by the requirement for long-distance, dependable electricity transmission. Submarine power cables minimize transmission losses, reduce the number of circuit interruptions, and improve efficiency, making them preferable to conventional overhead power lines.
Voltage Analysis
Due to its capacity to transmit larger quantities of power over greater distances, the High Voltage Segment dominates the Submarine Fiber Cable Market. Offshore oil and gas facilities and offshore wind farms are connected to the electrical grid by means of high-voltage submarine cables. In addition, they are used to connect electrical grids between countries, such as the North Sea Link connecting Norway and the United Kingdom.
The adoption of the High Voltage Segment is driven by economic development in emerging economies. Due to an increase in electricity demand, emerging economies are investing in their electrical infrastructure, which necessitates higher voltage power cables for more reliable and efficient power transmission.
The need for a more efficient and dependable power transmission system is driving the consumer trend and behavior toward the High Voltage Segment. The High Voltage Segment provides greater transmission capacity over extended distances, reduces transmission losses, and improves efficiency, making it a superior alternative to conventional overhead lines.
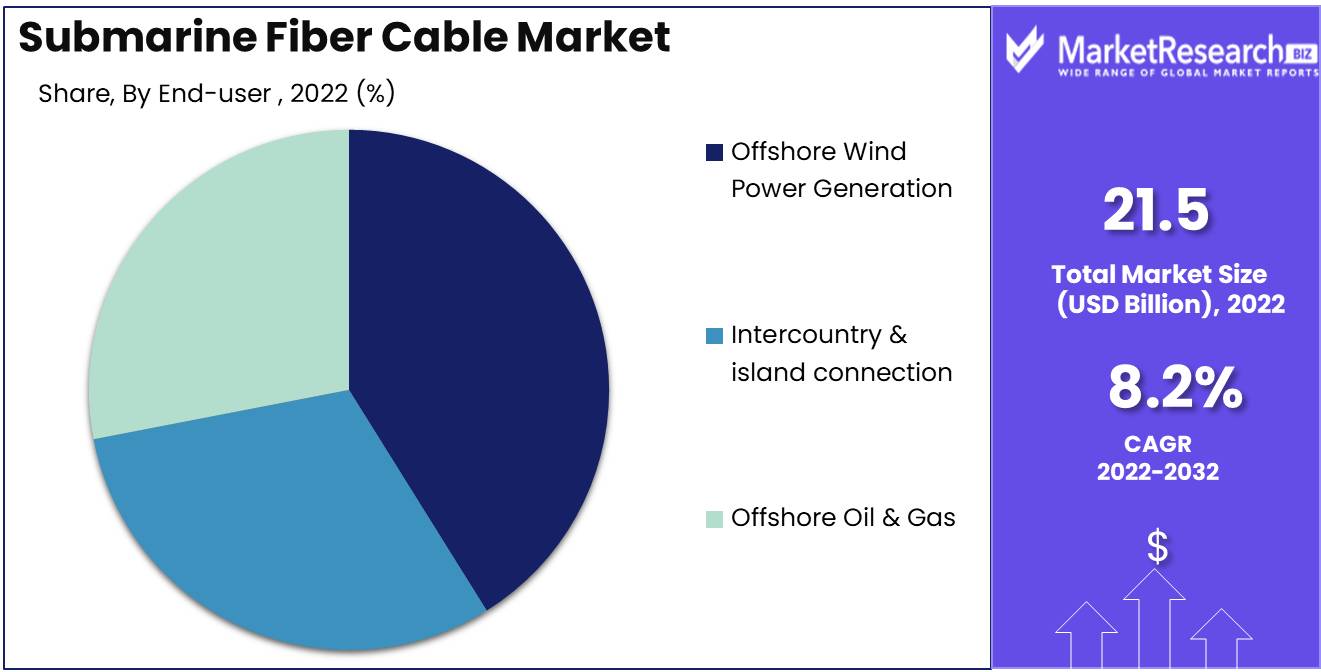
End-user Analysis
Due to the growing demand for renewable energy sources, the Offshore Wind Power Generation Segment dominates the Submarine Fiber Cable Market. Submarine cables are utilized to link offshore wind farms to the main electrical grid.
Economic Development in Emerging Economies drives the Offshore Wind Power Generation Segment's adoption. Renewable energy sources, such as wind power, are increasingly adopted by developing nations to satisfy their rising electricity demand and reduce their carbon footprint.
The demand for renewable energy sources is driving consumer trends and behavior toward the Offshore Wind Power Generation Segment. The Offshore Wind Power Generation Segment reduces reliance on fossil fuels, mitigating climate change's negative effects
Key Market Segments
By Application
- Submarine Power Cables
- Submarine Communication Cables
By Voltage
- High Voltage
- Medium Voltage
- Extra High Voltage
By End-user
- Offshore Wind Power Generation
- Intercountry & island connection
- Offshore Oil & Gas
Growth Opportunity
Investments in Submarine Cables
The growth of the submarine fiber cable market is primarily driven by investments in submarine cables. Governments, content providers, and telecommunications companies are all investing heavily in new submarine cable projects to satisfy the rising demand for high-speed internet connectivity and enhanced network performance. These new projects involve the installation of brand-new cables in addition to the expansion and modernization of existing cables.
Integration with Data Centers
The integration of cables with data centers is an additional factor contributing to the growth of the submarine fiber cable market. As data center operators seek to enhance the reach and performance of their networks, they are increasingly interested in integrating with submarine fiber cables. This integration enables data centers to increase their network capacity, improve network reliability and latency, and increase their capacity to provide hybrid cloud solutions to consumers.
Undersea Exploration Expansion
The expansion of undersea exploration activities is the third factor fueling the growth of the submarine fiber cable market. Human activities in the deep ocean have increased over time, necessitating the installation of additional cables. Governments, oil and gas exploration companies, and environmental groups have devised projects requiring the installation of submarine cables. Environmental organizations use the cables to monitor water contamination and changes in ocean temperature, while oil and gas exploration companies use the cables to monitor exploratory activities.
Latest Trends
Growth in International Data Traffic and Bandwidth Demand
International data traffic is exploding due to the growing demand for high-speed, dependable Internet access. As more enterprises and individuals establish cross-border connections, the demand for bandwidth is increasing at an unprecedented rate. To satisfy this demand, the submarine fiber cable industry is experiencing a flurry of investment, with companies seeking to lay new cables and expand existing networks across the world's oceans.
Expansion of submarine cable networks in emerging markets
Emerging markets have historically been underserved in terms of internet connectivity, whereas the established world has long enjoyed fast and dependable internet access. However, this is beginning to change as an increasing number of businesses seek to capitalize on the enormous potential presented by developing nations. Consequently, submarine cable networks are rapidly expanding in emergent markets, with companies laying new cables and constructing new landing stations in regions such as Latin America, Africa, and Southeast Asia.
Advances in Submarine Cable Technology for Higher Capacity
To satisfy the rising demand for international data traffic and bandwidth, submarine cable technology is advancing rapidly. The most recent iteration of cables is capable of providing greater capacity than ever before, enabling faster, more dependable connectivity over even the greatest distances. In the meantime, improvements in cable design and manufacturing processes are reducing costs and increasing efficiency, making it simpler for businesses to lay new cables and expand their networks.
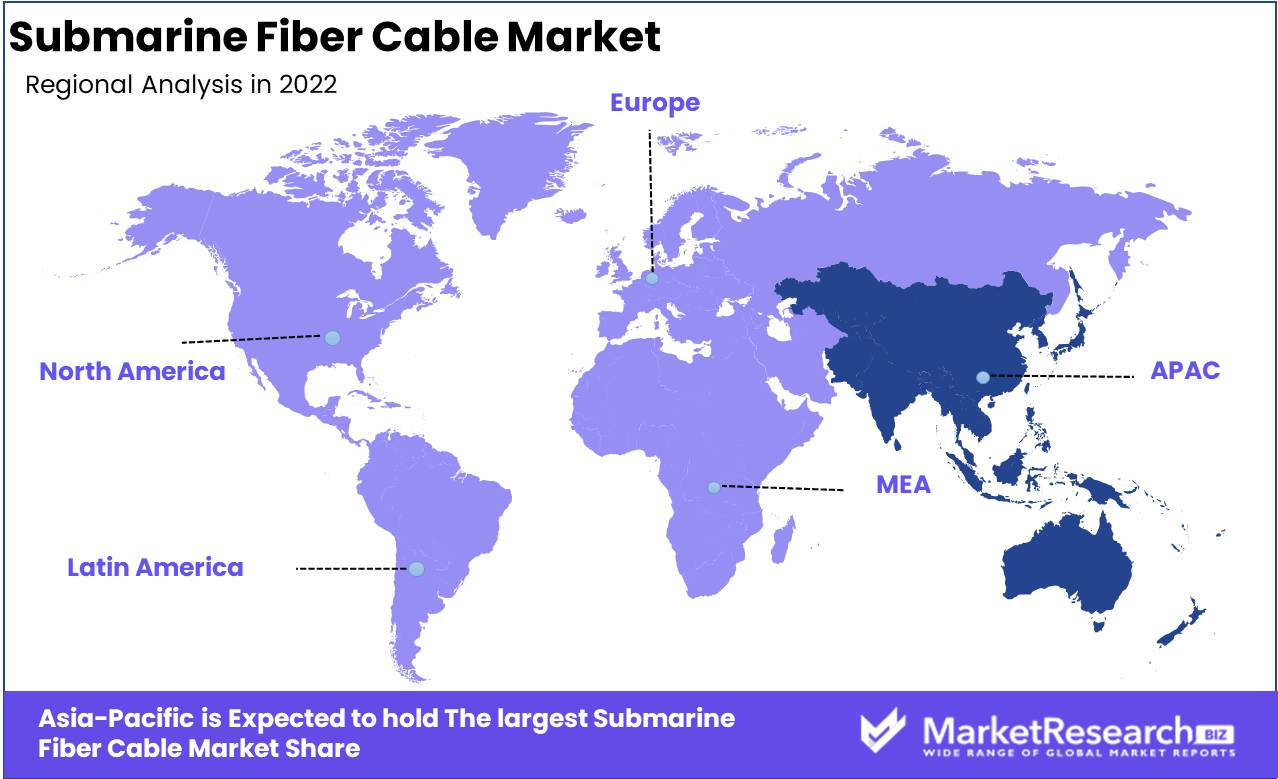
Regional Analysis
The Asia-Pacific region has emerged as a dominant force in the submarine fiber cable market, strengthening its position as the world's leader in telecommunications infrastructure. This dominance can be attributed to a number of significant factors that have fueled the region's development and expansion in this industry.
The Asia-Pacific region has a substantial population, with countries such as China and India accounting for a significant portion of the global population. This enormous consumer base has generated a substantial demand for high-speed internet connectivity and data transmission, necessitating the installation of robust submarine fiber cable networks. As a consequence, there has been a significant increase in regional investments in submarine cable systems.
Some of the world's fastest-growing economies, including China, India, Japan, and South Korea, are located in the Asia-Pacific region. These nations have experienced accelerated technological advancements, a rise in digitalization, and an increase in internet usage. To satisfy the rising demand for dependable and high-bandwidth communication, the installation of submarine fiber cables has become a top priority.
In addition, the Asia-Pacific region's geographical characteristics contribute to its market dominance in submarine fiber cable. Numerous archipelagos, islands, and coastal regions require efficient and dependable connectivity in this region. Submarine cables provide a cost-effective and efficient means of connecting these geographically dispersed locations, allowing for seamless communication and data transmission.
Key Regions and Countries
North America
- US
- Canada
- Mexico
Western Europe
- Germany
- France
- The UK
- Spain
- Italy
- Portugal
- Ireland
- Austria
- Switzerland
- Benelux
- Nordic
- Rest of Western Europe
Eastern Europe
- Russia
- Poland
- The Czech Republic
- Greece
- Rest of Eastern Europe
APAC
- China
- Japan
- South Korea
- India
- Australia & New Zealand
- Indonesia
- Malaysia
- Philippines
- Singapore
- Thailand
- Vietnam
- Rest of APAC
Latin America
- Brazil
- Colombia
- Chile
- Argentina
- Costa Rica
- Rest of Latin America
Middle East & Africa
- Algeria
- Egypt
- Israel
- Kuwait
- Nigeria
- Saudi Arabia
- South Africa
- Turkey
- United Arab Emirates
- Rest of MEA
Key Players Analysis
The market for submarine fiber cable is highly competitive and can be segmented by cable type, service, and region. In order to develop advanced, efficient, and dependable submarine cable systems, the dominant players in the submarine fiber cable market are investing significantly in research and development.
Alcatel-Lucent Submarine Networks, NEC Corporation, Fujitsu Limited, Huawei Marine Networks Co., Ltd., TE SubCom, and Nokia Corporation are some of the leading companies in the submarine fiber cable market. These businesses provide an extensive range of submarine cable services, including installation, maintenance, and repair.
Alcatel-Lucent Submarine Networks, a division of Nokia Corporation, is the market leader in submarine fiber cable. The company offers a range of cable services, including installation, repair, and maintenance. In addition, the company has created innovative cable systems that increase the capacity and efficiency of underwater communication.
NEC Corporation is another significant participant in the market for submarine fiber cables. Advanced submarine cable systems with high capacity and minimal latency have been developed by the company. The company also provides a range of cable maintenance, repair, and installation services.
Top Key Players in the Submarine Fiber Cable Market
- Nokia Corporation
- NEC Corporation
- Prysmian Group
- Huawei Investment & Holding Co., Ltd.
- KDDI CORPORATION
- Fujitsu Ltd.
- KEI Industries Limited
- Nexans S.A.
- SubCom, LLC
- LS Cable & System Ltd.
- Turkuaz Cable, Inc.
- Hydro Group Plc.
- Xtera Communications, Inc.
Recent Development
- In 2022, NEC announced the launch of NEC FLAG-H, its new submarine fiber cable. This new cable is designed to be even more resilient and reliable than previous submarine fiber cables, offering improved performance and dependability to meet the ever-increasing demands of the digital age.
- In 2022, Google announced Google Curie, its newest submarine fiber cable. The cable will connect the United States and Europe with ultra-low latency, providing connectivity that is faster and more reliable than ever before.
- In 2023, China Mobile announced that its new submarine fiber cable, China Mobile CN2, will be launched. This cable is designed to connect China with Europe and the Middle East, providing customers with faster and more reliable connectivity as well as access to key global markets.
- In 2023, Facebook announced the Facebook Echo submarine fiber cable. The cable is designed to connect the United States and Europe with ultra-high bandwidth, providing consumers and businesses with faster and more reliable connectivity.
Report Scope
Report Features Description Market Value (2022) USD 21.5 Bn Forecast Revenue (2032) USD 46.4 Bn CAGR (2023-2032) 8.2% Base Year for Estimation 2022 Historic Period 2016-2022 Forecast Period 2023-2032 Report Coverage Revenue Forecast, Market Dynamics, COVID-19 Impact, Competitive Landscape, Recent Developments Segments Covered By Application(Submarine Power Cables, Submarine Communication Cables), By Voltage(High Voltage, Medium Voltage, Extra High Voltage), By End-user(Offshore Wind Power Generation, Intercountry & island connection, Offshore Oil & Gas) Regional Analysis North America – The US, Canada, & Mexico; Western Europe – Germany, France, The UK, Spain, Italy, Portugal, Ireland, Austria, Switzerland, Benelux, Nordic, & Rest of Western Europe; Eastern Europe – Russia, Poland, The Czech Republic, Greece, & Rest of Eastern Europe; APAC – China, Japan, South Korea, India, Australia & New Zealand, Indonesia, Malaysia, Philippines, Singapore, Thailand, Vietnam, & Rest of APAC; Latin America – Brazil, Colombia, Chile, Argentina, Costa Rica, & Rest of Latin America; the Middle East & Africa – Algeria, Egypt, Israel, Kuwait, Nigeria, Saudi Arabia, South Africa, Turkey, United Arab Emirates, & Rest of MEA Competitive Landscape Nokia Corporation, NEC Corporation, Prysmian Group, Huawei Investment & Holding Co., Ltd., KDDI CORPORATION, Fujitsu Ltd., KEI Industries Limited, Nexans S.A., SubCom, LLC, LS Cable & System Ltd., Turkuaz Cable, Inc., Hydro Group Plc., Xtera Communications, Inc. Customization Scope Customization for segments, region/country-level will be provided. Moreover, additional customization can be done based on the requirements. Purchase Options We have three licenses to opt for: Single User License, Multi-User License (Up to 5 Users), Corporate Use License (Unlimited User and Printable PDF) - Nokia Corporation
- NEC Corporation
- Prysmian Group
- Huawei Investment & Holding Co., Ltd.
- KDDI CORPORATION
- Fujitsu Ltd.
- KEI Industries Limited
- Nexans S.A.
- SubCom, LLC
- LS Cable & System Ltd.
- Turkuaz Cable, Inc.
- Hydro Group Plc.
- Xtera Communications, Inc.
- 1. Executive Summary
- 1.1. Definition
- 1.2. Taxonomy
- 1.3. Research Scope
- 1.4. Key Analysis
- 1.5. Key Findings by Major Segments
- 1.6. Top strategies by Major Players
- 2. Global Submarine Fiber Cable Market Overview
- 2.1. Submarine Fiber Cable Market Dynamics
- 2.1.1. Drivers
- 2.1.2. Opportunities
- 2.1.3. Restraints
- 2.1.4. Challenges
- 2.2. Macro-economic Factors
- 2.3. Regulatory Framework
- 2.4. Market Investment Feasibility Index
- 2.5. PEST Analysis
- 2.6. PORTER’S Five Force Analysis
- 2.7. Drivers & Restraints Impact Analysis
- 2.8. Industry Chain Analysis
- 2.9. Cost Structure Analysis
- 2.10. Marketing Strategy
- 2.11. Russia-Ukraine War Impact Analysis
- 2.12. Opportunity Map Analysis
- 2.13. Market Competition Scenario Analysis
- 2.14. Product Life Cycle Analysis
- 2.15. Opportunity Orbits
- 2.16. Manufacturer Intensity Map
- 2.17. Major Companies sales by Value & Volume
- 2.1. Submarine Fiber Cable Market Dynamics
- 3. Global Submarine Fiber Cable Market Analysis, Opportunity and Forecast, 2016-2032
- 3.1. Global Submarine Fiber Cable Market Analysis, 2016-2021
- 3.2. Global Submarine Fiber Cable Market Opportunity and Forecast, 2023-2032
- 3.3. Global Submarine Fiber Cable Market Analysis, Opportunity and Forecast, By By Application, 2016-2032
- 3.3.1. Global Submarine Fiber Cable Market Analysis by By Application: Introduction
- 3.3.2. Market Size Absolute $ Opportunity Analysis and Forecast, By By Application, 2016-2032
- 3.3.3. Submarine Power Cables
- 3.3.4. Submarine Communication Cables
- 3.4. Global Submarine Fiber Cable Market Analysis, Opportunity and Forecast, By By Voltage, 2016-2032
- 3.4.1. Global Submarine Fiber Cable Market Analysis by By Voltage: Introduction
- 3.4.2. Market Size Absolute $ Opportunity Analysis and Forecast, By By Voltage, 2016-2032
- 3.4.3. High Voltage
- 3.4.4. Medium Voltage
- 3.4.5. Extra High Voltage
- 3.5. Global Submarine Fiber Cable Market Analysis, Opportunity and Forecast, By By End-user, 2016-2032
- 3.5.1. Global Submarine Fiber Cable Market Analysis by By End-user: Introduction
- 3.5.2. Market Size Absolute $ Opportunity Analysis and Forecast, By By End-user, 2016-2032
- 3.5.3. Offshore Wind Power Generation
- 3.5.4. Intercountry & island connection
- 3.5.5. Offshore Oil & Gas
- 3.6. Global Submarine Fiber Cable Market Analysis, Opportunity and Forecast, By , 2016-2032
- 3.6.1. Global Submarine Fiber Cable Market Analysis by : Introduction
- 3.6.2. Market Size Absolute $ Opportunity Analysis and Forecast, By , 2016-2032
- 4. North America Submarine Fiber Cable Market Analysis, Opportunity and Forecast, 2016-2032
- 4.1. North America Submarine Fiber Cable Market Analysis, 2016-2021
- 4.2. North America Submarine Fiber Cable Market Opportunity and Forecast, 2023-2032
- 4.3. North America Submarine Fiber Cable Market Analysis, Opportunity and Forecast, By By Application, 2016-2032
- 4.3.1. North America Submarine Fiber Cable Market Analysis by By Application: Introduction
- 4.3.2. Market Size Absolute $ Opportunity Analysis and Forecast, By By Application, 2016-2032
- 4.3.3. Submarine Power Cables
- 4.3.4. Submarine Communication Cables
- 4.4. North America Submarine Fiber Cable Market Analysis, Opportunity and Forecast, By By Voltage, 2016-2032
- 4.4.1. North America Submarine Fiber Cable Market Analysis by By Voltage: Introduction
- 4.4.2. Market Size Absolute $ Opportunity Analysis and Forecast, By By Voltage, 2016-2032
- 4.4.3. High Voltage
- 4.4.4. Medium Voltage
- 4.4.5. Extra High Voltage
- 4.5. North America Submarine Fiber Cable Market Analysis, Opportunity and Forecast, By By End-user, 2016-2032
- 4.5.1. North America Submarine Fiber Cable Market Analysis by By End-user: Introduction
- 4.5.2. Market Size Absolute $ Opportunity Analysis and Forecast, By By End-user, 2016-2032
- 4.5.3. Offshore Wind Power Generation
- 4.5.4. Intercountry & island connection
- 4.5.5. Offshore Oil & Gas
- 4.6. North America Submarine Fiber Cable Market Analysis, Opportunity and Forecast, By , 2016-2032
- 4.6.1. North America Submarine Fiber Cable Market Analysis by : Introduction
- 4.6.2. Market Size Absolute $ Opportunity Analysis and Forecast, By , 2016-2032
- 4.7. North America Submarine Fiber Cable Market Analysis, Opportunity and Forecast, By Country , 2016-2032
- 4.7.1. North America Submarine Fiber Cable Market Analysis by Country : Introduction
- 4.7.2. Market Size Absolute $ Opportunity Analysis and Forecast, Country , 2016-2032
- 4.7.2.1. The US
- 4.7.2.2. Canada
- 4.7.2.3. Mexico
- 5. Western Europe Submarine Fiber Cable Market Analysis, Opportunity and Forecast, 2016-2032
- 5.1. Western Europe Submarine Fiber Cable Market Analysis, 2016-2021
- 5.2. Western Europe Submarine Fiber Cable Market Opportunity and Forecast, 2023-2032
- 5.3. Western Europe Submarine Fiber Cable Market Analysis, Opportunity and Forecast, By By Application, 2016-2032
- 5.3.1. Western Europe Submarine Fiber Cable Market Analysis by By Application: Introduction
- 5.3.2. Market Size Absolute $ Opportunity Analysis and Forecast, By By Application, 2016-2032
- 5.3.3. Submarine Power Cables
- 5.3.4. Submarine Communication Cables
- 5.4. Western Europe Submarine Fiber Cable Market Analysis, Opportunity and Forecast, By By Voltage, 2016-2032
- 5.4.1. Western Europe Submarine Fiber Cable Market Analysis by By Voltage: Introduction
- 5.4.2. Market Size Absolute $ Opportunity Analysis and Forecast, By By Voltage, 2016-2032
- 5.4.3. High Voltage
- 5.4.4. Medium Voltage
- 5.4.5. Extra High Voltage
- 5.5. Western Europe Submarine Fiber Cable Market Analysis, Opportunity and Forecast, By By End-user, 2016-2032
- 5.5.1. Western Europe Submarine Fiber Cable Market Analysis by By End-user: Introduction
- 5.5.2. Market Size Absolute $ Opportunity Analysis and Forecast, By By End-user, 2016-2032
- 5.5.3. Offshore Wind Power Generation
- 5.5.4. Intercountry & island connection
- 5.5.5. Offshore Oil & Gas
- 5.6. Western Europe Submarine Fiber Cable Market Analysis, Opportunity and Forecast, By , 2016-2032
- 5.6.1. Western Europe Submarine Fiber Cable Market Analysis by : Introduction
- 5.6.2. Market Size Absolute $ Opportunity Analysis and Forecast, By , 2016-2032
- 5.7. Western Europe Submarine Fiber Cable Market Analysis, Opportunity and Forecast, By Country , 2016-2032
- 5.7.1. Western Europe Submarine Fiber Cable Market Analysis by Country : Introduction
- 5.7.2. Market Size Absolute $ Opportunity Analysis and Forecast, Country , 2016-2032
- 5.7.2.1. Germany
- 5.7.2.2. France
- 5.7.2.3. The UK
- 5.7.2.4. Spain
- 5.7.2.5. Italy
- 5.7.2.6. Portugal
- 5.7.2.7. Ireland
- 5.7.2.8. Austria
- 5.7.2.9. Switzerland
- 5.7.2.10. Benelux
- 5.7.2.11. Nordic
- 5.7.2.12. Rest of Western Europe
- 6. Eastern Europe Submarine Fiber Cable Market Analysis, Opportunity and Forecast, 2016-2032
- 6.1. Eastern Europe Submarine Fiber Cable Market Analysis, 2016-2021
- 6.2. Eastern Europe Submarine Fiber Cable Market Opportunity and Forecast, 2023-2032
- 6.3. Eastern Europe Submarine Fiber Cable Market Analysis, Opportunity and Forecast, By By Application, 2016-2032
- 6.3.1. Eastern Europe Submarine Fiber Cable Market Analysis by By Application: Introduction
- 6.3.2. Market Size Absolute $ Opportunity Analysis and Forecast, By By Application, 2016-2032
- 6.3.3. Submarine Power Cables
- 6.3.4. Submarine Communication Cables
- 6.4. Eastern Europe Submarine Fiber Cable Market Analysis, Opportunity and Forecast, By By Voltage, 2016-2032
- 6.4.1. Eastern Europe Submarine Fiber Cable Market Analysis by By Voltage: Introduction
- 6.4.2. Market Size Absolute $ Opportunity Analysis and Forecast, By By Voltage, 2016-2032
- 6.4.3. High Voltage
- 6.4.4. Medium Voltage
- 6.4.5. Extra High Voltage
- 6.5. Eastern Europe Submarine Fiber Cable Market Analysis, Opportunity and Forecast, By By End-user, 2016-2032
- 6.5.1. Eastern Europe Submarine Fiber Cable Market Analysis by By End-user: Introduction
- 6.5.2. Market Size Absolute $ Opportunity Analysis and Forecast, By By End-user, 2016-2032
- 6.5.3. Offshore Wind Power Generation
- 6.5.4. Intercountry & island connection
- 6.5.5. Offshore Oil & Gas
- 6.6. Eastern Europe Submarine Fiber Cable Market Analysis, Opportunity and Forecast, By , 2016-2032
- 6.6.1. Eastern Europe Submarine Fiber Cable Market Analysis by : Introduction
- 6.6.2. Market Size Absolute $ Opportunity Analysis and Forecast, By , 2016-2032
- 6.7. Eastern Europe Submarine Fiber Cable Market Analysis, Opportunity and Forecast, By Country , 2016-2032
- 6.7.1. Eastern Europe Submarine Fiber Cable Market Analysis by Country : Introduction
- 6.7.2. Market Size Absolute $ Opportunity Analysis and Forecast, Country , 2016-2032
- 6.7.2.1. Russia
- 6.7.2.2. Poland
- 6.7.2.3. The Czech Republic
- 6.7.2.4. Greece
- 6.7.2.5. Rest of Eastern Europe
- 7. APAC Submarine Fiber Cable Market Analysis, Opportunity and Forecast, 2016-2032
- 7.1. APAC Submarine Fiber Cable Market Analysis, 2016-2021
- 7.2. APAC Submarine Fiber Cable Market Opportunity and Forecast, 2023-2032
- 7.3. APAC Submarine Fiber Cable Market Analysis, Opportunity and Forecast, By By Application, 2016-2032
- 7.3.1. APAC Submarine Fiber Cable Market Analysis by By Application: Introduction
- 7.3.2. Market Size Absolute $ Opportunity Analysis and Forecast, By By Application, 2016-2032
- 7.3.3. Submarine Power Cables
- 7.3.4. Submarine Communication Cables
- 7.4. APAC Submarine Fiber Cable Market Analysis, Opportunity and Forecast, By By Voltage, 2016-2032
- 7.4.1. APAC Submarine Fiber Cable Market Analysis by By Voltage: Introduction
- 7.4.2. Market Size Absolute $ Opportunity Analysis and Forecast, By By Voltage, 2016-2032
- 7.4.3. High Voltage
- 7.4.4. Medium Voltage
- 7.4.5. Extra High Voltage
- 7.5. APAC Submarine Fiber Cable Market Analysis, Opportunity and Forecast, By By End-user, 2016-2032
- 7.5.1. APAC Submarine Fiber Cable Market Analysis by By End-user: Introduction
- 7.5.2. Market Size Absolute $ Opportunity Analysis and Forecast, By By End-user, 2016-2032
- 7.5.3. Offshore Wind Power Generation
- 7.5.4. Intercountry & island connection
- 7.5.5. Offshore Oil & Gas
- 7.6. APAC Submarine Fiber Cable Market Analysis, Opportunity and Forecast, By , 2016-2032
- 7.6.1. APAC Submarine Fiber Cable Market Analysis by : Introduction
- 7.6.2. Market Size Absolute $ Opportunity Analysis and Forecast, By , 2016-2032
- 7.7. APAC Submarine Fiber Cable Market Analysis, Opportunity and Forecast, By Country , 2016-2032
- 7.7.1. APAC Submarine Fiber Cable Market Analysis by Country : Introduction
- 7.7.2. Market Size Absolute $ Opportunity Analysis and Forecast, Country , 2016-2032
- 7.7.2.1. China
- 7.7.2.2. Japan
- 7.7.2.3. South Korea
- 7.7.2.4. India
- 7.7.2.5. Australia & New Zeland
- 7.7.2.6. Indonesia
- 7.7.2.7. Malaysia
- 7.7.2.8. Philippines
- 7.7.2.9. Singapore
- 7.7.2.10. Thailand
- 7.7.2.11. Vietnam
- 7.7.2.12. Rest of APAC
- 8. Latin America Submarine Fiber Cable Market Analysis, Opportunity and Forecast, 2016-2032
- 8.1. Latin America Submarine Fiber Cable Market Analysis, 2016-2021
- 8.2. Latin America Submarine Fiber Cable Market Opportunity and Forecast, 2023-2032
- 8.3. Latin America Submarine Fiber Cable Market Analysis, Opportunity and Forecast, By By Application, 2016-2032
- 8.3.1. Latin America Submarine Fiber Cable Market Analysis by By Application: Introduction
- 8.3.2. Market Size Absolute $ Opportunity Analysis and Forecast, By By Application, 2016-2032
- 8.3.3. Submarine Power Cables
- 8.3.4. Submarine Communication Cables
- 8.4. Latin America Submarine Fiber Cable Market Analysis, Opportunity and Forecast, By By Voltage, 2016-2032
- 8.4.1. Latin America Submarine Fiber Cable Market Analysis by By Voltage: Introduction
- 8.4.2. Market Size Absolute $ Opportunity Analysis and Forecast, By By Voltage, 2016-2032
- 8.4.3. High Voltage
- 8.4.4. Medium Voltage
- 8.4.5. Extra High Voltage
- 8.5. Latin America Submarine Fiber Cable Market Analysis, Opportunity and Forecast, By By End-user, 2016-2032
- 8.5.1. Latin America Submarine Fiber Cable Market Analysis by By End-user: Introduction
- 8.5.2. Market Size Absolute $ Opportunity Analysis and Forecast, By By End-user, 2016-2032
- 8.5.3. Offshore Wind Power Generation
- 8.5.4. Intercountry & island connection
- 8.5.5. Offshore Oil & Gas
- 8.6. Latin America Submarine Fiber Cable Market Analysis, Opportunity and Forecast, By , 2016-2032
- 8.6.1. Latin America Submarine Fiber Cable Market Analysis by : Introduction
- 8.6.2. Market Size Absolute $ Opportunity Analysis and Forecast, By , 2016-2032
- 8.7. Latin America Submarine Fiber Cable Market Analysis, Opportunity and Forecast, By Country , 2016-2032
- 8.7.1. Latin America Submarine Fiber Cable Market Analysis by Country : Introduction
- 8.7.2. Market Size Absolute $ Opportunity Analysis and Forecast, Country , 2016-2032
- 8.7.2.1. Brazil
- 8.7.2.2. Colombia
- 8.7.2.3. Chile
- 8.7.2.4. Argentina
- 8.7.2.5. Costa Rica
- 8.7.2.6. Rest of Latin America
- 9. Middle East & Africa Submarine Fiber Cable Market Analysis, Opportunity and Forecast, 2016-2032
- 9.1. Middle East & Africa Submarine Fiber Cable Market Analysis, 2016-2021
- 9.2. Middle East & Africa Submarine Fiber Cable Market Opportunity and Forecast, 2023-2032
- 9.3. Middle East & Africa Submarine Fiber Cable Market Analysis, Opportunity and Forecast, By By Application, 2016-2032
- 9.3.1. Middle East & Africa Submarine Fiber Cable Market Analysis by By Application: Introduction
- 9.3.2. Market Size Absolute $ Opportunity Analysis and Forecast, By By Application, 2016-2032
- 9.3.3. Submarine Power Cables
- 9.3.4. Submarine Communication Cables
- 9.4. Middle East & Africa Submarine Fiber Cable Market Analysis, Opportunity and Forecast, By By Voltage, 2016-2032
- 9.4.1. Middle East & Africa Submarine Fiber Cable Market Analysis by By Voltage: Introduction
- 9.4.2. Market Size Absolute $ Opportunity Analysis and Forecast, By By Voltage, 2016-2032
- 9.4.3. High Voltage
- 9.4.4. Medium Voltage
- 9.4.5. Extra High Voltage
- 9.5. Middle East & Africa Submarine Fiber Cable Market Analysis, Opportunity and Forecast, By By End-user, 2016-2032
- 9.5.1. Middle East & Africa Submarine Fiber Cable Market Analysis by By End-user: Introduction
- 9.5.2. Market Size Absolute $ Opportunity Analysis and Forecast, By By End-user, 2016-2032
- 9.5.3. Offshore Wind Power Generation
- 9.5.4. Intercountry & island connection
- 9.5.5. Offshore Oil & Gas
- 9.6. Middle East & Africa Submarine Fiber Cable Market Analysis, Opportunity and Forecast, By , 2016-2032
- 9.6.1. Middle East & Africa Submarine Fiber Cable Market Analysis by : Introduction
- 9.6.2. Market Size Absolute $ Opportunity Analysis and Forecast, By , 2016-2032
- 9.7. Middle East & Africa Submarine Fiber Cable Market Analysis, Opportunity and Forecast, By Country , 2016-2032
- 9.7.1. Middle East & Africa Submarine Fiber Cable Market Analysis by Country : Introduction
- 9.7.2. Market Size Absolute $ Opportunity Analysis and Forecast, Country , 2016-2032
- 9.7.2.1. Algeria
- 9.7.2.2. Egypt
- 9.7.2.3. Israel
- 9.7.2.4. Kuwait
- 9.7.2.5. Nigeria
- 9.7.2.6. Saudi Arabia
- 9.7.2.7. South Africa
- 9.7.2.8. Turkey
- 9.7.2.9. The UAE
- 9.7.2.10. Rest of MEA
- 10. Global Submarine Fiber Cable Market Analysis, Opportunity and Forecast, By Region , 2016-2032
- 10.1. Global Submarine Fiber Cable Market Analysis by Region : Introduction
- 10.2. Market Size Absolute $ Opportunity Analysis and Forecast, By Region , 2016-2032
- 10.2.1. North America
- 10.2.2. Western Europe
- 10.2.3. Eastern Europe
- 10.2.4. APAC
- 10.2.5. Latin America
- 10.2.6. Middle East & Africa
- 11. Global Submarine Fiber Cable Market Competitive Landscape, Market Share Analysis, and Company Profiles
- 11.1. Market Share Analysis
- 11.2. Company Profiles
- 11.3. Nokia Corporation
- 11.3.1. Company Overview
- 11.3.2. Financial Highlights
- 11.3.3. Product Portfolio
- 11.3.4. SWOT Analysis
- 11.3.5. Key Strategies and Developments
- 11.4. NEC Corporation
- 11.4.1. Company Overview
- 11.4.2. Financial Highlights
- 11.4.3. Product Portfolio
- 11.4.4. SWOT Analysis
- 11.4.5. Key Strategies and Developments
- 11.5. Prysmian Group
- 11.5.1. Company Overview
- 11.5.2. Financial Highlights
- 11.5.3. Product Portfolio
- 11.5.4. SWOT Analysis
- 11.5.5. Key Strategies and Developments
- 11.6. Huawei Investment & Holding Co., Ltd.
- 11.6.1. Company Overview
- 11.6.2. Financial Highlights
- 11.6.3. Product Portfolio
- 11.6.4. SWOT Analysis
- 11.6.5. Key Strategies and Developments
- 11.7. KDDI CORPORATION
- 11.7.1. Company Overview
- 11.7.2. Financial Highlights
- 11.7.3. Product Portfolio
- 11.7.4. SWOT Analysis
- 11.7.5. Key Strategies and Developments
- 11.8. Fujitsu Ltd.
- 11.8.1. Company Overview
- 11.8.2. Financial Highlights
- 11.8.3. Product Portfolio
- 11.8.4. SWOT Analysis
- 11.8.5. Key Strategies and Developments
- 11.9. KEI Industries Limited
- 11.9.1. Company Overview
- 11.9.2. Financial Highlights
- 11.9.3. Product Portfolio
- 11.9.4. SWOT Analysis
- 11.9.5. Key Strategies and Developments
- 11.10. Nexans S.A.
- 11.10.1. Company Overview
- 11.10.2. Financial Highlights
- 11.10.3. Product Portfolio
- 11.10.4. SWOT Analysis
- 11.10.5. Key Strategies and Developments
- 11.11. SubCom, LLC
- 11.11.1. Company Overview
- 11.11.2. Financial Highlights
- 11.11.3. Product Portfolio
- 11.11.4. SWOT Analysis
- 11.11.5. Key Strategies and Developments
- 11.12. LS Cable & System Ltd.
- 11.12.1. Company Overview
- 11.12.2. Financial Highlights
- 11.12.3. Product Portfolio
- 11.12.4. SWOT Analysis
- 11.12.5. Key Strategies and Developments
- 11.13. Turkuaz Cable, Inc.
- 11.13.1. Company Overview
- 11.13.2. Financial Highlights
- 11.13.3. Product Portfolio
- 11.13.4. SWOT Analysis
- 11.13.5. Key Strategies and Developments
- 11.14. Hydro Group Plc.
- 11.14.1. Company Overview
- 11.14.2. Financial Highlights
- 11.14.3. Product Portfolio
- 11.14.4. SWOT Analysis
- 11.14.5. Key Strategies and Developments
- 11.15. Xtera Communications, Inc.
- 11.15.1. Company Overview
- 11.15.2. Financial Highlights
- 11.15.3. Product Portfolio
- 11.15.4. SWOT Analysis
- 11.15.5. Key Strategies and Developments
- 12. Assumptions and Acronyms
- 13. Research Methodology
- 14. Contact
- List of Figures
- Figure 1: Global Submarine Fiber Cable Market Revenue (US$ Mn) Market Share by By Application in 2022
- Figure 2: Global Submarine Fiber Cable Market Attractiveness Analysis by By Application, 2016-2032
- Figure 3: Global Submarine Fiber Cable Market Revenue (US$ Mn) Market Share by By Voltagein 2022
- Figure 4: Global Submarine Fiber Cable Market Attractiveness Analysis by By Voltage, 2016-2032
- Figure 5: Global Submarine Fiber Cable Market Revenue (US$ Mn) Market Share by By End-userin 2022
- Figure 6: Global Submarine Fiber Cable Market Attractiveness Analysis by By End-user, 2016-2032
- Figure 7: Global Submarine Fiber Cable Market Revenue (US$ Mn) Market Share by in 2022
- Figure 8: Global Submarine Fiber Cable Market Attractiveness Analysis by , 2016-2032
- Figure 9: Global Submarine Fiber Cable Market Revenue (US$ Mn) Market Share by Region in 2022
- Figure 10: Global Submarine Fiber Cable Market Attractiveness Analysis by Region, 2016-2032
- Figure 11: Global Submarine Fiber Cable Market Revenue (US$ Mn) (2016-2032)
- Figure 12: Global Submarine Fiber Cable Market Revenue (US$ Mn) Comparison by Region (2016-2032)
- Figure 13: Global Submarine Fiber Cable Market Revenue (US$ Mn) Comparison by By Application (2016-2032)
- Figure 14: Global Submarine Fiber Cable Market Revenue (US$ Mn) Comparison by By Voltage (2016-2032)
- Figure 15: Global Submarine Fiber Cable Market Revenue (US$ Mn) Comparison by By End-user (2016-2032)
- Figure 16: Global Submarine Fiber Cable Market Revenue (US$ Mn) Comparison by (2016-2032)
- Figure 17: Global Submarine Fiber Cable Market Y-o-Y Growth Rate Comparison by Region (2016-2032)
- Figure 18: Global Submarine Fiber Cable Market Y-o-Y Growth Rate Comparison by By Application (2016-2032)
- Figure 19: Global Submarine Fiber Cable Market Y-o-Y Growth Rate Comparison by By Voltage (2016-2032)
- Figure 20: Global Submarine Fiber Cable Market Y-o-Y Growth Rate Comparison by By End-user (2016-2032)
- Figure 21: Global Submarine Fiber Cable Market Y-o-Y Growth Rate Comparison by (2016-2032)
- Figure 22: Global Submarine Fiber Cable Market Share Comparison by Region (2016-2032)
- Figure 23: Global Submarine Fiber Cable Market Share Comparison by By Application (2016-2032)
- Figure 24: Global Submarine Fiber Cable Market Share Comparison by By Voltage (2016-2032)
- Figure 25: Global Submarine Fiber Cable Market Share Comparison by By End-user (2016-2032)
- Figure 26: Global Submarine Fiber Cable Market Share Comparison by (2016-2032)
- Figure 27: North America Submarine Fiber Cable Market Revenue (US$ Mn) Market Share by By Applicationin 2022
- Figure 28: North America Submarine Fiber Cable Market Attractiveness Analysis by By Application, 2016-2032
- Figure 29: North America Submarine Fiber Cable Market Revenue (US$ Mn) Market Share by By Voltagein 2022
- Figure 30: North America Submarine Fiber Cable Market Attractiveness Analysis by By Voltage, 2016-2032
- Figure 31: North America Submarine Fiber Cable Market Revenue (US$ Mn) Market Share by By End-userin 2022
- Figure 32: North America Submarine Fiber Cable Market Attractiveness Analysis by By End-user, 2016-2032
- Figure 33: North America Submarine Fiber Cable Market Revenue (US$ Mn) Market Share by in 2022
- Figure 34: North America Submarine Fiber Cable Market Attractiveness Analysis by , 2016-2032
- Figure 35: North America Submarine Fiber Cable Market Revenue (US$ Mn) Market Share by Country in 2022
- Figure 36: North America Submarine Fiber Cable Market Attractiveness Analysis by Country, 2016-2032
- Figure 37: North America Submarine Fiber Cable Market Revenue (US$ Mn) (2016-2032)
- Figure 38: North America Submarine Fiber Cable Market Revenue (US$ Mn) Comparison by Country (2016-2032)
- Figure 39: North America Submarine Fiber Cable Market Revenue (US$ Mn) Comparison by By Application (2016-2032)
- Figure 40: North America Submarine Fiber Cable Market Revenue (US$ Mn) Comparison by By Voltage (2016-2032)
- Figure 41: North America Submarine Fiber Cable Market Revenue (US$ Mn) Comparison by By End-user (2016-2032)
- Figure 42: North America Submarine Fiber Cable Market Revenue (US$ Mn) Comparison by (2016-2032)
- Figure 43: North America Submarine Fiber Cable Market Y-o-Y Growth Rate Comparison by Country (2016-2032)
- Figure 44: North America Submarine Fiber Cable Market Y-o-Y Growth Rate Comparison by By Application (2016-2032)
- Figure 45: North America Submarine Fiber Cable Market Y-o-Y Growth Rate Comparison by By Voltage (2016-2032)
- Figure 46: North America Submarine Fiber Cable Market Y-o-Y Growth Rate Comparison by By End-user (2016-2032)
- Figure 47: North America Submarine Fiber Cable Market Y-o-Y Growth Rate Comparison by (2016-2032)
- Figure 48: North America Submarine Fiber Cable Market Share Comparison by Country (2016-2032)
- Figure 49: North America Submarine Fiber Cable Market Share Comparison by By Application (2016-2032)
- Figure 50: North America Submarine Fiber Cable Market Share Comparison by By Voltage (2016-2032)
- Figure 51: North America Submarine Fiber Cable Market Share Comparison by By End-user (2016-2032)
- Figure 52: North America Submarine Fiber Cable Market Share Comparison by (2016-2032)
- Figure 53: Western Europe Submarine Fiber Cable Market Revenue (US$ Mn) Market Share by By Applicationin 2022
- Figure 54: Western Europe Submarine Fiber Cable Market Attractiveness Analysis by By Application, 2016-2032
- Figure 55: Western Europe Submarine Fiber Cable Market Revenue (US$ Mn) Market Share by By Voltagein 2022
- Figure 56: Western Europe Submarine Fiber Cable Market Attractiveness Analysis by By Voltage, 2016-2032
- Figure 57: Western Europe Submarine Fiber Cable Market Revenue (US$ Mn) Market Share by By End-userin 2022
- Figure 58: Western Europe Submarine Fiber Cable Market Attractiveness Analysis by By End-user, 2016-2032
- Figure 59: Western Europe Submarine Fiber Cable Market Revenue (US$ Mn) Market Share by in 2022
- Figure 60: Western Europe Submarine Fiber Cable Market Attractiveness Analysis by , 2016-2032
- Figure 61: Western Europe Submarine Fiber Cable Market Revenue (US$ Mn) Market Share by Country in 2022
- Figure 62: Western Europe Submarine Fiber Cable Market Attractiveness Analysis by Country, 2016-2032
- Figure 63: Western Europe Submarine Fiber Cable Market Revenue (US$ Mn) (2016-2032)
- Figure 64: Western Europe Submarine Fiber Cable Market Revenue (US$ Mn) Comparison by Country (2016-2032)
- Figure 65: Western Europe Submarine Fiber Cable Market Revenue (US$ Mn) Comparison by By Application (2016-2032)
- Figure 66: Western Europe Submarine Fiber Cable Market Revenue (US$ Mn) Comparison by By Voltage (2016-2032)
- Figure 67: Western Europe Submarine Fiber Cable Market Revenue (US$ Mn) Comparison by By End-user (2016-2032)
- Figure 68: Western Europe Submarine Fiber Cable Market Revenue (US$ Mn) Comparison by (2016-2032)
- Figure 69: Western Europe Submarine Fiber Cable Market Y-o-Y Growth Rate Comparison by Country (2016-2032)
- Figure 70: Western Europe Submarine Fiber Cable Market Y-o-Y Growth Rate Comparison by By Application (2016-2032)
- Figure 71: Western Europe Submarine Fiber Cable Market Y-o-Y Growth Rate Comparison by By Voltage (2016-2032)
- Figure 72: Western Europe Submarine Fiber Cable Market Y-o-Y Growth Rate Comparison by By End-user (2016-2032)
- Figure 73: Western Europe Submarine Fiber Cable Market Y-o-Y Growth Rate Comparison by (2016-2032)
- Figure 74: Western Europe Submarine Fiber Cable Market Share Comparison by Country (2016-2032)
- Figure 75: Western Europe Submarine Fiber Cable Market Share Comparison by By Application (2016-2032)
- Figure 76: Western Europe Submarine Fiber Cable Market Share Comparison by By Voltage (2016-2032)
- Figure 77: Western Europe Submarine Fiber Cable Market Share Comparison by By End-user (2016-2032)
- Figure 78: Western Europe Submarine Fiber Cable Market Share Comparison by (2016-2032)
- Figure 79: Eastern Europe Submarine Fiber Cable Market Revenue (US$ Mn) Market Share by By Applicationin 2022
- Figure 80: Eastern Europe Submarine Fiber Cable Market Attractiveness Analysis by By Application, 2016-2032
- Figure 81: Eastern Europe Submarine Fiber Cable Market Revenue (US$ Mn) Market Share by By Voltagein 2022
- Figure 82: Eastern Europe Submarine Fiber Cable Market Attractiveness Analysis by By Voltage, 2016-2032
- Figure 83: Eastern Europe Submarine Fiber Cable Market Revenue (US$ Mn) Market Share by By End-userin 2022
- Figure 84: Eastern Europe Submarine Fiber Cable Market Attractiveness Analysis by By End-user, 2016-2032
- Figure 85: Eastern Europe Submarine Fiber Cable Market Revenue (US$ Mn) Market Share by in 2022
- Figure 86: Eastern Europe Submarine Fiber Cable Market Attractiveness Analysis by , 2016-2032
- Figure 87: Eastern Europe Submarine Fiber Cable Market Revenue (US$ Mn) Market Share by Country in 2022
- Figure 88: Eastern Europe Submarine Fiber Cable Market Attractiveness Analysis by Country, 2016-2032
- Figure 89: Eastern Europe Submarine Fiber Cable Market Revenue (US$ Mn) (2016-2032)
- Figure 90: Eastern Europe Submarine Fiber Cable Market Revenue (US$ Mn) Comparison by Country (2016-2032)
- Figure 91: Eastern Europe Submarine Fiber Cable Market Revenue (US$ Mn) Comparison by By Application (2016-2032)
- Figure 92: Eastern Europe Submarine Fiber Cable Market Revenue (US$ Mn) Comparison by By Voltage (2016-2032)
- Figure 93: Eastern Europe Submarine Fiber Cable Market Revenue (US$ Mn) Comparison by By End-user (2016-2032)
- Figure 94: Eastern Europe Submarine Fiber Cable Market Revenue (US$ Mn) Comparison by (2016-2032)
- Figure 95: Eastern Europe Submarine Fiber Cable Market Y-o-Y Growth Rate Comparison by Country (2016-2032)
- Figure 96: Eastern Europe Submarine Fiber Cable Market Y-o-Y Growth Rate Comparison by By Application (2016-2032)
- Figure 97: Eastern Europe Submarine Fiber Cable Market Y-o-Y Growth Rate Comparison by By Voltage (2016-2032)
- Figure 98: Eastern Europe Submarine Fiber Cable Market Y-o-Y Growth Rate Comparison by By End-user (2016-2032)
- Figure 99: Eastern Europe Submarine Fiber Cable Market Y-o-Y Growth Rate Comparison by (2016-2032)
- Figure 100: Eastern Europe Submarine Fiber Cable Market Share Comparison by Country (2016-2032)
- Figure 101: Eastern Europe Submarine Fiber Cable Market Share Comparison by By Application (2016-2032)
- Figure 102: Eastern Europe Submarine Fiber Cable Market Share Comparison by By Voltage (2016-2032)
- Figure 103: Eastern Europe Submarine Fiber Cable Market Share Comparison by By End-user (2016-2032)
- Figure 104: Eastern Europe Submarine Fiber Cable Market Share Comparison by (2016-2032)
- Figure 105: APAC Submarine Fiber Cable Market Revenue (US$ Mn) Market Share by By Applicationin 2022
- Figure 106: APAC Submarine Fiber Cable Market Attractiveness Analysis by By Application, 2016-2032
- Figure 107: APAC Submarine Fiber Cable Market Revenue (US$ Mn) Market Share by By Voltagein 2022
- Figure 108: APAC Submarine Fiber Cable Market Attractiveness Analysis by By Voltage, 2016-2032
- Figure 109: APAC Submarine Fiber Cable Market Revenue (US$ Mn) Market Share by By End-userin 2022
- Figure 110: APAC Submarine Fiber Cable Market Attractiveness Analysis by By End-user, 2016-2032
- Figure 111: APAC Submarine Fiber Cable Market Revenue (US$ Mn) Market Share by in 2022
- Figure 112: APAC Submarine Fiber Cable Market Attractiveness Analysis by , 2016-2032
- Figure 113: APAC Submarine Fiber Cable Market Revenue (US$ Mn) Market Share by Country in 2022
- Figure 114: APAC Submarine Fiber Cable Market Attractiveness Analysis by Country, 2016-2032
- Figure 115: APAC Submarine Fiber Cable Market Revenue (US$ Mn) (2016-2032)
- Figure 116: APAC Submarine Fiber Cable Market Revenue (US$ Mn) Comparison by Country (2016-2032)
- Figure 117: APAC Submarine Fiber Cable Market Revenue (US$ Mn) Comparison by By Application (2016-2032)
- Figure 118: APAC Submarine Fiber Cable Market Revenue (US$ Mn) Comparison by By Voltage (2016-2032)
- Figure 119: APAC Submarine Fiber Cable Market Revenue (US$ Mn) Comparison by By End-user (2016-2032)
- Figure 120: APAC Submarine Fiber Cable Market Revenue (US$ Mn) Comparison by (2016-2032)
- Figure 121: APAC Submarine Fiber Cable Market Y-o-Y Growth Rate Comparison by Country (2016-2032)
- Figure 122: APAC Submarine Fiber Cable Market Y-o-Y Growth Rate Comparison by By Application (2016-2032)
- Figure 123: APAC Submarine Fiber Cable Market Y-o-Y Growth Rate Comparison by By Voltage (2016-2032)
- Figure 124: APAC Submarine Fiber Cable Market Y-o-Y Growth Rate Comparison by By End-user (2016-2032)
- Figure 125: APAC Submarine Fiber Cable Market Y-o-Y Growth Rate Comparison by (2016-2032)
- Figure 126: APAC Submarine Fiber Cable Market Share Comparison by Country (2016-2032)
- Figure 127: APAC Submarine Fiber Cable Market Share Comparison by By Application (2016-2032)
- Figure 128: APAC Submarine Fiber Cable Market Share Comparison by By Voltage (2016-2032)
- Figure 129: APAC Submarine Fiber Cable Market Share Comparison by By End-user (2016-2032)
- Figure 130: APAC Submarine Fiber Cable Market Share Comparison by (2016-2032)
- Figure 131: Latin America Submarine Fiber Cable Market Revenue (US$ Mn) Market Share by By Applicationin 2022
- Figure 132: Latin America Submarine Fiber Cable Market Attractiveness Analysis by By Application, 2016-2032
- Figure 133: Latin America Submarine Fiber Cable Market Revenue (US$ Mn) Market Share by By Voltagein 2022
- Figure 134: Latin America Submarine Fiber Cable Market Attractiveness Analysis by By Voltage, 2016-2032
- Figure 135: Latin America Submarine Fiber Cable Market Revenue (US$ Mn) Market Share by By End-userin 2022
- Figure 136: Latin America Submarine Fiber Cable Market Attractiveness Analysis by By End-user, 2016-2032
- Figure 137: Latin America Submarine Fiber Cable Market Revenue (US$ Mn) Market Share by in 2022
- Figure 138: Latin America Submarine Fiber Cable Market Attractiveness Analysis by , 2016-2032
- Figure 139: Latin America Submarine Fiber Cable Market Revenue (US$ Mn) Market Share by Country in 2022
- Figure 140: Latin America Submarine Fiber Cable Market Attractiveness Analysis by Country, 2016-2032
- Figure 141: Latin America Submarine Fiber Cable Market Revenue (US$ Mn) (2016-2032)
- Figure 142: Latin America Submarine Fiber Cable Market Revenue (US$ Mn) Comparison by Country (2016-2032)
- Figure 143: Latin America Submarine Fiber Cable Market Revenue (US$ Mn) Comparison by By Application (2016-2032)
- Figure 144: Latin America Submarine Fiber Cable Market Revenue (US$ Mn) Comparison by By Voltage (2016-2032)
- Figure 145: Latin America Submarine Fiber Cable Market Revenue (US$ Mn) Comparison by By End-user (2016-2032)
- Figure 146: Latin America Submarine Fiber Cable Market Revenue (US$ Mn) Comparison by (2016-2032)
- Figure 147: Latin America Submarine Fiber Cable Market Y-o-Y Growth Rate Comparison by Country (2016-2032)
- Figure 148: Latin America Submarine Fiber Cable Market Y-o-Y Growth Rate Comparison by By Application (2016-2032)
- Figure 149: Latin America Submarine Fiber Cable Market Y-o-Y Growth Rate Comparison by By Voltage (2016-2032)
- Figure 150: Latin America Submarine Fiber Cable Market Y-o-Y Growth Rate Comparison by By End-user (2016-2032)
- Figure 151: Latin America Submarine Fiber Cable Market Y-o-Y Growth Rate Comparison by (2016-2032)
- Figure 152: Latin America Submarine Fiber Cable Market Share Comparison by Country (2016-2032)
- Figure 153: Latin America Submarine Fiber Cable Market Share Comparison by By Application (2016-2032)
- Figure 154: Latin America Submarine Fiber Cable Market Share Comparison by By Voltage (2016-2032)
- Figure 155: Latin America Submarine Fiber Cable Market Share Comparison by By End-user (2016-2032)
- Figure 156: Latin America Submarine Fiber Cable Market Share Comparison by (2016-2032)
- Figure 157: Middle East & Africa Submarine Fiber Cable Market Revenue (US$ Mn) Market Share by By Applicationin 2022
- Figure 158: Middle East & Africa Submarine Fiber Cable Market Attractiveness Analysis by By Application, 2016-2032
- Figure 159: Middle East & Africa Submarine Fiber Cable Market Revenue (US$ Mn) Market Share by By Voltagein 2022
- Figure 160: Middle East & Africa Submarine Fiber Cable Market Attractiveness Analysis by By Voltage, 2016-2032
- Figure 161: Middle East & Africa Submarine Fiber Cable Market Revenue (US$ Mn) Market Share by By End-userin 2022
- Figure 162: Middle East & Africa Submarine Fiber Cable Market Attractiveness Analysis by By End-user, 2016-2032
- Figure 163: Middle East & Africa Submarine Fiber Cable Market Revenue (US$ Mn) Market Share by in 2022
- Figure 164: Middle East & Africa Submarine Fiber Cable Market Attractiveness Analysis by , 2016-2032
- Figure 165: Middle East & Africa Submarine Fiber Cable Market Revenue (US$ Mn) Market Share by Country in 2022
- Figure 166: Middle East & Africa Submarine Fiber Cable Market Attractiveness Analysis by Country, 2016-2032
- Figure 167: Middle East & Africa Submarine Fiber Cable Market Revenue (US$ Mn) (2016-2032)
- Figure 168: Middle East & Africa Submarine Fiber Cable Market Revenue (US$ Mn) Comparison by Country (2016-2032)
- Figure 169: Middle East & Africa Submarine Fiber Cable Market Revenue (US$ Mn) Comparison by By Application (2016-2032)
- Figure 170: Middle East & Africa Submarine Fiber Cable Market Revenue (US$ Mn) Comparison by By Voltage (2016-2032)
- Figure 171: Middle East & Africa Submarine Fiber Cable Market Revenue (US$ Mn) Comparison by By End-user (2016-2032)
- Figure 172: Middle East & Africa Submarine Fiber Cable Market Revenue (US$ Mn) Comparison by (2016-2032)
- Figure 173: Middle East & Africa Submarine Fiber Cable Market Y-o-Y Growth Rate Comparison by Country (2016-2032)
- Figure 174: Middle East & Africa Submarine Fiber Cable Market Y-o-Y Growth Rate Comparison by By Application (2016-2032)
- Figure 175: Middle East & Africa Submarine Fiber Cable Market Y-o-Y Growth Rate Comparison by By Voltage (2016-2032)
- Figure 176: Middle East & Africa Submarine Fiber Cable Market Y-o-Y Growth Rate Comparison by By End-user (2016-2032)
- Figure 177: Middle East & Africa Submarine Fiber Cable Market Y-o-Y Growth Rate Comparison by (2016-2032)
- Figure 178: Middle East & Africa Submarine Fiber Cable Market Share Comparison by Country (2016-2032)
- Figure 179: Middle East & Africa Submarine Fiber Cable Market Share Comparison by By Application (2016-2032)
- Figure 180: Middle East & Africa Submarine Fiber Cable Market Share Comparison by By Voltage (2016-2032)
- Figure 181: Middle East & Africa Submarine Fiber Cable Market Share Comparison by By End-user (2016-2032)
- Figure 182: Middle East & Africa Submarine Fiber Cable Market Share Comparison by (2016-2032)
- Table 1: Global Submarine Fiber Cable Market Comparison by By Application (2016-2032)
- Table 2: Global Submarine Fiber Cable Market Comparison by By Voltage (2016-2032)
- Table 3: Global Submarine Fiber Cable Market Comparison by By End-user (2016-2032)
- Table 4: Global Submarine Fiber Cable Market Comparison by (2016-2032)
- Table 5: Global Submarine Fiber Cable Market Revenue (US$ Mn) Comparison by Region (2016-2032)
- Table 6: Global Submarine Fiber Cable Market Revenue (US$ Mn) (2016-2032)
- Table 7: Global Submarine Fiber Cable Market Revenue (US$ Mn) Comparison by Region (2016-2032)
- Table 8: Global Submarine Fiber Cable Market Revenue (US$ Mn) Comparison by By Application (2016-2032)
- Table 9: Global Submarine Fiber Cable Market Revenue (US$ Mn) Comparison by By Voltage (2016-2032)
- Table 10: Global Submarine Fiber Cable Market Revenue (US$ Mn) Comparison by By End-user (2016-2032)
- Table 11: Global Submarine Fiber Cable Market Revenue (US$ Mn) Comparison by (2016-2032)
- Table 12: Global Submarine Fiber Cable Market Y-o-Y Growth Rate Comparison by Region (2016-2032)
- Table 13: Global Submarine Fiber Cable Market Y-o-Y Growth Rate Comparison by By Application (2016-2032)
- Table 14: Global Submarine Fiber Cable Market Y-o-Y Growth Rate Comparison by By Voltage (2016-2032)
- Table 15: Global Submarine Fiber Cable Market Y-o-Y Growth Rate Comparison by By End-user (2016-2032)
- Table 16: Global Submarine Fiber Cable Market Y-o-Y Growth Rate Comparison by (2016-2032)
- Table 17: Global Submarine Fiber Cable Market Share Comparison by Region (2016-2032)
- Table 18: Global Submarine Fiber Cable Market Share Comparison by By Application (2016-2032)
- Table 19: Global Submarine Fiber Cable Market Share Comparison by By Voltage (2016-2032)
- Table 20: Global Submarine Fiber Cable Market Share Comparison by By End-user (2016-2032)
- Table 21: Global Submarine Fiber Cable Market Share Comparison by (2016-2032)
- Table 22: North America Submarine Fiber Cable Market Comparison by By Voltage (2016-2032)
- Table 23: North America Submarine Fiber Cable Market Comparison by By End-user (2016-2032)
- Table 24: North America Submarine Fiber Cable Market Comparison by (2016-2032)
- Table 25: North America Submarine Fiber Cable Market Revenue (US$ Mn) Comparison by Country (2016-2032)
- Table 26: North America Submarine Fiber Cable Market Revenue (US$ Mn) (2016-2032)
- Table 27: North America Submarine Fiber Cable Market Revenue (US$ Mn) Comparison by Country (2016-2032)
- Table 28: North America Submarine Fiber Cable Market Revenue (US$ Mn) Comparison by By Application (2016-2032)
- Table 29: North America Submarine Fiber Cable Market Revenue (US$ Mn) Comparison by By Voltage (2016-2032)
- Table 30: North America Submarine Fiber Cable Market Revenue (US$ Mn) Comparison by By End-user (2016-2032)
- Table 31: North America Submarine Fiber Cable Market Revenue (US$ Mn) Comparison by (2016-2032)
- Table 32: North America Submarine Fiber Cable Market Y-o-Y Growth Rate Comparison by Country (2016-2032)
- Table 33: North America Submarine Fiber Cable Market Y-o-Y Growth Rate Comparison by By Application (2016-2032)
- Table 34: North America Submarine Fiber Cable Market Y-o-Y Growth Rate Comparison by By Voltage (2016-2032)
- Table 35: North America Submarine Fiber Cable Market Y-o-Y Growth Rate Comparison by By End-user (2016-2032)
- Table 36: North America Submarine Fiber Cable Market Y-o-Y Growth Rate Comparison by (2016-2032)
- Table 37: North America Submarine Fiber Cable Market Share Comparison by Country (2016-2032)
- Table 38: North America Submarine Fiber Cable Market Share Comparison by By Application (2016-2032)
- Table 39: North America Submarine Fiber Cable Market Share Comparison by By Voltage (2016-2032)
- Table 40: North America Submarine Fiber Cable Market Share Comparison by By End-user (2016-2032)
- Table 41: North America Submarine Fiber Cable Market Share Comparison by (2016-2032)
- Table 42: Western Europe Submarine Fiber Cable Market Comparison by By Application (2016-2032)
- Table 43: Western Europe Submarine Fiber Cable Market Comparison by By Voltage (2016-2032)
- Table 44: Western Europe Submarine Fiber Cable Market Comparison by By End-user (2016-2032)
- Table 45: Western Europe Submarine Fiber Cable Market Comparison by (2016-2032)
- Table 46: Western Europe Submarine Fiber Cable Market Revenue (US$ Mn) Comparison by Country (2016-2032)
- Table 47: Western Europe Submarine Fiber Cable Market Revenue (US$ Mn) (2016-2032)
- Table 48: Western Europe Submarine Fiber Cable Market Revenue (US$ Mn) Comparison by Country (2016-2032)
- Table 49: Western Europe Submarine Fiber Cable Market Revenue (US$ Mn) Comparison by By Application (2016-2032)
- Table 50: Western Europe Submarine Fiber Cable Market Revenue (US$ Mn) Comparison by By Voltage (2016-2032)
- Table 51: Western Europe Submarine Fiber Cable Market Revenue (US$ Mn) Comparison by By End-user (2016-2032)
- Table 52: Western Europe Submarine Fiber Cable Market Revenue (US$ Mn) Comparison by (2016-2032)
- Table 53: Western Europe Submarine Fiber Cable Market Y-o-Y Growth Rate Comparison by Country (2016-2032)
- Table 54: Western Europe Submarine Fiber Cable Market Y-o-Y Growth Rate Comparison by By Application (2016-2032)
- Table 55: Western Europe Submarine Fiber Cable Market Y-o-Y Growth Rate Comparison by By Voltage (2016-2032)
- Table 56: Western Europe Submarine Fiber Cable Market Y-o-Y Growth Rate Comparison by By End-user (2016-2032)
- Table 57: Western Europe Submarine Fiber Cable Market Y-o-Y Growth Rate Comparison by (2016-2032)
- Table 58: Western Europe Submarine Fiber Cable Market Share Comparison by Country (2016-2032)
- Table 59: Western Europe Submarine Fiber Cable Market Share Comparison by By Application (2016-2032)
- Table 60: Western Europe Submarine Fiber Cable Market Share Comparison by By Voltage (2016-2032)
- Table 61: Western Europe Submarine Fiber Cable Market Share Comparison by By End-user (2016-2032)
- Table 62: Western Europe Submarine Fiber Cable Market Share Comparison by (2016-2032)
- Table 63: Eastern Europe Submarine Fiber Cable Market Comparison by By Application (2016-2032)
- Table 64: Eastern Europe Submarine Fiber Cable Market Comparison by By Voltage (2016-2032)
- Table 65: Eastern Europe Submarine Fiber Cable Market Comparison by By End-user (2016-2032)
- Table 66: Eastern Europe Submarine Fiber Cable Market Comparison by (2016-2032)
- Table 67: Eastern Europe Submarine Fiber Cable Market Revenue (US$ Mn) Comparison by Country (2016-2032)
- Table 68: Eastern Europe Submarine Fiber Cable Market Revenue (US$ Mn) (2016-2032)
- Table 69: Eastern Europe Submarine Fiber Cable Market Revenue (US$ Mn) Comparison by Country (2016-2032)
- Table 70: Eastern Europe Submarine Fiber Cable Market Revenue (US$ Mn) Comparison by By Application (2016-2032)
- Table 71: Eastern Europe Submarine Fiber Cable Market Revenue (US$ Mn) Comparison by By Voltage (2016-2032)
- Table 72: Eastern Europe Submarine Fiber Cable Market Revenue (US$ Mn) Comparison by By End-user (2016-2032)
- Table 73: Eastern Europe Submarine Fiber Cable Market Revenue (US$ Mn) Comparison by (2016-2032)
- Table 74: Eastern Europe Submarine Fiber Cable Market Y-o-Y Growth Rate Comparison by Country (2016-2032)
- Table 75: Eastern Europe Submarine Fiber Cable Market Y-o-Y Growth Rate Comparison by By Application (2016-2032)
- Table 76: Eastern Europe Submarine Fiber Cable Market Y-o-Y Growth Rate Comparison by By Voltage (2016-2032)
- Table 77: Eastern Europe Submarine Fiber Cable Market Y-o-Y Growth Rate Comparison by By End-user (2016-2032)
- Table 78: Eastern Europe Submarine Fiber Cable Market Y-o-Y Growth Rate Comparison by (2016-2032)
- Table 79: Eastern Europe Submarine Fiber Cable Market Share Comparison by Country (2016-2032)
- Table 80: Eastern Europe Submarine Fiber Cable Market Share Comparison by By Application (2016-2032)
- Table 81: Eastern Europe Submarine Fiber Cable Market Share Comparison by By Voltage (2016-2032)
- Table 82: Eastern Europe Submarine Fiber Cable Market Share Comparison by By End-user (2016-2032)
- Table 83: Eastern Europe Submarine Fiber Cable Market Share Comparison by (2016-2032)
- Table 84: APAC Submarine Fiber Cable Market Comparison by By Application (2016-2032)
- Table 85: APAC Submarine Fiber Cable Market Comparison by By Voltage (2016-2032)
- Table 86: APAC Submarine Fiber Cable Market Comparison by By End-user (2016-2032)
- Table 87: APAC Submarine Fiber Cable Market Comparison by (2016-2032)
- Table 88: APAC Submarine Fiber Cable Market Revenue (US$ Mn) Comparison by Country (2016-2032)
- Table 89: APAC Submarine Fiber Cable Market Revenue (US$ Mn) (2016-2032)
- Table 90: APAC Submarine Fiber Cable Market Revenue (US$ Mn) Comparison by Country (2016-2032)
- Table 91: APAC Submarine Fiber Cable Market Revenue (US$ Mn) Comparison by By Application (2016-2032)
- Table 92: APAC Submarine Fiber Cable Market Revenue (US$ Mn) Comparison by By Voltage (2016-2032)
- Table 93: APAC Submarine Fiber Cable Market Revenue (US$ Mn) Comparison by By End-user (2016-2032)
- Table 94: APAC Submarine Fiber Cable Market Revenue (US$ Mn) Comparison by (2016-2032)
- Table 95: APAC Submarine Fiber Cable Market Y-o-Y Growth Rate Comparison by Country (2016-2032)
- Table 96: APAC Submarine Fiber Cable Market Y-o-Y Growth Rate Comparison by By Application (2016-2032)
- Table 97: APAC Submarine Fiber Cable Market Y-o-Y Growth Rate Comparison by By Voltage (2016-2032)
- Table 98: APAC Submarine Fiber Cable Market Y-o-Y Growth Rate Comparison by By End-user (2016-2032)
- Table 99: APAC Submarine Fiber Cable Market Y-o-Y Growth Rate Comparison by (2016-2032)
- Table 100: APAC Submarine Fiber Cable Market Share Comparison by Country (2016-2032)
- Table 101: APAC Submarine Fiber Cable Market Share Comparison by By Application (2016-2032)
- Table 102: APAC Submarine Fiber Cable Market Share Comparison by By Voltage (2016-2032)
- Table 103: APAC Submarine Fiber Cable Market Share Comparison by By End-user (2016-2032)
- Table 104: APAC Submarine Fiber Cable Market Share Comparison by (2016-2032)
- Table 105: Latin America Submarine Fiber Cable Market Comparison by By Application (2016-2032)
- Table 106: Latin America Submarine Fiber Cable Market Comparison by By Voltage (2016-2032)
- Table 107: Latin America Submarine Fiber Cable Market Comparison by By End-user (2016-2032)
- Table 108: Latin America Submarine Fiber Cable Market Comparison by (2016-2032)
- Table 109: Latin America Submarine Fiber Cable Market Revenue (US$ Mn) Comparison by Country (2016-2032)
- Table 110: Latin America Submarine Fiber Cable Market Revenue (US$ Mn) (2016-2032)
- Table 111: Latin America Submarine Fiber Cable Market Revenue (US$ Mn) Comparison by Country (2016-2032)
- Table 112: Latin America Submarine Fiber Cable Market Revenue (US$ Mn) Comparison by By Application (2016-2032)
- Table 113: Latin America Submarine Fiber Cable Market Revenue (US$ Mn) Comparison by By Voltage (2016-2032)
- Table 114: Latin America Submarine Fiber Cable Market Revenue (US$ Mn) Comparison by By End-user (2016-2032)
- Table 115: Latin America Submarine Fiber Cable Market Revenue (US$ Mn) Comparison by (2016-2032)
- Table 116: Latin America Submarine Fiber Cable Market Y-o-Y Growth Rate Comparison by Country (2016-2032)
- Table 117: Latin America Submarine Fiber Cable Market Y-o-Y Growth Rate Comparison by By Application (2016-2032)
- Table 118: Latin America Submarine Fiber Cable Market Y-o-Y Growth Rate Comparison by By Voltage (2016-2032)
- Table 119: Latin America Submarine Fiber Cable Market Y-o-Y Growth Rate Comparison by By End-user (2016-2032)
- Table 120: Latin America Submarine Fiber Cable Market Y-o-Y Growth Rate Comparison by (2016-2032)
- Table 121: Latin America Submarine Fiber Cable Market Share Comparison by Country (2016-2032)
- Table 122: Latin America Submarine Fiber Cable Market Share Comparison by By Application (2016-2032)
- Table 123: Latin America Submarine Fiber Cable Market Share Comparison by By Voltage (2016-2032)
- Table 124: Latin America Submarine Fiber Cable Market Share Comparison by By End-user (2016-2032)
- Table 125: Latin America Submarine Fiber Cable Market Share Comparison by (2016-2032)
- Table 126: Middle East & Africa Submarine Fiber Cable Market Comparison by By Application (2016-2032)
- Table 127: Middle East & Africa Submarine Fiber Cable Market Comparison by By Voltage (2016-2032)
- Table 128: Middle East & Africa Submarine Fiber Cable Market Comparison by By End-user (2016-2032)
- Table 129: Middle East & Africa Submarine Fiber Cable Market Comparison by (2016-2032)
- Table 130: Middle East & Africa Submarine Fiber Cable Market Revenue (US$ Mn) Comparison by Country (2016-2032)
- Table 131: Middle East & Africa Submarine Fiber Cable Market Revenue (US$ Mn) (2016-2032)
- Table 132: Middle East & Africa Submarine Fiber Cable Market Revenue (US$ Mn) Comparison by Country (2016-2032)
- Table 133: Middle East & Africa Submarine Fiber Cable Market Revenue (US$ Mn) Comparison by By Application (2016-2032)
- Table 134: Middle East & Africa Submarine Fiber Cable Market Revenue (US$ Mn) Comparison by By Voltage (2016-2032)
- Table 135: Middle East & Africa Submarine Fiber Cable Market Revenue (US$ Mn) Comparison by By End-user (2016-2032)
- Table 136: Middle East & Africa Submarine Fiber Cable Market Revenue (US$ Mn) Comparison by (2016-2032)
- Table 137: Middle East & Africa Submarine Fiber Cable Market Y-o-Y Growth Rate Comparison by Country (2016-2032)
- Table 138: Middle East & Africa Submarine Fiber Cable Market Y-o-Y Growth Rate Comparison by By Application (2016-2032)
- Table 139: Middle East & Africa Submarine Fiber Cable Market Y-o-Y Growth Rate Comparison by By Voltage (2016-2032)
- Table 140: Middle East & Africa Submarine Fiber Cable Market Y-o-Y Growth Rate Comparison by By End-user (2016-2032)
- Table 141: Middle East & Africa Submarine Fiber Cable Market Y-o-Y Growth Rate Comparison by (2016-2032)
- Table 142: Middle East & Africa Submarine Fiber Cable Market Share Comparison by Country (2016-2032)
- Table 143: Middle East & Africa Submarine Fiber Cable Market Share Comparison by By Application (2016-2032)
- Table 144: Middle East & Africa Submarine Fiber Cable Market Share Comparison by By Voltage (2016-2032)
- Table 145: Middle East & Africa Submarine Fiber Cable Market Share Comparison by By End-user (2016-2032)
- Table 146: Middle East & Africa Submarine Fiber Cable Market Share Comparison by (2016-2032)
- 1. Executive Summary
Inquiry Form
Why Choose Us
- 360 Degree Approach
- Growth Consulting
- 24/7 Research Support
- Comprehensive-Level of Customization
- Competitive Intelligence
- Single-Country/ Region Intelligence
- Post-Sale Service Assistance
- Access to Lead Analysts
- Available in PDF, Excel, Word/ PPT
Request for Customization
OUR CLIENTS
Don't just take our word. We are trusted by these great companies!