
Soft Robotics Market By Type (Soft Grippers, Cobots, Inflated Robots, Exoskeleton), By Component (Hardware, Software), By End-User (Healthcare, Advanced Manufacturing, Food & Beverages, Logistics, Others), By Region And Companies - Industry Segment Outlook, Market Assessment, Competition Scenario, Trends, And Forecast 2024-2033
-
51311
-
September 2024
-
300
-


-
This report was compiled by Vishwa Gaul Vishwa is an experienced market research and consulting professional with over 8 years of expertise in the ICT industry, contributing to over 700 reports across telecommunications, software, hardware, and digital solutions. Correspondence Team Lead- ICT Linkedin | Detailed Market research Methodology Our methodology involves a mix of primary research, including interviews with leading mental health experts, and secondary research from reputable medical journals and databases. View Detailed Methodology Page
-
Quick Navigation
Report Overview
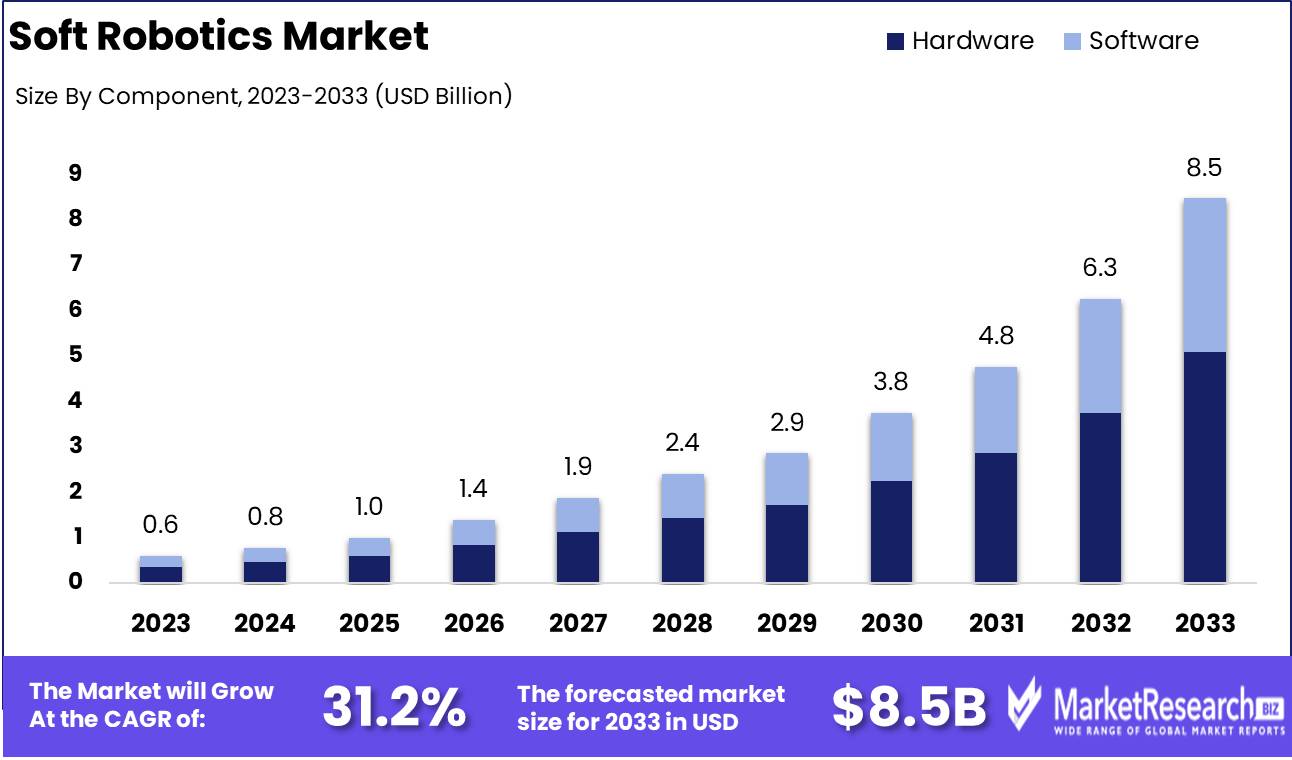
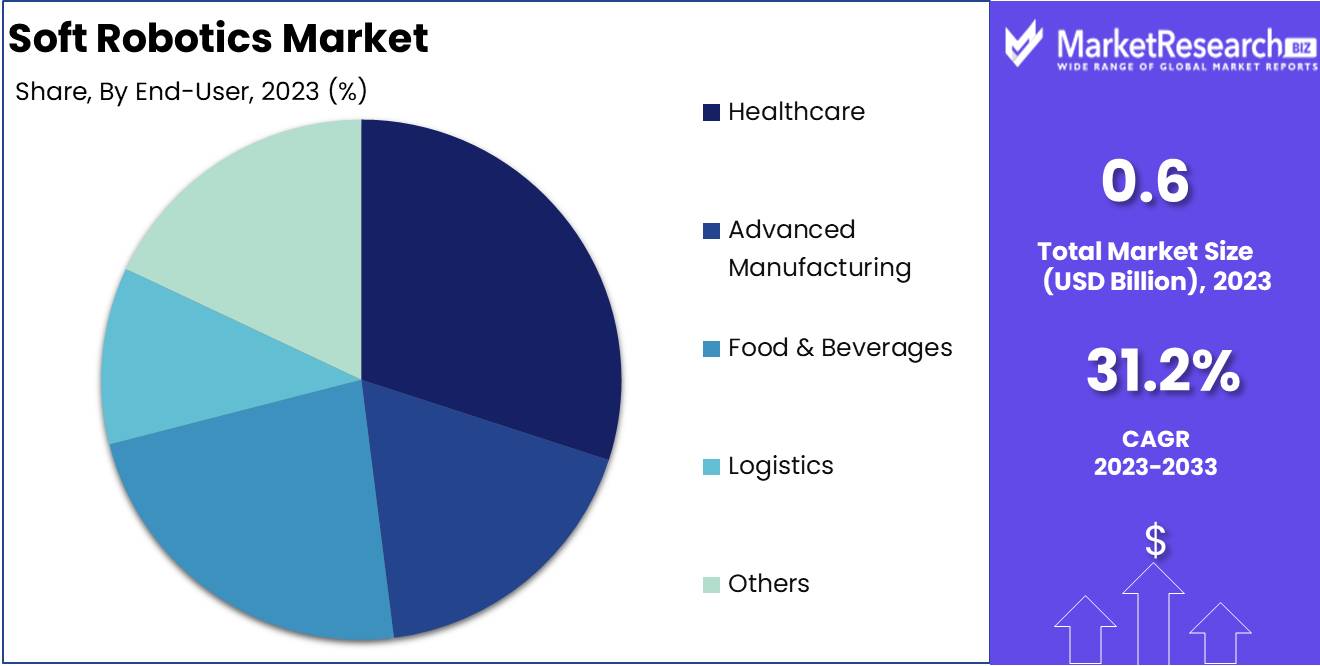
The Soft Robotics Market was valued at USD 0.6 billion in 2023. It is expected to reach USD 8.5 billion by 2033, with a CAGR of 31.2% during the forecast period from 2024 to 2033.
The Soft Robotics market encompasses the development and commercialization of robotic systems that utilize flexible, often bio-inspired materials and designs to perform tasks traditionally challenging for rigid robots. These systems are employed in the healthcare, manufacturing, and agriculture sectors, offering enhanced adaptability, safety, and dexterity in complex environments. Innovations in soft actuators, sensors, and control systems have driven significant market growth, supported by rising demand for automation and advancements in artificial intelligence.
The soft robotics market is poised for substantial growth, driven by advancements in automation, healthcare, and consumer electronics industries. A key factor in this market’s expansion is the rising demand for soft robotics in healthcare and medical devices, particularly in minimally invasive surgery, rehabilitation, and assistive devices. The increasing adoption of soft robotics in these areas underscores the need for more adaptable, flexible, and biocompatible solutions, contributing to improved patient outcomes. Additionally, the trend toward automation in various industrial sectors, such as manufacturing and logistics, further fuels demand, as soft robotics offer enhanced safety and flexibility compared to traditional rigid robotic systems.
However, high costs associated with development and implementation remain a significant barrier to wider adoption. The integration of soft robotics often requires complex and costly materials, along with advanced algorithms for control and functionality. Despite these challenges, growth in wearable robotics, particularly in the healthcare sector, indicates a promising trajectory for the market. The consumer electronics industry also plays a pivotal role, with the integration of soft robotics in devices such as wearables and smartphones driving innovation and further expanding market potential. Overall, the combination of rising healthcare demands, increasing industrial automation, and expanding consumer electronics applications positions the soft robotics market for accelerated growth, albeit tempered by cost-related challenges.
Key Takeaways
- Market Growth: The Soft Robotics Market was valued at USD 0.6 billion in 2023. It is expected to reach USD 8.5 billion by 2033, with a CAGR of 31.2% during the forecast period from 2024 to 2033.
- By Type: Soft Grippers dominated the diverse Soft Robotics market applications.
- By Component: Hardware dominated the soft robotics market by component.
- By End-User: Healthcare dominated the Soft Robotics Market by end-user.
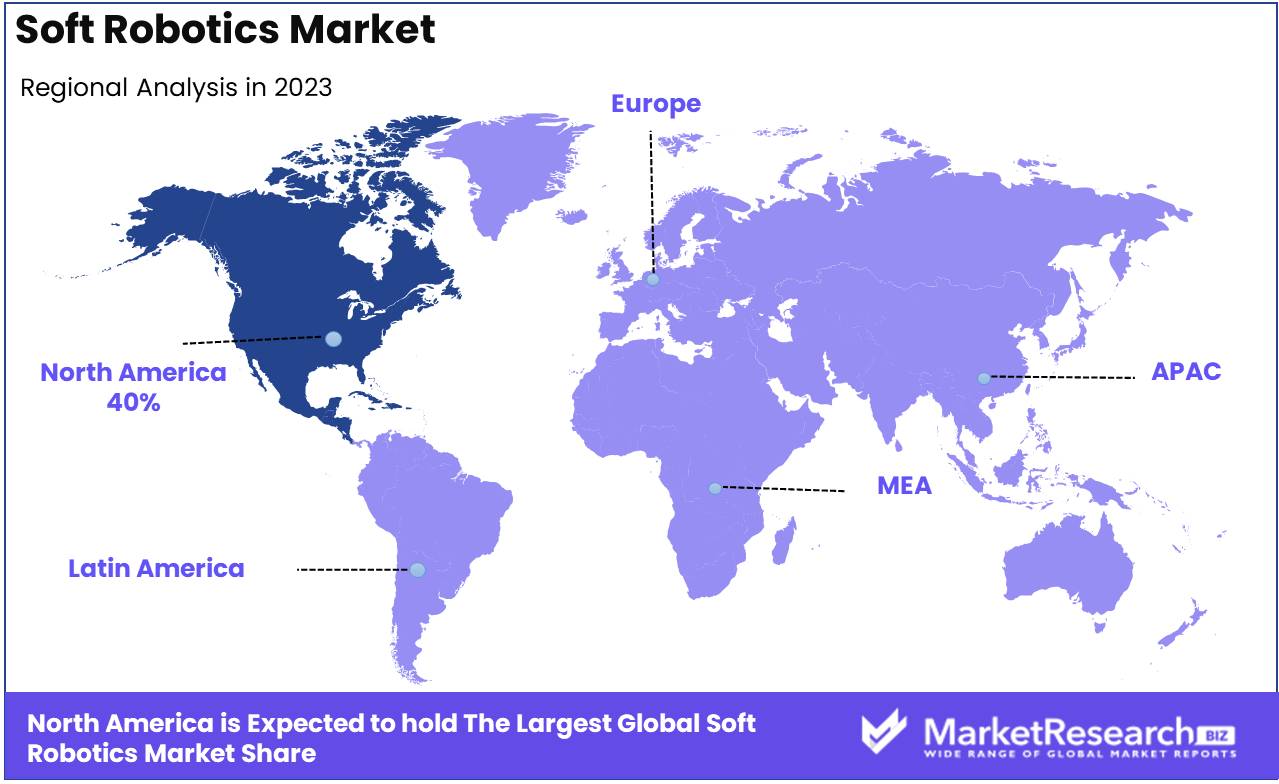
- Regional Dominance: North America dominates the soft robotics market with a 40% largest share.
- Growth Opportunity: The global soft robotics market is set to experience significant growth, driven by advancements in food processing automation and e-commerce logistics integration, creating substantial opportunities for industry expansion.
Driving factors
Increasing Demand for Automation
The global push for automation, driven by industries striving to enhance efficiency, accuracy, and productivity, is one of the most significant factors accelerating the growth of the soft robotics market. Sectors such as manufacturing, healthcare, and logistics are increasingly adopting automated solutions to reduce operational costs and mitigate human errors. Soft robotics, known for their flexibility, adaptability, and gentle handling of complex tasks, are particularly appealing in environments that require a delicate touch, such as in prosthetics or the food industry. The increased demand for robots that can safely interact with humans and handle fragile objects without damage is expected to boost the market, with the automation sector growing by 8-10% annually in some regions, according to industry reports.
Advancements in Technology
Technological advancements in material science, artificial intelligence (AI), and sensor technologies have significantly expanded the capabilities and applications of soft robotics. The integration of AI enables soft robots to learn from their environments, allowing them to perform increasingly complex tasks autonomously. In addition, innovations in soft materials, such as silicone, polymers, and bio-materials, have enhanced the durability, elasticity, and versatility of soft robots, making them suitable for a broader range of applications from surgery to agriculture. These advancements are directly linked to the growing adoption of soft robotics in both industrial and non-industrial applications. For example, the use of AI in soft robotics is expected to contribute to a CAGR of over 35% in sectors like healthcare and logistics.
Advancements in Research and Development
Ongoing investments in research and development (R&D) are a critical driver of the soft robotics market, facilitating continuous innovation and the expansion of potential use cases. Universities, research institutions, and private companies are actively engaged in R&D efforts to improve the functionality, safety, and cost-effectiveness of soft robots. Significant progress has been made in enhancing the robots ability to mimic human dexterity and adaptability, further promoting their use in industries like medical care, where soft robots can assist in complex surgeries or rehabilitation therapies.
Additionally, R&D is helping to reduce the overall costs of production, making soft robots more accessible to smaller companies and emerging markets. R&D spending in this field has been rising steadily, with estimates suggesting a year-on-year increase of 10-12% in some regions, contributing significantly to market expansion.
Restraining Factors
Regulatory Hurdles: Slowing Market Expansion Through Complex Approval Processes
Regulatory challenges are a significant restraining factor in the growth of the soft robotics market. Soft robotics technology often involves novel materials, intricate designs, and unique operational mechanisms that may not fit easily into existing regulatory frameworks. This results in prolonged approval times and increased costs for companies attempting to bring their products to market.
For instance, sectors like healthcare, where soft robotics has significant potential (e.g., in surgical robots or assistive devices), face stringent regulatory requirements for safety and efficacy. The approval process can be time-consuming and may require extensive clinical trials, which delays market entry and restricts innovation. Additionally, differences in regulations across regions such as North America, Europe, and Asia can add complexity for companies looking to expand globally. Harmonizing these regulations is often slow, which further hampers international growth opportunities.
The need for compliance with varying regulations in industrial applications—such as manufacturing or automation also creates additional barriers. Certification processes regarding the safety, performance, and environmental impacts of soft robots can delay the introduction of new products, increase development costs, and deter smaller companies from entering the market. This can lead to a slower pace of growth, as firms spend more time and resources navigating the regulatory landscape instead of focusing on product innovation and market penetration.
Limited Durability: Affecting Performance and Increasing Costs
Durability issues in soft robotics are another critical factor limiting market growth. Soft robots are often constructed from flexible, compliant materials that are prone to wear and tear, reducing their lifespan and reliability compared to traditional, rigid robots. This limited durability makes the technology less attractive for industries requiring high-performance, long-lasting robotic solutions, such as manufacturing, healthcare, and defense.
For example, in industrial applications, robots are expected to operate continuously in harsh environments, where exposure to chemicals, extreme temperatures, or mechanical stress can quickly degrade the soft materials used in soft robots. As a result, companies may be hesitant to adopt soft robotics technology due to concerns over frequent maintenance, higher replacement costs, and potential operational downtime. These concerns directly affect the cost-effectiveness of soft robotics solutions, which is a crucial consideration for many businesses.
In addition, healthcare applications, where soft robots are envisioned for delicate tasks such as assisting in surgeries or patient rehabilitation, may be affected by material fatigue or failure. If a robot’s components degrade quickly, it could pose significant safety risks, thus slowing down adoption in sensitive environments like hospitals or rehabilitation centers. The additional costs of ensuring durability, through advanced materials or more frequent part replacement, can drive up prices for end-users and further restrict the market’s growth potential.
By Type Analysis
In 2023, Soft Grippers dominated the diverse Soft Robotics market applications.
In 2023, Soft Grippers held a dominant market position in the By Type segment of the Soft Robotics Market, driven by their versatility across various industries such as food and beverage, healthcare, and logistics. Soft grippers, characterized by their ability to handle delicate objects without causing damage, are increasingly preferred in automation tasks that require high precision. Their non-intrusive, flexible design allows for the safe manipulation of fragile or irregularly shaped items, which has significantly boosted their adoption.
Cobots, or collaborative robots, are growing rapidly within this segment, owing to their ability to work safely alongside humans in industrial settings. These robots enhance operational efficiency and reduce the risk of workplace accidents.
Inflated Robots are gaining attention for their lightweight, cost-effective nature, particularly in applications where traditional robotics would be too rigid or cumbersome.
Exoskeletons, although still niche, are seeing increasing usage in healthcare for rehabilitation and assistive purposes, as well as in industrial environments to reduce worker fatigue and improve productivity. Together, these technologies are advancing the soft robotics market, each fulfilling unique operational needs.
By Component Analysis
In 2023, Hardware dominated the soft robotics market by component.
In 2023, Hardware held a dominant market position in the By Component segment of the soft robotics market. The hardware segment, which includes actuators, sensors, controllers, and grippers, was the key driver of market growth, accounting for a significant share due to advancements in material sciences and engineering. Increasing demand for sophisticated, flexible robotic systems in industries such as healthcare, manufacturing, and agriculture contributed to the segment's dominance. Innovations in soft robotic components that enhance precision, adaptability, and interaction with dynamic environments bolstered their application across various sectors.
While hardware maintained a strong foothold, the software segment demonstrated steady growth, driven by the integration of artificial intelligence (AI), machine learning (ML), and advanced algorithms to optimize soft robotics' performance and control. The software component, though smaller in market share, is critical in enhancing the intelligence and responsiveness of soft robotic systems, particularly in applications requiring complex decision-making and adaptability. Overall, the combination of cutting-edge hardware and software development positions the soft robotics market for sustained growth as industries continue to seek flexible automation solutions.
By End-User Analysis
In 2023, Healthcare dominated the Soft Robotics Market by end-user.
In 2023, Healthcare held a dominant market position in the By End-User segment of the Soft Robotics Market, driven by increasing applications in surgical robotics, rehabilitation, and patient assistance. The healthcare sector's significant demand for soft robotics is propelled by the need for precision in minimally invasive surgeries and patient-centric technologies. These advancements have not only improved patient outcomes but have also reduced operational costs, solidifying healthcare's leadership in the market.
The Advanced Manufacturing sector is another key end-user, leveraging soft robotics for automation, flexible manufacturing, and improved safety in human-robot collaboration. This sector benefits from soft robots' ability to adapt to diverse tasks and environments, enhancing productivity while minimizing workplace injuries.
In Food & Beverages, soft robotics is increasingly applied in packaging, handling delicate products, and maintaining hygiene standards. This sector's adoption of automation to meet demand for efficiency and safety has driven its growing share in the soft robotics market.
Logistics has also emerged as a major growth area, utilizing soft robotics for warehousing, inventory management, and transportation. The rise of e-commerce and the need for fast, accurate deliveries are key factors driving adoption in this sector.
Other end-users, including research and education institutions, continue to explore novel applications of soft robotics, contributing to the market's ongoing innovation and diversification across various industries.
Key Market Segments
By Type
- Soft Grippers
- Cobots
- Inflated Robots
- Exoskeleton
By Component
- Hardware
- Software
By End-User
- Healthcare
- Advanced Manufacturing
- Food & Beverages
- Logistics
- Others
Growth Opportunity
Increased Adoption in Food Processing Automation Driving Market Expansion
The global soft robotics market is poised for significant growth, with the food processing sector emerging as a key driver. The demand for automation in food handling, packaging, and processing has increased due to the rising need for efficiency and hygiene. Soft robotic solutions, which are capable of handling delicate and irregular-shaped food items without damaging them, are gaining traction. The adoption of these technologies can be attributed to the growing consumer preference for pre-packaged foods and ready-to-eat meals, alongside stringent regulations regarding food safety and hygiene standards. It is projected that soft robotics applications in food processing will capture a significant share of the market, as businesses look to streamline operations, reduce labor costs, and ensure product quality.
E-commerce Logistics Boom Creating New Opportunities for Soft Robotics Integration
The e-commerce sector, which saw an exponential rise during the pandemic, continues to offer lucrative opportunities for the soft robotics market. Logistics operations, including sorting, packaging, and last-mile delivery, are increasingly utilizing soft robots to optimize efficiency and address labor shortages. Soft robotic solutions, particularly those with adaptive gripping technologies, are ideal for handling diverse product ranges, which is critical in the fast-paced e-commerce environment. As online retailers expand their operations to meet growing demand, the integration of soft robotics in warehouse automation is expected to witness accelerated adoption. This trend is further fueled by advancements in AI and machine learning, enhancing the functionality and efficiency of these robotic systems.
Latest Trends
Diverse Applications Driving Growth
The soft robotics market is poised to experience significant growth, driven largely by its expanding range of applications. Industries such as healthcare, agriculture, and manufacturing are increasingly adopting soft robotic systems for tasks requiring delicate handling and flexibility. In healthcare, soft robotics is gaining traction in rehabilitation and minimally invasive surgeries, providing enhanced precision while reducing patient risk. The agricultural sector also sees potential in soft robots for crop harvesting, as these machines can handle delicate fruits and vegetables without damage. The versatility of soft robotics, along with its ability to adapt to challenging environments and fragile tasks, is expected to drive further market penetration across various sectors.
High Manufacturing Costs Remain a Barrier
While diverse applications create new opportunities, high manufacturing costs remain a key challenge for the soft robotics industry. The production of advanced materials such as soft actuators and sensors, along with the specialized design processes, drives up costs, making the technology less accessible for smaller firms.
Additionally, the complex fabrication techniques required for soft robotics, including 3D printing and molding of soft materials, contribute to significant expenses. These high costs are likely to slow market adoption, particularly in price-sensitive industries. However, advancements in material science and mass production techniques may gradually mitigate these challenges, making soft robotics more cost-effective over time.
Regional Analysis
North America dominates the soft robotics market with a 40% largest share.
The global soft robotics market exhibits significant regional variance, driven by technological advancements, industry adoption rates, and government support for innovation. North America dominates the market, accounting for over 40% of global revenue, largely due to high R&D investment and the presence of key players like Soft Robotics Inc. and Boston Dynamics. The U.S. and Canada lead the region, bolstered by the healthcare and logistics sectors, which actively integrate soft robotics for automation and efficiency improvements.
Europe is another crucial player, with around 25% market share, driven by demand in the automotive and manufacturing sectors. Germany, France, and the UK spearhead this growth, as these countries increasingly adopt advanced robotics to maintain competitiveness in global markets.
Asia Pacific is poised for the fastest growth, with a projected CAGR of 35%, supported by Japan, China, and South Korea, where manufacturing and consumer electronics sectors are rapidly embracing automation solutions. China's aggressive push for industrial automation, supported by government policies like "Made in China 2025," significantly boosts regional market expansion.
The Middle East & Africa and Latin America represent smaller market segments but are witnessing gradual growth, driven by increasing adoption in sectors such as oil and gas, agriculture, and healthcare. In these regions, soft robotics is emerging as a solution to industry-specific challenges like labor shortages and hazardous working conditions.
Key Regions and Countries
North America
- The US
- Canada
- Rest of North America
Europe
- Germany
- France
- The UK
- Spain
- Netherlands
- Russia
- Italy
- Rest of Europe
Asia-Pacific
- China
- Japan
- Singapore
- Thailand
- South Korea
- Vietnam
- India
- New Zealand
- Rest of Asia Pacific
Latin America
- Mexico
- Brazil
- Rest of Latin America
Middle East & Africa
- Saudi Arabia
- South Africa
- UAE
- Rest of the Middle East & Africa
Key Players Analysis
The global soft robotics market is expected to witness significant growth in 2024, driven by advancements in artificial intelligence, materials science, and increasing applications across various industries such as healthcare, manufacturing, and logistics. The key players contributing to this growth are employing innovative technologies and expanding their product portfolios to gain a competitive edge.
Bioservo Technologies AB is recognized for its strength-enhancing exoskeleton gloves, catering to healthcare and industrial sectors, emphasizing ergonomics and human augmentation. Similarly, Cyberdyne Inc. has developed assistive robotic devices for healthcare, particularly in rehabilitation, with a focus on improving patient mobility through its HAL exoskeleton. Ekso Bionics Holdings, Inc. is a leader in robotic exoskeletons, contributing significantly to the medical rehabilitation sector, especially in neuro-recovery applications.
F&P Robotics AG and Festo AG are at the forefront of service robotics, developing highly flexible, safe, and intelligent soft robotic solutions tailored for personal care, hospitality, and industrial automation. Rewalk Robotics Ltd. focuses on robotic exoskeletons for paraplegics, improving mobility and independence, while Righthand Robotics Inc. is a pioneer in autonomous grasping systems, addressing the increasing demand in logistics and e-commerce fulfillment.
Roam Robotics and Soft Robotics Inc. continue to innovate in wearable robotics and adaptive grippers, respectively, while Yaskawa Electric Corporation leverages its stronghold in industrial robotics to expand its presence in soft robotics through advanced automation solutions. Collectively, these companies are shaping the future of the soft robotics market by addressing critical needs across diverse sectors.
Market Key Players
- Bioservo Technologies AB
- Cyberdyne Inc.
- Ekso Bionics Holdings, Inc.
- F&P Robotics AG
- Festo AG
- Rewalk Robotics Ltd.
- Righthand Robotics Inc.
- Roam Robotics
- Soft Robotics Inc.
- Yaskawa Electric Corporation
Recent Development
- In May 2022, Cyberdyne Inc., known for its robotics in healthcare and cleaning applications, continued to see growth in its partnership with Kanagawa Prefecture. Their robot installations, including the Cleaning Robot CL02, have seen financial backing as part of broader government efforts to integrate robotic solutions for public and industrial services.
- In April 2024, Khalifa University of Science and Technology in the UAE partnered with Silal to establish a joint Centre of Excellence in Agri-Robotics and Automation. This collaboration focuses on leveraging advancements in soft robotics to enhance agricultural productivity and sustainability, potentially transforming farming practices in the UAE and beyond.
- In February 2024, RightHand Robotics, known for its autonomous AI robotic picking solutions, entered into a multi-year agreement with Staples Inc. This partnership allows Staples to deploy RightHand Robotics’ "RightPick" system to automate order fulfillment, enhancing efficiency for next-day delivery across the United States. This move addresses the growing need for automation in e-commerce and logistics operations.
Report Scope
Report Features Description Market Value (2023) USD 0.6 Billion Forecast Revenue (2033) USD 8.5 Billion CAGR (2024-2032) 31.2% Base Year for Estimation 2023 Historic Period 2016-2023 Forecast Period 2024-2033 Report Coverage Revenue Forecast, Market Dynamics, COVID-19 Impact, Competitive Landscape, Recent Developments Segments Covered By Type (Soft Grippers, Cobots, Inflated Robots, Exoskeleton), By Component (Hardware, Software), By End-User (Healthcare, Advanced Manufacturing, Food & Beverages, Logistics, Others) Regional Analysis North America - The US, Canada, Rest of North America, Europe - Germany, France, The UK, Spain, Italy, Russia, Netherlands, Rest of Europe, Asia-Pacific - China, Japan, South Korea, India, New Zealand, Singapore, Thailand, Vietnam, Rest of Asia Pacific, Latin America - Brazil, Mexico, Rest of Latin America, Middle East & Africa - South Africa, Saudi Arabia, UAE, Rest of Middle East & Africa Competitive Landscape Bioservo Technologies AB, Cyberdyne Inc., Ekso Bionics Holdings, Inc., F&P Robotics AG, Festo AG, Rewalk Robotics Ltd., Righthand Robotics Inc., Roam Robotics, Soft Robotics Inc., Yaskawa Electric Corporation Customization Scope Customization for segments at the regional/country level will be provided. Moreover, additional customization can be done based on the requirements. Purchase Options We have three licenses to opt for Single User License, Multi-User License (Up to 5 Users), Corporate Use License (Unlimited User and Printable PDF) -
- 1. Executive Summary
- 1.1. Definition
- 1.2. Taxonomy
- 1.3. Research Scope
- 1.4. Key Analysis
- 1.5. Key Findings by Major Segments
- 1.6. Top strategies by Major Players
- 2. Global Soft Robotics Market Overview
- 2.1. Soft Robotics Market Dynamics
- 2.1.1. Drivers
- 2.1.2. Opportunities
- 2.1.3. Restraints
- 2.1.4. Challenges
- 2.2. Macro-economic Factors
- 2.3. Regulatory Framework
- 2.4. Market Investment Feasibility Index
- 2.5. PEST Analysis
- 2.6. PORTER’S Five Force Analysis
- 2.7. Drivers & Restraints Impact Analysis
- 2.8. Industry Chain Analysis
- 2.9. Cost Structure Analysis
- 2.10. Marketing Strategy
- 2.11. Russia-Ukraine War Impact Analysis
- 2.12. Opportunity Map Analysis
- 2.13. Market Competition Scenario Analysis
- 2.14. Product Life Cycle Analysis
- 2.15. Opportunity Orbits
- 2.16. Manufacturer Intensity Map
- 2.17. Major Companies sales by Value & Volume
- 2.1. Soft Robotics Market Dynamics
- 3. Global Soft Robotics Market Analysis, Opportunity and Forecast, 2016-2032
- 3.1. Global Soft Robotics Market Analysis, 2016-2021
- 3.2. Global Soft Robotics Market Opportunity and Forecast, 2023-2032
- 3.3. Global Soft Robotics Market Analysis, Opportunity and Forecast, By Type, 2016-2032
- 3.3.1. Global Soft Robotics Market Analysis by Type: Introduction
- 3.3.2. Market Size Absolute $ Opportunity Analysis and Forecast, By Type, 2016-2032
- 3.3.3. Soft Grippers
- 3.3.4. Cobots
- 3.3.5. Inflated Robots
- 3.3.6. Exoskeleton
- 3.4. Global Soft Robotics Market Analysis, Opportunity and Forecast, By Component, 2016-2032
- 3.4.1. Global Soft Robotics Market Analysis by Component: Introduction
- 3.4.2. Market Size Absolute $ Opportunity Analysis and Forecast, By Component, 2016-2032
- 3.4.3. Hardware
- 3.4.4. Software
- 3.5. Global Soft Robotics Market Analysis, Opportunity and Forecast, By End-User, 2016-2032
- 3.5.1. Global Soft Robotics Market Analysis by End-User: Introduction
- 3.5.2. Market Size Absolute $ Opportunity Analysis and Forecast, By End-User, 2016-2032
- 3.5.3. Healthcare
- 3.5.4. Advanced Manufacturing
- 3.5.5. Food & Beverages
- 3.5.6. Logistics
- 3.5.7. Others
- 4. North America Soft Robotics Market Analysis, Opportunity and Forecast, 2016-2032
- 4.1. North America Soft Robotics Market Analysis, 2016-2021
- 4.2. North America Soft Robotics Market Opportunity and Forecast, 2023-2032
- 4.3. North America Soft Robotics Market Analysis, Opportunity and Forecast, By Type, 2016-2032
- 4.3.1. North America Soft Robotics Market Analysis by Type: Introduction
- 4.3.2. Market Size Absolute $ Opportunity Analysis and Forecast, By Type, 2016-2032
- 4.3.3. Soft Grippers
- 4.3.4. Cobots
- 4.3.5. Inflated Robots
- 4.3.6. Exoskeleton
- 4.4. North America Soft Robotics Market Analysis, Opportunity and Forecast, By Component, 2016-2032
- 4.4.1. North America Soft Robotics Market Analysis by Component: Introduction
- 4.4.2. Market Size Absolute $ Opportunity Analysis and Forecast, By Component, 2016-2032
- 4.4.3. Hardware
- 4.4.4. Software
- 4.5. North America Soft Robotics Market Analysis, Opportunity and Forecast, By End-User, 2016-2032
- 4.5.1. North America Soft Robotics Market Analysis by End-User: Introduction
- 4.5.2. Market Size Absolute $ Opportunity Analysis and Forecast, By End-User, 2016-2032
- 4.5.3. Healthcare
- 4.5.4. Advanced Manufacturing
- 4.5.5. Food & Beverages
- 4.5.6. Logistics
- 4.5.7. Others
- 4.6. North America Soft Robotics Market Analysis, Opportunity and Forecast, By Country , 2016-2032
- 4.6.1. North America Soft Robotics Market Analysis by Country : Introduction
- 4.6.2. Market Size Absolute $ Opportunity Analysis and Forecast, Country , 2016-2032
- 4.6.2.1. The US
- 4.6.2.2. Canada
- 4.6.2.3. Mexico
- 5. Western Europe Soft Robotics Market Analysis, Opportunity and Forecast, 2016-2032
- 5.1. Western Europe Soft Robotics Market Analysis, 2016-2021
- 5.2. Western Europe Soft Robotics Market Opportunity and Forecast, 2023-2032
- 5.3. Western Europe Soft Robotics Market Analysis, Opportunity and Forecast, By Type, 2016-2032
- 5.3.1. Western Europe Soft Robotics Market Analysis by Type: Introduction
- 5.3.2. Market Size Absolute $ Opportunity Analysis and Forecast, By Type, 2016-2032
- 5.3.3. Soft Grippers
- 5.3.4. Cobots
- 5.3.5. Inflated Robots
- 5.3.6. Exoskeleton
- 5.4. Western Europe Soft Robotics Market Analysis, Opportunity and Forecast, By Component, 2016-2032
- 5.4.1. Western Europe Soft Robotics Market Analysis by Component: Introduction
- 5.4.2. Market Size Absolute $ Opportunity Analysis and Forecast, By Component, 2016-2032
- 5.4.3. Hardware
- 5.4.4. Software
- 5.5. Western Europe Soft Robotics Market Analysis, Opportunity and Forecast, By End-User, 2016-2032
- 5.5.1. Western Europe Soft Robotics Market Analysis by End-User: Introduction
- 5.5.2. Market Size Absolute $ Opportunity Analysis and Forecast, By End-User, 2016-2032
- 5.5.3. Healthcare
- 5.5.4. Advanced Manufacturing
- 5.5.5. Food & Beverages
- 5.5.6. Logistics
- 5.5.7. Others
- 5.6. Western Europe Soft Robotics Market Analysis, Opportunity and Forecast, By Country , 2016-2032
- 5.6.1. Western Europe Soft Robotics Market Analysis by Country : Introduction
- 5.6.2. Market Size Absolute $ Opportunity Analysis and Forecast, Country , 2016-2032
- 5.6.2.1. Germany
- 5.6.2.2. France
- 5.6.2.3. The UK
- 5.6.2.4. Spain
- 5.6.2.5. Italy
- 5.6.2.6. Portugal
- 5.6.2.7. Ireland
- 5.6.2.8. Austria
- 5.6.2.9. Switzerland
- 5.6.2.10. Benelux
- 5.6.2.11. Nordic
- 5.6.2.12. Rest of Western Europe
- 6. Eastern Europe Soft Robotics Market Analysis, Opportunity and Forecast, 2016-2032
- 6.1. Eastern Europe Soft Robotics Market Analysis, 2016-2021
- 6.2. Eastern Europe Soft Robotics Market Opportunity and Forecast, 2023-2032
- 6.3. Eastern Europe Soft Robotics Market Analysis, Opportunity and Forecast, By Type, 2016-2032
- 6.3.1. Eastern Europe Soft Robotics Market Analysis by Type: Introduction
- 6.3.2. Market Size Absolute $ Opportunity Analysis and Forecast, By Type, 2016-2032
- 6.3.3. Soft Grippers
- 6.3.4. Cobots
- 6.3.5. Inflated Robots
- 6.3.6. Exoskeleton
- 6.4. Eastern Europe Soft Robotics Market Analysis, Opportunity and Forecast, By Component, 2016-2032
- 6.4.1. Eastern Europe Soft Robotics Market Analysis by Component: Introduction
- 6.4.2. Market Size Absolute $ Opportunity Analysis and Forecast, By Component, 2016-2032
- 6.4.3. Hardware
- 6.4.4. Software
- 6.5. Eastern Europe Soft Robotics Market Analysis, Opportunity and Forecast, By End-User, 2016-2032
- 6.5.1. Eastern Europe Soft Robotics Market Analysis by End-User: Introduction
- 6.5.2. Market Size Absolute $ Opportunity Analysis and Forecast, By End-User, 2016-2032
- 6.5.3. Healthcare
- 6.5.4. Advanced Manufacturing
- 6.5.5. Food & Beverages
- 6.5.6. Logistics
- 6.5.7. Others
- 6.6. Eastern Europe Soft Robotics Market Analysis, Opportunity and Forecast, By Country , 2016-2032
- 6.6.1. Eastern Europe Soft Robotics Market Analysis by Country : Introduction
- 6.6.2. Market Size Absolute $ Opportunity Analysis and Forecast, Country , 2016-2032
- 6.6.2.1. Russia
- 6.6.2.2. Poland
- 6.6.2.3. The Czech Republic
- 6.6.2.4. Greece
- 6.6.2.5. Rest of Eastern Europe
- 7. APAC Soft Robotics Market Analysis, Opportunity and Forecast, 2016-2032
- 7.1. APAC Soft Robotics Market Analysis, 2016-2021
- 7.2. APAC Soft Robotics Market Opportunity and Forecast, 2023-2032
- 7.3. APAC Soft Robotics Market Analysis, Opportunity and Forecast, By Type, 2016-2032
- 7.3.1. APAC Soft Robotics Market Analysis by Type: Introduction
- 7.3.2. Market Size Absolute $ Opportunity Analysis and Forecast, By Type, 2016-2032
- 7.3.3. Soft Grippers
- 7.3.4. Cobots
- 7.3.5. Inflated Robots
- 7.3.6. Exoskeleton
- 7.4. APAC Soft Robotics Market Analysis, Opportunity and Forecast, By Component, 2016-2032
- 7.4.1. APAC Soft Robotics Market Analysis by Component: Introduction
- 7.4.2. Market Size Absolute $ Opportunity Analysis and Forecast, By Component, 2016-2032
- 7.4.3. Hardware
- 7.4.4. Software
- 7.5. APAC Soft Robotics Market Analysis, Opportunity and Forecast, By End-User, 2016-2032
- 7.5.1. APAC Soft Robotics Market Analysis by End-User: Introduction
- 7.5.2. Market Size Absolute $ Opportunity Analysis and Forecast, By End-User, 2016-2032
- 7.5.3. Healthcare
- 7.5.4. Advanced Manufacturing
- 7.5.5. Food & Beverages
- 7.5.6. Logistics
- 7.5.7. Others
- 7.6. APAC Soft Robotics Market Analysis, Opportunity and Forecast, By Country , 2016-2032
- 7.6.1. APAC Soft Robotics Market Analysis by Country : Introduction
- 7.6.2. Market Size Absolute $ Opportunity Analysis and Forecast, Country , 2016-2032
- 7.6.2.1. China
- 7.6.2.2. Japan
- 7.6.2.3. South Korea
- 7.6.2.4. India
- 7.6.2.5. Australia & New Zeland
- 7.6.2.6. Indonesia
- 7.6.2.7. Malaysia
- 7.6.2.8. Philippines
- 7.6.2.9. Singapore
- 7.6.2.10. Thailand
- 7.6.2.11. Vietnam
- 7.6.2.12. Rest of APAC
- 8. Latin America Soft Robotics Market Analysis, Opportunity and Forecast, 2016-2032
- 8.1. Latin America Soft Robotics Market Analysis, 2016-2021
- 8.2. Latin America Soft Robotics Market Opportunity and Forecast, 2023-2032
- 8.3. Latin America Soft Robotics Market Analysis, Opportunity and Forecast, By Type, 2016-2032
- 8.3.1. Latin America Soft Robotics Market Analysis by Type: Introduction
- 8.3.2. Market Size Absolute $ Opportunity Analysis and Forecast, By Type, 2016-2032
- 8.3.3. Soft Grippers
- 8.3.4. Cobots
- 8.3.5. Inflated Robots
- 8.3.6. Exoskeleton
- 8.4. Latin America Soft Robotics Market Analysis, Opportunity and Forecast, By Component, 2016-2032
- 8.4.1. Latin America Soft Robotics Market Analysis by Component: Introduction
- 8.4.2. Market Size Absolute $ Opportunity Analysis and Forecast, By Component, 2016-2032
- 8.4.3. Hardware
- 8.4.4. Software
- 8.5. Latin America Soft Robotics Market Analysis, Opportunity and Forecast, By End-User, 2016-2032
- 8.5.1. Latin America Soft Robotics Market Analysis by End-User: Introduction
- 8.5.2. Market Size Absolute $ Opportunity Analysis and Forecast, By End-User, 2016-2032
- 8.5.3. Healthcare
- 8.5.4. Advanced Manufacturing
- 8.5.5. Food & Beverages
- 8.5.6. Logistics
- 8.5.7. Others
- 8.6. Latin America Soft Robotics Market Analysis, Opportunity and Forecast, By Country , 2016-2032
- 8.6.1. Latin America Soft Robotics Market Analysis by Country : Introduction
- 8.6.2. Market Size Absolute $ Opportunity Analysis and Forecast, Country , 2016-2032
- 8.6.2.1. Brazil
- 8.6.2.2. Colombia
- 8.6.2.3. Chile
- 8.6.2.4. Argentina
- 8.6.2.5. Costa Rica
- 8.6.2.6. Rest of Latin America
- 9. Middle East & Africa Soft Robotics Market Analysis, Opportunity and Forecast, 2016-2032
- 9.1. Middle East & Africa Soft Robotics Market Analysis, 2016-2021
- 9.2. Middle East & Africa Soft Robotics Market Opportunity and Forecast, 2023-2032
- 9.3. Middle East & Africa Soft Robotics Market Analysis, Opportunity and Forecast, By Type, 2016-2032
- 9.3.1. Middle East & Africa Soft Robotics Market Analysis by Type: Introduction
- 9.3.2. Market Size Absolute $ Opportunity Analysis and Forecast, By Type, 2016-2032
- 9.3.3. Soft Grippers
- 9.3.4. Cobots
- 9.3.5. Inflated Robots
- 9.3.6. Exoskeleton
- 9.4. Middle East & Africa Soft Robotics Market Analysis, Opportunity and Forecast, By Component, 2016-2032
- 9.4.1. Middle East & Africa Soft Robotics Market Analysis by Component: Introduction
- 9.4.2. Market Size Absolute $ Opportunity Analysis and Forecast, By Component, 2016-2032
- 9.4.3. Hardware
- 9.4.4. Software
- 9.5. Middle East & Africa Soft Robotics Market Analysis, Opportunity and Forecast, By End-User, 2016-2032
- 9.5.1. Middle East & Africa Soft Robotics Market Analysis by End-User: Introduction
- 9.5.2. Market Size Absolute $ Opportunity Analysis and Forecast, By End-User, 2016-2032
- 9.5.3. Healthcare
- 9.5.4. Advanced Manufacturing
- 9.5.5. Food & Beverages
- 9.5.6. Logistics
- 9.5.7. Others
- 9.6. Middle East & Africa Soft Robotics Market Analysis, Opportunity and Forecast, By Country , 2016-2032
- 9.6.1. Middle East & Africa Soft Robotics Market Analysis by Country : Introduction
- 9.6.2. Market Size Absolute $ Opportunity Analysis and Forecast, Country , 2016-2032
- 9.6.2.1. Algeria
- 9.6.2.2. Egypt
- 9.6.2.3. Israel
- 9.6.2.4. Kuwait
- 9.6.2.5. Nigeria
- 9.6.2.6. Saudi Arabia
- 9.6.2.7. South Africa
- 9.6.2.8. Turkey
- 9.6.2.9. The UAE
- 9.6.2.10. Rest of MEA
- 10. Global Soft Robotics Market Analysis, Opportunity and Forecast, By Region , 2016-2032
- 10.1. Global Soft Robotics Market Analysis by Region : Introduction
- 10.2. Market Size Absolute $ Opportunity Analysis and Forecast, By Region , 2016-2032
- 10.2.1. North America
- 10.2.2. Western Europe
- 10.2.3. Eastern Europe
- 10.2.4. APAC
- 10.2.5. Latin America
- 10.2.6. Middle East & Africa
- 11. Global Soft Robotics Market Competitive Landscape, Market Share Analysis, and Company Profiles
- 11.1. Market Share Analysis
- 11.2. Company Profiles
- 11.3. Bioservo Technologies AB
- 11.3.1. Company Overview
- 11.3.2. Financial Highlights
- 11.3.3. Product Portfolio
- 11.3.4. SWOT Analysis
- 11.3.5. Key Strategies and Developments
- 11.4. Cyberdyne Inc.
- 11.4.1. Company Overview
- 11.4.2. Financial Highlights
- 11.4.3. Product Portfolio
- 11.4.4. SWOT Analysis
- 11.4.5. Key Strategies and Developments
- 11.5. Ekso Bionics Holdings, Inc.
- 11.5.1. Company Overview
- 11.5.2. Financial Highlights
- 11.5.3. Product Portfolio
- 11.5.4. SWOT Analysis
- 11.5.5. Key Strategies and Developments
- 11.6. F&P Robotics AG
- 11.6.1. Company Overview
- 11.6.2. Financial Highlights
- 11.6.3. Product Portfolio
- 11.6.4. SWOT Analysis
- 11.6.5. Key Strategies and Developments
- 11.7. Festo AG
- 11.7.1. Company Overview
- 11.7.2. Financial Highlights
- 11.7.3. Product Portfolio
- 11.7.4. SWOT Analysis
- 11.7.5. Key Strategies and Developments
- 11.8. Rewalk Robotics Ltd.
- 11.8.1. Company Overview
- 11.8.2. Financial Highlights
- 11.8.3. Product Portfolio
- 11.8.4. SWOT Analysis
- 11.8.5. Key Strategies and Developments
- 11.9. Righthand Robotics Inc.
- 11.9.1. Company Overview
- 11.9.2. Financial Highlights
- 11.9.3. Product Portfolio
- 11.9.4. SWOT Analysis
- 11.9.5. Key Strategies and Developments
- 11.10. Roam Robotics
- 11.10.1. Company Overview
- 11.10.2. Financial Highlights
- 11.10.3. Product Portfolio
- 11.10.4. SWOT Analysis
- 11.10.5. Key Strategies and Developments
- 11.11. Soft Robotics Inc.
- 11.11.1. Company Overview
- 11.11.2. Financial Highlights
- 11.11.3. Product Portfolio
- 11.11.4. SWOT Analysis
- 11.11.5. Key Strategies and Developments
- 11.12. Yaskawa Electric Corporation
- 11.12.1. Company Overview
- 11.12.2. Financial Highlights
- 11.12.3. Product Portfolio
- 11.12.4. SWOT Analysis
- 11.12.5. Key Strategies and Developments
- 11.13.1. Company Overview
- 11.13.2. Financial Highlights
- 11.13.3. Product Portfolio
- 11.13.4. SWOT Analysis
- 11.13.5. Key Strategies and Developments
- 12. Assumptions and Acronyms
- 13. Research Methodology
- 14. Contact
"
- List of Figures
- "
- Figure 1: Global Soft Robotics Market Revenue (US$ Mn) Market Share by Type in 2022
- Figure 2: Global Soft Robotics Market Market Attractiveness Analysis by Type, 2016-2032
- Figure 3: Global Soft Robotics Market Revenue (US$ Mn) Market Share by Componentin 2022
- Figure 4: Global Soft Robotics Market Market Attractiveness Analysis by Component, 2016-2032
- Figure 5: Global Soft Robotics Market Revenue (US$ Mn) Market Share by End-Userin 2022
- Figure 6: Global Soft Robotics Market Market Attractiveness Analysis by End-User, 2016-2032
- Figure 7: Global Soft Robotics Market Revenue (US$ Mn) Market Share by Region in 2022
- Figure 8: Global Soft Robotics Market Market Attractiveness Analysis by Region, 2016-2032
- Figure 9: Global Soft Robotics Market Market Revenue (US$ Mn) (2016-2032)
- Figure 10: Global Soft Robotics Market Market Revenue (US$ Mn) Comparison by Region (2016-2032)
- Figure 11: Global Soft Robotics Market Market Revenue (US$ Mn) Comparison by Type (2016-2032)
- Figure 12: Global Soft Robotics Market Market Revenue (US$ Mn) Comparison by Component (2016-2032)
- Figure 13: Global Soft Robotics Market Market Revenue (US$ Mn) Comparison by End-User (2016-2032)
- Figure 14: Global Soft Robotics Market Market Y-o-Y Growth Rate Comparison by Region (2016-2032)
- Figure 15: Global Soft Robotics Market Market Y-o-Y Growth Rate Comparison by Type (2016-2032)
- Figure 16: Global Soft Robotics Market Market Y-o-Y Growth Rate Comparison by Component (2016-2032)
- Figure 17: Global Soft Robotics Market Market Y-o-Y Growth Rate Comparison by End-User (2016-2032)
- Figure 18: Global Soft Robotics Market Market Share Comparison by Region (2016-2032)
- Figure 19: Global Soft Robotics Market Market Share Comparison by Type (2016-2032)
- Figure 20: Global Soft Robotics Market Market Share Comparison by Component (2016-2032)
- Figure 21: Global Soft Robotics Market Market Share Comparison by End-User (2016-2032)
- Figure 22: North America Soft Robotics Market Revenue (US$ Mn) Market Share by Typein 2022
- Figure 23: North America Soft Robotics Market Market Attractiveness Analysis by Type, 2016-2032
- Figure 24: North America Soft Robotics Market Revenue (US$ Mn) Market Share by Componentin 2022
- Figure 25: North America Soft Robotics Market Market Attractiveness Analysis by Component, 2016-2032
- Figure 26: North America Soft Robotics Market Revenue (US$ Mn) Market Share by End-Userin 2022
- Figure 27: North America Soft Robotics Market Market Attractiveness Analysis by End-User, 2016-2032
- Figure 28: North America Soft Robotics Market Revenue (US$ Mn) Market Share by Country in 2022
- Figure 29: North America Soft Robotics Market Market Attractiveness Analysis by Country, 2016-2032
- Figure 30: North America Soft Robotics Market Market Revenue (US$ Mn) (2016-2032)
- Figure 31: North America Soft Robotics Market Market Revenue (US$ Mn) Comparison by Country (2016-2032)
- Figure 32: North America Soft Robotics Market Market Revenue (US$ Mn) Comparison by Type (2016-2032)
- Figure 33: North America Soft Robotics Market Market Revenue (US$ Mn) Comparison by Component (2016-2032)
- Figure 34: North America Soft Robotics Market Market Revenue (US$ Mn) Comparison by End-User (2016-2032)
- Figure 35: North America Soft Robotics Market Market Y-o-Y Growth Rate Comparison by Country (2016-2032)
- Figure 36: North America Soft Robotics Market Market Y-o-Y Growth Rate Comparison by Type (2016-2032)
- Figure 37: North America Soft Robotics Market Market Y-o-Y Growth Rate Comparison by Component (2016-2032)
- Figure 38: North America Soft Robotics Market Market Y-o-Y Growth Rate Comparison by End-User (2016-2032)
- Figure 39: North America Soft Robotics Market Market Share Comparison by Country (2016-2032)
- Figure 40: North America Soft Robotics Market Market Share Comparison by Type (2016-2032)
- Figure 41: North America Soft Robotics Market Market Share Comparison by Component (2016-2032)
- Figure 42: North America Soft Robotics Market Market Share Comparison by End-User (2016-2032)
- Figure 43: Western Europe Soft Robotics Market Revenue (US$ Mn) Market Share by Typein 2022
- Figure 44: Western Europe Soft Robotics Market Market Attractiveness Analysis by Type, 2016-2032
- Figure 45: Western Europe Soft Robotics Market Revenue (US$ Mn) Market Share by Componentin 2022
- Figure 46: Western Europe Soft Robotics Market Market Attractiveness Analysis by Component, 2016-2032
- Figure 47: Western Europe Soft Robotics Market Revenue (US$ Mn) Market Share by End-Userin 2022
- Figure 48: Western Europe Soft Robotics Market Market Attractiveness Analysis by End-User, 2016-2032
- Figure 49: Western Europe Soft Robotics Market Revenue (US$ Mn) Market Share by Country in 2022
- Figure 50: Western Europe Soft Robotics Market Market Attractiveness Analysis by Country, 2016-2032
- Figure 51: Western Europe Soft Robotics Market Market Revenue (US$ Mn) (2016-2032)
- Figure 52: Western Europe Soft Robotics Market Market Revenue (US$ Mn) Comparison by Country (2016-2032)
- Figure 53: Western Europe Soft Robotics Market Market Revenue (US$ Mn) Comparison by Type (2016-2032)
- Figure 54: Western Europe Soft Robotics Market Market Revenue (US$ Mn) Comparison by Component (2016-2032)
- Figure 55: Western Europe Soft Robotics Market Market Revenue (US$ Mn) Comparison by End-User (2016-2032)
- Figure 56: Western Europe Soft Robotics Market Market Y-o-Y Growth Rate Comparison by Country (2016-2032)
- Figure 57: Western Europe Soft Robotics Market Market Y-o-Y Growth Rate Comparison by Type (2016-2032)
- Figure 58: Western Europe Soft Robotics Market Market Y-o-Y Growth Rate Comparison by Component (2016-2032)
- Figure 59: Western Europe Soft Robotics Market Market Y-o-Y Growth Rate Comparison by End-User (2016-2032)
- Figure 60: Western Europe Soft Robotics Market Market Share Comparison by Country (2016-2032)
- Figure 61: Western Europe Soft Robotics Market Market Share Comparison by Type (2016-2032)
- Figure 62: Western Europe Soft Robotics Market Market Share Comparison by Component (2016-2032)
- Figure 63: Western Europe Soft Robotics Market Market Share Comparison by End-User (2016-2032)
- Figure 64: Eastern Europe Soft Robotics Market Revenue (US$ Mn) Market Share by Typein 2022
- Figure 65: Eastern Europe Soft Robotics Market Market Attractiveness Analysis by Type, 2016-2032
- Figure 66: Eastern Europe Soft Robotics Market Revenue (US$ Mn) Market Share by Componentin 2022
- Figure 67: Eastern Europe Soft Robotics Market Market Attractiveness Analysis by Component, 2016-2032
- Figure 68: Eastern Europe Soft Robotics Market Revenue (US$ Mn) Market Share by End-Userin 2022
- Figure 69: Eastern Europe Soft Robotics Market Market Attractiveness Analysis by End-User, 2016-2032
- Figure 70: Eastern Europe Soft Robotics Market Revenue (US$ Mn) Market Share by Country in 2022
- Figure 71: Eastern Europe Soft Robotics Market Market Attractiveness Analysis by Country, 2016-2032
- Figure 72: Eastern Europe Soft Robotics Market Market Revenue (US$ Mn) (2016-2032)
- Figure 73: Eastern Europe Soft Robotics Market Market Revenue (US$ Mn) Comparison by Country (2016-2032)
- Figure 74: Eastern Europe Soft Robotics Market Market Revenue (US$ Mn) Comparison by Type (2016-2032)
- Figure 75: Eastern Europe Soft Robotics Market Market Revenue (US$ Mn) Comparison by Component (2016-2032)
- Figure 76: Eastern Europe Soft Robotics Market Market Revenue (US$ Mn) Comparison by End-User (2016-2032)
- Figure 77: Eastern Europe Soft Robotics Market Market Y-o-Y Growth Rate Comparison by Country (2016-2032)
- Figure 78: Eastern Europe Soft Robotics Market Market Y-o-Y Growth Rate Comparison by Type (2016-2032)
- Figure 79: Eastern Europe Soft Robotics Market Market Y-o-Y Growth Rate Comparison by Component (2016-2032)
- Figure 80: Eastern Europe Soft Robotics Market Market Y-o-Y Growth Rate Comparison by End-User (2016-2032)
- Figure 81: Eastern Europe Soft Robotics Market Market Share Comparison by Country (2016-2032)
- Figure 82: Eastern Europe Soft Robotics Market Market Share Comparison by Type (2016-2032)
- Figure 83: Eastern Europe Soft Robotics Market Market Share Comparison by Component (2016-2032)
- Figure 84: Eastern Europe Soft Robotics Market Market Share Comparison by End-User (2016-2032)
- Figure 85: APAC Soft Robotics Market Revenue (US$ Mn) Market Share by Typein 2022
- Figure 86: APAC Soft Robotics Market Market Attractiveness Analysis by Type, 2016-2032
- Figure 87: APAC Soft Robotics Market Revenue (US$ Mn) Market Share by Componentin 2022
- Figure 88: APAC Soft Robotics Market Market Attractiveness Analysis by Component, 2016-2032
- Figure 89: APAC Soft Robotics Market Revenue (US$ Mn) Market Share by End-Userin 2022
- Figure 90: APAC Soft Robotics Market Market Attractiveness Analysis by End-User, 2016-2032
- Figure 91: APAC Soft Robotics Market Revenue (US$ Mn) Market Share by Country in 2022
- Figure 92: APAC Soft Robotics Market Market Attractiveness Analysis by Country, 2016-2032
- Figure 93: APAC Soft Robotics Market Market Revenue (US$ Mn) (2016-2032)
- Figure 94: APAC Soft Robotics Market Market Revenue (US$ Mn) Comparison by Country (2016-2032)
- Figure 95: APAC Soft Robotics Market Market Revenue (US$ Mn) Comparison by Type (2016-2032)
- Figure 96: APAC Soft Robotics Market Market Revenue (US$ Mn) Comparison by Component (2016-2032)
- Figure 97: APAC Soft Robotics Market Market Revenue (US$ Mn) Comparison by End-User (2016-2032)
- Figure 98: APAC Soft Robotics Market Market Y-o-Y Growth Rate Comparison by Country (2016-2032)
- Figure 99: APAC Soft Robotics Market Market Y-o-Y Growth Rate Comparison by Type (2016-2032)
- Figure 100: APAC Soft Robotics Market Market Y-o-Y Growth Rate Comparison by Component (2016-2032)
- Figure 101: APAC Soft Robotics Market Market Y-o-Y Growth Rate Comparison by End-User (2016-2032)
- Figure 102: APAC Soft Robotics Market Market Share Comparison by Country (2016-2032)
- Figure 103: APAC Soft Robotics Market Market Share Comparison by Type (2016-2032)
- Figure 104: APAC Soft Robotics Market Market Share Comparison by Component (2016-2032)
- Figure 105: APAC Soft Robotics Market Market Share Comparison by End-User (2016-2032)
- Figure 106: Latin America Soft Robotics Market Revenue (US$ Mn) Market Share by Typein 2022
- Figure 107: Latin America Soft Robotics Market Market Attractiveness Analysis by Type, 2016-2032
- Figure 108: Latin America Soft Robotics Market Revenue (US$ Mn) Market Share by Componentin 2022
- Figure 109: Latin America Soft Robotics Market Market Attractiveness Analysis by Component, 2016-2032
- Figure 110: Latin America Soft Robotics Market Revenue (US$ Mn) Market Share by End-Userin 2022
- Figure 111: Latin America Soft Robotics Market Market Attractiveness Analysis by End-User, 2016-2032
- Figure 112: Latin America Soft Robotics Market Revenue (US$ Mn) Market Share by Country in 2022
- Figure 113: Latin America Soft Robotics Market Market Attractiveness Analysis by Country, 2016-2032
- Figure 114: Latin America Soft Robotics Market Market Revenue (US$ Mn) (2016-2032)
- Figure 115: Latin America Soft Robotics Market Market Revenue (US$ Mn) Comparison by Country (2016-2032)
- Figure 116: Latin America Soft Robotics Market Market Revenue (US$ Mn) Comparison by Type (2016-2032)
- Figure 117: Latin America Soft Robotics Market Market Revenue (US$ Mn) Comparison by Component (2016-2032)
- Figure 118: Latin America Soft Robotics Market Market Revenue (US$ Mn) Comparison by End-User (2016-2032)
- Figure 119: Latin America Soft Robotics Market Market Y-o-Y Growth Rate Comparison by Country (2016-2032)
- Figure 120: Latin America Soft Robotics Market Market Y-o-Y Growth Rate Comparison by Type (2016-2032)
- Figure 121: Latin America Soft Robotics Market Market Y-o-Y Growth Rate Comparison by Component (2016-2032)
- Figure 122: Latin America Soft Robotics Market Market Y-o-Y Growth Rate Comparison by End-User (2016-2032)
- Figure 123: Latin America Soft Robotics Market Market Share Comparison by Country (2016-2032)
- Figure 124: Latin America Soft Robotics Market Market Share Comparison by Type (2016-2032)
- Figure 125: Latin America Soft Robotics Market Market Share Comparison by Component (2016-2032)
- Figure 126: Latin America Soft Robotics Market Market Share Comparison by End-User (2016-2032)
- Figure 127: Middle East & Africa Soft Robotics Market Revenue (US$ Mn) Market Share by Typein 2022
- Figure 128: Middle East & Africa Soft Robotics Market Market Attractiveness Analysis by Type, 2016-2032
- Figure 129: Middle East & Africa Soft Robotics Market Revenue (US$ Mn) Market Share by Componentin 2022
- Figure 130: Middle East & Africa Soft Robotics Market Market Attractiveness Analysis by Component, 2016-2032
- Figure 131: Middle East & Africa Soft Robotics Market Revenue (US$ Mn) Market Share by End-Userin 2022
- Figure 132: Middle East & Africa Soft Robotics Market Market Attractiveness Analysis by End-User, 2016-2032
- Figure 133: Middle East & Africa Soft Robotics Market Revenue (US$ Mn) Market Share by Country in 2022
- Figure 134: Middle East & Africa Soft Robotics Market Market Attractiveness Analysis by Country, 2016-2032
- Figure 135: Middle East & Africa Soft Robotics Market Market Revenue (US$ Mn) (2016-2032)
- Figure 136: Middle East & Africa Soft Robotics Market Market Revenue (US$ Mn) Comparison by Country (2016-2032)
- Figure 137: Middle East & Africa Soft Robotics Market Market Revenue (US$ Mn) Comparison by Type (2016-2032)
- Figure 138: Middle East & Africa Soft Robotics Market Market Revenue (US$ Mn) Comparison by Component (2016-2032)
- Figure 139: Middle East & Africa Soft Robotics Market Market Revenue (US$ Mn) Comparison by End-User (2016-2032)
- Figure 140: Middle East & Africa Soft Robotics Market Market Y-o-Y Growth Rate Comparison by Country (2016-2032)
- Figure 141: Middle East & Africa Soft Robotics Market Market Y-o-Y Growth Rate Comparison by Type (2016-2032)
- Figure 142: Middle East & Africa Soft Robotics Market Market Y-o-Y Growth Rate Comparison by Component (2016-2032)
- Figure 143: Middle East & Africa Soft Robotics Market Market Y-o-Y Growth Rate Comparison by End-User (2016-2032)
- Figure 144: Middle East & Africa Soft Robotics Market Market Share Comparison by Country (2016-2032)
- Figure 145: Middle East & Africa Soft Robotics Market Market Share Comparison by Type (2016-2032)
- Figure 146: Middle East & Africa Soft Robotics Market Market Share Comparison by Component (2016-2032)
- Figure 147: Middle East & Africa Soft Robotics Market Market Share Comparison by End-User (2016-2032)
"
- List of Tables
- "
- Table 1: Global Soft Robotics Market Market Comparison by Type (2016-2032)
- Table 2: Global Soft Robotics Market Market Comparison by Component (2016-2032)
- Table 3: Global Soft Robotics Market Market Comparison by End-User (2016-2032)
- Table 4: Global Soft Robotics Market Revenue (US$ Mn) Comparison by Region (2016-2032)
- Table 5: Global Soft Robotics Market Market Revenue (US$ Mn) (2016-2032)
- Table 6: Global Soft Robotics Market Market Revenue (US$ Mn) Comparison by Region (2016-2032)
- Table 7: Global Soft Robotics Market Market Revenue (US$ Mn) Comparison by Type (2016-2032)
- Table 8: Global Soft Robotics Market Market Revenue (US$ Mn) Comparison by Component (2016-2032)
- Table 9: Global Soft Robotics Market Market Revenue (US$ Mn) Comparison by End-User (2016-2032)
- Table 10: Global Soft Robotics Market Market Y-o-Y Growth Rate Comparison by Region (2016-2032)
- Table 11: Global Soft Robotics Market Market Y-o-Y Growth Rate Comparison by Type (2016-2032)
- Table 12: Global Soft Robotics Market Market Y-o-Y Growth Rate Comparison by Component (2016-2032)
- Table 13: Global Soft Robotics Market Market Y-o-Y Growth Rate Comparison by End-User (2016-2032)
- Table 14: Global Soft Robotics Market Market Share Comparison by Region (2016-2032)
- Table 15: Global Soft Robotics Market Market Share Comparison by Type (2016-2032)
- Table 16: Global Soft Robotics Market Market Share Comparison by Component (2016-2032)
- Table 17: Global Soft Robotics Market Market Share Comparison by End-User (2016-2032)
- Table 18: North America Soft Robotics Market Market Comparison by Component (2016-2032)
- Table 19: North America Soft Robotics Market Market Comparison by End-User (2016-2032)
- Table 20: North America Soft Robotics Market Revenue (US$ Mn) Comparison by Country (2016-2032)
- Table 21: North America Soft Robotics Market Market Revenue (US$ Mn) (2016-2032)
- Table 22: North America Soft Robotics Market Market Revenue (US$ Mn) Comparison by Country (2016-2032)
- Table 23: North America Soft Robotics Market Market Revenue (US$ Mn) Comparison by Type (2016-2032)
- Table 24: North America Soft Robotics Market Market Revenue (US$ Mn) Comparison by Component (2016-2032)
- Table 25: North America Soft Robotics Market Market Revenue (US$ Mn) Comparison by End-User (2016-2032)
- Table 26: North America Soft Robotics Market Market Y-o-Y Growth Rate Comparison by Country (2016-2032)
- Table 27: North America Soft Robotics Market Market Y-o-Y Growth Rate Comparison by Type (2016-2032)
- Table 28: North America Soft Robotics Market Market Y-o-Y Growth Rate Comparison by Component (2016-2032)
- Table 29: North America Soft Robotics Market Market Y-o-Y Growth Rate Comparison by End-User (2016-2032)
- Table 30: North America Soft Robotics Market Market Share Comparison by Country (2016-2032)
- Table 31: North America Soft Robotics Market Market Share Comparison by Type (2016-2032)
- Table 32: North America Soft Robotics Market Market Share Comparison by Component (2016-2032)
- Table 33: North America Soft Robotics Market Market Share Comparison by End-User (2016-2032)
- Table 34: Western Europe Soft Robotics Market Market Comparison by Type (2016-2032)
- Table 35: Western Europe Soft Robotics Market Market Comparison by Component (2016-2032)
- Table 36: Western Europe Soft Robotics Market Market Comparison by End-User (2016-2032)
- Table 37: Western Europe Soft Robotics Market Revenue (US$ Mn) Comparison by Country (2016-2032)
- Table 38: Western Europe Soft Robotics Market Market Revenue (US$ Mn) (2016-2032)
- Table 39: Western Europe Soft Robotics Market Market Revenue (US$ Mn) Comparison by Country (2016-2032)
- Table 40: Western Europe Soft Robotics Market Market Revenue (US$ Mn) Comparison by Type (2016-2032)
- Table 41: Western Europe Soft Robotics Market Market Revenue (US$ Mn) Comparison by Component (2016-2032)
- Table 42: Western Europe Soft Robotics Market Market Revenue (US$ Mn) Comparison by End-User (2016-2032)
- Table 43: Western Europe Soft Robotics Market Market Y-o-Y Growth Rate Comparison by Country (2016-2032)
- Table 44: Western Europe Soft Robotics Market Market Y-o-Y Growth Rate Comparison by Type (2016-2032)
- Table 45: Western Europe Soft Robotics Market Market Y-o-Y Growth Rate Comparison by Component (2016-2032)
- Table 46: Western Europe Soft Robotics Market Market Y-o-Y Growth Rate Comparison by End-User (2016-2032)
- Table 47: Western Europe Soft Robotics Market Market Share Comparison by Country (2016-2032)
- Table 48: Western Europe Soft Robotics Market Market Share Comparison by Type (2016-2032)
- Table 49: Western Europe Soft Robotics Market Market Share Comparison by Component (2016-2032)
- Table 50: Western Europe Soft Robotics Market Market Share Comparison by End-User (2016-2032)
- Table 51: Eastern Europe Soft Robotics Market Market Comparison by Type (2016-2032)
- Table 52: Eastern Europe Soft Robotics Market Market Comparison by Component (2016-2032)
- Table 53: Eastern Europe Soft Robotics Market Market Comparison by End-User (2016-2032)
- Table 54: Eastern Europe Soft Robotics Market Revenue (US$ Mn) Comparison by Country (2016-2032)
- Table 55: Eastern Europe Soft Robotics Market Market Revenue (US$ Mn) (2016-2032)
- Table 56: Eastern Europe Soft Robotics Market Market Revenue (US$ Mn) Comparison by Country (2016-2032)
- Table 57: Eastern Europe Soft Robotics Market Market Revenue (US$ Mn) Comparison by Type (2016-2032)
- Table 58: Eastern Europe Soft Robotics Market Market Revenue (US$ Mn) Comparison by Component (2016-2032)
- Table 59: Eastern Europe Soft Robotics Market Market Revenue (US$ Mn) Comparison by End-User (2016-2032)
- Table 60: Eastern Europe Soft Robotics Market Market Y-o-Y Growth Rate Comparison by Country (2016-2032)
- Table 61: Eastern Europe Soft Robotics Market Market Y-o-Y Growth Rate Comparison by Type (2016-2032)
- Table 62: Eastern Europe Soft Robotics Market Market Y-o-Y Growth Rate Comparison by Component (2016-2032)
- Table 63: Eastern Europe Soft Robotics Market Market Y-o-Y Growth Rate Comparison by End-User (2016-2032)
- Table 64: Eastern Europe Soft Robotics Market Market Share Comparison by Country (2016-2032)
- Table 65: Eastern Europe Soft Robotics Market Market Share Comparison by Type (2016-2032)
- Table 66: Eastern Europe Soft Robotics Market Market Share Comparison by Component (2016-2032)
- Table 67: Eastern Europe Soft Robotics Market Market Share Comparison by End-User (2016-2032)
- Table 68: APAC Soft Robotics Market Market Comparison by Type (2016-2032)
- Table 69: APAC Soft Robotics Market Market Comparison by Component (2016-2032)
- Table 70: APAC Soft Robotics Market Market Comparison by End-User (2016-2032)
- Table 71: APAC Soft Robotics Market Revenue (US$ Mn) Comparison by Country (2016-2032)
- Table 72: APAC Soft Robotics Market Market Revenue (US$ Mn) (2016-2032)
- Table 73: APAC Soft Robotics Market Market Revenue (US$ Mn) Comparison by Country (2016-2032)
- Table 74: APAC Soft Robotics Market Market Revenue (US$ Mn) Comparison by Type (2016-2032)
- Table 75: APAC Soft Robotics Market Market Revenue (US$ Mn) Comparison by Component (2016-2032)
- Table 76: APAC Soft Robotics Market Market Revenue (US$ Mn) Comparison by End-User (2016-2032)
- Table 77: APAC Soft Robotics Market Market Y-o-Y Growth Rate Comparison by Country (2016-2032)
- Table 78: APAC Soft Robotics Market Market Y-o-Y Growth Rate Comparison by Type (2016-2032)
- Table 79: APAC Soft Robotics Market Market Y-o-Y Growth Rate Comparison by Component (2016-2032)
- Table 80: APAC Soft Robotics Market Market Y-o-Y Growth Rate Comparison by End-User (2016-2032)
- Table 81: APAC Soft Robotics Market Market Share Comparison by Country (2016-2032)
- Table 82: APAC Soft Robotics Market Market Share Comparison by Type (2016-2032)
- Table 83: APAC Soft Robotics Market Market Share Comparison by Component (2016-2032)
- Table 84: APAC Soft Robotics Market Market Share Comparison by End-User (2016-2032)
- Table 85: Latin America Soft Robotics Market Market Comparison by Type (2016-2032)
- Table 86: Latin America Soft Robotics Market Market Comparison by Component (2016-2032)
- Table 87: Latin America Soft Robotics Market Market Comparison by End-User (2016-2032)
- Table 88: Latin America Soft Robotics Market Revenue (US$ Mn) Comparison by Country (2016-2032)
- Table 89: Latin America Soft Robotics Market Market Revenue (US$ Mn) (2016-2032)
- Table 90: Latin America Soft Robotics Market Market Revenue (US$ Mn) Comparison by Country (2016-2032)
- Table 91: Latin America Soft Robotics Market Market Revenue (US$ Mn) Comparison by Type (2016-2032)
- Table 92: Latin America Soft Robotics Market Market Revenue (US$ Mn) Comparison by Component (2016-2032)
- Table 93: Latin America Soft Robotics Market Market Revenue (US$ Mn) Comparison by End-User (2016-2032)
- Table 94: Latin America Soft Robotics Market Market Y-o-Y Growth Rate Comparison by Country (2016-2032)
- Table 95: Latin America Soft Robotics Market Market Y-o-Y Growth Rate Comparison by Type (2016-2032)
- Table 96: Latin America Soft Robotics Market Market Y-o-Y Growth Rate Comparison by Component (2016-2032)
- Table 97: Latin America Soft Robotics Market Market Y-o-Y Growth Rate Comparison by End-User (2016-2032)
- Table 98: Latin America Soft Robotics Market Market Share Comparison by Country (2016-2032)
- Table 99: Latin America Soft Robotics Market Market Share Comparison by Type (2016-2032)
- Table 100: Latin America Soft Robotics Market Market Share Comparison by Component (2016-2032)
- Table 101: Latin America Soft Robotics Market Market Share Comparison by End-User (2016-2032)
- Table 102: Middle East & Africa Soft Robotics Market Market Comparison by Type (2016-2032)
- Table 103: Middle East & Africa Soft Robotics Market Market Comparison by Component (2016-2032)
- Table 104: Middle East & Africa Soft Robotics Market Market Comparison by End-User (2016-2032)
- Table 105: Middle East & Africa Soft Robotics Market Revenue (US$ Mn) Comparison by Country (2016-2032)
- Table 106: Middle East & Africa Soft Robotics Market Market Revenue (US$ Mn) (2016-2032)
- Table 107: Middle East & Africa Soft Robotics Market Market Revenue (US$ Mn) Comparison by Country (2016-2032)
- Table 108: Middle East & Africa Soft Robotics Market Market Revenue (US$ Mn) Comparison by Type (2016-2032)
- Table 109: Middle East & Africa Soft Robotics Market Market Revenue (US$ Mn) Comparison by Component (2016-2032)
- Table 110: Middle East & Africa Soft Robotics Market Market Revenue (US$ Mn) Comparison by End-User (2016-2032)
- Table 111: Middle East & Africa Soft Robotics Market Market Y-o-Y Growth Rate Comparison by Country (2016-2032)
- Table 112: Middle East & Africa Soft Robotics Market Market Y-o-Y Growth Rate Comparison by Type (2016-2032)
- Table 113: Middle East & Africa Soft Robotics Market Market Y-o-Y Growth Rate Comparison by Component (2016-2032)
- Table 114: Middle East & Africa Soft Robotics Market Market Y-o-Y Growth Rate Comparison by End-User (2016-2032)
- Table 115: Middle East & Africa Soft Robotics Market Market Share Comparison by Country (2016-2032)
- Table 116: Middle East & Africa Soft Robotics Market Market Share Comparison by Type (2016-2032)
- Table 117: Middle East & Africa Soft Robotics Market Market Share Comparison by Component (2016-2032)
- Table 118: Middle East & Africa Soft Robotics Market Market Share Comparison by End-User (2016-2032)
- 1. Executive Summary
-
- Bioservo Technologies AB
- Cyberdyne Inc.
- Ekso Bionics Holdings, Inc.
- F&P Robotics AG
- Festo AG
- Rewalk Robotics Ltd.
- Righthand Robotics Inc.
- Roam Robotics
- Soft Robotics Inc.
- Yaskawa Electric Corporation
Our Clients


View Our Licence Options
