
Global Snack Bars Market Product Type Analysis (Granola Bars, Protein Bars and Others), Distribution Channel Analysis (Supermarkets and Hypermarkets,Convenience Stores, and Others), Ingredients Analysis (Chocolate,Nuts ,Seeds and Others) By Region And Companies - Industry Segment Outlook, Market Assessment, Competition Scenario, Trends, And Forecast 2023-2032
-
5054
-
May 2023
-
178
-


-
This report was compiled by Shreyas Rokade Shreyas Rokade is a seasoned Research Analyst with CMFE, bringing extensive expertise in market research and consulting, with a strong background in Chemical Engineering. Correspondence Team Lead-CMFE Linkedin | Detailed Market research Methodology Our methodology involves a mix of primary research, including interviews with leading mental health experts, and secondary research from reputable medical journals and databases. View Detailed Methodology Page
-
Quick Navigation
Report Overview
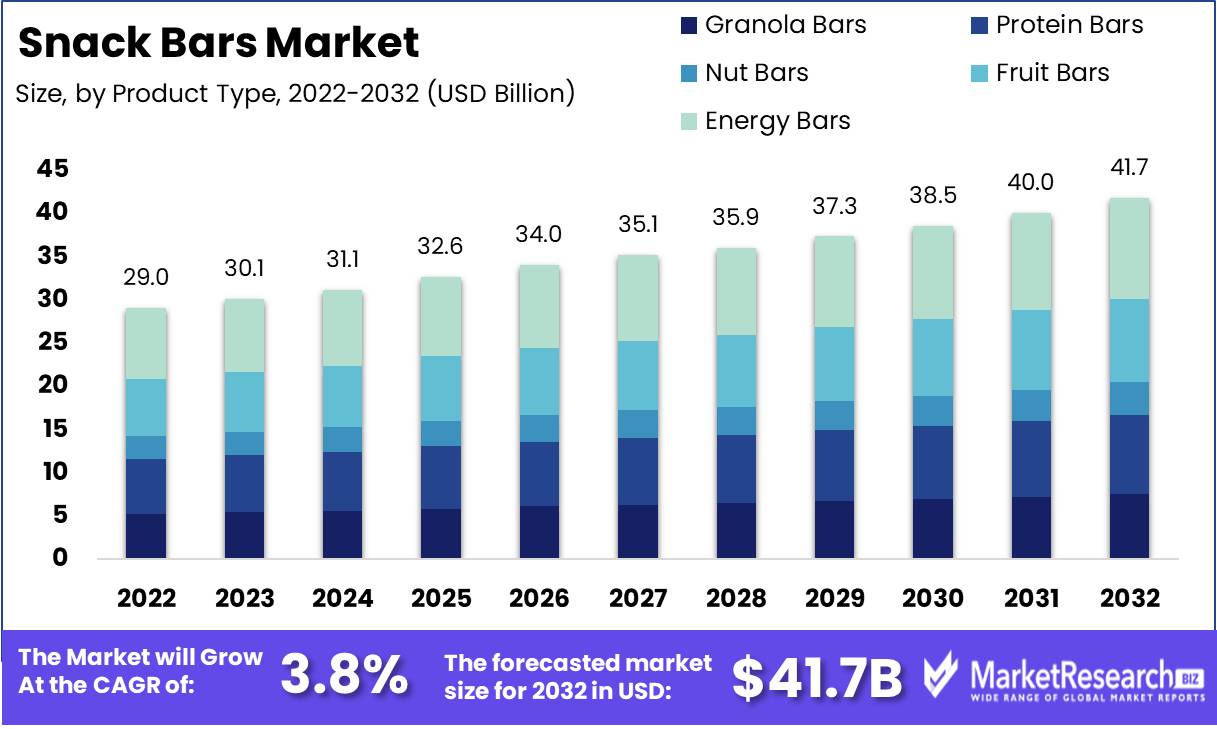
Global Snack Bars Market size is expected to be worth around USD 41.7 Bn by 2032 from USD 29.0 Bn in 2022, growing at a CAGR of 3.8% during the forecast period from 2023 to 2032.
The ever-increasing popularity of the snack bars market is an undeniable phenomenon that continues to captivate the general public with its unparalleled convenience, affordability, and extraordinary health benefits. This enthralling field explores multifaceted dimensions comprising a multitude of intriguing elements, such as ground-breaking innovations, exponential growth patterns, versatile applications, intriguing ethical concerns, and enthralling business implications.
Embracing the ethos of health and nourishment, snack bars emerge as the epitome of a wholesome and convenient snack option, meticulously crafted from a plethora of natural ingredients to provide an exceptional array of vital components such as protein, fiber, vitamins, and minerals. This bounty manifests as a vibrant tapestry of flavors and styles, ranging from energy bars pulsating with vitality to protein bars that ignite the senses, as well as rustic granola bars brimming with textured elegance and fruity bars that transport taste buds to paradisiacal realms.
Positioned as an integral cog in the machinery of the snack bars industry, the snack bars market is an indispensable conduit that meticulously accommodates the growing demand for wholesome and convenient snack alternatives. These extraordinary bars are endowed with a variety of benefits, including portability, durability, and satiety, while also harnessing the power of nature's bountiful offerings and eschewing artificial preservatives, flavors, and hues. Indeed, these formidable snack bars are a reliable source of revitalizing energy, endowed with the ability to bestow vital nutrients, thereby ushering in an era of swift and robust revitalization.
Immersed in this vibrant industry of the snack bars market, a never-ending stream of innovations has emerged, as industry pioneers discharge a deluge of novel flavors, textures, and nutritional marvels within their products.
The snack bars market has attracted both venture capitalists' and corporate titans' fervent interest and investment. Notably, renowned conglomerates such as Nestle and General Mills have strategically acquired well-known snack bar brands, as evidenced by their respective acquisitions of KIND and RXBAR.
A combination of factors, including a resolute commitment to health consciousness, a transformation in prevailing lifestyles, and an increase in disposable incomes, are expected to propel the snack bars market to a rapid expansion in the near future.
Driving factors
The Snack Bars Market is Evolving Due to Dynamic Forces
The snack bars market is enduring a remarkable transformation, which is being driven by a variety of dynamic forces that are converging to determine its trajectory. Among these factors, the growing demand for nutritious and convenient snack alternatives plays a crucial role. As consumers embark on a journey toward greater health awareness, their quest for sustenance and pursuit of unparalleled convenience become intertwined. Snack bars are the epitome of this harmonious union, brimming with protein, fiber, and wholesome ingredients.
The Success of Snack Bars is Driven by Health Awareness
The remarkable increase in consumers' health and wellness consciousness considerably contributes to the success of the snack bars market. Individuals are awakening to the utmost significance of cultivating healthy dietary habits as the specter of lifestyle-related diseases looms ominously on the horizon.
Income from Discretion and Snack Bar Preferences
The exponential development of the snack bars market is aided by the rising tide of discretionary income, which enables consumers to exercise discriminating tastes. Individuals tend to gravitate toward snack bars, attracted by the allure of both convenience and health-consciousness, as their wealth increases.
Ahead of Uncertainty Stricter Labeling Challenges
However, a cloud of uncertainty hangs over this prospective landscape, threatening to challenge the snack bars market. The impending implementation of stricter labeling requirements is one such impediment that requires cautious consideration.
Innovative Snack Bars Using 3D Printing and Personalized Nutrition
In addition, the snack bars market is obscured by the disruptive potential of emergent technologies. Innovations such as 3D printing and personalized nutrition hold the tantalizing promise of empowering consumers to create snack bars tailored to their specific dietary needs.
Changing Consumer Preferences Competing with Meal Replacements
As transformative trends threaten to reorient consumer preferences, the competitive landscape of the snack bars market confronts potential upheaval. The ascendance of meal replacement options and the rising popularity of intermittent fasting introduce formidable competitors that may sway consumers away from snack bars, luring them instead with alternatives that meet their changing needs.
Restraining Factors
Challenges Contributing to Snack Bars Market Growth
The market for snack bars has identified several factors that limit industry expansion. High competition among established players and new entrants, limited shelf life and raw materials storage, fluctuating snack bar prices, and stringent regulations and labeling requirements in some regions present significant challenges, even though snack bars have become increasingly popular among consumers seeking convenient and healthy on-the-go food options.
The Intense Rivalry Between Established Competitors and New Entrants
Numerous companies offer a vast selection of snack bars, and the competition is intensifying. They have the resources to invest in product innovation and marketing and have already established brand loyalty. It is often difficult for new entrants to acquire market share and compete with established players' marketing budgets.
However, we believe there is still space on the market for new entrants with strong brand identities and innovative products. These new entrants must have a distinct selling proposition to attract consumers and obtain a competitive advantage.
Restricted Shelf Life and Storage Requirements
Snack bars have a relatively short shelf life, and appropriate storage is required to preserve their nutritional value and flavor. Preventing ingredient deterioration and maintaining the bars' freshness, flavor, and texture requires cautious storage and transportation. This requirement restricts the geographic reach of some manufacturers because it raises storage and transportation costs.
Variable Prices for Raw Materials
The fluctuating price of the raw materials used to produce snack bars makes it difficult for manufacturers to plan their production process and pricing strategy. For instance, the price of nuts is highly variable, and any significant price increase has a significant impact on the profit margins of manufacturers. However, at our company, we believe that the key to managing these fluctuations in raw material prices is to maintain stable relationships with suppliers, negotiate favorable contracts, and conduct ongoing research into cost-saving alternative ingredients.
In some Regions of the Market for Snack Bars, Strict Regulations and Labeling Requirements Apply
Various government and industry bodies regulate the snack bars industry, and manufacturers must adhere to certain labeling and safety requirements. These regulations can vary from region to region and make it challenging for manufacturers to offer their products in certain areas.
Product Type Analysis
The snack bar market is controlled by the energy bars segment. Due to their nutritional content and energy-boosting capabilities, energy bars are becoming increasingly popular among health-conscious consumers. These bars contain nuts, seeds, fruits, protein, and fiber.
Due to the rising demand for healthier snacks, the energy bars segment is likely to dominate the snack bars market in the future years. Consumers want quick, convenient, and healthful snack options, especially ones that provide continuous energy throughout the day.
Emerging economies are adopting energy bars due to economic growth. Consumers have more disposable income as these economies grow, and they are increasingly health-conscious. This has increased demand for healthier snacks, especially in urban areas where consumers have access to imported products.
The energy bars segment is predicted to develop the fastest over the next few years. First, as indicated, consumers are increasingly interested in healthy and nutritious snack options, making the energy bars segment well-positioned to address this demand.
Distribution Channel Analysis
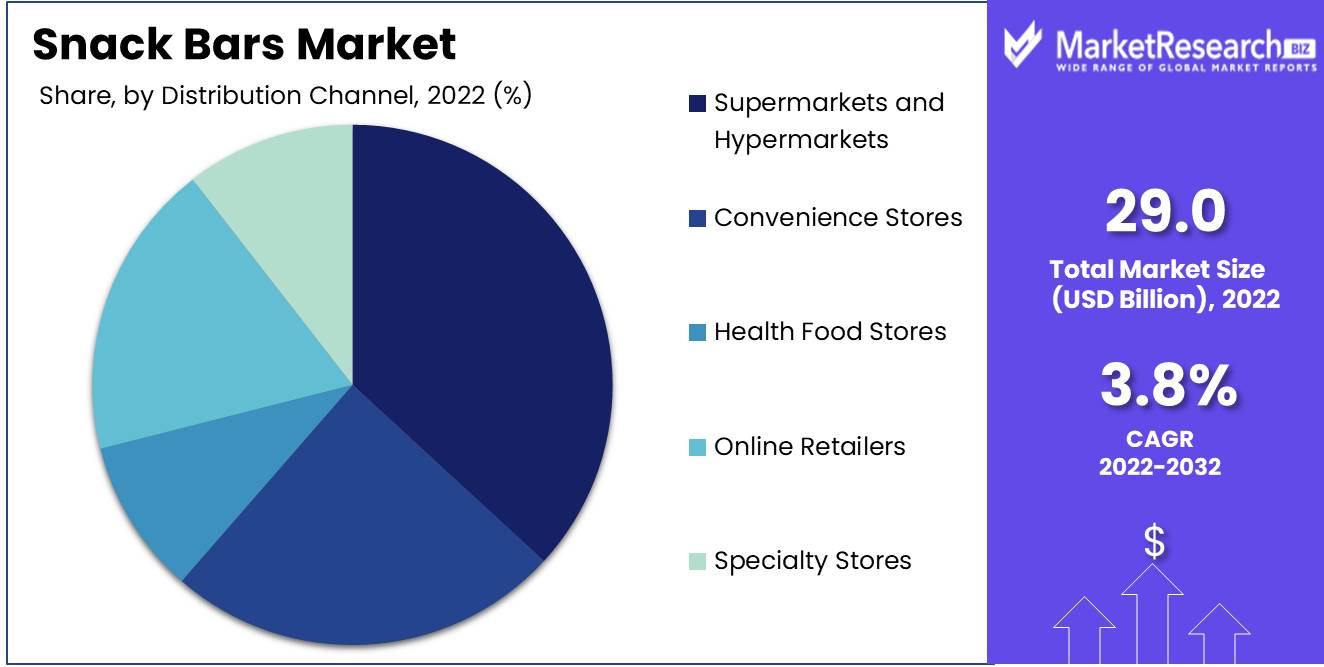
Supermarkets and hypermarkets dominate the snack bar market. These convenience stores sell snack bars and other products. Supermarkets and hypermarkets can provide consumers with bulk discounts and other promotional opportunities.
Economic development drives the growth of supermarkets and hypermarkets in emerging markets. As economies grow, consumers have more disposable income and demand convenience and accessibility. With changing lifestyles, consumers are increasingly shopping in supermarkets and hypermarkets.
Consumers are increasingly looking for convenience and accessibility, which has increased demand for supermarkets and hypermarkets. These stores have a large choice of products, including snack bars, making it easier for consumers to purchase for their daily necessities.
The supermarkets/hypermarkets segment is predicted to experience the fastest growth rate in the future years. First, more supermarkets and hypermarkets are opening in emerging nations, making shopping easier for consumers.
Ingredients Analysis
The chocolate segment dominates the snack bar market. Chocolate is a well-known and well-loved ingredient, and manufacturers use it in many ways to make snack bars appeal to consumers.
Milk, dark, or white chocolate is used to make chocolate snack bars. These bars have many tastes and may contain nuts or fruits. Rising disposable income and lifestyle changes boost emerging economies' chocolate segment growth. These economies are increasingly exposed to different varieties of chocolate and willing to spend more for higher-quality products.
Chocolate's sweet taste and comforting qualities make it popular. Chocolate is also associated with sentiments of indulgence and nostalgia, making it a popular snack bar ingredient.
Due to many variables, the chocolate segment is predicted to have the fastest growth rate in the next years. First, as emerging economies expand, consumers will have more disposable income and demand premium chocolate products.
Key Market Segments
Product Type Analysis
- Granola Bars
- Protein Bars
- Nut Bars
- Fruit Bars
- Energy Bars
Distribution Channel Analysis
- Supermarkets and Hypermarkets
- Convenience Stores
- Health Food Stores
- Online Retailers
- Specialty Stores
Ingredients Analysis
- Chocolate (dark, milk, or white)
- Nuts (such as almonds, peanuts, cashews)
- Seeds (such as chia seeds, flaxseeds, pumpkin seeds)
- Dried Fruits (such as dates, raisins, cranberries)
- Protein Sources (such as whey protein, plant-based proteins)
Growth Opportunity
The Snack Bars Market's Exciting Growth:
Snack bars are experiencing phenomenal growth thanks to the growing health and wellness market, where people want easy, healthy snacks. Many factors drove this remarkable rise. The realms of market expansion into uncharted regions, a mesmerizing symphony of new and inventive flavors and ingredients, harmonious alliances with fitness and health clubs, and the noble quest for sustainable and eco-friendly packaging.
Expansion in Untapped Markets and Regions:
Watch as the snack bars market expands and reveals its secrets in new markets and regions. Particularly in emerging markets like Asia Pacific, Latin America, and the Middle East, a roaring demand for snack bars has been sparked by consumers' growing knowledge of the health benefits of snack bars.
A Magical Launch of New Flavors and Ingredients:
Prepare to be enchanted by the snack bar market's kaleidoscope of flavors and ingredients. As consumers explore the cuisine, they want distinctive, unusual products. They want functional ingredients like protein, fiber, and superfoods to maximize their diets. Manufacturers follow this demand and create unconventional flavors and formulations. They work with suppliers to create a feast of sustainable and ethereal ingredients.
The Dance of Unity: Fitness and Health Club Partnerships for Wellness:
The snack bars market and fitness and health clubs dance together. As consumers pursue vitality and well-being, this cosmic partnership develops. Manufacturers give gyms and fitness centers free samples, support big events, and create co-branded products. This holy tie gives the market life. It captures health-conscious consumers' hearts and leads them to satisfaction by weaving a trusting web.
Sustainable Packaging: Environmental Salvation:
Join the snack bars market's noble quest to save the world through sustainable and eco-friendly packaging. Consumers want products that bear the banner of sustainability as the globe realizes the negative effects of single-use packaging on the environment. Changemakers invest in biodegradable, compostable, and recyclable packaging.
Latest Trends
Significant market trends influencing the Snack Bars industry:
The demand for convenient, healthful, and on-the-go snacks has increased in recent years, propelling the growth of the snack bars market. As consumers become more health conscious, they seek snacks that not only taste delicious but also provide nutritional benefits. The major market trends that are influencing the snack bars industry, such as the increased emphasis on plant-based and vegan options, the use of natural and organic ingredients, the introduction of snack bars with functional benefits such as immunity and gut health, and the rising popularity of personalized and customized snack bars.
Increased Focus on Vegan and Plant-Based Options:
As consumers become more aware of the environmental and health benefits of a plant-based diet, the demand for plant-based and vegan snacks has increased dramatically in recent years. Numerous manufacturers of snack bars are incorporating vegan and plant-based options into their product lines. These snacks typically contain no animal products or byproducts and are typically prepared with ingredients like nuts, seeds, fruits, and grains.
Utilization of Natural and Organic Components:
Increasingly wary of artificial ingredients and preservatives in their food, consumers seek out snacks made with natural, organic ingredients. Many manufacturers of snack bars have reformulated their products to include natural and organic ingredients, such as whole cereals, nuts, seeds, fruits, and dark chocolate. Not only are these ingredients healthier, but they also make for a more satisfying and flavorful snack.
Introduction of Snack Bars with Physiological Benefits, Including Immunity and Gut Health:
Consumers progressively seek out snacks that provide functional benefits in addition to basic nutrition. Snack bars fortified with antioxidants, vitamins, probiotics, and other functional ingredients are gaining popularity because they provide targeted health benefits, such as improved immunity and digestive health.
Increasing Demand for Personalized and Custom Snack Bars:
As consumers become more health-conscious and demand more personalized nutrition, manufacturers of snack bars respond by offering customized and individualized snack bars. These bars can be tailored to an individual's preferences and dietary requirements, and their flavors, ingredients, and branding can be personalized.
Regional Analysis
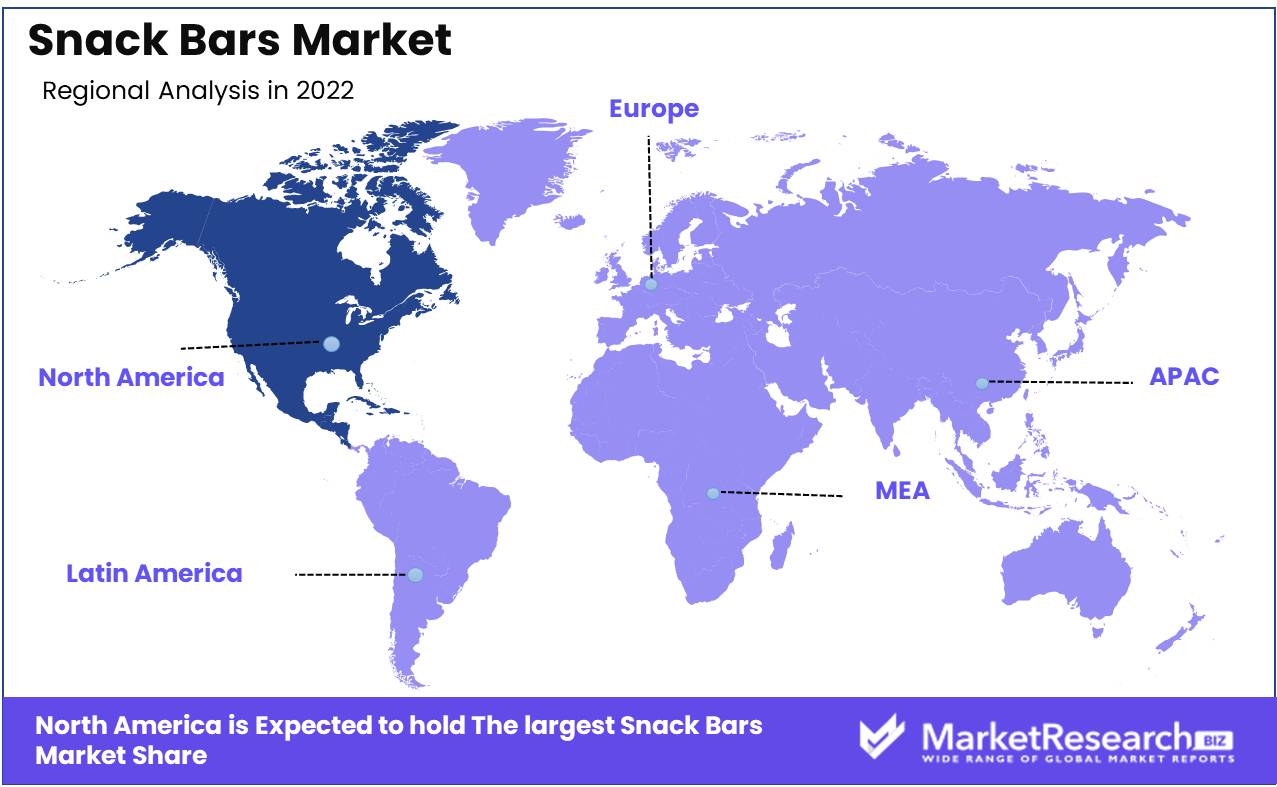
North America and Europe are two of the world's greatest markets for numerous industries. These two regions are attractive to businesses seeking to expand their scope due to the sheer number of residents and purchasing power. However, there is a clear winner when it comes to which region is the most significant market: North America.
North America has a larger total market size, making it a more desirable location for businesses seeking to establish themselves. In addition, North America has a high per capita GDP, which reflects the region's overall prosperity.
Europe has a lower purchasing capacity than North America. This indicates that North American consumers have more discretionary income to spend on products and services. This increased purchasing power generates a more robust market for businesses. North America's economy is robust and stable, making it an investment-worthy market for businesses.
North America has the largest market share in part because it is home to many of the world's most successful industries. The region is renowned for its technological prowess and is home to some of the world's largest technology corporations. North America is also a leader in the pharmaceutical and healthcare industries. These industries considerably contribute to the economic and social stability of the region as a whole.
In addition, North America has been a marketing, advertising, and branding pioneer. North America is home to many of the world's largest and most successful marketing firms. This indicates a comprehensive comprehension of how to successfully market products and services to North American consumers.
Key Regions and Countries
North America
- US
- Canada
- Mexico
Western Europe
- Germany
- France
- The UK
- Spain
- Italy
- Portugal
- Ireland
- Austria
- Switzerland
- Benelux
- Nordic
- Rest of Western Europe
Eastern Europe
- Russia
- Poland
- The Czech Republic
- Greece
- Rest of Eastern Europe
APAC
- China
- Japan
- South Korea
- India
- Australia & New Zealand
- Indonesia
- Malaysia
- Philippines
- Singapore
- Thailand
- Vietnam
- Rest of APAC
Latin America
- Brazil
- Colombia
- Chile
- Argentina
- Costa Rica
- Rest of Latin America
Middle East & Africa
- Algeria
- Egypt
- Israel
- Kuwait
- Nigeria
- Saudi Arabia
- South Africa
- Turkey
- United Arab Emirates
- Rest of MEA
Key Players Analysis
Due to an increasing preference for healthy snacking alternatives, the snack bars market has experienced a significant increase in recent years. Numerous major players are involved in the production, marketing, and distribution of their products. The market can be segmented according to its geographical presence, product offerings, and target clientele.
Kellogg Co, one of the main players in the snack bars market, offers a diverse range of snack bars under its brand names, including Nutri-Grain, Rice Krispies, and Special K. These bars are marketed as healthy snack options and come in a variety of flavors.
KIND LLC, a significant competitor, offers a wide range of snack bars made with healthy and natural ingredients. The company focuses heavily on nutrition and provides bars with high protein, fiber, and low sugar content.
Another significant player in the snack bars market is Clif Bar & Company, which is renowned for its organic and environmentally friendly manufacturing methods. The company provides a variety of snack bars that appeal to various dietary requirements, including gluten-free and vegan.
Nature Valley, which is owned by General Mills, is a significant player in the snack bars market with a focus on natural ingredients. The company provides a diverse range of snack bars, such as granola bar, chewy bars, and biscuits.
Top Key Players in Snack Bars Market
- General Mills Inc.
- Kellogg Company
- The Quaker Oats Company
- KIND LLC
- Clif Bar & Company
- Atkins Nutritionals, Inc.
- Earnest Eats
- Mars, Incorporated
- Healthy Food Ingredients, LLC
- Quest Nutrition LLC
Recent Development
- In 2023, The Rise of Plant-Based and Vegan Snack Bars. As consumers become more conscious of their diets and the environment, there is a growing demand for plant-based and vegan snack bars.
- In 2022, Sustainable procurement progressed, with snack bar manufacturers emphasizing the use of ethically and responsibly sourced ingredients.
- In 2021, Snack bar manufacturers offered consumers personalized options. Customers were able to select their preferred ingredients, flavors, and even nutritional profiles via online platforms, resulting in snack bars tailored to their preferences and dietary needs.
- In 2020, The COVID-19 pandemic changed consumer behavior, with a growing emphasis on immunity-boosting food. Profiting from the heightened health concerns of the population, snack bar manufacturers quickly introduced bars fortified with immune-boosting ingredients such as vitamin C, elderberry, and turmeric.
- In 2019, There was an increase in the introduction of snack bars with novel flavors and textures, tailored to consumers' evolving tastes.
Report Scope:
Report Features Description Market Value (2022) USD 29.0 Bn Forecast Revenue (2032) USD 41.7 Bn CAGR (2023-2032) 3.8% Base Year for Estimation 2022 Historic Period 2016-2022 Forecast Period 2023-2032 Report Coverage Revenue Forecast, Market Dynamics, COVID-19 Impact, Competitive Landscape, Recent Developments Segments Covered Product Type Analysis(Granola Bars, Protein Bars,Nut Bars,Fruit Bars,Energy Bars), Distribution Channel Analysis(Supermarkets and Hypermarkets,Convenience Stores,Health Food Stores,Online Retailers,Specialty Stores), Ingredients Analysis(Chocolate,Nuts ,Seeds ,Dried Fruits ,Protein Sources) Regional Analysis North America – The US, Canada, & Mexico; Western Europe – Germany, France, The UK, Spain, Italy, Portugal, Ireland, Austria, Switzerland, Benelux, Nordic, & Rest of Western Europe; Eastern Europe – Russia, Poland, The Czech Republic, Greece, & Rest of Eastern Europe; APAC – China, Japan, South Korea, India, Australia & New Zealand, Indonesia, Malaysia, Philippines, Singapore, Thailand, Vietnam, & Rest of APAC; Latin America – Brazil, Colombia, Chile, Argentina, Costa Rica, & Rest of Latin America; Middle East & Africa – Algeria, Egypt, Israel, Kuwait, Nigeria, Saudi Arabia, South Africa, Turkey, United Arab Emirates, & Rest of MEA Competitive Landscape General Mills Inc., Kellogg Company, The Quaker Oats Company, KIND LLC, Clif Bar & Company, Atkins Nutritionals, Inc., Earnest Eats, Mars, Incorporated, Healthy Food Ingredients, LLC, Quest Nutrition LLC Customization Scope Customization for segments, region/country-level will be provided. Moreover, additional customization can be done based on the requirements. Purchase Options We have three licenses to opt for: Single User License, Multi-User License (Up to 5 Users), Corporate Use License (Unlimited User and Printable PDF) -
- 1. Executive Summary
- 1.1. Definition
- 1.2. Taxonomy
- 1.3. Research Scope
- 1.4. Key Analysis
- 1.5. Key Findings by Major Segments
- 1.6. Top strategies by Major Players
- 2. Global Snack Bars Market Overview
- 2.1. Snack Bars Market Dynamics
- 2.1.1. Drivers
- 2.1.2. Opportunities
- 2.1.3. Restraints
- 2.1.4. Challenges
- 2.2. Macro-economic Factors
- 2.3. Regulatory Framework
- 2.4. Market Investment Feasibility Index
- 2.5. PEST Analysis
- 2.6. PORTER’S Five Force Analysis
- 2.7. Drivers & Restraints Impact Analysis
- 2.8. Industry Chain Analysis
- 2.9. Cost Structure Analysis
- 2.10. Marketing Strategy
- 2.11. Russia-Ukraine War Impact Analysis
- 2.12. Opportunity Map Analysis
- 2.13. Market Competition Scenario Analysis
- 2.14. Product Life Cycle Analysis
- 2.15. Opportunity Orbits
- 2.16. Manufacturer Intensity Map
- 2.17. Major Companies sales by Value & Volume
- 2.1. Snack Bars Market Dynamics
- 3. Global Snack Bars Market Analysis, Opportunity and Forecast, 2016-2032
- 3.1. Global Snack Bars Market Analysis, 2016-2021
- 3.2. Global Snack Bars Market Opportunity and Forecast, 2023-2032
- 3.3. Global Snack Bars Market Analysis, Opportunity and Forecast, By Product Type Analysis, 2016-2032
- 3.3.1. Global Snack Bars Market Analysis by Product Type Analysis: Introduction
- 3.3.2. Market Size Absolute $ Opportunity Analysis and Forecast, By Product Type Analysis, 2016-2032
- 3.3.3. Granola Bars
- 3.3.4. Protein Bars
- 3.3.5. Nut Bars
- 3.3.6. Fruit Bars
- 3.3.7. Energy Bars
- 3.4. Global Snack Bars Market Analysis, Opportunity and Forecast, By Distribution Channel Analysis, 2016-2032
- 3.4.1. Global Snack Bars Market Analysis by Distribution Channel Analysis: Introduction
- 3.4.2. Market Size Absolute $ Opportunity Analysis and Forecast, By Distribution Channel Analysis, 2016-2032
- 3.4.3. Supermarkets and Hypermarkets
- 3.4.4. Convenience Stores
- 3.4.5. Health Food Stores
- 3.4.6. Online Retailers
- 3.4.7. Specialty Stores
- 3.5. Global Snack Bars Market Analysis, Opportunity and Forecast, By Ingredients Analysis, 2016-2032
- 3.5.1. Global Snack Bars Market Analysis by Ingredients Analysis: Introduction
- 3.5.2. Market Size Absolute $ Opportunity Analysis and Forecast, By Ingredients Analysis, 2016-2032
- 3.5.3. Chocolate (dark, milk, or white)
- 3.5.4. Nuts (such as almonds, peanuts, cashews)
- 3.5.5. Seeds (such as chia seeds, flaxseeds, pumpkin seeds)
- 3.5.6. Dried Fruits (such as dates, raisins, cranberries)
- 3.5.7. Protein Sources (such as whey protein, plant-based proteins)
- 4. North America Snack Bars Market Analysis, Opportunity and Forecast, 2016-2032
- 4.1. North America Snack Bars Market Analysis, 2016-2021
- 4.2. North America Snack Bars Market Opportunity and Forecast, 2023-2032
- 4.3. North America Snack Bars Market Analysis, Opportunity and Forecast, By Product Type Analysis, 2016-2032
- 4.3.1. North America Snack Bars Market Analysis by Product Type Analysis: Introduction
- 4.3.2. Market Size Absolute $ Opportunity Analysis and Forecast, By Product Type Analysis, 2016-2032
- 4.3.3. Granola Bars
- 4.3.4. Protein Bars
- 4.3.5. Nut Bars
- 4.3.6. Fruit Bars
- 4.3.7. Energy Bars
- 4.4. North America Snack Bars Market Analysis, Opportunity and Forecast, By Distribution Channel Analysis, 2016-2032
- 4.4.1. North America Snack Bars Market Analysis by Distribution Channel Analysis: Introduction
- 4.4.2. Market Size Absolute $ Opportunity Analysis and Forecast, By Distribution Channel Analysis, 2016-2032
- 4.4.3. Supermarkets and Hypermarkets
- 4.4.4. Convenience Stores
- 4.4.5. Health Food Stores
- 4.4.6. Online Retailers
- 4.4.7. Specialty Stores
- 4.5. North America Snack Bars Market Analysis, Opportunity and Forecast, By Ingredients Analysis, 2016-2032
- 4.5.1. North America Snack Bars Market Analysis by Ingredients Analysis: Introduction
- 4.5.2. Market Size Absolute $ Opportunity Analysis and Forecast, By Ingredients Analysis, 2016-2032
- 4.5.3. Chocolate (dark, milk, or white)
- 4.5.4. Nuts (such as almonds, peanuts, cashews)
- 4.5.5. Seeds (such as chia seeds, flaxseeds, pumpkin seeds)
- 4.5.6. Dried Fruits (such as dates, raisins, cranberries)
- 4.5.7. Protein Sources (such as whey protein, plant-based proteins)
- 4.6. North America Snack Bars Market Analysis, Opportunity and Forecast, By Country , 2016-2032
- 4.6.1. North America Snack Bars Market Analysis by Country : Introduction
- 4.6.2. Market Size Absolute $ Opportunity Analysis and Forecast, Country , 2016-2032
- 4.6.2.1. The US
- 4.6.2.2. Canada
- 4.6.2.3. Mexico
- 5. Western Europe Snack Bars Market Analysis, Opportunity and Forecast, 2016-2032
- 5.1. Western Europe Snack Bars Market Analysis, 2016-2021
- 5.2. Western Europe Snack Bars Market Opportunity and Forecast, 2023-2032
- 5.3. Western Europe Snack Bars Market Analysis, Opportunity and Forecast, By Product Type Analysis, 2016-2032
- 5.3.1. Western Europe Snack Bars Market Analysis by Product Type Analysis: Introduction
- 5.3.2. Market Size Absolute $ Opportunity Analysis and Forecast, By Product Type Analysis, 2016-2032
- 5.3.3. Granola Bars
- 5.3.4. Protein Bars
- 5.3.5. Nut Bars
- 5.3.6. Fruit Bars
- 5.3.7. Energy Bars
- 5.4. Western Europe Snack Bars Market Analysis, Opportunity and Forecast, By Distribution Channel Analysis, 2016-2032
- 5.4.1. Western Europe Snack Bars Market Analysis by Distribution Channel Analysis: Introduction
- 5.4.2. Market Size Absolute $ Opportunity Analysis and Forecast, By Distribution Channel Analysis, 2016-2032
- 5.4.3. Supermarkets and Hypermarkets
- 5.4.4. Convenience Stores
- 5.4.5. Health Food Stores
- 5.4.6. Online Retailers
- 5.4.7. Specialty Stores
- 5.5. Western Europe Snack Bars Market Analysis, Opportunity and Forecast, By Ingredients Analysis, 2016-2032
- 5.5.1. Western Europe Snack Bars Market Analysis by Ingredients Analysis: Introduction
- 5.5.2. Market Size Absolute $ Opportunity Analysis and Forecast, By Ingredients Analysis, 2016-2032
- 5.5.3. Chocolate (dark, milk, or white)
- 5.5.4. Nuts (such as almonds, peanuts, cashews)
- 5.5.5. Seeds (such as chia seeds, flaxseeds, pumpkin seeds)
- 5.5.6. Dried Fruits (such as dates, raisins, cranberries)
- 5.5.7. Protein Sources (such as whey protein, plant-based proteins)
- 5.6. Western Europe Snack Bars Market Analysis, Opportunity and Forecast, By Country , 2016-2032
- 5.6.1. Western Europe Snack Bars Market Analysis by Country : Introduction
- 5.6.2. Market Size Absolute $ Opportunity Analysis and Forecast, Country , 2016-2032
- 5.6.2.1. Germany
- 5.6.2.2. France
- 5.6.2.3. The UK
- 5.6.2.4. Spain
- 5.6.2.5. Italy
- 5.6.2.6. Portugal
- 5.6.2.7. Ireland
- 5.6.2.8. Austria
- 5.6.2.9. Switzerland
- 5.6.2.10. Benelux
- 5.6.2.11. Nordic
- 5.6.2.12. Rest of Western Europe
- 6. Eastern Europe Snack Bars Market Analysis, Opportunity and Forecast, 2016-2032
- 6.1. Eastern Europe Snack Bars Market Analysis, 2016-2021
- 6.2. Eastern Europe Snack Bars Market Opportunity and Forecast, 2023-2032
- 6.3. Eastern Europe Snack Bars Market Analysis, Opportunity and Forecast, By Product Type Analysis, 2016-2032
- 6.3.1. Eastern Europe Snack Bars Market Analysis by Product Type Analysis: Introduction
- 6.3.2. Market Size Absolute $ Opportunity Analysis and Forecast, By Product Type Analysis, 2016-2032
- 6.3.3. Granola Bars
- 6.3.4. Protein Bars
- 6.3.5. Nut Bars
- 6.3.6. Fruit Bars
- 6.3.7. Energy Bars
- 6.4. Eastern Europe Snack Bars Market Analysis, Opportunity and Forecast, By Distribution Channel Analysis, 2016-2032
- 6.4.1. Eastern Europe Snack Bars Market Analysis by Distribution Channel Analysis: Introduction
- 6.4.2. Market Size Absolute $ Opportunity Analysis and Forecast, By Distribution Channel Analysis, 2016-2032
- 6.4.3. Supermarkets and Hypermarkets
- 6.4.4. Convenience Stores
- 6.4.5. Health Food Stores
- 6.4.6. Online Retailers
- 6.4.7. Specialty Stores
- 6.5. Eastern Europe Snack Bars Market Analysis, Opportunity and Forecast, By Ingredients Analysis, 2016-2032
- 6.5.1. Eastern Europe Snack Bars Market Analysis by Ingredients Analysis: Introduction
- 6.5.2. Market Size Absolute $ Opportunity Analysis and Forecast, By Ingredients Analysis, 2016-2032
- 6.5.3. Chocolate (dark, milk, or white)
- 6.5.4. Nuts (such as almonds, peanuts, cashews)
- 6.5.5. Seeds (such as chia seeds, flaxseeds, pumpkin seeds)
- 6.5.6. Dried Fruits (such as dates, raisins, cranberries)
- 6.5.7. Protein Sources (such as whey protein, plant-based proteins)
- 6.6. Eastern Europe Snack Bars Market Analysis, Opportunity and Forecast, By Country , 2016-2032
- 6.6.1. Eastern Europe Snack Bars Market Analysis by Country : Introduction
- 6.6.2. Market Size Absolute $ Opportunity Analysis and Forecast, Country , 2016-2032
- 6.6.2.1. Russia
- 6.6.2.2. Poland
- 6.6.2.3. The Czech Republic
- 6.6.2.4. Greece
- 6.6.2.5. Rest of Eastern Europe
- 7. APAC Snack Bars Market Analysis, Opportunity and Forecast, 2016-2032
- 7.1. APAC Snack Bars Market Analysis, 2016-2021
- 7.2. APAC Snack Bars Market Opportunity and Forecast, 2023-2032
- 7.3. APAC Snack Bars Market Analysis, Opportunity and Forecast, By Product Type Analysis, 2016-2032
- 7.3.1. APAC Snack Bars Market Analysis by Product Type Analysis: Introduction
- 7.3.2. Market Size Absolute $ Opportunity Analysis and Forecast, By Product Type Analysis, 2016-2032
- 7.3.3. Granola Bars
- 7.3.4. Protein Bars
- 7.3.5. Nut Bars
- 7.3.6. Fruit Bars
- 7.3.7. Energy Bars
- 7.4. APAC Snack Bars Market Analysis, Opportunity and Forecast, By Distribution Channel Analysis, 2016-2032
- 7.4.1. APAC Snack Bars Market Analysis by Distribution Channel Analysis: Introduction
- 7.4.2. Market Size Absolute $ Opportunity Analysis and Forecast, By Distribution Channel Analysis, 2016-2032
- 7.4.3. Supermarkets and Hypermarkets
- 7.4.4. Convenience Stores
- 7.4.5. Health Food Stores
- 7.4.6. Online Retailers
- 7.4.7. Specialty Stores
- 7.5. APAC Snack Bars Market Analysis, Opportunity and Forecast, By Ingredients Analysis, 2016-2032
- 7.5.1. APAC Snack Bars Market Analysis by Ingredients Analysis: Introduction
- 7.5.2. Market Size Absolute $ Opportunity Analysis and Forecast, By Ingredients Analysis, 2016-2032
- 7.5.3. Chocolate (dark, milk, or white)
- 7.5.4. Nuts (such as almonds, peanuts, cashews)
- 7.5.5. Seeds (such as chia seeds, flaxseeds, pumpkin seeds)
- 7.5.6. Dried Fruits (such as dates, raisins, cranberries)
- 7.5.7. Protein Sources (such as whey protein, plant-based proteins)
- 7.6. APAC Snack Bars Market Analysis, Opportunity and Forecast, By Country , 2016-2032
- 7.6.1. APAC Snack Bars Market Analysis by Country : Introduction
- 7.6.2. Market Size Absolute $ Opportunity Analysis and Forecast, Country , 2016-2032
- 7.6.2.1. China
- 7.6.2.2. Japan
- 7.6.2.3. South Korea
- 7.6.2.4. India
- 7.6.2.5. Australia & New Zeland
- 7.6.2.6. Indonesia
- 7.6.2.7. Malaysia
- 7.6.2.8. Philippines
- 7.6.2.9. Singapore
- 7.6.2.10. Thailand
- 7.6.2.11. Vietnam
- 7.6.2.12. Rest of APAC
- 8. Latin America Snack Bars Market Analysis, Opportunity and Forecast, 2016-2032
- 8.1. Latin America Snack Bars Market Analysis, 2016-2021
- 8.2. Latin America Snack Bars Market Opportunity and Forecast, 2023-2032
- 8.3. Latin America Snack Bars Market Analysis, Opportunity and Forecast, By Product Type Analysis, 2016-2032
- 8.3.1. Latin America Snack Bars Market Analysis by Product Type Analysis: Introduction
- 8.3.2. Market Size Absolute $ Opportunity Analysis and Forecast, By Product Type Analysis, 2016-2032
- 8.3.3. Granola Bars
- 8.3.4. Protein Bars
- 8.3.5. Nut Bars
- 8.3.6. Fruit Bars
- 8.3.7. Energy Bars
- 8.4. Latin America Snack Bars Market Analysis, Opportunity and Forecast, By Distribution Channel Analysis, 2016-2032
- 8.4.1. Latin America Snack Bars Market Analysis by Distribution Channel Analysis: Introduction
- 8.4.2. Market Size Absolute $ Opportunity Analysis and Forecast, By Distribution Channel Analysis, 2016-2032
- 8.4.3. Supermarkets and Hypermarkets
- 8.4.4. Convenience Stores
- 8.4.5. Health Food Stores
- 8.4.6. Online Retailers
- 8.4.7. Specialty Stores
- 8.5. Latin America Snack Bars Market Analysis, Opportunity and Forecast, By Ingredients Analysis, 2016-2032
- 8.5.1. Latin America Snack Bars Market Analysis by Ingredients Analysis: Introduction
- 8.5.2. Market Size Absolute $ Opportunity Analysis and Forecast, By Ingredients Analysis, 2016-2032
- 8.5.3. Chocolate (dark, milk, or white)
- 8.5.4. Nuts (such as almonds, peanuts, cashews)
- 8.5.5. Seeds (such as chia seeds, flaxseeds, pumpkin seeds)
- 8.5.6. Dried Fruits (such as dates, raisins, cranberries)
- 8.5.7. Protein Sources (such as whey protein, plant-based proteins)
- 8.6. Latin America Snack Bars Market Analysis, Opportunity and Forecast, By Country , 2016-2032
- 8.6.1. Latin America Snack Bars Market Analysis by Country : Introduction
- 8.6.2. Market Size Absolute $ Opportunity Analysis and Forecast, Country , 2016-2032
- 8.6.2.1. Brazil
- 8.6.2.2. Colombia
- 8.6.2.3. Chile
- 8.6.2.4. Argentina
- 8.6.2.5. Costa Rica
- 8.6.2.6. Rest of Latin America
- 9. Middle East & Africa Snack Bars Market Analysis, Opportunity and Forecast, 2016-2032
- 9.1. Middle East & Africa Snack Bars Market Analysis, 2016-2021
- 9.2. Middle East & Africa Snack Bars Market Opportunity and Forecast, 2023-2032
- 9.3. Middle East & Africa Snack Bars Market Analysis, Opportunity and Forecast, By Product Type Analysis, 2016-2032
- 9.3.1. Middle East & Africa Snack Bars Market Analysis by Product Type Analysis: Introduction
- 9.3.2. Market Size Absolute $ Opportunity Analysis and Forecast, By Product Type Analysis, 2016-2032
- 9.3.3. Granola Bars
- 9.3.4. Protein Bars
- 9.3.5. Nut Bars
- 9.3.6. Fruit Bars
- 9.3.7. Energy Bars
- 9.4. Middle East & Africa Snack Bars Market Analysis, Opportunity and Forecast, By Distribution Channel Analysis, 2016-2032
- 9.4.1. Middle East & Africa Snack Bars Market Analysis by Distribution Channel Analysis: Introduction
- 9.4.2. Market Size Absolute $ Opportunity Analysis and Forecast, By Distribution Channel Analysis, 2016-2032
- 9.4.3. Supermarkets and Hypermarkets
- 9.4.4. Convenience Stores
- 9.4.5. Health Food Stores
- 9.4.6. Online Retailers
- 9.4.7. Specialty Stores
- 9.5. Middle East & Africa Snack Bars Market Analysis, Opportunity and Forecast, By Ingredients Analysis, 2016-2032
- 9.5.1. Middle East & Africa Snack Bars Market Analysis by Ingredients Analysis: Introduction
- 9.5.2. Market Size Absolute $ Opportunity Analysis and Forecast, By Ingredients Analysis, 2016-2032
- 9.5.3. Chocolate (dark, milk, or white)
- 9.5.4. Nuts (such as almonds, peanuts, cashews)
- 9.5.5. Seeds (such as chia seeds, flaxseeds, pumpkin seeds)
- 9.5.6. Dried Fruits (such as dates, raisins, cranberries)
- 9.5.7. Protein Sources (such as whey protein, plant-based proteins)
- 9.6. Middle East & Africa Snack Bars Market Analysis, Opportunity and Forecast, By Country , 2016-2032
- 9.6.1. Middle East & Africa Snack Bars Market Analysis by Country : Introduction
- 9.6.2. Market Size Absolute $ Opportunity Analysis and Forecast, Country , 2016-2032
- 9.6.2.1. Algeria
- 9.6.2.2. Egypt
- 9.6.2.3. Israel
- 9.6.2.4. Kuwait
- 9.6.2.5. Nigeria
- 9.6.2.6. Saudi Arabia
- 9.6.2.7. South Africa
- 9.6.2.8. Turkey
- 9.6.2.9. The UAE
- 9.6.2.10. Rest of MEA
- 10. Global Snack Bars Market Analysis, Opportunity and Forecast, By Region , 2016-2032
- 10.1. Global Snack Bars Market Analysis by Region : Introduction
- 10.2. Market Size Absolute $ Opportunity Analysis and Forecast, By Region , 2016-2032
- 10.2.1. North America
- 10.2.2. Western Europe
- 10.2.3. Eastern Europe
- 10.2.4. APAC
- 10.2.5. Latin America
- 10.2.6. Middle East & Africa
- 11. Global Snack Bars Market Competitive Landscape, Market Share Analysis, and Company Profiles
- 11.1. Market Share Analysis
- 11.2. Company Profiles
- 11.3. General Mills Inc.
- 11.3.1. Company Overview
- 11.3.2. Financial Highlights
- 11.3.3. Product Portfolio
- 11.3.4. SWOT Analysis
- 11.3.5. Key Strategies and Developments
- 11.4. Kellogg Company
- 11.4.1. Company Overview
- 11.4.2. Financial Highlights
- 11.4.3. Product Portfolio
- 11.4.4. SWOT Analysis
- 11.4.5. Key Strategies and Developments
- 11.5. The Quaker Oats Company
- 11.5.1. Company Overview
- 11.5.2. Financial Highlights
- 11.5.3. Product Portfolio
- 11.5.4. SWOT Analysis
- 11.5.5. Key Strategies and Developments
- 11.6. KIND LLC
- 11.6.1. Company Overview
- 11.6.2. Financial Highlights
- 11.6.3. Product Portfolio
- 11.6.4. SWOT Analysis
- 11.6.5. Key Strategies and Developments
- 11.7. Clif Bar & Company
- 11.7.1. Company Overview
- 11.7.2. Financial Highlights
- 11.7.3. Product Portfolio
- 11.7.4. SWOT Analysis
- 11.7.5. Key Strategies and Developments
- 11.8. Atkins Nutritionals, Inc.
- 11.8.1. Company Overview
- 11.8.2. Financial Highlights
- 11.8.3. Product Portfolio
- 11.8.4. SWOT Analysis
- 11.8.5. Key Strategies and Developments
- 11.9. Earnest Eats
- 11.9.1. Company Overview
- 11.9.2. Financial Highlights
- 11.9.3. Product Portfolio
- 11.9.4. SWOT Analysis
- 11.9.5. Key Strategies and Developments
- 11.10. Mars, Incorporated
- 11.10.1. Company Overview
- 11.10.2. Financial Highlights
- 11.10.3. Product Portfolio
- 11.10.4. SWOT Analysis
- 11.10.5. Key Strategies and Developments
- 11.11. Healthy Food Ingredients, LLC
- 11.11.1. Company Overview
- 11.11.2. Financial Highlights
- 11.11.3. Product Portfolio
- 11.11.4. SWOT Analysis
- 11.11.5. Key Strategies and Developments
- 11.12. Quest Nutrition LLC
- 11.12.1. Company Overview
- 11.12.2. Financial Highlights
- 11.12.3. Product Portfolio
- 11.12.4. SWOT Analysis
- 11.12.5. Key Strategies and Developments
- 12. Assumptions and Acronyms
- 13. Research Methodology
- 14. Contact
- List of Figures
- Figure 1: Global Snack Bars Market Revenue (US$ Mn) Market Share by Product Type Analysis in 2022
- Figure 2: Global Snack Bars Market Attractiveness Analysis by Product Type Analysis, 2016-2032
- Figure 3: Global Snack Bars Market Revenue (US$ Mn) Market Share by Distribution Channel Analysisin 2022
- Figure 4: Global Snack Bars Market Attractiveness Analysis by Distribution Channel Analysis, 2016-2032
- Figure 5: Global Snack Bars Market Revenue (US$ Mn) Market Share by Ingredients Analysisin 2022
- Figure 6: Global Snack Bars Market Attractiveness Analysis by Ingredients Analysis, 2016-2032
- Figure 7: Global Snack Bars Market Revenue (US$ Mn) Market Share by Region in 2022
- Figure 8: Global Snack Bars Market Attractiveness Analysis by Region, 2016-2032
- Figure 9: Global Snack Bars Market Revenue (US$ Mn) (2016-2032)
- Figure 10: Global Snack Bars Market Revenue (US$ Mn) Comparison by Region (2016-2032)
- Figure 11: Global Snack Bars Market Revenue (US$ Mn) Comparison by Product Type Analysis (2016-2032)
- Figure 12: Global Snack Bars Market Revenue (US$ Mn) Comparison by Distribution Channel Analysis (2016-2032)
- Figure 13: Global Snack Bars Market Revenue (US$ Mn) Comparison by Ingredients Analysis (2016-2032)
- Figure 14: Global Snack Bars Market Y-o-Y Growth Rate Comparison by Region (2016-2032)
- Figure 15: Global Snack Bars Market Y-o-Y Growth Rate Comparison by Product Type Analysis (2016-2032)
- Figure 16: Global Snack Bars Market Y-o-Y Growth Rate Comparison by Distribution Channel Analysis (2016-2032)
- Figure 17: Global Snack Bars Market Y-o-Y Growth Rate Comparison by Ingredients Analysis (2016-2032)
- Figure 18: Global Snack Bars Market Share Comparison by Region (2016-2032)
- Figure 19: Global Snack Bars Market Share Comparison by Product Type Analysis (2016-2032)
- Figure 20: Global Snack Bars Market Share Comparison by Distribution Channel Analysis (2016-2032)
- Figure 21: Global Snack Bars Market Share Comparison by Ingredients Analysis (2016-2032)
- Figure 22: North America Snack Bars Market Revenue (US$ Mn) Market Share by Product Type Analysisin 2022
- Figure 23: North America Snack Bars Market Attractiveness Analysis by Product Type Analysis, 2016-2032
- Figure 24: North America Snack Bars Market Revenue (US$ Mn) Market Share by Distribution Channel Analysisin 2022
- Figure 25: North America Snack Bars Market Attractiveness Analysis by Distribution Channel Analysis, 2016-2032
- Figure 26: North America Snack Bars Market Revenue (US$ Mn) Market Share by Ingredients Analysisin 2022
- Figure 27: North America Snack Bars Market Attractiveness Analysis by Ingredients Analysis, 2016-2032
- Figure 28: North America Snack Bars Market Revenue (US$ Mn) Market Share by Country in 2022
- Figure 29: North America Snack Bars Market Attractiveness Analysis by Country, 2016-2032
- Figure 30: North America Snack Bars Market Revenue (US$ Mn) (2016-2032)
- Figure 31: North America Snack Bars Market Revenue (US$ Mn) Comparison by Country (2016-2032)
- Figure 32: North America Snack Bars Market Revenue (US$ Mn) Comparison by Product Type Analysis (2016-2032)
- Figure 33: North America Snack Bars Market Revenue (US$ Mn) Comparison by Distribution Channel Analysis (2016-2032)
- Figure 34: North America Snack Bars Market Revenue (US$ Mn) Comparison by Ingredients Analysis (2016-2032)
- Figure 35: North America Snack Bars Market Y-o-Y Growth Rate Comparison by Country (2016-2032)
- Figure 36: North America Snack Bars Market Y-o-Y Growth Rate Comparison by Product Type Analysis (2016-2032)
- Figure 37: North America Snack Bars Market Y-o-Y Growth Rate Comparison by Distribution Channel Analysis (2016-2032)
- Figure 38: North America Snack Bars Market Y-o-Y Growth Rate Comparison by Ingredients Analysis (2016-2032)
- Figure 39: North America Snack Bars Market Share Comparison by Country (2016-2032)
- Figure 40: North America Snack Bars Market Share Comparison by Product Type Analysis (2016-2032)
- Figure 41: North America Snack Bars Market Share Comparison by Distribution Channel Analysis (2016-2032)
- Figure 42: North America Snack Bars Market Share Comparison by Ingredients Analysis (2016-2032)
- Figure 43: Western Europe Snack Bars Market Revenue (US$ Mn) Market Share by Product Type Analysisin 2022
- Figure 44: Western Europe Snack Bars Market Attractiveness Analysis by Product Type Analysis, 2016-2032
- Figure 45: Western Europe Snack Bars Market Revenue (US$ Mn) Market Share by Distribution Channel Analysisin 2022
- Figure 46: Western Europe Snack Bars Market Attractiveness Analysis by Distribution Channel Analysis, 2016-2032
- Figure 47: Western Europe Snack Bars Market Revenue (US$ Mn) Market Share by Ingredients Analysisin 2022
- Figure 48: Western Europe Snack Bars Market Attractiveness Analysis by Ingredients Analysis, 2016-2032
- Figure 49: Western Europe Snack Bars Market Revenue (US$ Mn) Market Share by Country in 2022
- Figure 50: Western Europe Snack Bars Market Attractiveness Analysis by Country, 2016-2032
- Figure 51: Western Europe Snack Bars Market Revenue (US$ Mn) (2016-2032)
- Figure 52: Western Europe Snack Bars Market Revenue (US$ Mn) Comparison by Country (2016-2032)
- Figure 53: Western Europe Snack Bars Market Revenue (US$ Mn) Comparison by Product Type Analysis (2016-2032)
- Figure 54: Western Europe Snack Bars Market Revenue (US$ Mn) Comparison by Distribution Channel Analysis (2016-2032)
- Figure 55: Western Europe Snack Bars Market Revenue (US$ Mn) Comparison by Ingredients Analysis (2016-2032)
- Figure 56: Western Europe Snack Bars Market Y-o-Y Growth Rate Comparison by Country (2016-2032)
- Figure 57: Western Europe Snack Bars Market Y-o-Y Growth Rate Comparison by Product Type Analysis (2016-2032)
- Figure 58: Western Europe Snack Bars Market Y-o-Y Growth Rate Comparison by Distribution Channel Analysis (2016-2032)
- Figure 59: Western Europe Snack Bars Market Y-o-Y Growth Rate Comparison by Ingredients Analysis (2016-2032)
- Figure 60: Western Europe Snack Bars Market Share Comparison by Country (2016-2032)
- Figure 61: Western Europe Snack Bars Market Share Comparison by Product Type Analysis (2016-2032)
- Figure 62: Western Europe Snack Bars Market Share Comparison by Distribution Channel Analysis (2016-2032)
- Figure 63: Western Europe Snack Bars Market Share Comparison by Ingredients Analysis (2016-2032)
- Figure 64: Eastern Europe Snack Bars Market Revenue (US$ Mn) Market Share by Product Type Analysisin 2022
- Figure 65: Eastern Europe Snack Bars Market Attractiveness Analysis by Product Type Analysis, 2016-2032
- Figure 66: Eastern Europe Snack Bars Market Revenue (US$ Mn) Market Share by Distribution Channel Analysisin 2022
- Figure 67: Eastern Europe Snack Bars Market Attractiveness Analysis by Distribution Channel Analysis, 2016-2032
- Figure 68: Eastern Europe Snack Bars Market Revenue (US$ Mn) Market Share by Ingredients Analysisin 2022
- Figure 69: Eastern Europe Snack Bars Market Attractiveness Analysis by Ingredients Analysis, 2016-2032
- Figure 70: Eastern Europe Snack Bars Market Revenue (US$ Mn) Market Share by Country in 2022
- Figure 71: Eastern Europe Snack Bars Market Attractiveness Analysis by Country, 2016-2032
- Figure 72: Eastern Europe Snack Bars Market Revenue (US$ Mn) (2016-2032)
- Figure 73: Eastern Europe Snack Bars Market Revenue (US$ Mn) Comparison by Country (2016-2032)
- Figure 74: Eastern Europe Snack Bars Market Revenue (US$ Mn) Comparison by Product Type Analysis (2016-2032)
- Figure 75: Eastern Europe Snack Bars Market Revenue (US$ Mn) Comparison by Distribution Channel Analysis (2016-2032)
- Figure 76: Eastern Europe Snack Bars Market Revenue (US$ Mn) Comparison by Ingredients Analysis (2016-2032)
- Figure 77: Eastern Europe Snack Bars Market Y-o-Y Growth Rate Comparison by Country (2016-2032)
- Figure 78: Eastern Europe Snack Bars Market Y-o-Y Growth Rate Comparison by Product Type Analysis (2016-2032)
- Figure 79: Eastern Europe Snack Bars Market Y-o-Y Growth Rate Comparison by Distribution Channel Analysis (2016-2032)
- Figure 80: Eastern Europe Snack Bars Market Y-o-Y Growth Rate Comparison by Ingredients Analysis (2016-2032)
- Figure 81: Eastern Europe Snack Bars Market Share Comparison by Country (2016-2032)
- Figure 82: Eastern Europe Snack Bars Market Share Comparison by Product Type Analysis (2016-2032)
- Figure 83: Eastern Europe Snack Bars Market Share Comparison by Distribution Channel Analysis (2016-2032)
- Figure 84: Eastern Europe Snack Bars Market Share Comparison by Ingredients Analysis (2016-2032)
- Figure 85: APAC Snack Bars Market Revenue (US$ Mn) Market Share by Product Type Analysisin 2022
- Figure 86: APAC Snack Bars Market Attractiveness Analysis by Product Type Analysis, 2016-2032
- Figure 87: APAC Snack Bars Market Revenue (US$ Mn) Market Share by Distribution Channel Analysisin 2022
- Figure 88: APAC Snack Bars Market Attractiveness Analysis by Distribution Channel Analysis, 2016-2032
- Figure 89: APAC Snack Bars Market Revenue (US$ Mn) Market Share by Ingredients Analysisin 2022
- Figure 90: APAC Snack Bars Market Attractiveness Analysis by Ingredients Analysis, 2016-2032
- Figure 91: APAC Snack Bars Market Revenue (US$ Mn) Market Share by Country in 2022
- Figure 92: APAC Snack Bars Market Attractiveness Analysis by Country, 2016-2032
- Figure 93: APAC Snack Bars Market Revenue (US$ Mn) (2016-2032)
- Figure 94: APAC Snack Bars Market Revenue (US$ Mn) Comparison by Country (2016-2032)
- Figure 95: APAC Snack Bars Market Revenue (US$ Mn) Comparison by Product Type Analysis (2016-2032)
- Figure 96: APAC Snack Bars Market Revenue (US$ Mn) Comparison by Distribution Channel Analysis (2016-2032)
- Figure 97: APAC Snack Bars Market Revenue (US$ Mn) Comparison by Ingredients Analysis (2016-2032)
- Figure 98: APAC Snack Bars Market Y-o-Y Growth Rate Comparison by Country (2016-2032)
- Figure 99: APAC Snack Bars Market Y-o-Y Growth Rate Comparison by Product Type Analysis (2016-2032)
- Figure 100: APAC Snack Bars Market Y-o-Y Growth Rate Comparison by Distribution Channel Analysis (2016-2032)
- Figure 101: APAC Snack Bars Market Y-o-Y Growth Rate Comparison by Ingredients Analysis (2016-2032)
- Figure 102: APAC Snack Bars Market Share Comparison by Country (2016-2032)
- Figure 103: APAC Snack Bars Market Share Comparison by Product Type Analysis (2016-2032)
- Figure 104: APAC Snack Bars Market Share Comparison by Distribution Channel Analysis (2016-2032)
- Figure 105: APAC Snack Bars Market Share Comparison by Ingredients Analysis (2016-2032)
- Figure 106: Latin America Snack Bars Market Revenue (US$ Mn) Market Share by Product Type Analysisin 2022
- Figure 107: Latin America Snack Bars Market Attractiveness Analysis by Product Type Analysis, 2016-2032
- Figure 108: Latin America Snack Bars Market Revenue (US$ Mn) Market Share by Distribution Channel Analysisin 2022
- Figure 109: Latin America Snack Bars Market Attractiveness Analysis by Distribution Channel Analysis, 2016-2032
- Figure 110: Latin America Snack Bars Market Revenue (US$ Mn) Market Share by Ingredients Analysisin 2022
- Figure 111: Latin America Snack Bars Market Attractiveness Analysis by Ingredients Analysis, 2016-2032
- Figure 112: Latin America Snack Bars Market Revenue (US$ Mn) Market Share by Country in 2022
- Figure 113: Latin America Snack Bars Market Attractiveness Analysis by Country, 2016-2032
- Figure 114: Latin America Snack Bars Market Revenue (US$ Mn) (2016-2032)
- Figure 115: Latin America Snack Bars Market Revenue (US$ Mn) Comparison by Country (2016-2032)
- Figure 116: Latin America Snack Bars Market Revenue (US$ Mn) Comparison by Product Type Analysis (2016-2032)
- Figure 117: Latin America Snack Bars Market Revenue (US$ Mn) Comparison by Distribution Channel Analysis (2016-2032)
- Figure 118: Latin America Snack Bars Market Revenue (US$ Mn) Comparison by Ingredients Analysis (2016-2032)
- Figure 119: Latin America Snack Bars Market Y-o-Y Growth Rate Comparison by Country (2016-2032)
- Figure 120: Latin America Snack Bars Market Y-o-Y Growth Rate Comparison by Product Type Analysis (2016-2032)
- Figure 121: Latin America Snack Bars Market Y-o-Y Growth Rate Comparison by Distribution Channel Analysis (2016-2032)
- Figure 122: Latin America Snack Bars Market Y-o-Y Growth Rate Comparison by Ingredients Analysis (2016-2032)
- Figure 123: Latin America Snack Bars Market Share Comparison by Country (2016-2032)
- Figure 124: Latin America Snack Bars Market Share Comparison by Product Type Analysis (2016-2032)
- Figure 125: Latin America Snack Bars Market Share Comparison by Distribution Channel Analysis (2016-2032)
- Figure 126: Latin America Snack Bars Market Share Comparison by Ingredients Analysis (2016-2032)
- Figure 127: Middle East & Africa Snack Bars Market Revenue (US$ Mn) Market Share by Product Type Analysisin 2022
- Figure 128: Middle East & Africa Snack Bars Market Attractiveness Analysis by Product Type Analysis, 2016-2032
- Figure 129: Middle East & Africa Snack Bars Market Revenue (US$ Mn) Market Share by Distribution Channel Analysisin 2022
- Figure 130: Middle East & Africa Snack Bars Market Attractiveness Analysis by Distribution Channel Analysis, 2016-2032
- Figure 131: Middle East & Africa Snack Bars Market Revenue (US$ Mn) Market Share by Ingredients Analysisin 2022
- Figure 132: Middle East & Africa Snack Bars Market Attractiveness Analysis by Ingredients Analysis, 2016-2032
- Figure 133: Middle East & Africa Snack Bars Market Revenue (US$ Mn) Market Share by Country in 2022
- Figure 134: Middle East & Africa Snack Bars Market Attractiveness Analysis by Country, 2016-2032
- Figure 135: Middle East & Africa Snack Bars Market Revenue (US$ Mn) (2016-2032)
- Figure 136: Middle East & Africa Snack Bars Market Revenue (US$ Mn) Comparison by Country (2016-2032)
- Figure 137: Middle East & Africa Snack Bars Market Revenue (US$ Mn) Comparison by Product Type Analysis (2016-2032)
- Figure 138: Middle East & Africa Snack Bars Market Revenue (US$ Mn) Comparison by Distribution Channel Analysis (2016-2032)
- Figure 139: Middle East & Africa Snack Bars Market Revenue (US$ Mn) Comparison by Ingredients Analysis (2016-2032)
- Figure 140: Middle East & Africa Snack Bars Market Y-o-Y Growth Rate Comparison by Country (2016-2032)
- Figure 141: Middle East & Africa Snack Bars Market Y-o-Y Growth Rate Comparison by Product Type Analysis (2016-2032)
- Figure 142: Middle East & Africa Snack Bars Market Y-o-Y Growth Rate Comparison by Distribution Channel Analysis (2016-2032)
- Figure 143: Middle East & Africa Snack Bars Market Y-o-Y Growth Rate Comparison by Ingredients Analysis (2016-2032)
- Figure 144: Middle East & Africa Snack Bars Market Share Comparison by Country (2016-2032)
- Figure 145: Middle East & Africa Snack Bars Market Share Comparison by Product Type Analysis (2016-2032)
- Figure 146: Middle East & Africa Snack Bars Market Share Comparison by Distribution Channel Analysis (2016-2032)
- Figure 147: Middle East & Africa Snack Bars Market Share Comparison by Ingredients Analysis (2016-2032)
List of Tables
- Table 1: Global Snack Bars Market Comparison by Product Type Analysis (2016-2032)
- Table 2: Global Snack Bars Market Comparison by Distribution Channel Analysis (2016-2032)
- Table 3: Global Snack Bars Market Comparison by Ingredients Analysis (2016-2032)
- Table 4: Global Snack Bars Market Revenue (US$ Mn) Comparison by Region (2016-2032)
- Table 5: Global Snack Bars Market Revenue (US$ Mn) (2016-2032)
- Table 6: Global Snack Bars Market Revenue (US$ Mn) Comparison by Region (2016-2032)
- Table 7: Global Snack Bars Market Revenue (US$ Mn) Comparison by Product Type Analysis (2016-2032)
- Table 8: Global Snack Bars Market Revenue (US$ Mn) Comparison by Distribution Channel Analysis (2016-2032)
- Table 9: Global Snack Bars Market Revenue (US$ Mn) Comparison by Ingredients Analysis (2016-2032)
- Table 10: Global Snack Bars Market Y-o-Y Growth Rate Comparison by Region (2016-2032)
- Table 11: Global Snack Bars Market Y-o-Y Growth Rate Comparison by Product Type Analysis (2016-2032)
- Table 12: Global Snack Bars Market Y-o-Y Growth Rate Comparison by Distribution Channel Analysis (2016-2032)
- Table 13: Global Snack Bars Market Y-o-Y Growth Rate Comparison by Ingredients Analysis (2016-2032)
- Table 14: Global Snack Bars Market Share Comparison by Region (2016-2032)
- Table 15: Global Snack Bars Market Share Comparison by Product Type Analysis (2016-2032)
- Table 16: Global Snack Bars Market Share Comparison by Distribution Channel Analysis (2016-2032)
- Table 17: Global Snack Bars Market Share Comparison by Ingredients Analysis (2016-2032)
- Table 18: North America Snack Bars Market Comparison by Distribution Channel Analysis (2016-2032)
- Table 19: North America Snack Bars Market Comparison by Ingredients Analysis (2016-2032)
- Table 20: North America Snack Bars Market Revenue (US$ Mn) Comparison by Country (2016-2032)
- Table 21: North America Snack Bars Market Revenue (US$ Mn) (2016-2032)
- Table 22: North America Snack Bars Market Revenue (US$ Mn) Comparison by Country (2016-2032)
- Table 23: North America Snack Bars Market Revenue (US$ Mn) Comparison by Product Type Analysis (2016-2032)
- Table 24: North America Snack Bars Market Revenue (US$ Mn) Comparison by Distribution Channel Analysis (2016-2032)
- Table 25: North America Snack Bars Market Revenue (US$ Mn) Comparison by Ingredients Analysis (2016-2032)
- Table 26: North America Snack Bars Market Y-o-Y Growth Rate Comparison by Country (2016-2032)
- Table 27: North America Snack Bars Market Y-o-Y Growth Rate Comparison by Product Type Analysis (2016-2032)
- Table 28: North America Snack Bars Market Y-o-Y Growth Rate Comparison by Distribution Channel Analysis (2016-2032)
- Table 29: North America Snack Bars Market Y-o-Y Growth Rate Comparison by Ingredients Analysis (2016-2032)
- Table 30: North America Snack Bars Market Share Comparison by Country (2016-2032)
- Table 31: North America Snack Bars Market Share Comparison by Product Type Analysis (2016-2032)
- Table 32: North America Snack Bars Market Share Comparison by Distribution Channel Analysis (2016-2032)
- Table 33: North America Snack Bars Market Share Comparison by Ingredients Analysis (2016-2032)
- Table 34: Western Europe Snack Bars Market Comparison by Product Type Analysis (2016-2032)
- Table 35: Western Europe Snack Bars Market Comparison by Distribution Channel Analysis (2016-2032)
- Table 36: Western Europe Snack Bars Market Comparison by Ingredients Analysis (2016-2032)
- Table 37: Western Europe Snack Bars Market Revenue (US$ Mn) Comparison by Country (2016-2032)
- Table 38: Western Europe Snack Bars Market Revenue (US$ Mn) (2016-2032)
- Table 39: Western Europe Snack Bars Market Revenue (US$ Mn) Comparison by Country (2016-2032)
- Table 40: Western Europe Snack Bars Market Revenue (US$ Mn) Comparison by Product Type Analysis (2016-2032)
- Table 41: Western Europe Snack Bars Market Revenue (US$ Mn) Comparison by Distribution Channel Analysis (2016-2032)
- Table 42: Western Europe Snack Bars Market Revenue (US$ Mn) Comparison by Ingredients Analysis (2016-2032)
- Table 43: Western Europe Snack Bars Market Y-o-Y Growth Rate Comparison by Country (2016-2032)
- Table 44: Western Europe Snack Bars Market Y-o-Y Growth Rate Comparison by Product Type Analysis (2016-2032)
- Table 45: Western Europe Snack Bars Market Y-o-Y Growth Rate Comparison by Distribution Channel Analysis (2016-2032)
- Table 46: Western Europe Snack Bars Market Y-o-Y Growth Rate Comparison by Ingredients Analysis (2016-2032)
- Table 47: Western Europe Snack Bars Market Share Comparison by Country (2016-2032)
- Table 48: Western Europe Snack Bars Market Share Comparison by Product Type Analysis (2016-2032)
- Table 49: Western Europe Snack Bars Market Share Comparison by Distribution Channel Analysis (2016-2032)
- Table 50: Western Europe Snack Bars Market Share Comparison by Ingredients Analysis (2016-2032)
- Table 51: Eastern Europe Snack Bars Market Comparison by Product Type Analysis (2016-2032)
- Table 52: Eastern Europe Snack Bars Market Comparison by Distribution Channel Analysis (2016-2032)
- Table 53: Eastern Europe Snack Bars Market Comparison by Ingredients Analysis (2016-2032)
- Table 54: Eastern Europe Snack Bars Market Revenue (US$ Mn) Comparison by Country (2016-2032)
- Table 55: Eastern Europe Snack Bars Market Revenue (US$ Mn) (2016-2032)
- Table 56: Eastern Europe Snack Bars Market Revenue (US$ Mn) Comparison by Country (2016-2032)
- Table 57: Eastern Europe Snack Bars Market Revenue (US$ Mn) Comparison by Product Type Analysis (2016-2032)
- Table 58: Eastern Europe Snack Bars Market Revenue (US$ Mn) Comparison by Distribution Channel Analysis (2016-2032)
- Table 59: Eastern Europe Snack Bars Market Revenue (US$ Mn) Comparison by Ingredients Analysis (2016-2032)
- Table 60: Eastern Europe Snack Bars Market Y-o-Y Growth Rate Comparison by Country (2016-2032)
- Table 61: Eastern Europe Snack Bars Market Y-o-Y Growth Rate Comparison by Product Type Analysis (2016-2032)
- Table 62: Eastern Europe Snack Bars Market Y-o-Y Growth Rate Comparison by Distribution Channel Analysis (2016-2032)
- Table 63: Eastern Europe Snack Bars Market Y-o-Y Growth Rate Comparison by Ingredients Analysis (2016-2032)
- Table 64: Eastern Europe Snack Bars Market Share Comparison by Country (2016-2032)
- Table 65: Eastern Europe Snack Bars Market Share Comparison by Product Type Analysis (2016-2032)
- Table 66: Eastern Europe Snack Bars Market Share Comparison by Distribution Channel Analysis (2016-2032)
- Table 67: Eastern Europe Snack Bars Market Share Comparison by Ingredients Analysis (2016-2032)
- Table 68: APAC Snack Bars Market Comparison by Product Type Analysis (2016-2032)
- Table 69: APAC Snack Bars Market Comparison by Distribution Channel Analysis (2016-2032)
- Table 70: APAC Snack Bars Market Comparison by Ingredients Analysis (2016-2032)
- Table 71: APAC Snack Bars Market Revenue (US$ Mn) Comparison by Country (2016-2032)
- Table 72: APAC Snack Bars Market Revenue (US$ Mn) (2016-2032)
- Table 73: APAC Snack Bars Market Revenue (US$ Mn) Comparison by Country (2016-2032)
- Table 74: APAC Snack Bars Market Revenue (US$ Mn) Comparison by Product Type Analysis (2016-2032)
- Table 75: APAC Snack Bars Market Revenue (US$ Mn) Comparison by Distribution Channel Analysis (2016-2032)
- Table 76: APAC Snack Bars Market Revenue (US$ Mn) Comparison by Ingredients Analysis (2016-2032)
- Table 77: APAC Snack Bars Market Y-o-Y Growth Rate Comparison by Country (2016-2032)
- Table 78: APAC Snack Bars Market Y-o-Y Growth Rate Comparison by Product Type Analysis (2016-2032)
- Table 79: APAC Snack Bars Market Y-o-Y Growth Rate Comparison by Distribution Channel Analysis (2016-2032)
- Table 80: APAC Snack Bars Market Y-o-Y Growth Rate Comparison by Ingredients Analysis (2016-2032)
- Table 81: APAC Snack Bars Market Share Comparison by Country (2016-2032)
- Table 82: APAC Snack Bars Market Share Comparison by Product Type Analysis (2016-2032)
- Table 83: APAC Snack Bars Market Share Comparison by Distribution Channel Analysis (2016-2032)
- Table 84: APAC Snack Bars Market Share Comparison by Ingredients Analysis (2016-2032)
- Table 85: Latin America Snack Bars Market Comparison by Product Type Analysis (2016-2032)
- Table 86: Latin America Snack Bars Market Comparison by Distribution Channel Analysis (2016-2032)
- Table 87: Latin America Snack Bars Market Comparison by Ingredients Analysis (2016-2032)
- Table 88: Latin America Snack Bars Market Revenue (US$ Mn) Comparison by Country (2016-2032)
- Table 89: Latin America Snack Bars Market Revenue (US$ Mn) (2016-2032)
- Table 90: Latin America Snack Bars Market Revenue (US$ Mn) Comparison by Country (2016-2032)
- Table 91: Latin America Snack Bars Market Revenue (US$ Mn) Comparison by Product Type Analysis (2016-2032)
- Table 92: Latin America Snack Bars Market Revenue (US$ Mn) Comparison by Distribution Channel Analysis (2016-2032)
- Table 93: Latin America Snack Bars Market Revenue (US$ Mn) Comparison by Ingredients Analysis (2016-2032)
- Table 94: Latin America Snack Bars Market Y-o-Y Growth Rate Comparison by Country (2016-2032)
- Table 95: Latin America Snack Bars Market Y-o-Y Growth Rate Comparison by Product Type Analysis (2016-2032)
- Table 96: Latin America Snack Bars Market Y-o-Y Growth Rate Comparison by Distribution Channel Analysis (2016-2032)
- Table 97: Latin America Snack Bars Market Y-o-Y Growth Rate Comparison by Ingredients Analysis (2016-2032)
- Table 98: Latin America Snack Bars Market Share Comparison by Country (2016-2032)
- Table 99: Latin America Snack Bars Market Share Comparison by Product Type Analysis (2016-2032)
- Table 100: Latin America Snack Bars Market Share Comparison by Distribution Channel Analysis (2016-2032)
- Table 101: Latin America Snack Bars Market Share Comparison by Ingredients Analysis (2016-2032)
- Table 102: Middle East & Africa Snack Bars Market Comparison by Product Type Analysis (2016-2032)
- Table 103: Middle East & Africa Snack Bars Market Comparison by Distribution Channel Analysis (2016-2032)
- Table 104: Middle East & Africa Snack Bars Market Comparison by Ingredients Analysis (2016-2032)
- Table 105: Middle East & Africa Snack Bars Market Revenue (US$ Mn) Comparison by Country (2016-2032)
- Table 106: Middle East & Africa Snack Bars Market Revenue (US$ Mn) (2016-2032)
- Table 107: Middle East & Africa Snack Bars Market Revenue (US$ Mn) Comparison by Country (2016-2032)
- Table 108: Middle East & Africa Snack Bars Market Revenue (US$ Mn) Comparison by Product Type Analysis (2016-2032)
- Table 109: Middle East & Africa Snack Bars Market Revenue (US$ Mn) Comparison by Distribution Channel Analysis (2016-2032)
- Table 110: Middle East & Africa Snack Bars Market Revenue (US$ Mn) Comparison by Ingredients Analysis (2016-2032)
- Table 111: Middle East & Africa Snack Bars Market Y-o-Y Growth Rate Comparison by Country (2016-2032)
- Table 112: Middle East & Africa Snack Bars Market Y-o-Y Growth Rate Comparison by Product Type Analysis (2016-2032)
- Table 113: Middle East & Africa Snack Bars Market Y-o-Y Growth Rate Comparison by Distribution Channel Analysis (2016-2032)
- Table 114: Middle East & Africa Snack Bars Market Y-o-Y Growth Rate Comparison by Ingredients Analysis (2016-2032)
- Table 115: Middle East & Africa Snack Bars Market Share Comparison by Country (2016-2032)
- Table 116: Middle East & Africa Snack Bars Market Share Comparison by Product Type Analysis (2016-2032)
- Table 117: Middle East & Africa Snack Bars Market Share Comparison by Distribution Channel Analysis (2016-2032)
- Table 118: Middle East & Africa Snack Bars Market Share Comparison by Ingredients Analysis (2016-2032)
- 1. Executive Summary
-
- General Mills Inc.
- Kellogg Company
- The Quaker Oats Company
- KIND LLC
- Clif Bar & Company
- Atkins Nutritionals, Inc.
- Earnest Eats
- Mars, Incorporated
- Healthy Food Ingredients, LLC
- Quest Nutrition LLC
Our Clients


View Our Licence Options
