Global Smart Traffic Camera Market By Camera Type(Surveillance Cameras, Fixed Cameras, Traffic Monitoring Cameras, Mobile Speed Cameras, Red Light Cameras, Other Camera Types), By Deployment Mode(Traffic Monitoring, Traffic Enforcement), By Application(Traffic Management and Surveillance, Toll Management, Other Applications), By End-User, By Region and Companies - Industry Segment Outlook, Market Assessment, Competition Scenario, Trends and Forecast 2024-2033
-
29105
-
August 2024
-
324
-


-
This report was compiled by Vishwa Gaul Vishwa is an experienced market research and consulting professional with over 8 years of expertise in the ICT industry, contributing to over 700 reports across telecommunications, software, hardware, and digital solutions. Correspondence Team Lead- ICT Linkedin | Detailed Market research Methodology Our methodology involves a mix of primary research, including interviews with leading mental health experts, and secondary research from reputable medical journals and databases. View Detailed Methodology Page
-
Quick Navigation
Report Overview
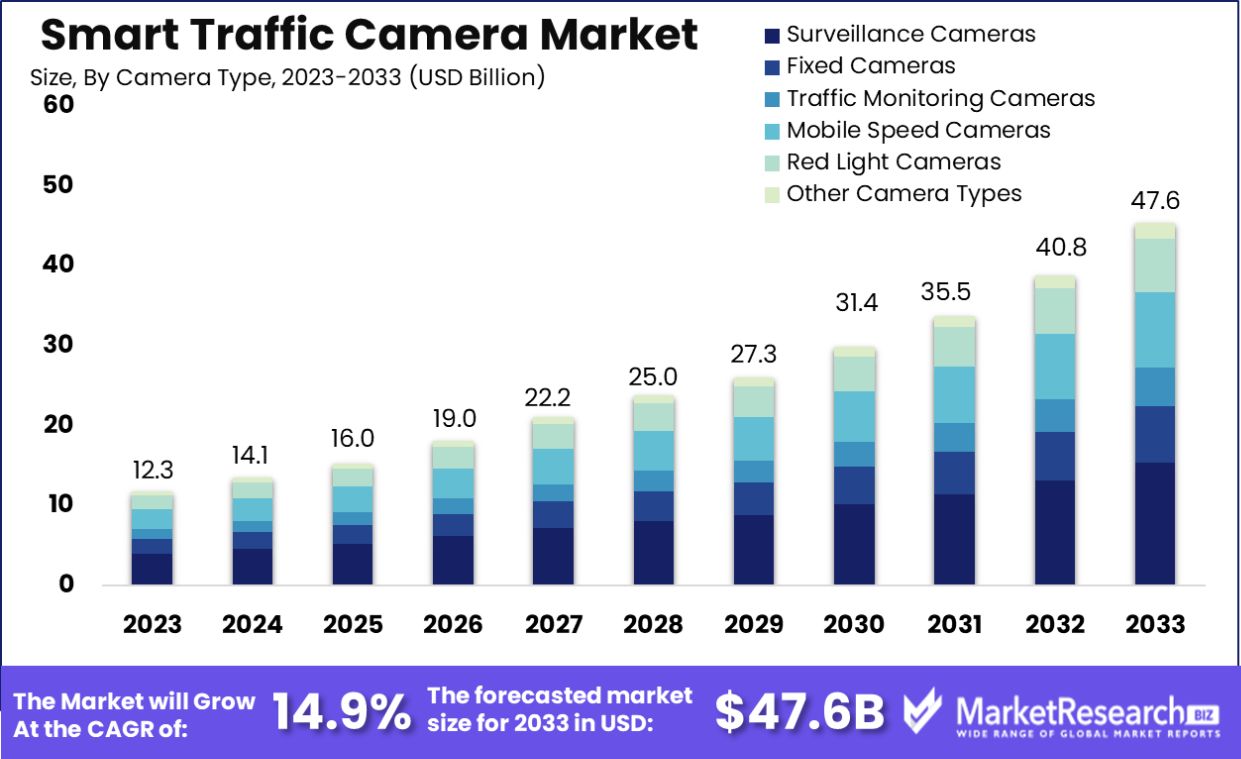
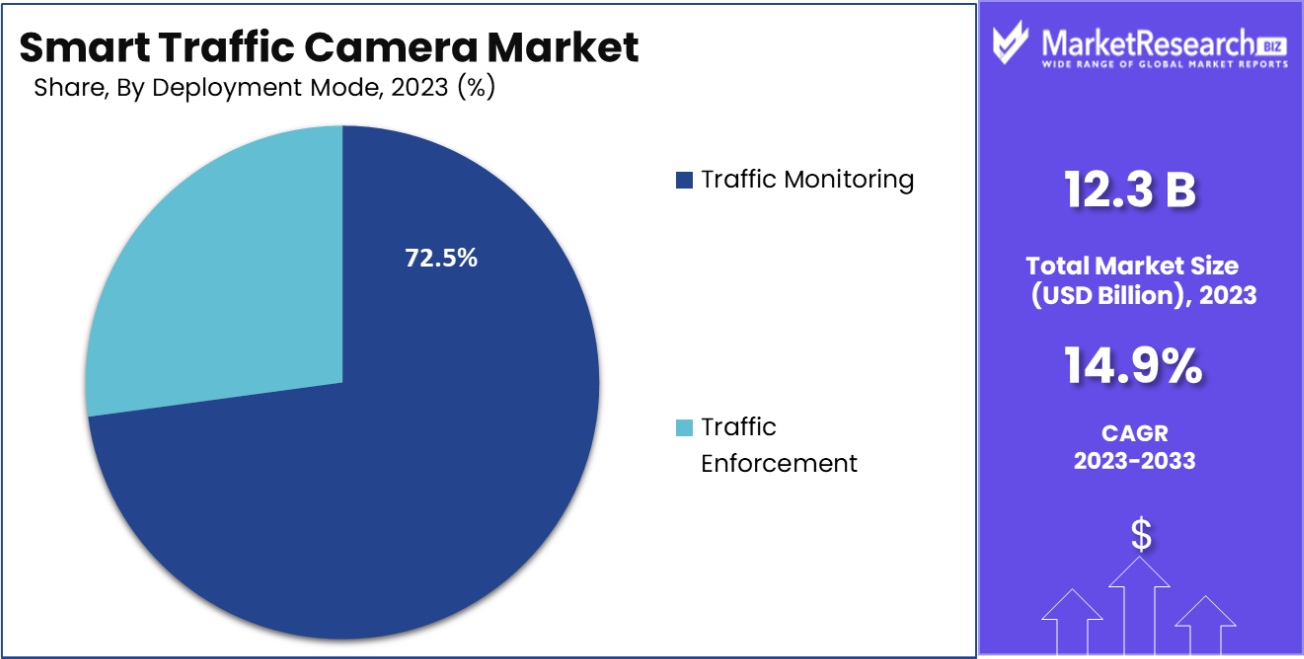
The Global Smart Traffic Camera Market size is expected to be worth around USD 47.6 Billion by 2033, from USD 12.3 Billion in 2023, growing at a CAGR of 14.9% during the forecast period from 2024 to 2033.
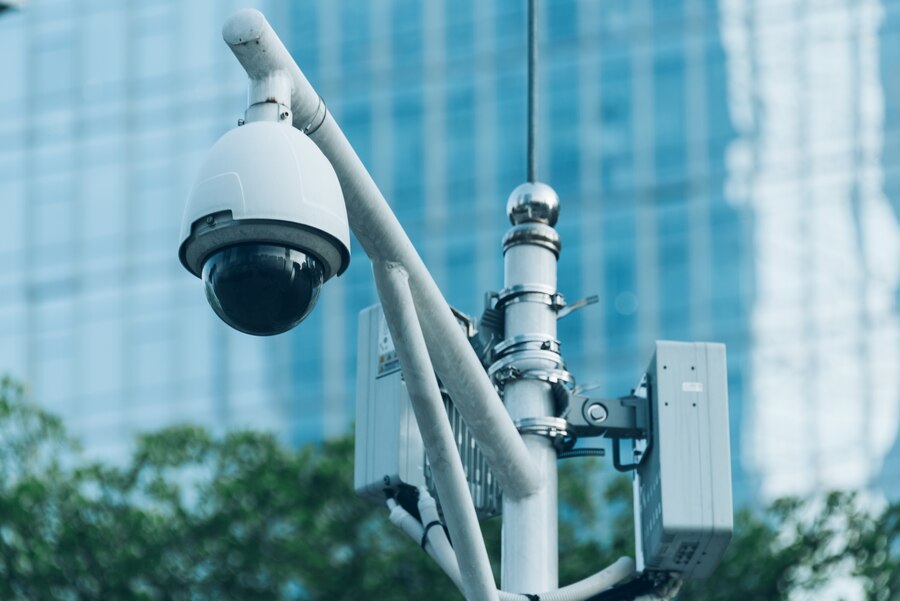
The Smart Traffic Camera Market encompasses the design, production, and implementation of advanced traffic monitoring cameras. These cameras use technologies such as artificial intelligence(AI), machine learning, and IoT to enhance traffic management and safety. The market is driven by the increasing need for efficient traffic control, the reduction of road accidents, and the enforcement of traffic laws.
Key features include real-time data processing, automatic number plate recognition (ANPR), and integration with smart city infrastructure. Major players invest in cutting-edge technology and innovative solutions to provide high-resolution imaging, accurate data analytics, and seamless connectivity, contributing to smarter and safer urban environments.
The smart traffic camera market is experiencing significant growth, driven by advancements in IoT technology and increasing adoption in urban areas. Smart traffic cameras are designed to manage and monitor traffic flows efficiently, leveraging real-time data and analytics to enhance road safety and reduce congestion. In the United States, the number of communities using automated speed safety cameras rose from 211 in 2023 to 222 in 2024, highlighting the expanding adoption of these systems.
Smart cameras play a crucial role in law enforcement by monitoring and managing traffic violations. Cities like Carlsbad, California, have implemented both mobile and fixed license plate readers (LPRs) to capture and analyze vehicle data. These systems are effective in reducing traffic offenses and improving public safety. For example, the Nevada Department of Public Safety reported a 43% decrease in speeding incidents and an 18% reduction in crashes following the deployment of AI-powered traffic monitoring systems.
Market dynamics indicate a positive trajectory for the smart traffic camera market. The integration of advanced technologies, such as AI and machine learning, enhances the capabilities of these systems, making them more reliable and efficient. The demand for improved traffic management solutions is further driven by the increasing urbanization and the need to ensure safer and more efficient transportation networks.
Technological advancements and the growing emphasis on smart city initiatives are key drivers of market growth. The ability of smart traffic cameras to provide real-time data and insights is invaluable for traffic management centers, helping to optimize traffic flow and enhance road safety.
The smart traffic camera market is set for robust growth. The combination of technological innovations, increasing urban adoption, and proven effectiveness in enhancing traffic management and safety will continue to drive market demand. These systems are essential for modernizing urban infrastructure and ensuring efficient, safe transportation networks.
Key Takeaways
- The Global Smart Traffic Camera Market size is expected to be worth around USD Billion by 2033, from USD 12.3 Billion in 2023, growing at a CAGR of 14.9% during the forecast period from 2024 to 2033.
- In 2023, Surveillance Cameras held a dominant market position in By by-camera type segment of the Smart Traffic Camera Market, capturing more than a 32.1% share.
- In 2023, Traffic Monitoring held a dominant market position in the By Deployment Mode segment of the Smart Traffic Camera Market, capturing more than a 72.5% share.
- 2023, Traffic Management and Surveillance held a dominant market position in the By Application segment of the Smart Traffic Camera Market, capturing more than a 67.9% share.
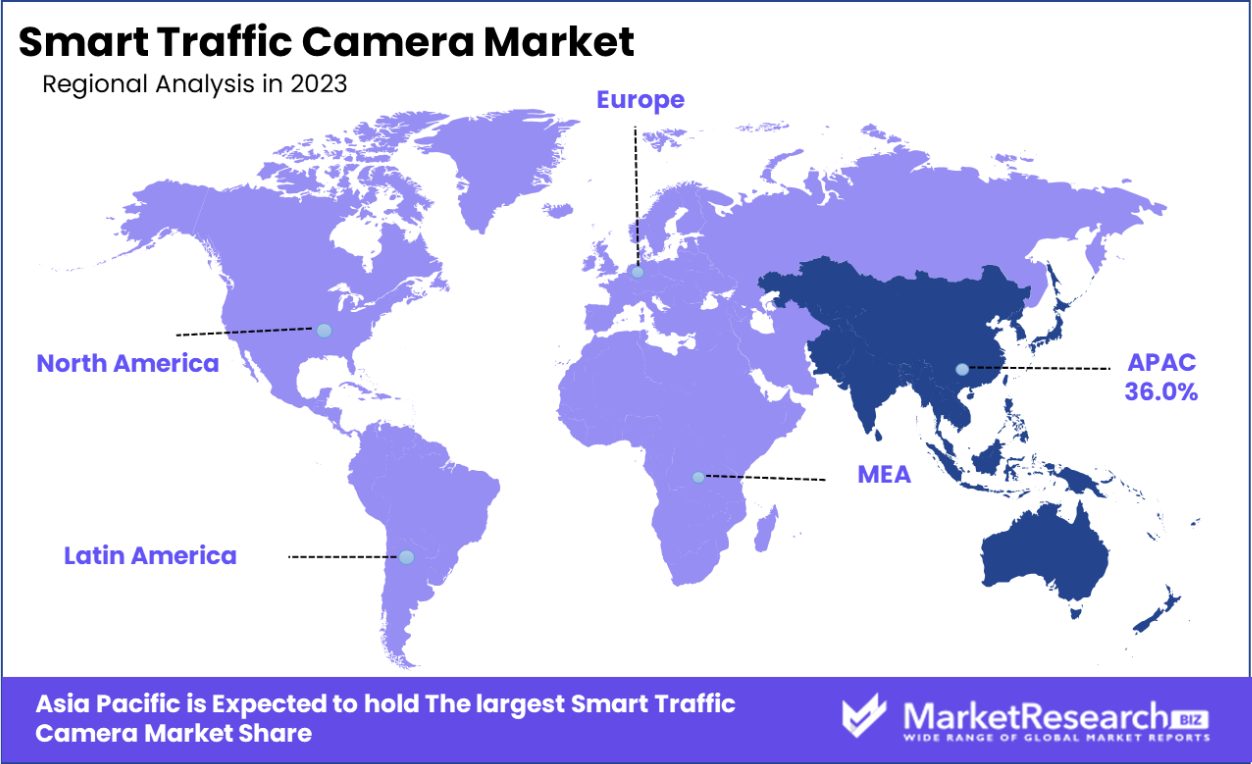
- The Smart Traffic Camera Market in Asia-Pacific commands a substantial 36.0% share of the global market.
Driving factors
Increasing Urban Population and Traffic Congestion Drive Market Growth
The rapid growth of urban areas worldwide is leading to increased traffic congestion, driving the demand for traffic management systems. Smart traffic cameras play a crucial role in monitoring and managing traffic flow, reducing congestion, and improving overall urban mobility. For example, in 2019, the city of Bengaluru, India, implemented an Adaptive Traffic Control System using smart cameras at 353 junctions. This resulted in a 30% reduction in travel time. This successful implementation has inspired other cities to adopt similar systems, fueling the growth of the smart traffic camera market.
As urban populations continue to rise, the strain on existing traffic infrastructure intensifies. Smart traffic cameras help alleviate these challenges by providing real-time data and adaptive traffic control, leading to more efficient traffic management. This demand for improved urban mobility and reduced travel times is a significant factor driving the growth of the smart traffic camera market.
Growing Focus on Road Safety and Traffic Law Enforcement Drives Market Growth
Governments and transportation authorities are increasingly prioritizing road safety and strict enforcement of traffic laws, driving the adoption of smart traffic cameras. These cameras can detect various traffic violations, such as speeding, red light running, and illegal parking, leading to improved road safety and reduced accidents. For instance, the city of Chicago's red light camera program, which uses smart cameras at intersections, reported a 19% reduction in angle crashes and a 10% reduction in injury-causing crashes since its implementation. Such success stories are encouraging other cities to invest in smart traffic camera systems, boosting market growth.
The emphasis on road safety and the need for effective traffic law enforcement are pivotal in promoting the adoption of smart traffic cameras. These systems not only enhance public safety but also streamline traffic operations, making them a critical component of modern traffic management strategies.
Advancements in AI and Machine Learning Technologies Drive Market Growth
The integration of artificial intelligence (AI) and machine learning in smart traffic cameras is significantly enhancing their capabilities, and driving market growth. These technologies enable cameras to perform complex tasks such as real-time vehicle classification, license plate recognition, and behavior analysis. For example, Waycare Technologies partnered with the Regional Transportation Commission of Southern Nevada to implement AI-powered traffic cameras that can predict and prevent accidents.
The system resulted in a 17% reduction in crashes along a pilot stretch of highway. Such innovative applications are expanding the market for smart traffic cameras and attracting investments from both the public and private sectors. Advancements in AI and machine learning provide smart traffic cameras with the ability to offer predictive analytics and proactive traffic management solutions. This technological progress not only improves traffic safety and efficiency but also fosters further development and deployment of smart traffic systems, driving market growth.
Restraining Factors
High Implementation and Maintenance Costs Restrain Market Growth
The initial investment required for deploying smart traffic camera systems, including hardware, software, and infrastructure upgrades, can be substantial. Additionally, ongoing maintenance and data management costs can strain budgets, particularly for smaller municipalities.
For example, the city of San Francisco faced criticism for its red-light camera program, which cost USD 462,020 annually to operate 13 cameras, leading to debates about cost-effectiveness. Such high costs can deter some cities from adopting smart traffic camera systems or limit the scale of implementation. Smaller municipalities with limited budgets may find it difficult to allocate the necessary funds for both the initial setup and the continuous operation of these systems, restraining market growth.
Privacy Concerns and Public Resistance Restrain Market Growth
The widespread use of smart traffic cameras has raised privacy concerns among citizens and civil liberties groups. There are fears about constant surveillance and the potential misuse of collected data. These concerns can lead to public resistance and legal challenges, slowing down the adoption of smart traffic camera systems.
For instance, in 2020, the European Data Protection Board expressed concerns about the use of smart cameras for temperature checks during the COVID-19 pandemic, highlighting the ongoing tension between technology adoption and privacy protection. Such issues can significantly impact the market growth for smart traffic cameras, especially in regions with strict privacy laws. Ensuring that smart traffic camera systems comply with privacy regulations and addressing public concerns is crucial for gaining broader acceptance and promoting market expansion.
By Camera Type Analysis
In 2023, Surveillance Cameras held a dominant market position in the by-camera type segment of the Smart Traffic Camera Market, capturing more than a 32.1% share. The segments within this market include Fixed Cameras, Traffic Monitoring Cameras, Mobile Speed Cameras, Red Light Cameras, and Other Camera Types.
Fixed Cameras followed closely, constituting a substantial portion of the market with their deployment integral for continuous monitoring at critical intersections. Traffic Monitoring Cameras, essential for real-time traffic analysis and management, also secured a significant market share, reflecting their growing adoption in urban traffic systems.
Mobile Speed Cameras, designed for deployment in varied locations to enforce speed limits, and Red Light Cameras, employed to enhance road safety by reducing traffic signal violations, both experienced steady market penetrations. The category of Other Camera Types, which includes specialized cameras for incident detection and automated enforcement, captured the remaining market share.
This distribution underscores the increasing reliance on sophisticated surveillance technologies to enhance traffic management, safety, and law enforcement efficacy across urban settings. The strategic placement of these cameras plays a pivotal role in the seamless operation of smart traffic systems, providing critical data that supports dynamic traffic control and infrastructural adjustments.
By Deployment Mode Analysis
In 2023, Traffic Monitoring held a dominant market position in the By Deployment Mode segment of the Smart Traffic Camera Market, capturing more than a 72.5% share. The segments within this market are primarily categorized into Traffic Monitoring and Traffic Enforcement.
Traffic Monitoring systems are pivotal in providing real-time data essential for traffic management, congestion reduction, and incident response strategies. Their extensive deployment across highways, urban roads, and key intersections highlights their critical role in modern traffic management frameworks, facilitating smoother traffic flow and enhanced public safety.
On the other hand, Traffic Enforcement, which accounted for the remainder of the market share, emphasizes compliance with traffic laws through the use of technologies such as red light cameras and speed cameras. These systems are instrumental in deterring traffic violations and improving road safety by holding drivers accountable and encouraging adherence to traffic regulations.
The substantial lead of Traffic Monitoring in the Smart Traffic Camera Market can be attributed to the increasing global urbanization and the need for advanced systems to manage growing traffic volumes effectively. Moreover, governmental initiatives aimed at smart city developments are further propelling the adoption of these systems, highlighting a significant trend towards more technologically integrated traffic solutions.
By Application Analysis
In 2023, Traffic Management and Surveillance held a dominant market position in the By Application segment of the Smart Traffic Camera Market, capturing more than a 67.9% share. This segment includes Traffic Management and Surveillance, Toll Management, and Other Applications.
The substantial share of Traffic Management and Surveillance underscores its vital role in modern transportation networks, where it enhances traffic flow, reduces congestion, and increases safety through continuous monitoring and management. These systems utilize advanced camera technologies to gather and analyze traffic data, supporting dynamic traffic light sequencing and incident detection which facilitate efficient urban mobility.
Toll Management, while occupying a smaller portion of the market, plays a crucial role in automating toll collection processes, thus reducing traffic delays and operational costs associated with manual toll collection. This segment benefits from the integration of smart cameras that can recognize license plates and vehicle classifications for accurate tolling.
Other Applications include uses in emergency response coordination, infrastructure maintenance, and security measures, which collectively contribute to the remaining market share. This diverse application range highlights the expanding utility of smart traffic cameras beyond traditional traffic and toll management, catering to a broad spectrum of transportation-related needs.
Key Market Segments
By Camera Type
- Surveillance Cameras
- Fixed Cameras
- Traffic Monitoring Cameras
- Mobile Speed Cameras
- Red Light Cameras
- Other Camera Types
By Deployment Mode
- Traffic Monitoring
- Traffic Enforcement
By Application
- Traffic Management and Surveillance
- Toll Management
- Other Applications
Growth Opportunity
Integration with Emerging Technologies Offers Growth Opportunities
The integration of smart traffic cameras with emerging technologies such as 5G infrastructure, edge computing, and the Internet of Things (IoT) presents significant growth opportunities. These integrations can enhance real-time data processing, improve system responsiveness, and enable new applications.
For instance, the city of Hangzhou, China, has implemented a "City Brain" project that combines smart traffic cameras with cloud computing and big data analytics to optimize traffic flow in real time. This system has reduced travel time by 15% and has been exported to other cities. As 5G networks become more prevalent, similar integrated systems are likely to be adopted worldwide, driving demand for advanced smart traffic cameras. These technologies enable more efficient traffic management, reducing congestion and improving road safety, thus presenting substantial growth potential for the smart traffic camera market.
Expansion in Developing Countries Offers Growth Opportunity
Rapidly growing urban areas in developing countries present a substantial growth opportunity for the smart traffic camera market. As these cities grapple with increasing traffic congestion and road safety issues, there is a growing need for intelligent traffic management solutions.
For example, in 2019, Jakarta, Indonesia, began implementing a smart traffic light system using AI-powered cameras at 31 intersections, with plans for citywide expansion. This trend is likely to continue across developing nations, opening up new markets for smart traffic camera manufacturers and service providers. These systems help manage traffic flow more effectively and enhance safety, making them an attractive investment for cities looking to modernize their infrastructure.
Latest Trends
Multi-Functional Smart Cameras Are Trending Factors
There is a growing trend towards developing smart traffic cameras that serve multiple purposes beyond traffic management. These cameras can incorporate functions such as environmental monitoring, public safety surveillance, and parking management.
For example, the city of San Diego has implemented a Smart Streetlights program that uses cameras not only for traffic monitoring but also for air quality sensing, gunshot detection, and parking space availability tracking. This trend towards multi-functional devices is likely to drive innovation in the smart traffic camera market and increase the value proposition for cities considering implementation. By offering a broader range of services, these smart cameras can provide comprehensive urban management solutions, enhancing their appeal and utility.
Edge Computing for Real-Time Processing Are Trending Factors
The trend toward edge computing in smart traffic camera systems is gaining momentum. By processing data at the edge (i.e., within the camera or nearby devices), these systems can reduce latency, improve real-time responsiveness, and reduce bandwidth requirements.
For instance, NVIDIA's Metropolis platform enables cities to deploy AI-powered smart cameras that can process video data at the edge, allowing for instant traffic analysis and decision-making. This trend is likely to continue as cities seek more efficient and responsive traffic management solutions. Edge computing enhances the capabilities of smart traffic cameras, enabling them to provide immediate insights and actions, which is crucial for effective traffic management and safety improvements.
Regional Analysis
The Smart Traffic Camera Market in Asia-Pacific commands a substantial 36.0% share of the global market.
The smart traffic camera market exhibits distinct characteristics and growth trajectories across various regions, with notable developments and deployment rates differing by geographic area. In North America, the market is driven by stringent traffic regulations and a high rate of technological adoption, fostering the installation of advanced traffic management systems. Europe follows closely, with a robust emphasis on road safety and environmental concerns pushing for the integration of smart cameras to reduce traffic congestion and monitor emissions.
The Asia-Pacific region, however, emerges as the dominant player, holding approximately 36.0% of the global market share. This dominance is underpinned by rapid urbanization in major economies such as China and India, where there is a pressing need to manage burgeoning vehicle populations and enhance public safety through sophisticated traffic surveillance. The market in this region benefits from strong governmental support and investments in smart city projects.
In contrast, the Middle East & Africa, and Latin America are nascent but growing markets. These regions display increasing interest in smart traffic solutions driven by growing urban centers and the need for efficient traffic management solutions to support economic growth and infrastructural development. Here, the adoption rate is expected to accelerate, driven by urbanization and increased investments in transport infrastructure. These regional dynamics collectively influence the strategic positioning and expansion efforts of key players within the smart traffic camera market.
Key Regions and Countries
North America
- The US
- Canada
- Rest of North America
Europe
- Germany
- France
- The UK
- Spain
- Netherlands
- Russia
- Italy
- Rest of Europe
Asia-Pacific
- China
- Japan
- Singapore
- Thailand
- South Korea
- Vietnam
- India
- New Zealand
- Rest of Asia Pacific
Latin America
- Mexico
- Brazil
- Rest of Latin America
Middle East & Africa
- Saudi Arabia
- South Africa
- UAE
- Rest of Middle East & Africa
Key Players Analysis
In 2023, the global smart traffic camera market remains intensely competitive, with key players driving innovations and expansions across various regions. Teledyne Technologies Incorporated continues to excel through robust technological advancements and strategic acquisitions, enhancing its product offerings and market reach. Similarly, Axis Communications AB strengthens its position with high-resolution cameras equipped with advanced analytics capabilities, appealing to urban infrastructures and prioritizing smart city solutions.
Robert Bosch GmbH maintains its market prominence by integrating Internet of Things (IoT) capabilities into its smart traffic systems, thereby offering comprehensive traffic management solutions. Hikvision Digital Technology Co., Ltd. and Dahua Technology Co., Ltd. leverage their extensive distribution networks and cost-effective product portfolios, capturing significant shares in emerging markets.
Jenoptik AG focuses on innovation in speed and red-light enforcement cameras, which are integral to intelligent transport systems in Europe. North American market dynamics are notably influenced by Viion Systems Inc. and Motorola Solutions, Inc., with the latter expanding its integrated software solutions, enhancing public safety and traffic efficiency.
Companies like Milesight and CP PLUS are pivotal in driving technological integration and accessibility in the smart camera sector, with an emphasis on adaptive and scalable solutions. Collectively, these key players are essential in shaping the market dynamics through strategic innovation, partnerships, and an expanded global footprint, catering to an increasingly digital and interconnected landscape.
Market Key Players
- Teledyne Technologies Incorporated
- Axis Communications AB
- Robert Bosch GmbH
- Hikvision Digital Technology Co., Ltd.
- Milesight
- Dahua Technology Co., Ltd.
- Jenoptik AG
- Viion Systems Inc.
- Motorola Solutions, Inc.
- CP PLUS
- Other Key Players
Recent Development
- In September 2023, Dahua Technology Co., Ltd., Received $50 million in funding to expand its smart traffic solutions globally, enhancing system integration capabilities.
- In August 2023, Hikvision Digital Technology Co., Ltd., Launched a new AI-powered traffic camera that reduces false alarms by 30%.
- In July 2023, Unveiled its latest 4K traffic monitoring camera, boasting a 40% improvement in night vision clarity.
Report Scope
Report Features Description Market Value (2023) USD 12.3 Billion Forecast Revenue (2033) USD 47.6 Billion CAGR (2024-2032) 14.9% Base Year for Estimation 2023 Historic Period 2016-2019 Forecast Period 2024-2033 Report Coverage Revenue Forecast, Market Dynamics, COVID-19 Impact, Competitive Landscape, Recent Developments Segments Covered By Camera Type(Surveillance Cameras, Fixed Cameras, Traffic Monitoring Cameras, Mobile Speed Cameras, Red Light Cameras, Other Camera Types), By Deployment Mode(Traffic Monitoring, Traffic Enforcement), By Application(Traffic Management and Surveillance, Toll Management, Other Applications) Regional Analysis North America - The US, Canada, Rest of North America, Europe - Germany, France, The UK, Spain, Italy, Russia, Netherlands, Rest of Europe, Asia-Pacific - China, Japan, South Korea, India, New Zealand, Singapore, Thailand, Vietnam, Rest of Asia Pacific, Latin America - Brazil, Mexico, Rest of Latin America, Middle East & Africa - South Africa, Saudi Arabia, UAE, Rest of Middle East & Africa Competitive Landscape Teledyne Technologies Incorporated, Axis Communications AB, Robert Bosch GmbH, Hikvision Digital Technology Co., Ltd., Milesight, Dahua Technology Co., Ltd., Jenoptik AG, Viion Systems Inc., Motorola Solutions, Inc., CP PLUS, Other Key Players Customization Scope Customization for segments, region/country-level will be provided. Moreover, additional customization can be done based on the requirements. Purchase Options We have three licenses to opt for Single User License, Multi-User License (Up to 5 Users), Corporate Use License (Unlimited User and Printable PDF) -
-
- Teledyne Technologies Incorporated
- Axis Communications AB
- Robert Bosch GmbH
- Hikvision Digital Technology Co., Ltd.
- Milesight
- Dahua Technology Co., Ltd.
- Jenoptik AG
- Viion Systems Inc.
- Motorola Solutions, Inc.
- CP PLUS
- Other Key Players
Our Clients


View Our Licence Options
