Single Use Bioreactors Market By Product Type (Stirred Single Use Bioreactors, Bubble Column Single Use Bioreactors, Wave-Mixed Single Use Bioreactors), By Application (Biopharmaceutical, Biotechnology, Others), By Region And Companies - Industry Segment Outlook, Market Assessment, Competition Scenario, Trends, And Forecast 2023-2032
-
22831
-
June 2023
-
168
-


-
This report was compiled by Correspondence Linkedin | Detailed Market research Methodology Our methodology involves a mix of primary research, including interviews with leading mental health experts, and secondary research from reputable medical journals and databases. View Detailed Methodology Page
-
Quick Navigation
Report Overview
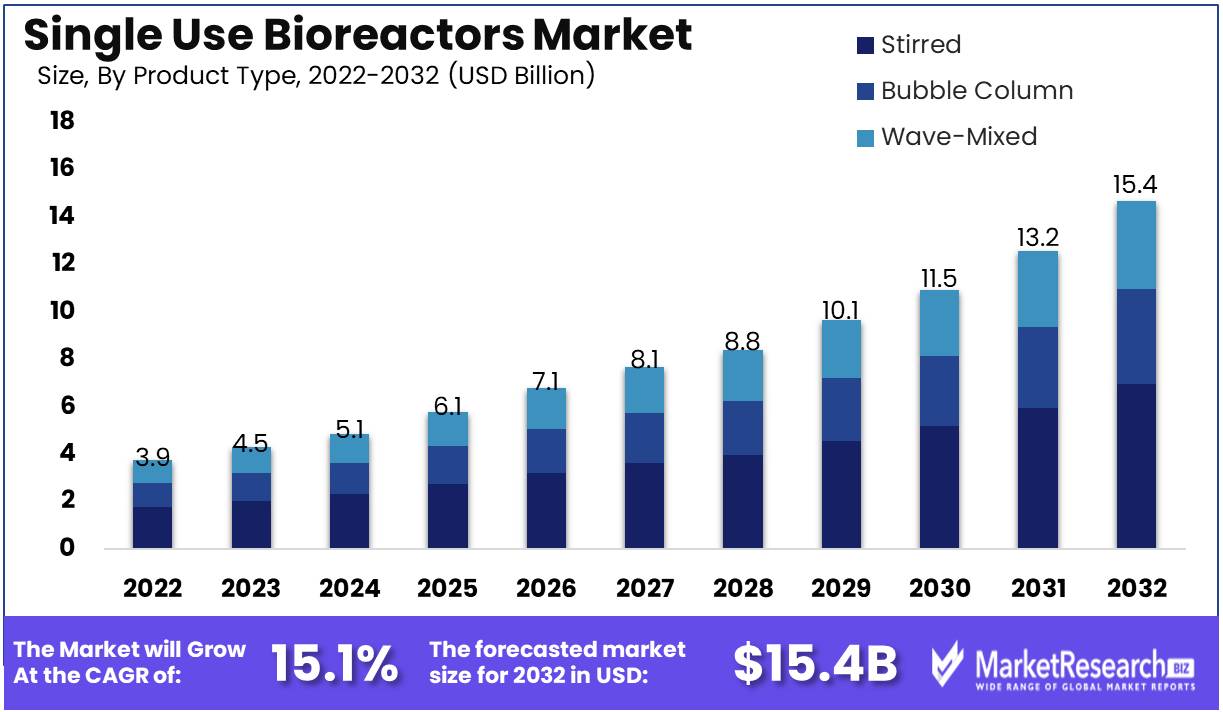
Single Use Bioreactors Market size is expected to be worth around USD 15.4 Bn by 2032 from USD 3.9 Bn in 2022, growing at a CAGR of 15.1% during the forecast period from 2023 to 2032.
The Single-Use Bioreactors Market is of the utmost importance, as it is one of the most rapidly expanding sectors in the extensive biotechnology landscape. This cutting-edge technology has effectively ushered in a major transformation in the field of bioprocessing, providing an economically viable and highly adaptable solution for the development and production of biologics. In addition to a growing demand for biologics and a reduction in operational costs, the adoption of single-use technologies is also on the rise, which are the primary factors driving this remarkable progress.
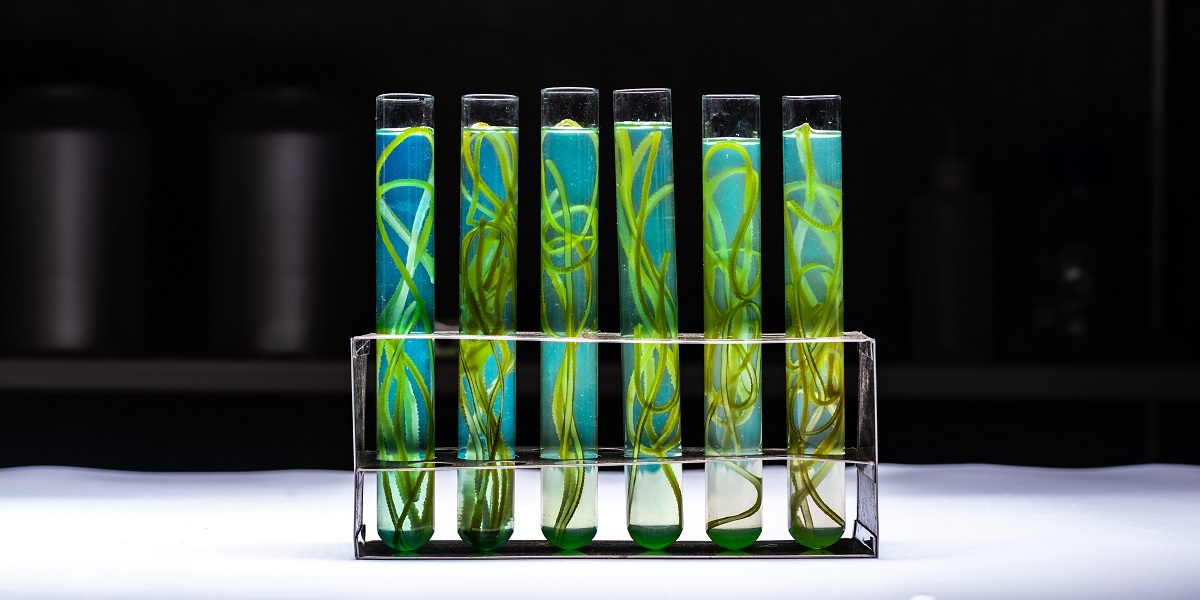
Single-Use Bioreactors are complex systems designed to facilitate the cultivation of cells and microbes. The primary benefit of these bioreactors is their disposability, which eliminates the need for sterilization and cleaning procedures. In the production of biologics, including vaccines, gene therapies, and monoclonal antibodies, this revolutionary technology is indispensable. Single-Use Bioreactors have the potential to revolutionize the field of bioprocessing by increasing adaptability, reducing costs, and mitigating the risks of cross-contamination.
In the field of biopharmaceutical manufacturing, single-use bioreactors have received widespread acclaim due to their numerous advantages. Traditional stainless steel bioreactors are rendered obsolete as a result of the elimination of complex cleansing, sterilization, and validation procedures. The combination of the simplification of workflow, the resultant process optimization, and the concurrent reduction in the need for elaborate infrastructure augments operational efficiency. Single-use bioreactors' disposability increases product safety while concurrently mitigating the risk of batch-to-batch variances, thereby ensuring consistent and reliable production.
From the domain of single-use bioreactors have emerged an abundance of remarkable innovations. The introduction of cutting-edge sensor technologies that enable real-time monitoring and control of crucial process parameters, such as pH, dissolved oxygen, and temperature, is the most significant of these innovative developments. In addition, the advancement of materials and design paradigms has resulted in significant improvements in the scalability and performance of single-use bioreactors, enabling the attainment of larger and more efficient production capacities.
The market for bioreactors designed for single use has expanded significantly. Demand for biopharmaceuticals, such as monoclonal antibodies, vaccines, and cell therapies, has accelerated the adoption of single-use bioreactors in manufacturing processes to unprecedented levels. The pervasive use of single-use bioreactors is evident in the research and development, experimental scale production, and large-scale commercial manufacturing sectors. Future projections indicate that the market will continue its ascent as an increasing number of biopharmaceutical companies recognize the numerous benefits of single-use bioreactors and direct their investments toward their seamless implementation.
Driving Factors
Increasing Demand for Biologics and Biosimilars
The global increase in the incidence of chronic diseases has fuelled a surge in demand for biologics and biosimilars. As a result, there has been a notable increase in research and development related to these products, resulting in greater adoption of single-use bioreactors.
The demand for personalized medicine and targeted therapies is increasing
Increasing demand for personalized medicine and targeted therapies has accelerated the adoption of single-use bioreactors. These bioreactors offer superior scalability and usability, making them the technology of choice for developing new medicines. Consequently, small and medium-sized biopharmaceutical companies are adopting single-use technologies at an increasing rate.
Expansion of the biopharmaceutical industry in emerging markets
The expanding biopharmaceutical industry in emerging markets has significantly increased the demand for single-use bioreactors. These markets are experiencing accelerated growth, resulting in an increase in demand for healthcare products, especially biologics and biosimilars. Consequently, research and development expenditures have increased, propelling the market growth for single-use bioreactors.
A Favorable Regulatory Environment
A favorable regulatory environment within the biopharmaceutical industry has facilitated the adoption of single-use bioreactors. This regulatory support has fostered a competitive environment favorable to manufacturers in this market.
Potential Disruptors
The competitive landscape of the Single-Use Bioreactors Market could be affected by potential market disruptors despite the market's robust growth. Emerging technologies that offer greater efficacy or cost savings may present a difficulty. Changes in regulations, particularly regarding environmental concerns associated with the disposal of single-use products, could also have an effect on the market.
Adapting to Environmental Consciousness
The market may be affected by a transition toward eco-friendly products. To accommodate evolving consumer preferences, manufacturers should consider sustainable practices and develop biodegradable or recyclable materials.
Continuous Innovation
To remain competitive, companies need to prioritize continuous innovation. It is essential to remain vigilant and responsive to altering consumer and regulatory demands. Embracing emerging technologies and integrating them into designs for single-use bioreactors can help meet changing market demands.In the Single Use Bioreactors Market, the adoption of mammalian cell fermentation technology is driving scalability, flexibility, and reduced contamination risks.
Restraining Factors
Limited Capacity of Single-Use Bioreactors Compared to Stainless Steel Bioreactors
Compared to conventional stainless steel bioreactors, single-use bioreactors have a limited capacity. The size restriction presents an obstacle for large-scale production activities that demand high production volumes. While single-use bioreactors are restricted to a certain volume, stainless steel bioreactors can be made to accommodate any capacity. This limitation has made it difficult for single-use bioreactors to compete with conventional stainless steel bioreactors in large-scale production activities.
Concerns Regarding the Quality and Consistency of Single-Use Bioreactor Components
Concerns regarding the quality and consistency of single-use bioreactor components are another factor restraining the adoption of single-use bioreactors. Plastics and films are used to create the components of single-use bioreactors, whose quality and consistency can vary. The materials used in single-use bioreactors are also susceptible to degradation, which can compromise the integrity of the product. To address these issues, stringent quality control measures must be implemented throughout the entire supply chain, from production to disposal.
Limited Availability of Specialized Single-Use Bioreactor Products
Utilizing single-use bioreactors necessitates the availability of specialized products. These products consist of disposable sensors, tubes, containers, and filters. Due to their limited availability, single-use bioreactors face significant obstacles in their widespread adoption. These products can also be prohibitively expensive.
High Initial Costs Associated with the Adoption of Single-Use Bioreactors
Single-use bioreactors have a high initial cost associated with their adoption. Single-use bioreactors can offer long-term savings due to their quick setup times and low operating costs, but their high initial cost can be a hindrance. The high price is due to the required specialized apparatus, which includes disposable sensors, tubes, bags, and filters.
Limited Compatibility of Single-Use Bioreactors with Certain Cell Lines and Culture Conditions
Lastly, single-use bioreactors' compatibility with particular cell lines and cultivation conditions can be a major limiting factor. The design of single-use bioreactors is optimized for specific culture conditions, which can limit their compatibility with particular cell lines. Foaming can be an issue with single-use bioreactors, leading to unstable culture conditions.
Product Type Analysis
The stirred-tank bioreactors and single-use bioreactors product categories are used to segment the Single-Use Bioreactors Market. The segment of stirred-tank bioreactors dominates the market. The pervasive adoption of these bioreactors in the biopharmaceutical industry is due to their adaptability, scalability, and high efficiency. In addition, they provide continuous operation and optimal energy utilization, reducing overall operational costs.
The economic growth of emerging nations has had a significant impact on the biopharmaceutical industry's adoption of stirred-tank bioreactors. These nations have experienced robust development in the biopharmaceutical industry, which has increased demand for stirred-tank bioreactors. Increasing investments in research and development have also contributed to the expansion of this market segment.
Due to their numerous benefits, the consumer trend and behavior toward stirred-tank bioreactors have been positive. The majority of biopharmaceutical firms choose these bioreactors to assure product quality, greater efficiency, and cost-effectiveness. In addition, the adaptability and scalability of these bioreactors have made them popular with small and medium-sized biotechnology companies.
Cell Type Analysis
Because they are widely used in the production of biologics, the Mammalian Cells Segment dominates the Single-Use Bioreactors Market. Numerous therapeutic proteins, monoclonal antibodies, and vaccines are produced using mammalian cells. Single-use bioreactors offer numerous benefits, including usability, scalability, and cost-effectiveness, making them the optimal choice for mammalian cell culture applications.
In addition to influencing the adoption of mammalian cells in the Single-Use Bioreactors Market, the economic growth of emerging economies has also had an effect. These nations have experienced robust development in the biopharmaceutical industry, which has increased the demand for mammalian cell culture applications. Government and private sector investments in the biopharmaceutical industry have also contributed to the expansion of this market segment.
Due to their pervasive use in the production of biologics, the consumer attitude and behavior toward mammalian cells have been positive. The majority of biopharmaceutical companies choose single-use bioreactors to assure product quality, increased efficiency, and cost-effectiveness. In addition, the scalability and adaptability of these bioreactors have made them popular with small and medium-sized biotechnology companies.
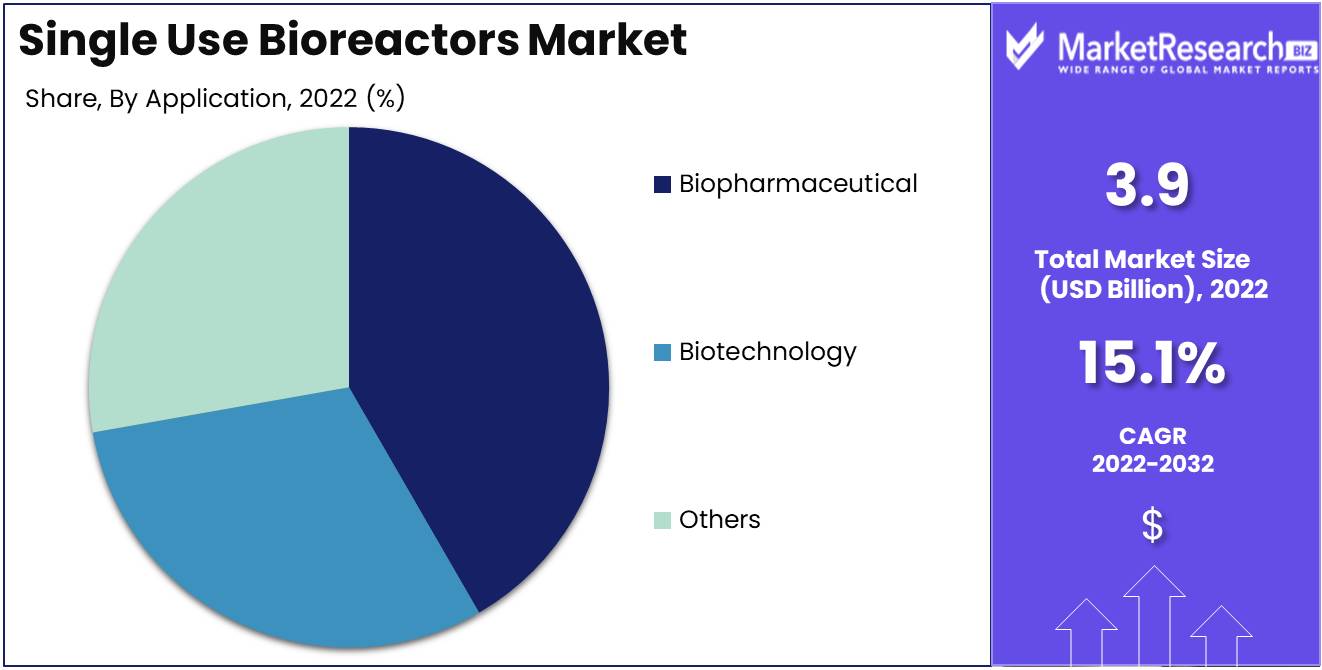
Application Analysis
Due to the rising demand for biologics and rising investments in biopharmaceutical research and development activities, the Biopharmaceuticals Segment dominates the Single-Use Bioreactors Market. Biopharmaceuticals are composed of extremely complex molecules that necessitate precise manufacturing processes to ensure their quality and efficacy. Single-use bioreactors offer numerous benefits, including adaptability, scalability, and cost-effectiveness, making them an ideal choice for biopharmaceutical production.
The economic growth of emerging societies has also had an effect on biopharmaceutical adoption. These economies have experienced robust development in the biopharmaceutical industry, resulting in a rise in demand for single-use bioreactors. Government and private sector investments in the biopharmaceutical industry have also contributed to the expansion of this market segment.
As a result of their greater efficacy and specificity compared to conventional small-molecule therapeutics, the consumer trend and behavior toward biopharmaceuticals has been positive. To ensure the integrity and efficacy of their products, the majority of biopharmaceutical companies choose single-use bioreactors. In addition, the scalability and adaptability of these bioreactors have made them popular among small and medium-sized biotech companies.
Key Market Segments
By Product Type
- Stirred
- Bubble Column
- Wave-Mixed
By Cell Type
- Mammalian Cells
- Bacterial Cells
- Yeast Cells
- Other
By Molecule Type
- Monoclonal Antibodies (Mabs)
- Vaccines
- Stem Cells
- Gene-Modified Cells
- Other
By Application
- Biopharmaceutical
- Biotechnology
- Others
Growth Opportunity
Growing demand for gene therapies and cell-based therapies
The rapid development of gene therapies and cell-based therapies has substantially increased the demand for bioreactor technology that is more adaptable and scalable. Single-use bioreactors are the optimal choice for these emerging therapies, as they enable more rapid and adaptable cell culture production.
Increasing adoption of single-use bioreactors in small and mid-sized biopharmaceutical companies
Small and mid-sized biopharmaceutical companies are increasingly adopting single-use bioreactors due to their lower initial investment, quicker turnaround times, and lower operational costs. This presents a substantial market opportunity for bioreactor manufacturers who can produce high-quality, dependable systems.
Expansion of the Biopharmaceutical Industry in Emerging Markets
The accelerated growth of the biopharmaceutical industry in emerging markets presents a tremendous opportunity for businesses that can provide flexible and scalable bioreactor technology. Single-use bioreactors are ideally adapted for these markets due to their lower initial investment, quicker turnaround times, and lower operating expenses.
Increasing investments in research and development of biologics and biosimilars
As the biopharmaceutical industry continues to expand, there is a rising demand for the development of novel and cutting-edge therapies. This necessitates substantial investments in the research and development of biologics and biosimilars, which increases the need for more efficient and dependable bioreactor technology.
Improved Automation and Monitoring Capabilities
Integration with sophisticated automation and monitoring systems is one of the most significant benefits of single-use bioreactors. This enables more precise control of key parameters such as temperature, pH, and dissolved oxygen, resulting in more consistent and superior cell cultures.
Latest Trends
Increasing Use of Single-use Bioreactors in the Production of Vaccines
Due to their benefits, which include increased operational efficiency, cost-effectiveness, and decreased risk of contamination, single-use bioreactors are increasingly used in the production of vaccines. Compared to conventional stainless steel bioreactors, which require routine cleaning and sterilization, single-use bioreactors allow for rapid process alterations. Vaccine manufacturers have also benefited from the scalability of single-use bioreactors, which has allowed for the rapid production of vaccines in response to pandemics or epidemics.
Growing Interest in the Development of Single-Use Bioreactors for Stem Cell Production
Due to their capacity to support stem cell growth and differentiation, the development of single-use bioreactors for stem cell production has gained momentum in recent years. By using single-use bioreactors, manufacturing processes can be made more efficient and cost-effective. Stem cells have the potential to treat numerous life-threatening diseases. In addition, single-use bioreactors have reduced contamination risks, making them suitable for cellular therapies that require highly regulated production processes.
Increasing Adoption of Single-use Bioreactors in the Production of Biosimilars
Single-use bioreactors have become more widely used in recent years for the production of biosimilars, or biologics that are similar to already-approved medications. In the production of biosimilars, the use of single-use bioreactors as opposed to stainless steel bioreactors facilitates faster and more cost-effective biologic manufacturing. In addition, single-use bioreactors provide greater flexibility in the biomanufacturing process because they can be readily scaled up or down based on production needs.
Demand for single-use bioreactors with larger working volumes is increasing
Historically, single-use bioreactors had reduced working volumes, which limited their throughput and, consequently, their use in bioprocessing. However, technological innovation has enabled the development of single-use bioreactors with larger working volumes, resulting in a rise in demand for them. Larger working volume single-use bioreactors provides increased flexibility, quicker turnaround times, and enhanced performance, making them ideal for vaccine and pharmaceutical production.
Regional Analysis
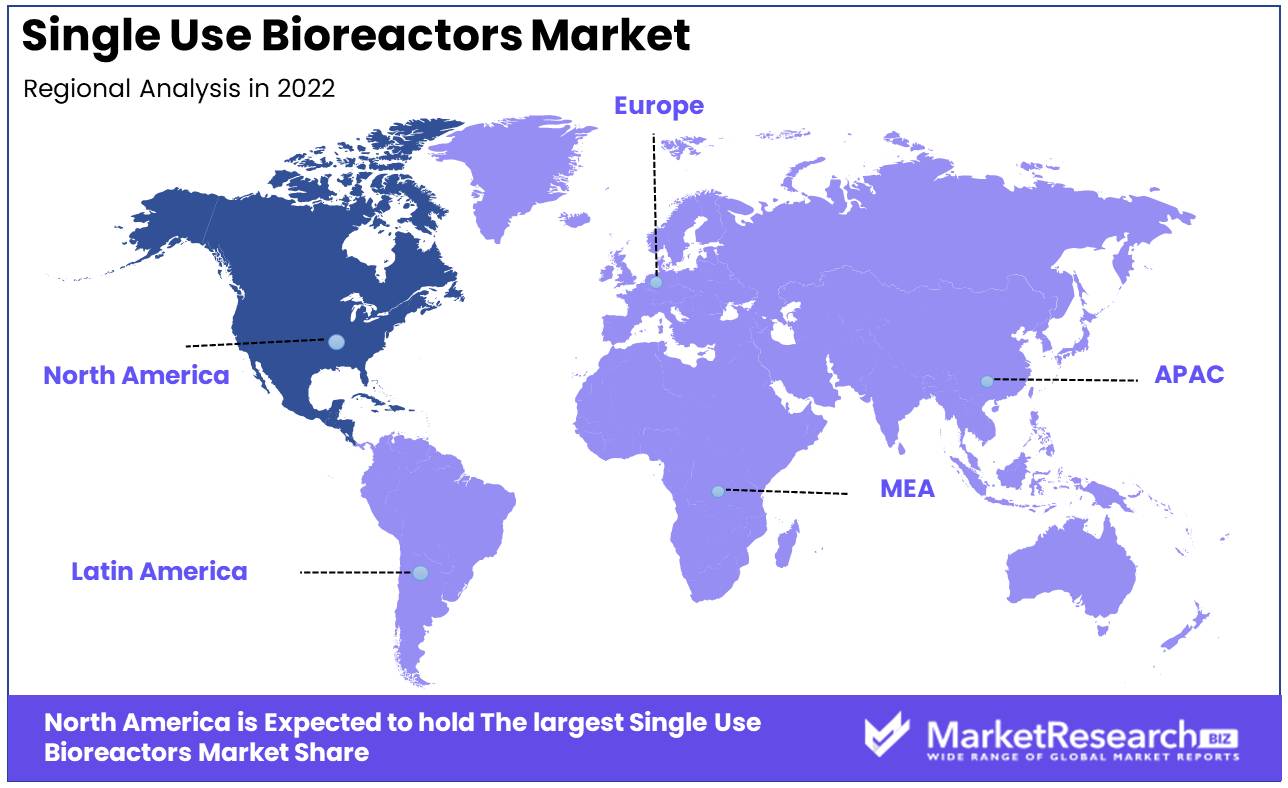
The Single-Use Bioreactors Market is dominated by North America. Every day, new technologies and innovative approaches emerge in the biopharmaceutical industry, which has been advancing rapidly. The region is renowned for its strong emphasis on research and development, the presence of a well-established biopharmaceutical industry, and favorable regulatory policies that encourage the adoption of single-use technologies. These factors have made the market for single-use bioreactors in North America increasingly attractive to biopharmaceutical companies, and the region is expected to dominate the market over the next few years.
The biopharmaceutical industry in North America is one of the main factors that have positioned the region to dominate the single-use bioreactors market. These corporations have established research and development facilities devoted to the creation of innovative therapies for a variety of diseases, including cancer, Alzheimer's, and multiple sclerosis, among others. This not only generates employment opportunities but also provides an ecosystem that sustains the development of the industry, which is essential for the adoption of new technologies such as single-use bioreactors.
Due to the region's regulatory environment, North America is also expected to dominate the market for single-use bioreactors. The United States, Canada, and Mexico, the three most populous nations in the region, have favorable regulatory policies that encourage the adoption of single-use bioreactors in the biopharmaceutical industry. In addition, the regulatory environment in North America is stable, predictable, and innovation-friendly, making the region a secure location for biopharmaceutical industry investments.
In addition, North America's strong emphasis on research and development is a key factor that has positioned the region to dominate the market for single-use bioreactors. The region has state-of-the-art research facilities, institutions of the highest caliber, and research organizations committed to the creation of novel biopharmaceutical products and technologies. This research ecosystem provides crucial support for the development and commercialization of new products, which is essential for the expansion of the biopharmaceutical industry.
In addition, the growing demand for personalized medicine is a major driver for the adoption of single-use bioreactors. Single-use bioreactors are well adapted to the practice of personalized medicine, which tailors medical treatment to an individual's unique genetic makeup. With their ability to produce small quantities of customized drugs, single-use bioreactors are becoming an increasingly popular choice for the production of personalized medicines, making North America an attractive market for biopharmaceutical firms.
Key Regions and Countries
North America
- US
- Canada
- Mexico
Western Europe
- Germany
- France
- The UK
- Spain
- Italy
- Portugal
- Ireland
- Austria
- Switzerland
- Benelux
- Nordic
- Rest of Western Europe
Eastern Europe
- Russia
- Poland
- The Czech Republic
- Greece
- Rest of Eastern Europe
APAC
- China
- Japan
- South Korea
- India
- Australia & New Zealand
- Indonesia
- Malaysia
- Philippines
- Singapore
- Thailand
- Vietnam
- Rest of APAC
Latin America
- Brazil
- Colombia
- Chile
- Argentina
- Costa Rica
- Rest of Latin America
Middle East & Africa
- Algeria
- Egypt
- Israel
- Kuwait
- Nigeria
- Saudi Arabia
- South Africa
- Turkey
- United Arab Emirates
- Rest of MEA
Key Players Analysis
Thermo Fisher Scientific is an industry leader in the single-use bioreactors market. The company provides an extensive selection of single-use bioreactor systems, including agitated and wave-mixed models. Thermo Fisher's dominant position in the biopharmaceutical industry and commitment to technological innovation contribute to its market dominance.
Sartorius AG is a leading supplier of single-use bioreactors for a variety of applications. The company's product line comprises stirred and wave-mixed bioreactors with advanced control systems, scalability, and dependability. The dedication to innovation and emphasis on producing high-quality products contribute to Sartorius's market position.
Merck KGaA is a global leader in the biopharmaceutical industry for single-use bioreactors. The company offers an extensive selection of bioreactors, including agitated, bubble column, and wave-mixed models. Merck's commitment to research and development, combined with its global presence, positions it as a market leader.
GE Healthcare is a major participant in the single-use bioreactors market, offering a variety of bioreactor systems and consumables. The company's bioreactors are designed to accommodate a variety of applications, including cell culture and fermentation. The bioprocessing technologies expertise and global presence of GE Healthcare contribute to its market competitiveness.
Eppendorf AG is a prominent provider of single-use bioreactors for biopharmaceutical applications. The company offers a variety of bioreactor systems, such as agitated bioreactors with sophisticated control capabilities. Eppendorf's dedication to product innovation, quality, and customer-centricity distinguishes it as a market leader.
Applikon Biotechnology is an industry leader in the provision of single-use bioreactor systems and accouterments. The company provides an extensive selection of agitated bioreactors with sophisticated monitoring and control features. Applikon Biotechnology's market position is bolstered by its emphasis on customer satisfaction, technological advancements, and strong presence in the bioprocessing industry.
Top Key Players in Single-Use Bioreactors Market
- Sartorius Stedim Biotech
- Merck Millipore
- GE Healthcare
- Danaher
- Thermo Fisher Scientific
- Parker Hannifin
- Applikon Biotechnology
- Eppendorf
- Cesco Bioengineering
- Cellexus
- Celltainer Biotech
- PBS Biotech
- Distek
- Solida Biotech
- Pierre Guerin
Recent Development
- In 2020, Sartorius AG, a German biotech equipment and services provider, acquired the dominant stake in kSep Systems, an American single-use bioreactor company. The acquisition is anticipated to strengthen Sartorius' position in the single-use bioreactor market and enable the company to provide its customers with a wider selection of innovative products and services.
- In 2019, GE Healthcare, a subsidiary of General Electric Company and a prominent global provider of medical technologies and services, added the Xcellerex XDR 10 bioreactor to its portfolio of single-use bioreactors. The new product is designed to satisfy the increasing demand for flexible, efficient, and cost-effective solutions in the biotechnology industry.
- In 2018, Merck KGaA, a German multinational pharmaceutical, chemical, and life sciences corporation, acquired Biochrom AG, the foremost manufacturer of single-use bioreactors. The acquisition was part of Merck's plan to expand its biopharmaceutical portfolio and bolster its position in the life sciences industry.
- In 2017, the foremost provider of laboratory equipment and services, Eppendorf AG, introduced the BioBLU 5p single-use bioreactor for microbial fermentation. The product provides scalable, cost-effective, and high-quality solutions for cell culture production, and it has been well-received by the biotechnology industry.
Report Scope
Report Features Description Market Value (2022) USD 3.9 Bn Forecast Revenue (2032) USD 15.4 Bn CAGR (2023-2032) 15.1% Base Year for Estimation 2022 Historic Period 2016-2022 Forecast Period 2023-2032 Report Coverage Revenue Forecast, Market Dynamics, COVID-19 Impact, Competitive Landscape, Recent Developments Segments Covered By Product Type (Stirred, Bubble Column, Wave-Mixed)
By Cell Type (Mammalian Cells, Bacterial Cells, Yeast Cells, Other)
By Molecule Type (Monoclonal Antibodies (Mabs), Vaccines, Stem Cells, Gene-Modified Cells, Other)
By Application (Biopharmaceutical, Biotechnology, Others)Regional Analysis North America – The US, Canada, & Mexico; Western Europe – Germany, France, The UK, Spain, Italy, Portugal, Ireland, Austria, Switzerland, Benelux, Nordic, & Rest of Western Europe; Eastern Europe – Russia, Poland, The Czech Republic, Greece, & Rest of Eastern Europe; APAC – China, Japan, South Korea, India, Australia & New Zealand, Indonesia, Malaysia, Philippines, Singapore, Thailand, Vietnam, & Rest of APAC; Latin America – Brazil, Colombia, Chile, Argentina, Costa Rica, & Rest of Latin America; the Middle East & Africa – Algeria, Egypt, Israel, Kuwait, Nigeria, Saudi Arabia, South Africa, Turkey, United Arab Emirates, & Rest of MEA Competitive Landscape Sartorius Stedim Biotech, Merck Millipore, GE Healthcare, Danaher, Thermo Fisher Scientific, Parker Hannifin, Applikon Biotechnology, Eppendorf, Cesco Bioengineering, Cellexus, Celltainer Biotech, PBS Biotech, Distek, Solida Biotech, Pierre Guerin Customization Scope Customization for segments, region/country-level will be provided. Moreover, additional customization can be done based on the requirements. Purchase Options We have three licenses to opt for Single-User License, Multi-User License (Up to 5 Users), Corporate Use License (Unlimited User and Printable PDF) -
- 1. Executive Summary
- 1.1. Definition
- 1.2. Taxonomy
- 1.3. Research Scope
- 1.4. Key Analysis
- 1.5. Key Findings by Major Segments
- 1.6. Top strategies by Major Players
- 2. Global Single Use Bioreactors Market Overview
- 2.1. Single Use Bioreactors Market Dynamics
- 2.1.1. Drivers
- 2.1.2. Opportunities
- 2.1.3. Restraints
- 2.1.4. Challenges
- 2.2. Macro-economic Factors
- 2.3. Regulatory Framework
- 2.4. Market Investment Feasibility Index
- 2.5. PEST Analysis
- 2.6. PORTER’S Five Force Analysis
- 2.7. Drivers & Restraints Impact Analysis
- 2.8. Industry Chain Analysis
- 2.9. Cost Structure Analysis
- 2.10. Marketing Strategy
- 2.11. Russia-Ukraine War Impact Analysis
- 2.12. Opportunity Map Analysis
- 2.13. Market Competition Scenario Analysis
- 2.14. Product Life Cycle Analysis
- 2.15. Opportunity Orbits
- 2.16. Manufacturer Intensity Map
- 2.17. Major Companies sales by Value & Volume
- 2.1. Single Use Bioreactors Market Dynamics
- 3. Global Single Use Bioreactors Market Analysis, Opportunity and Forecast, 2016-2032
- 3.1. Global Single Use Bioreactors Market Analysis, 2016-2021
- 3.2. Global Single Use Bioreactors Market Opportunity and Forecast, 2023-2032
- 3.3. Global Single Use Bioreactors Market Analysis, Opportunity and Forecast, By By Product Type, 2016-2032
- 3.3.1. Global Single Use Bioreactors Market Analysis By Product Type: Introduction
- 3.3.2. Market Size Absolute $ Opportunity Analysis and Forecast, By By Product Type, 2016-2032
- 3.3.3. Stirred
- 3.3.4. Bubble Column
- 3.3.5. Wave-Mixed
- 3.4. Global Single Use Bioreactors Market Analysis, Opportunity and Forecast, By By Cell Type, 2016-2032
- 3.4.1. Global Single Use Bioreactors Market Analysis By Cell Type: Introduction
- 3.4.2. Market Size Absolute $ Opportunity Analysis and Forecast, By By Cell Type, 2016-2032
- 3.4.3. Mammalian Cells
- 3.4.4. Bacterial Cells
- 3.4.5. Yeast Cells
- 3.4.6. Other
- 3.5. Global Single Use Bioreactors Market Analysis, Opportunity and Forecast, By By Molecule Type, 2016-2032
- 3.5.1. Global Single Use Bioreactors Market Analysis By Molecule Type: Introduction
- 3.5.2. Market Size Absolute $ Opportunity Analysis and Forecast, By By Molecule Type, 2016-2032
- 3.5.3. Monoclonal Antibodies (Mabs)
- 3.5.4. Vaccines
- 3.5.5. Stem Cells
- 3.5.6. Gene-Modified Cells
- 3.5.7. Other
- 3.6. Global Single Use Bioreactors Market Analysis, Opportunity and Forecast, By By Application, 2016-2032
- 3.6.1. Global Single Use Bioreactors Market Analysis By Application: Introduction
- 3.6.2. Market Size Absolute $ Opportunity Analysis and Forecast, By By Application, 2016-2032
- 3.6.3. Biopharmaceutical
- 3.6.4. Biotechnology
- 3.6.5. Others
- 4. North America Single Use Bioreactors Market Analysis, Opportunity and Forecast, 2016-2032
- 4.1. North America Single Use Bioreactors Market Analysis, 2016-2021
- 4.2. North America Single Use Bioreactors Market Opportunity and Forecast, 2023-2032
- 4.3. North America Single Use Bioreactors Market Analysis, Opportunity and Forecast, By By Product Type, 2016-2032
- 4.3.1. North America Single Use Bioreactors Market Analysis By Product Type: Introduction
- 4.3.2. Market Size Absolute $ Opportunity Analysis and Forecast, By By Product Type, 2016-2032
- 4.3.3. Stirred
- 4.3.4. Bubble Column
- 4.3.5. Wave-Mixed
- 4.4. North America Single Use Bioreactors Market Analysis, Opportunity and Forecast, By By Cell Type, 2016-2032
- 4.4.1. North America Single Use Bioreactors Market Analysis By Cell Type: Introduction
- 4.4.2. Market Size Absolute $ Opportunity Analysis and Forecast, By By Cell Type, 2016-2032
- 4.4.3. Mammalian Cells
- 4.4.4. Bacterial Cells
- 4.4.5. Yeast Cells
- 4.4.6. Other
- 4.5. North America Single Use Bioreactors Market Analysis, Opportunity and Forecast, By By Molecule Type, 2016-2032
- 4.5.1. North America Single Use Bioreactors Market Analysis By Molecule Type: Introduction
- 4.5.2. Market Size Absolute $ Opportunity Analysis and Forecast, By By Molecule Type, 2016-2032
- 4.5.3. Monoclonal Antibodies (Mabs)
- 4.5.4. Vaccines
- 4.5.5. Stem Cells
- 4.5.6. Gene-Modified Cells
- 4.5.7. Other
- 4.6. North America Single Use Bioreactors Market Analysis, Opportunity and Forecast, By By Application, 2016-2032
- 4.6.1. North America Single Use Bioreactors Market Analysis By Application: Introduction
- 4.6.2. Market Size Absolute $ Opportunity Analysis and Forecast, By By Application, 2016-2032
- 4.6.3. Biopharmaceutical
- 4.6.4. Biotechnology
- 4.6.5. Others
- 4.7. North America Single Use Bioreactors Market Analysis, Opportunity and Forecast, By Country , 2016-2032
- 4.7.1. North America Single Use Bioreactors Market Analysis by Country : Introduction
- 4.7.2. Market Size Absolute $ Opportunity Analysis and Forecast, Country , 2016-2032
- 4.7.2.1. The US
- 4.7.2.2. Canada
- 4.7.2.3. Mexico
- 5. Western Europe Single Use Bioreactors Market Analysis, Opportunity and Forecast, 2016-2032
- 5.1. Western Europe Single Use Bioreactors Market Analysis, 2016-2021
- 5.2. Western Europe Single Use Bioreactors Market Opportunity and Forecast, 2023-2032
- 5.3. Western Europe Single Use Bioreactors Market Analysis, Opportunity and Forecast, By By Product Type, 2016-2032
- 5.3.1. Western Europe Single Use Bioreactors Market Analysis By Product Type: Introduction
- 5.3.2. Market Size Absolute $ Opportunity Analysis and Forecast, By By Product Type, 2016-2032
- 5.3.3. Stirred
- 5.3.4. Bubble Column
- 5.3.5. Wave-Mixed
- 5.4. Western Europe Single Use Bioreactors Market Analysis, Opportunity and Forecast, By By Cell Type, 2016-2032
- 5.4.1. Western Europe Single Use Bioreactors Market Analysis By Cell Type: Introduction
- 5.4.2. Market Size Absolute $ Opportunity Analysis and Forecast, By By Cell Type, 2016-2032
- 5.4.3. Mammalian Cells
- 5.4.4. Bacterial Cells
- 5.4.5. Yeast Cells
- 5.4.6. Other
- 5.5. Western Europe Single Use Bioreactors Market Analysis, Opportunity and Forecast, By By Molecule Type, 2016-2032
- 5.5.1. Western Europe Single Use Bioreactors Market Analysis By Molecule Type: Introduction
- 5.5.2. Market Size Absolute $ Opportunity Analysis and Forecast, By By Molecule Type, 2016-2032
- 5.5.3. Monoclonal Antibodies (Mabs)
- 5.5.4. Vaccines
- 5.5.5. Stem Cells
- 5.5.6. Gene-Modified Cells
- 5.5.7. Other
- 5.6. Western Europe Single Use Bioreactors Market Analysis, Opportunity and Forecast, By By Application, 2016-2032
- 5.6.1. Western Europe Single Use Bioreactors Market Analysis By Application: Introduction
- 5.6.2. Market Size Absolute $ Opportunity Analysis and Forecast, By By Application, 2016-2032
- 5.6.3. Biopharmaceutical
- 5.6.4. Biotechnology
- 5.6.5. Others
- 5.7. Western Europe Single Use Bioreactors Market Analysis, Opportunity and Forecast, By Country , 2016-2032
- 5.7.1. Western Europe Single Use Bioreactors Market Analysis by Country : Introduction
- 5.7.2. Market Size Absolute $ Opportunity Analysis and Forecast, Country , 2016-2032
- 5.7.2.1. Germany
- 5.7.2.2. France
- 5.7.2.3. The UK
- 5.7.2.4. Spain
- 5.7.2.5. Italy
- 5.7.2.6. Portugal
- 5.7.2.7. Ireland
- 5.7.2.8. Austria
- 5.7.2.9. Switzerland
- 5.7.2.10. Benelux
- 5.7.2.11. Nordic
- 5.7.2.12. Rest of Western Europe
- 6. Eastern Europe Single Use Bioreactors Market Analysis, Opportunity and Forecast, 2016-2032
- 6.1. Eastern Europe Single Use Bioreactors Market Analysis, 2016-2021
- 6.2. Eastern Europe Single Use Bioreactors Market Opportunity and Forecast, 2023-2032
- 6.3. Eastern Europe Single Use Bioreactors Market Analysis, Opportunity and Forecast, By By Product Type, 2016-2032
- 6.3.1. Eastern Europe Single Use Bioreactors Market Analysis By Product Type: Introduction
- 6.3.2. Market Size Absolute $ Opportunity Analysis and Forecast, By By Product Type, 2016-2032
- 6.3.3. Stirred
- 6.3.4. Bubble Column
- 6.3.5. Wave-Mixed
- 6.4. Eastern Europe Single Use Bioreactors Market Analysis, Opportunity and Forecast, By By Cell Type, 2016-2032
- 6.4.1. Eastern Europe Single Use Bioreactors Market Analysis By Cell Type: Introduction
- 6.4.2. Market Size Absolute $ Opportunity Analysis and Forecast, By By Cell Type, 2016-2032
- 6.4.3. Mammalian Cells
- 6.4.4. Bacterial Cells
- 6.4.5. Yeast Cells
- 6.4.6. Other
- 6.5. Eastern Europe Single Use Bioreactors Market Analysis, Opportunity and Forecast, By By Molecule Type, 2016-2032
- 6.5.1. Eastern Europe Single Use Bioreactors Market Analysis By Molecule Type: Introduction
- 6.5.2. Market Size Absolute $ Opportunity Analysis and Forecast, By By Molecule Type, 2016-2032
- 6.5.3. Monoclonal Antibodies (Mabs)
- 6.5.4. Vaccines
- 6.5.5. Stem Cells
- 6.5.6. Gene-Modified Cells
- 6.5.7. Other
- 6.6. Eastern Europe Single Use Bioreactors Market Analysis, Opportunity and Forecast, By By Application, 2016-2032
- 6.6.1. Eastern Europe Single Use Bioreactors Market Analysis By Application: Introduction
- 6.6.2. Market Size Absolute $ Opportunity Analysis and Forecast, By By Application, 2016-2032
- 6.6.3. Biopharmaceutical
- 6.6.4. Biotechnology
- 6.6.5. Others
- 6.7. Eastern Europe Single Use Bioreactors Market Analysis, Opportunity and Forecast, By Country , 2016-2032
- 6.7.1. Eastern Europe Single Use Bioreactors Market Analysis by Country : Introduction
- 6.7.2. Market Size Absolute $ Opportunity Analysis and Forecast, Country , 2016-2032
- 6.7.2.1. Russia
- 6.7.2.2. Poland
- 6.7.2.3. The Czech Republic
- 6.7.2.4. Greece
- 6.7.2.5. Rest of Eastern Europe
- 7. APAC Single Use Bioreactors Market Analysis, Opportunity and Forecast, 2016-2032
- 7.1. APAC Single Use Bioreactors Market Analysis, 2016-2021
- 7.2. APAC Single Use Bioreactors Market Opportunity and Forecast, 2023-2032
- 7.3. APAC Single Use Bioreactors Market Analysis, Opportunity and Forecast, By By Product Type, 2016-2032
- 7.3.1. APAC Single Use Bioreactors Market Analysis By Product Type: Introduction
- 7.3.2. Market Size Absolute $ Opportunity Analysis and Forecast, By By Product Type, 2016-2032
- 7.3.3. Stirred
- 7.3.4. Bubble Column
- 7.3.5. Wave-Mixed
- 7.4. APAC Single Use Bioreactors Market Analysis, Opportunity and Forecast, By By Cell Type, 2016-2032
- 7.4.1. APAC Single Use Bioreactors Market Analysis By Cell Type: Introduction
- 7.4.2. Market Size Absolute $ Opportunity Analysis and Forecast, By By Cell Type, 2016-2032
- 7.4.3. Mammalian Cells
- 7.4.4. Bacterial Cells
- 7.4.5. Yeast Cells
- 7.4.6. Other
- 7.5. APAC Single Use Bioreactors Market Analysis, Opportunity and Forecast, By By Molecule Type, 2016-2032
- 7.5.1. APAC Single Use Bioreactors Market Analysis By Molecule Type: Introduction
- 7.5.2. Market Size Absolute $ Opportunity Analysis and Forecast, By By Molecule Type, 2016-2032
- 7.5.3. Monoclonal Antibodies (Mabs)
- 7.5.4. Vaccines
- 7.5.5. Stem Cells
- 7.5.6. Gene-Modified Cells
- 7.5.7. Other
- 7.6. APAC Single Use Bioreactors Market Analysis, Opportunity and Forecast, By By Application, 2016-2032
- 7.6.1. APAC Single Use Bioreactors Market Analysis By Application: Introduction
- 7.6.2. Market Size Absolute $ Opportunity Analysis and Forecast, By By Application, 2016-2032
- 7.6.3. Biopharmaceutical
- 7.6.4. Biotechnology
- 7.6.5. Others
- 7.7. APAC Single Use Bioreactors Market Analysis, Opportunity and Forecast, By Country , 2016-2032
- 7.7.1. APAC Single Use Bioreactors Market Analysis by Country : Introduction
- 7.7.2. Market Size Absolute $ Opportunity Analysis and Forecast, Country , 2016-2032
- 7.7.2.1. China
- 7.7.2.2. Japan
- 7.7.2.3. South Korea
- 7.7.2.4. India
- 7.7.2.5. Australia & New Zeland
- 7.7.2.6. Indonesia
- 7.7.2.7. Malaysia
- 7.7.2.8. Philippines
- 7.7.2.9. Singapore
- 7.7.2.10. Thailand
- 7.7.2.11. Vietnam
- 7.7.2.12. Rest of APAC
- 8. Latin America Single Use Bioreactors Market Analysis, Opportunity and Forecast, 2016-2032
- 8.1. Latin America Single Use Bioreactors Market Analysis, 2016-2021
- 8.2. Latin America Single Use Bioreactors Market Opportunity and Forecast, 2023-2032
- 8.3. Latin America Single Use Bioreactors Market Analysis, Opportunity and Forecast, By By Product Type, 2016-2032
- 8.3.1. Latin America Single Use Bioreactors Market Analysis By Product Type: Introduction
- 8.3.2. Market Size Absolute $ Opportunity Analysis and Forecast, By By Product Type, 2016-2032
- 8.3.3. Stirred
- 8.3.4. Bubble Column
- 8.3.5. Wave-Mixed
- 8.4. Latin America Single Use Bioreactors Market Analysis, Opportunity and Forecast, By By Cell Type, 2016-2032
- 8.4.1. Latin America Single Use Bioreactors Market Analysis By Cell Type: Introduction
- 8.4.2. Market Size Absolute $ Opportunity Analysis and Forecast, By By Cell Type, 2016-2032
- 8.4.3. Mammalian Cells
- 8.4.4. Bacterial Cells
- 8.4.5. Yeast Cells
- 8.4.6. Other
- 8.5. Latin America Single Use Bioreactors Market Analysis, Opportunity and Forecast, By By Molecule Type, 2016-2032
- 8.5.1. Latin America Single Use Bioreactors Market Analysis By Molecule Type: Introduction
- 8.5.2. Market Size Absolute $ Opportunity Analysis and Forecast, By By Molecule Type, 2016-2032
- 8.5.3. Monoclonal Antibodies (Mabs)
- 8.5.4. Vaccines
- 8.5.5. Stem Cells
- 8.5.6. Gene-Modified Cells
- 8.5.7. Other
- 8.6. Latin America Single Use Bioreactors Market Analysis, Opportunity and Forecast, By By Application, 2016-2032
- 8.6.1. Latin America Single Use Bioreactors Market Analysis By Application: Introduction
- 8.6.2. Market Size Absolute $ Opportunity Analysis and Forecast, By By Application, 2016-2032
- 8.6.3. Biopharmaceutical
- 8.6.4. Biotechnology
- 8.6.5. Others
- 8.7. Latin America Single Use Bioreactors Market Analysis, Opportunity and Forecast, By Country , 2016-2032
- 8.7.1. Latin America Single Use Bioreactors Market Analysis by Country : Introduction
- 8.7.2. Market Size Absolute $ Opportunity Analysis and Forecast, Country , 2016-2032
- 8.7.2.1. Brazil
- 8.7.2.2. Colombia
- 8.7.2.3. Chile
- 8.7.2.4. Argentina
- 8.7.2.5. Costa Rica
- 8.7.2.6. Rest of Latin America
- 9. Middle East & Africa Single Use Bioreactors Market Analysis, Opportunity and Forecast, 2016-2032
- 9.1. Middle East & Africa Single Use Bioreactors Market Analysis, 2016-2021
- 9.2. Middle East & Africa Single Use Bioreactors Market Opportunity and Forecast, 2023-2032
- 9.3. Middle East & Africa Single Use Bioreactors Market Analysis, Opportunity and Forecast, By By Product Type, 2016-2032
- 9.3.1. Middle East & Africa Single Use Bioreactors Market Analysis By Product Type: Introduction
- 9.3.2. Market Size Absolute $ Opportunity Analysis and Forecast, By By Product Type, 2016-2032
- 9.3.3. Stirred
- 9.3.4. Bubble Column
- 9.3.5. Wave-Mixed
- 9.4. Middle East & Africa Single Use Bioreactors Market Analysis, Opportunity and Forecast, By By Cell Type, 2016-2032
- 9.4.1. Middle East & Africa Single Use Bioreactors Market Analysis By Cell Type: Introduction
- 9.4.2. Market Size Absolute $ Opportunity Analysis and Forecast, By By Cell Type, 2016-2032
- 9.4.3. Mammalian Cells
- 9.4.4. Bacterial Cells
- 9.4.5. Yeast Cells
- 9.4.6. Other
- 9.5. Middle East & Africa Single Use Bioreactors Market Analysis, Opportunity and Forecast, By By Molecule Type, 2016-2032
- 9.5.1. Middle East & Africa Single Use Bioreactors Market Analysis By Molecule Type: Introduction
- 9.5.2. Market Size Absolute $ Opportunity Analysis and Forecast, By By Molecule Type, 2016-2032
- 9.5.3. Monoclonal Antibodies (Mabs)
- 9.5.4. Vaccines
- 9.5.5. Stem Cells
- 9.5.6. Gene-Modified Cells
- 9.5.7. Other
- 9.6. Middle East & Africa Single Use Bioreactors Market Analysis, Opportunity and Forecast, By By Application, 2016-2032
- 9.6.1. Middle East & Africa Single Use Bioreactors Market Analysis By Application: Introduction
- 9.6.2. Market Size Absolute $ Opportunity Analysis and Forecast, By By Application, 2016-2032
- 9.6.3. Biopharmaceutical
- 9.6.4. Biotechnology
- 9.6.5. Others
- 9.7. Middle East & Africa Single Use Bioreactors Market Analysis, Opportunity and Forecast, By Country , 2016-2032
- 9.7.1. Middle East & Africa Single Use Bioreactors Market Analysis by Country : Introduction
- 9.7.2. Market Size Absolute $ Opportunity Analysis and Forecast, Country , 2016-2032
- 9.7.2.1. Algeria
- 9.7.2.2. Egypt
- 9.7.2.3. Israel
- 9.7.2.4. Kuwait
- 9.7.2.5. Nigeria
- 9.7.2.6. Saudi Arabia
- 9.7.2.7. South Africa
- 9.7.2.8. Turkey
- 9.7.2.9. The UAE
- 9.7.2.10. Rest of MEA
- 10. Global Single Use Bioreactors Market Analysis, Opportunity and Forecast, By Region , 2016-2032
- 10.1. Global Single Use Bioreactors Market Analysis by Region : Introduction
- 10.2. Market Size Absolute $ Opportunity Analysis and Forecast, By Region , 2016-2032
- 10.2.1. North America
- 10.2.2. Western Europe
- 10.2.3. Eastern Europe
- 10.2.4. APAC
- 10.2.5. Latin America
- 10.2.6. Middle East & Africa
- 11. Global Single Use Bioreactors Market Competitive Landscape, Market Share Analysis, and Company Profiles
- 11.1. Market Share Analysis
- 11.2. Company Profiles
- 11.3. Sartorius Stedim Biotech
- 11.3.1. Company Overview
- 11.3.2. Financial Highlights
- 11.3.3. Product Portfolio
- 11.3.4. SWOT Analysis
- 11.3.5. Key Strategies and Developments
- 11.4. Merck Millipore
- 11.4.1. Company Overview
- 11.4.2. Financial Highlights
- 11.4.3. Product Portfolio
- 11.4.4. SWOT Analysis
- 11.4.5. Key Strategies and Developments
- 11.5. GE Healthcare
- 11.5.1. Company Overview
- 11.5.2. Financial Highlights
- 11.5.3. Product Portfolio
- 11.5.4. SWOT Analysis
- 11.5.5. Key Strategies and Developments
- 11.6. Danaher
- 11.6.1. Company Overview
- 11.6.2. Financial Highlights
- 11.6.3. Product Portfolio
- 11.6.4. SWOT Analysis
- 11.6.5. Key Strategies and Developments
- 11.7. Thermo Fisher Scientific
- 11.7.1. Company Overview
- 11.7.2. Financial Highlights
- 11.7.3. Product Portfolio
- 11.7.4. SWOT Analysis
- 11.7.5. Key Strategies and Developments
- 11.8. Parker Hannifin
- 11.8.1. Company Overview
- 11.8.2. Financial Highlights
- 11.8.3. Product Portfolio
- 11.8.4. SWOT Analysis
- 11.8.5. Key Strategies and Developments
- 11.9. Applikon Biotechnology
- 11.9.1. Company Overview
- 11.9.2. Financial Highlights
- 11.9.3. Product Portfolio
- 11.9.4. SWOT Analysis
- 11.9.5. Key Strategies and Developments
- 11.10. Eppendorf
- 11.10.1. Company Overview
- 11.10.2. Financial Highlights
- 11.10.3. Product Portfolio
- 11.10.4. SWOT Analysis
- 11.10.5. Key Strategies and Developments
- 11.11. Cesco Bioengineering
- 11.11.1. Company Overview
- 11.11.2. Financial Highlights
- 11.11.3. Product Portfolio
- 11.11.4. SWOT Analysis
- 11.11.5. Key Strategies and Developments
- 11.12. Cellexus
- 11.12.1. Company Overview
- 11.12.2. Financial Highlights
- 11.12.3. Product Portfolio
- 11.12.4. SWOT Analysis
- 11.12.5. Key Strategies and Developments
- 11.13. Celltainer Biotech
- 11.13.1. Company Overview
- 11.13.2. Financial Highlights
- 11.13.3. Product Portfolio
- 11.13.4. SWOT Analysis
- 11.13.5. Key Strategies and Developments
- 11.14. PBS Biotech
- 11.14.1. Company Overview
- 11.14.2. Financial Highlights
- 11.14.3. Product Portfolio
- 11.14.4. SWOT Analysis
- 11.14.5. Key Strategies and Developments
- 11.15. Distek
- 11.15.1. Company Overview
- 11.15.2. Financial Highlights
- 11.15.3. Product Portfolio
- 11.15.4. SWOT Analysis
- 11.15.5. Key Strategies and Developments
- 11.16. Solida Biotech
- 11.16.1. Company Overview
- 11.16.2. Financial Highlights
- 11.16.3. Product Portfolio
- 11.16.4. SWOT Analysis
- 11.16.5. Key Strategies and Developments
- 11.17. Pierre Guerin
- 11.17.1. Company Overview
- 11.17.2. Financial Highlights
- 11.17.3. Product Portfolio
- 11.17.4. SWOT Analysis
- 11.17.5. Key Strategies and Developments
- 12. Assumptions and Acronyms
- 13. Research Methodology
- 14. Contact
List of Figures
- Figure 1: Global Single Use Bioreactors Market Revenue (US$ Mn) Market Share By Product Type in 2022
- Figure 2: Global Single Use Bioreactors Market Attractiveness Analysis By Product Type, 2016-2032
- Figure 3: Global Single Use Bioreactors Market Revenue (US$ Mn) Market Share By Cell Typein 2022
- Figure 4: Global Single Use Bioreactors Market Attractiveness Analysis By Cell Type, 2016-2032
- Figure 5: Global Single Use Bioreactors Market Revenue (US$ Mn) Market Share By Molecule Typein 2022
- Figure 6: Global Single Use Bioreactors Market Attractiveness Analysis By Molecule Type, 2016-2032
- Figure 7: Global Single Use Bioreactors Market Revenue (US$ Mn) Market Share By Applicationin 2022
- Figure 8: Global Single Use Bioreactors Market Attractiveness Analysis By Application, 2016-2032
- Figure 9: Global Single Use Bioreactors Market Revenue (US$ Mn) Market Share by Region in 2022
- Figure 10: Global Single Use Bioreactors Market Attractiveness Analysis by Region, 2016-2032
- Figure 11: Global Single Use Bioreactors Market Revenue (US$ Mn) (2016-2032)
- Figure 12: Global Single Use Bioreactors Market Revenue (US$ Mn) Comparison by Region (2016-2032)
- Figure 13: Global Single Use Bioreactors Market Revenue (US$ Mn) Comparison By Product Type (2016-2032)
- Figure 14: Global Single Use Bioreactors Market Revenue (US$ Mn) Comparison By Cell Type (2016-2032)
- Figure 15: Global Single Use Bioreactors Market Revenue (US$ Mn) Comparison By Molecule Type (2016-2032)
- Figure 16: Global Single Use Bioreactors Market Revenue (US$ Mn) Comparison By Application (2016-2032)
- Figure 17: Global Single Use Bioreactors Market Y-o-Y Growth Rate Comparison by Region (2016-2032)
- Figure 18: Global Single Use Bioreactors Market Y-o-Y Growth Rate Comparison By Product Type (2016-2032)
- Figure 19: Global Single Use Bioreactors Market Y-o-Y Growth Rate Comparison By Cell Type (2016-2032)
- Figure 20: Global Single Use Bioreactors Market Y-o-Y Growth Rate Comparison By Molecule Type (2016-2032)
- Figure 21: Global Single Use Bioreactors Market Y-o-Y Growth Rate Comparison By Application (2016-2032)
- Figure 22: Global Single Use Bioreactors Market Share Comparison by Region (2016-2032)
- Figure 23: Global Single Use Bioreactors Market Share Comparison By Product Type (2016-2032)
- Figure 24: Global Single Use Bioreactors Market Share Comparison By Cell Type (2016-2032)
- Figure 25: Global Single Use Bioreactors Market Share Comparison By Molecule Type (2016-2032)
- Figure 26: Global Single Use Bioreactors Market Share Comparison By Application (2016-2032)
- Figure 27: North America Single Use Bioreactors Market Revenue (US$ Mn) Market Share By Product Typein 2022
- Figure 28: North America Single Use Bioreactors Market Attractiveness Analysis By Product Type, 2016-2032
- Figure 29: North America Single Use Bioreactors Market Revenue (US$ Mn) Market Share By Cell Typein 2022
- Figure 30: North America Single Use Bioreactors Market Attractiveness Analysis By Cell Type, 2016-2032
- Figure 31: North America Single Use Bioreactors Market Revenue (US$ Mn) Market Share By Molecule Typein 2022
- Figure 32: North America Single Use Bioreactors Market Attractiveness Analysis By Molecule Type, 2016-2032
- Figure 33: North America Single Use Bioreactors Market Revenue (US$ Mn) Market Share By Applicationin 2022
- Figure 34: North America Single Use Bioreactors Market Attractiveness Analysis By Application, 2016-2032
- Figure 35: North America Single Use Bioreactors Market Revenue (US$ Mn) Market Share by Country in 2022
- Figure 36: North America Single Use Bioreactors Market Attractiveness Analysis by Country, 2016-2032
- Figure 37: North America Single Use Bioreactors Market Revenue (US$ Mn) (2016-2032)
- Figure 38: North America Single Use Bioreactors Market Revenue (US$ Mn) Comparison by Country (2016-2032)
- Figure 39: North America Single Use Bioreactors Market Revenue (US$ Mn) Comparison By Product Type (2016-2032)
- Figure 40: North America Single Use Bioreactors Market Revenue (US$ Mn) Comparison By Cell Type (2016-2032)
- Figure 41: North America Single Use Bioreactors Market Revenue (US$ Mn) Comparison By Molecule Type (2016-2032)
- Figure 42: North America Single Use Bioreactors Market Revenue (US$ Mn) Comparison By Application (2016-2032)
- Figure 43: North America Single Use Bioreactors Market Y-o-Y Growth Rate Comparison by Country (2016-2032)
- Figure 44: North America Single Use Bioreactors Market Y-o-Y Growth Rate Comparison By Product Type (2016-2032)
- Figure 45: North America Single Use Bioreactors Market Y-o-Y Growth Rate Comparison By Cell Type (2016-2032)
- Figure 46: North America Single Use Bioreactors Market Y-o-Y Growth Rate Comparison By Molecule Type (2016-2032)
- Figure 47: North America Single Use Bioreactors Market Y-o-Y Growth Rate Comparison By Application (2016-2032)
- Figure 48: North America Single Use Bioreactors Market Share Comparison by Country (2016-2032)
- Figure 49: North America Single Use Bioreactors Market Share Comparison By Product Type (2016-2032)
- Figure 50: North America Single Use Bioreactors Market Share Comparison By Cell Type (2016-2032)
- Figure 51: North America Single Use Bioreactors Market Share Comparison By Molecule Type (2016-2032)
- Figure 52: North America Single Use Bioreactors Market Share Comparison By Application (2016-2032)
- Figure 53: Western Europe Single Use Bioreactors Market Revenue (US$ Mn) Market Share By Product Typein 2022
- Figure 54: Western Europe Single Use Bioreactors Market Attractiveness Analysis By Product Type, 2016-2032
- Figure 55: Western Europe Single Use Bioreactors Market Revenue (US$ Mn) Market Share By Cell Typein 2022
- Figure 56: Western Europe Single Use Bioreactors Market Attractiveness Analysis By Cell Type, 2016-2032
- Figure 57: Western Europe Single Use Bioreactors Market Revenue (US$ Mn) Market Share By Molecule Typein 2022
- Figure 58: Western Europe Single Use Bioreactors Market Attractiveness Analysis By Molecule Type, 2016-2032
- Figure 59: Western Europe Single Use Bioreactors Market Revenue (US$ Mn) Market Share By Applicationin 2022
- Figure 60: Western Europe Single Use Bioreactors Market Attractiveness Analysis By Application, 2016-2032
- Figure 61: Western Europe Single Use Bioreactors Market Revenue (US$ Mn) Market Share by Country in 2022
- Figure 62: Western Europe Single Use Bioreactors Market Attractiveness Analysis by Country, 2016-2032
- Figure 63: Western Europe Single Use Bioreactors Market Revenue (US$ Mn) (2016-2032)
- Figure 64: Western Europe Single Use Bioreactors Market Revenue (US$ Mn) Comparison by Country (2016-2032)
- Figure 65: Western Europe Single Use Bioreactors Market Revenue (US$ Mn) Comparison By Product Type (2016-2032)
- Figure 66: Western Europe Single Use Bioreactors Market Revenue (US$ Mn) Comparison By Cell Type (2016-2032)
- Figure 67: Western Europe Single Use Bioreactors Market Revenue (US$ Mn) Comparison By Molecule Type (2016-2032)
- Figure 68: Western Europe Single Use Bioreactors Market Revenue (US$ Mn) Comparison By Application (2016-2032)
- Figure 69: Western Europe Single Use Bioreactors Market Y-o-Y Growth Rate Comparison by Country (2016-2032)
- Figure 70: Western Europe Single Use Bioreactors Market Y-o-Y Growth Rate Comparison By Product Type (2016-2032)
- Figure 71: Western Europe Single Use Bioreactors Market Y-o-Y Growth Rate Comparison By Cell Type (2016-2032)
- Figure 72: Western Europe Single Use Bioreactors Market Y-o-Y Growth Rate Comparison By Molecule Type (2016-2032)
- Figure 73: Western Europe Single Use Bioreactors Market Y-o-Y Growth Rate Comparison By Application (2016-2032)
- Figure 74: Western Europe Single Use Bioreactors Market Share Comparison by Country (2016-2032)
- Figure 75: Western Europe Single Use Bioreactors Market Share Comparison By Product Type (2016-2032)
- Figure 76: Western Europe Single Use Bioreactors Market Share Comparison By Cell Type (2016-2032)
- Figure 77: Western Europe Single Use Bioreactors Market Share Comparison By Molecule Type (2016-2032)
- Figure 78: Western Europe Single Use Bioreactors Market Share Comparison By Application (2016-2032)
- Figure 79: Eastern Europe Single Use Bioreactors Market Revenue (US$ Mn) Market Share By Product Typein 2022
- Figure 80: Eastern Europe Single Use Bioreactors Market Attractiveness Analysis By Product Type, 2016-2032
- Figure 81: Eastern Europe Single Use Bioreactors Market Revenue (US$ Mn) Market Share By Cell Typein 2022
- Figure 82: Eastern Europe Single Use Bioreactors Market Attractiveness Analysis By Cell Type, 2016-2032
- Figure 83: Eastern Europe Single Use Bioreactors Market Revenue (US$ Mn) Market Share By Molecule Typein 2022
- Figure 84: Eastern Europe Single Use Bioreactors Market Attractiveness Analysis By Molecule Type, 2016-2032
- Figure 85: Eastern Europe Single Use Bioreactors Market Revenue (US$ Mn) Market Share By Applicationin 2022
- Figure 86: Eastern Europe Single Use Bioreactors Market Attractiveness Analysis By Application, 2016-2032
- Figure 87: Eastern Europe Single Use Bioreactors Market Revenue (US$ Mn) Market Share by Country in 2022
- Figure 88: Eastern Europe Single Use Bioreactors Market Attractiveness Analysis by Country, 2016-2032
- Figure 89: Eastern Europe Single Use Bioreactors Market Revenue (US$ Mn) (2016-2032)
- Figure 90: Eastern Europe Single Use Bioreactors Market Revenue (US$ Mn) Comparison by Country (2016-2032)
- Figure 91: Eastern Europe Single Use Bioreactors Market Revenue (US$ Mn) Comparison By Product Type (2016-2032)
- Figure 92: Eastern Europe Single Use Bioreactors Market Revenue (US$ Mn) Comparison By Cell Type (2016-2032)
- Figure 93: Eastern Europe Single Use Bioreactors Market Revenue (US$ Mn) Comparison By Molecule Type (2016-2032)
- Figure 94: Eastern Europe Single Use Bioreactors Market Revenue (US$ Mn) Comparison By Application (2016-2032)
- Figure 95: Eastern Europe Single Use Bioreactors Market Y-o-Y Growth Rate Comparison by Country (2016-2032)
- Figure 96: Eastern Europe Single Use Bioreactors Market Y-o-Y Growth Rate Comparison By Product Type (2016-2032)
- Figure 97: Eastern Europe Single Use Bioreactors Market Y-o-Y Growth Rate Comparison By Cell Type (2016-2032)
- Figure 98: Eastern Europe Single Use Bioreactors Market Y-o-Y Growth Rate Comparison By Molecule Type (2016-2032)
- Figure 99: Eastern Europe Single Use Bioreactors Market Y-o-Y Growth Rate Comparison By Application (2016-2032)
- Figure 100: Eastern Europe Single Use Bioreactors Market Share Comparison by Country (2016-2032)
- Figure 101: Eastern Europe Single Use Bioreactors Market Share Comparison By Product Type (2016-2032)
- Figure 102: Eastern Europe Single Use Bioreactors Market Share Comparison By Cell Type (2016-2032)
- Figure 103: Eastern Europe Single Use Bioreactors Market Share Comparison By Molecule Type (2016-2032)
- Figure 104: Eastern Europe Single Use Bioreactors Market Share Comparison By Application (2016-2032)
- Figure 105: APAC Single Use Bioreactors Market Revenue (US$ Mn) Market Share By Product Typein 2022
- Figure 106: APAC Single Use Bioreactors Market Attractiveness Analysis By Product Type, 2016-2032
- Figure 107: APAC Single Use Bioreactors Market Revenue (US$ Mn) Market Share By Cell Typein 2022
- Figure 108: APAC Single Use Bioreactors Market Attractiveness Analysis By Cell Type, 2016-2032
- Figure 109: APAC Single Use Bioreactors Market Revenue (US$ Mn) Market Share By Molecule Typein 2022
- Figure 110: APAC Single Use Bioreactors Market Attractiveness Analysis By Molecule Type, 2016-2032
- Figure 111: APAC Single Use Bioreactors Market Revenue (US$ Mn) Market Share By Applicationin 2022
- Figure 112: APAC Single Use Bioreactors Market Attractiveness Analysis By Application, 2016-2032
- Figure 113: APAC Single Use Bioreactors Market Revenue (US$ Mn) Market Share by Country in 2022
- Figure 114: APAC Single Use Bioreactors Market Attractiveness Analysis by Country, 2016-2032
- Figure 115: APAC Single Use Bioreactors Market Revenue (US$ Mn) (2016-2032)
- Figure 116: APAC Single Use Bioreactors Market Revenue (US$ Mn) Comparison by Country (2016-2032)
- Figure 117: APAC Single Use Bioreactors Market Revenue (US$ Mn) Comparison By Product Type (2016-2032)
- Figure 118: APAC Single Use Bioreactors Market Revenue (US$ Mn) Comparison By Cell Type (2016-2032)
- Figure 119: APAC Single Use Bioreactors Market Revenue (US$ Mn) Comparison By Molecule Type (2016-2032)
- Figure 120: APAC Single Use Bioreactors Market Revenue (US$ Mn) Comparison By Application (2016-2032)
- Figure 121: APAC Single Use Bioreactors Market Y-o-Y Growth Rate Comparison by Country (2016-2032)
- Figure 122: APAC Single Use Bioreactors Market Y-o-Y Growth Rate Comparison By Product Type (2016-2032)
- Figure 123: APAC Single Use Bioreactors Market Y-o-Y Growth Rate Comparison By Cell Type (2016-2032)
- Figure 124: APAC Single Use Bioreactors Market Y-o-Y Growth Rate Comparison By Molecule Type (2016-2032)
- Figure 125: APAC Single Use Bioreactors Market Y-o-Y Growth Rate Comparison By Application (2016-2032)
- Figure 126: APAC Single Use Bioreactors Market Share Comparison by Country (2016-2032)
- Figure 127: APAC Single Use Bioreactors Market Share Comparison By Product Type (2016-2032)
- Figure 128: APAC Single Use Bioreactors Market Share Comparison By Cell Type (2016-2032)
- Figure 129: APAC Single Use Bioreactors Market Share Comparison By Molecule Type (2016-2032)
- Figure 130: APAC Single Use Bioreactors Market Share Comparison By Application (2016-2032)
- Figure 131: Latin America Single Use Bioreactors Market Revenue (US$ Mn) Market Share By Product Typein 2022
- Figure 132: Latin America Single Use Bioreactors Market Attractiveness Analysis By Product Type, 2016-2032
- Figure 133: Latin America Single Use Bioreactors Market Revenue (US$ Mn) Market Share By Cell Typein 2022
- Figure 134: Latin America Single Use Bioreactors Market Attractiveness Analysis By Cell Type, 2016-2032
- Figure 135: Latin America Single Use Bioreactors Market Revenue (US$ Mn) Market Share By Molecule Typein 2022
- Figure 136: Latin America Single Use Bioreactors Market Attractiveness Analysis By Molecule Type, 2016-2032
- Figure 137: Latin America Single Use Bioreactors Market Revenue (US$ Mn) Market Share By Applicationin 2022
- Figure 138: Latin America Single Use Bioreactors Market Attractiveness Analysis By Application, 2016-2032
- Figure 139: Latin America Single Use Bioreactors Market Revenue (US$ Mn) Market Share by Country in 2022
- Figure 140: Latin America Single Use Bioreactors Market Attractiveness Analysis by Country, 2016-2032
- Figure 141: Latin America Single Use Bioreactors Market Revenue (US$ Mn) (2016-2032)
- Figure 142: Latin America Single Use Bioreactors Market Revenue (US$ Mn) Comparison by Country (2016-2032)
- Figure 143: Latin America Single Use Bioreactors Market Revenue (US$ Mn) Comparison By Product Type (2016-2032)
- Figure 144: Latin America Single Use Bioreactors Market Revenue (US$ Mn) Comparison By Cell Type (2016-2032)
- Figure 145: Latin America Single Use Bioreactors Market Revenue (US$ Mn) Comparison By Molecule Type (2016-2032)
- Figure 146: Latin America Single Use Bioreactors Market Revenue (US$ Mn) Comparison By Application (2016-2032)
- Figure 147: Latin America Single Use Bioreactors Market Y-o-Y Growth Rate Comparison by Country (2016-2032)
- Figure 148: Latin America Single Use Bioreactors Market Y-o-Y Growth Rate Comparison By Product Type (2016-2032)
- Figure 149: Latin America Single Use Bioreactors Market Y-o-Y Growth Rate Comparison By Cell Type (2016-2032)
- Figure 150: Latin America Single Use Bioreactors Market Y-o-Y Growth Rate Comparison By Molecule Type (2016-2032)
- Figure 151: Latin America Single Use Bioreactors Market Y-o-Y Growth Rate Comparison By Application (2016-2032)
- Figure 152: Latin America Single Use Bioreactors Market Share Comparison by Country (2016-2032)
- Figure 153: Latin America Single Use Bioreactors Market Share Comparison By Product Type (2016-2032)
- Figure 154: Latin America Single Use Bioreactors Market Share Comparison By Cell Type (2016-2032)
- Figure 155: Latin America Single Use Bioreactors Market Share Comparison By Molecule Type (2016-2032)
- Figure 156: Latin America Single Use Bioreactors Market Share Comparison By Application (2016-2032)
- Figure 157: Middle East & Africa Single Use Bioreactors Market Revenue (US$ Mn) Market Share By Product Typein 2022
- Figure 158: Middle East & Africa Single Use Bioreactors Market Attractiveness Analysis By Product Type, 2016-2032
- Figure 159: Middle East & Africa Single Use Bioreactors Market Revenue (US$ Mn) Market Share By Cell Typein 2022
- Figure 160: Middle East & Africa Single Use Bioreactors Market Attractiveness Analysis By Cell Type, 2016-2032
- Figure 161: Middle East & Africa Single Use Bioreactors Market Revenue (US$ Mn) Market Share By Molecule Typein 2022
- Figure 162: Middle East & Africa Single Use Bioreactors Market Attractiveness Analysis By Molecule Type, 2016-2032
- Figure 163: Middle East & Africa Single Use Bioreactors Market Revenue (US$ Mn) Market Share By Applicationin 2022
- Figure 164: Middle East & Africa Single Use Bioreactors Market Attractiveness Analysis By Application, 2016-2032
- Figure 165: Middle East & Africa Single Use Bioreactors Market Revenue (US$ Mn) Market Share by Country in 2022
- Figure 166: Middle East & Africa Single Use Bioreactors Market Attractiveness Analysis by Country, 2016-2032
- Figure 167: Middle East & Africa Single Use Bioreactors Market Revenue (US$ Mn) (2016-2032)
- Figure 168: Middle East & Africa Single Use Bioreactors Market Revenue (US$ Mn) Comparison by Country (2016-2032)
- Figure 169: Middle East & Africa Single Use Bioreactors Market Revenue (US$ Mn) Comparison By Product Type (2016-2032)
- Figure 170: Middle East & Africa Single Use Bioreactors Market Revenue (US$ Mn) Comparison By Cell Type (2016-2032)
- Figure 171: Middle East & Africa Single Use Bioreactors Market Revenue (US$ Mn) Comparison By Molecule Type (2016-2032)
- Figure 172: Middle East & Africa Single Use Bioreactors Market Revenue (US$ Mn) Comparison By Application (2016-2032)
- Figure 173: Middle East & Africa Single Use Bioreactors Market Y-o-Y Growth Rate Comparison by Country (2016-2032)
- Figure 174: Middle East & Africa Single Use Bioreactors Market Y-o-Y Growth Rate Comparison By Product Type (2016-2032)
- Figure 175: Middle East & Africa Single Use Bioreactors Market Y-o-Y Growth Rate Comparison By Cell Type (2016-2032)
- Figure 176: Middle East & Africa Single Use Bioreactors Market Y-o-Y Growth Rate Comparison By Molecule Type (2016-2032)
- Figure 177: Middle East & Africa Single Use Bioreactors Market Y-o-Y Growth Rate Comparison By Application (2016-2032)
- Figure 178: Middle East & Africa Single Use Bioreactors Market Share Comparison by Country (2016-2032)
- Figure 179: Middle East & Africa Single Use Bioreactors Market Share Comparison By Product Type (2016-2032)
- Figure 180: Middle East & Africa Single Use Bioreactors Market Share Comparison By Cell Type (2016-2032)
- Figure 181: Middle East & Africa Single Use Bioreactors Market Share Comparison By Molecule Type (2016-2032)
- Figure 182: Middle East & Africa Single Use Bioreactors Market Share Comparison By Application (2016-2032)
List of Tables
- Table 1: Global Single Use Bioreactors Market Comparison By Product Type (2016-2032)
- Table 2: Global Single Use Bioreactors Market Comparison By Cell Type (2016-2032)
- Table 3: Global Single Use Bioreactors Market Comparison By Molecule Type (2016-2032)
- Table 4: Global Single Use Bioreactors Market Comparison By Application (2016-2032)
- Table 5: Global Single Use Bioreactors Market Revenue (US$ Mn) Comparison by Region (2016-2032)
- Table 6: Global Single Use Bioreactors Market Revenue (US$ Mn) (2016-2032)
- Table 7: Global Single Use Bioreactors Market Revenue (US$ Mn) Comparison by Region (2016-2032)
- Table 8: Global Single Use Bioreactors Market Revenue (US$ Mn) Comparison By Product Type (2016-2032)
- Table 9: Global Single Use Bioreactors Market Revenue (US$ Mn) Comparison By Cell Type (2016-2032)
- Table 10: Global Single Use Bioreactors Market Revenue (US$ Mn) Comparison By Molecule Type (2016-2032)
- Table 11: Global Single Use Bioreactors Market Revenue (US$ Mn) Comparison By Application (2016-2032)
- Table 12: Global Single Use Bioreactors Market Y-o-Y Growth Rate Comparison by Region (2016-2032)
- Table 13: Global Single Use Bioreactors Market Y-o-Y Growth Rate Comparison By Product Type (2016-2032)
- Table 14: Global Single Use Bioreactors Market Y-o-Y Growth Rate Comparison By Cell Type (2016-2032)
- Table 15: Global Single Use Bioreactors Market Y-o-Y Growth Rate Comparison By Molecule Type (2016-2032)
- Table 16: Global Single Use Bioreactors Market Y-o-Y Growth Rate Comparison By Application (2016-2032)
- Table 17: Global Single Use Bioreactors Market Share Comparison by Region (2016-2032)
- Table 18: Global Single Use Bioreactors Market Share Comparison By Product Type (2016-2032)
- Table 19: Global Single Use Bioreactors Market Share Comparison By Cell Type (2016-2032)
- Table 20: Global Single Use Bioreactors Market Share Comparison By Molecule Type (2016-2032)
- Table 21: Global Single Use Bioreactors Market Share Comparison By Application (2016-2032)
- Table 22: North America Single Use Bioreactors Market Comparison By Cell Type (2016-2032)
- Table 23: North America Single Use Bioreactors Market Comparison By Molecule Type (2016-2032)
- Table 24: North America Single Use Bioreactors Market Comparison By Application (2016-2032)
- Table 25: North America Single Use Bioreactors Market Revenue (US$ Mn) Comparison by Country (2016-2032)
- Table 26: North America Single Use Bioreactors Market Revenue (US$ Mn) (2016-2032)
- Table 27: North America Single Use Bioreactors Market Revenue (US$ Mn) Comparison by Country (2016-2032)
- Table 28: North America Single Use Bioreactors Market Revenue (US$ Mn) Comparison By Product Type (2016-2032)
- Table 29: North America Single Use Bioreactors Market Revenue (US$ Mn) Comparison By Cell Type (2016-2032)
- Table 30: North America Single Use Bioreactors Market Revenue (US$ Mn) Comparison By Molecule Type (2016-2032)
- Table 31: North America Single Use Bioreactors Market Revenue (US$ Mn) Comparison By Application (2016-2032)
- Table 32: North America Single Use Bioreactors Market Y-o-Y Growth Rate Comparison by Country (2016-2032)
- Table 33: North America Single Use Bioreactors Market Y-o-Y Growth Rate Comparison By Product Type (2016-2032)
- Table 34: North America Single Use Bioreactors Market Y-o-Y Growth Rate Comparison By Cell Type (2016-2032)
- Table 35: North America Single Use Bioreactors Market Y-o-Y Growth Rate Comparison By Molecule Type (2016-2032)
- Table 36: North America Single Use Bioreactors Market Y-o-Y Growth Rate Comparison By Application (2016-2032)
- Table 37: North America Single Use Bioreactors Market Share Comparison by Country (2016-2032)
- Table 38: North America Single Use Bioreactors Market Share Comparison By Product Type (2016-2032)
- Table 39: North America Single Use Bioreactors Market Share Comparison By Cell Type (2016-2032)
- Table 40: North America Single Use Bioreactors Market Share Comparison By Molecule Type (2016-2032)
- Table 41: North America Single Use Bioreactors Market Share Comparison By Application (2016-2032)
- Table 42: Western Europe Single Use Bioreactors Market Comparison By Product Type (2016-2032)
- Table 43: Western Europe Single Use Bioreactors Market Comparison By Cell Type (2016-2032)
- Table 44: Western Europe Single Use Bioreactors Market Comparison By Molecule Type (2016-2032)
- Table 45: Western Europe Single Use Bioreactors Market Comparison By Application (2016-2032)
- Table 46: Western Europe Single Use Bioreactors Market Revenue (US$ Mn) Comparison by Country (2016-2032)
- Table 47: Western Europe Single Use Bioreactors Market Revenue (US$ Mn) (2016-2032)
- Table 48: Western Europe Single Use Bioreactors Market Revenue (US$ Mn) Comparison by Country (2016-2032)
- Table 49: Western Europe Single Use Bioreactors Market Revenue (US$ Mn) Comparison By Product Type (2016-2032)
- Table 50: Western Europe Single Use Bioreactors Market Revenue (US$ Mn) Comparison By Cell Type (2016-2032)
- Table 51: Western Europe Single Use Bioreactors Market Revenue (US$ Mn) Comparison By Molecule Type (2016-2032)
- Table 52: Western Europe Single Use Bioreactors Market Revenue (US$ Mn) Comparison By Application (2016-2032)
- Table 53: Western Europe Single Use Bioreactors Market Y-o-Y Growth Rate Comparison by Country (2016-2032)
- Table 54: Western Europe Single Use Bioreactors Market Y-o-Y Growth Rate Comparison By Product Type (2016-2032)
- Table 55: Western Europe Single Use Bioreactors Market Y-o-Y Growth Rate Comparison By Cell Type (2016-2032)
- Table 56: Western Europe Single Use Bioreactors Market Y-o-Y Growth Rate Comparison By Molecule Type (2016-2032)
- Table 57: Western Europe Single Use Bioreactors Market Y-o-Y Growth Rate Comparison By Application (2016-2032)
- Table 58: Western Europe Single Use Bioreactors Market Share Comparison by Country (2016-2032)
- Table 59: Western Europe Single Use Bioreactors Market Share Comparison By Product Type (2016-2032)
- Table 60: Western Europe Single Use Bioreactors Market Share Comparison By Cell Type (2016-2032)
- Table 61: Western Europe Single Use Bioreactors Market Share Comparison By Molecule Type (2016-2032)
- Table 62: Western Europe Single Use Bioreactors Market Share Comparison By Application (2016-2032)
- Table 63: Eastern Europe Single Use Bioreactors Market Comparison By Product Type (2016-2032)
- Table 64: Eastern Europe Single Use Bioreactors Market Comparison By Cell Type (2016-2032)
- Table 65: Eastern Europe Single Use Bioreactors Market Comparison By Molecule Type (2016-2032)
- Table 66: Eastern Europe Single Use Bioreactors Market Comparison By Application (2016-2032)
- Table 67: Eastern Europe Single Use Bioreactors Market Revenue (US$ Mn) Comparison by Country (2016-2032)
- Table 68: Eastern Europe Single Use Bioreactors Market Revenue (US$ Mn) (2016-2032)
- Table 69: Eastern Europe Single Use Bioreactors Market Revenue (US$ Mn) Comparison by Country (2016-2032)
- Table 70: Eastern Europe Single Use Bioreactors Market Revenue (US$ Mn) Comparison By Product Type (2016-2032)
- Table 71: Eastern Europe Single Use Bioreactors Market Revenue (US$ Mn) Comparison By Cell Type (2016-2032)
- Table 72: Eastern Europe Single Use Bioreactors Market Revenue (US$ Mn) Comparison By Molecule Type (2016-2032)
- Table 73: Eastern Europe Single Use Bioreactors Market Revenue (US$ Mn) Comparison By Application (2016-2032)
- Table 74: Eastern Europe Single Use Bioreactors Market Y-o-Y Growth Rate Comparison by Country (2016-2032)
- Table 75: Eastern Europe Single Use Bioreactors Market Y-o-Y Growth Rate Comparison By Product Type (2016-2032)
- Table 76: Eastern Europe Single Use Bioreactors Market Y-o-Y Growth Rate Comparison By Cell Type (2016-2032)
- Table 77: Eastern Europe Single Use Bioreactors Market Y-o-Y Growth Rate Comparison By Molecule Type (2016-2032)
- Table 78: Eastern Europe Single Use Bioreactors Market Y-o-Y Growth Rate Comparison By Application (2016-2032)
- Table 79: Eastern Europe Single Use Bioreactors Market Share Comparison by Country (2016-2032)
- Table 80: Eastern Europe Single Use Bioreactors Market Share Comparison By Product Type (2016-2032)
- Table 81: Eastern Europe Single Use Bioreactors Market Share Comparison By Cell Type (2016-2032)
- Table 82: Eastern Europe Single Use Bioreactors Market Share Comparison By Molecule Type (2016-2032)
- Table 83: Eastern Europe Single Use Bioreactors Market Share Comparison By Application (2016-2032)
- Table 84: APAC Single Use Bioreactors Market Comparison By Product Type (2016-2032)
- Table 85: APAC Single Use Bioreactors Market Comparison By Cell Type (2016-2032)
- Table 86: APAC Single Use Bioreactors Market Comparison By Molecule Type (2016-2032)
- Table 87: APAC Single Use Bioreactors Market Comparison By Application (2016-2032)
- Table 88: APAC Single Use Bioreactors Market Revenue (US$ Mn) Comparison by Country (2016-2032)
- Table 89: APAC Single Use Bioreactors Market Revenue (US$ Mn) (2016-2032)
- Table 90: APAC Single Use Bioreactors Market Revenue (US$ Mn) Comparison by Country (2016-2032)
- Table 91: APAC Single Use Bioreactors Market Revenue (US$ Mn) Comparison By Product Type (2016-2032)
- Table 92: APAC Single Use Bioreactors Market Revenue (US$ Mn) Comparison By Cell Type (2016-2032)
- Table 93: APAC Single Use Bioreactors Market Revenue (US$ Mn) Comparison By Molecule Type (2016-2032)
- Table 94: APAC Single Use Bioreactors Market Revenue (US$ Mn) Comparison By Application (2016-2032)
- Table 95: APAC Single Use Bioreactors Market Y-o-Y Growth Rate Comparison by Country (2016-2032)
- Table 96: APAC Single Use Bioreactors Market Y-o-Y Growth Rate Comparison By Product Type (2016-2032)
- Table 97: APAC Single Use Bioreactors Market Y-o-Y Growth Rate Comparison By Cell Type (2016-2032)
- Table 98: APAC Single Use Bioreactors Market Y-o-Y Growth Rate Comparison By Molecule Type (2016-2032)
- Table 99: APAC Single Use Bioreactors Market Y-o-Y Growth Rate Comparison By Application (2016-2032)
- Table 100: APAC Single Use Bioreactors Market Share Comparison by Country (2016-2032)
- Table 101: APAC Single Use Bioreactors Market Share Comparison By Product Type (2016-2032)
- Table 102: APAC Single Use Bioreactors Market Share Comparison By Cell Type (2016-2032)
- Table 103: APAC Single Use Bioreactors Market Share Comparison By Molecule Type (2016-2032)
- Table 104: APAC Single Use Bioreactors Market Share Comparison By Application (2016-2032)
- Table 105: Latin America Single Use Bioreactors Market Comparison By Product Type (2016-2032)
- Table 106: Latin America Single Use Bioreactors Market Comparison By Cell Type (2016-2032)
- Table 107: Latin America Single Use Bioreactors Market Comparison By Molecule Type (2016-2032)
- Table 108: Latin America Single Use Bioreactors Market Comparison By Application (2016-2032)
- Table 109: Latin America Single Use Bioreactors Market Revenue (US$ Mn) Comparison by Country (2016-2032)
- Table 110: Latin America Single Use Bioreactors Market Revenue (US$ Mn) (2016-2032)
- Table 111: Latin America Single Use Bioreactors Market Revenue (US$ Mn) Comparison by Country (2016-2032)
- Table 112: Latin America Single Use Bioreactors Market Revenue (US$ Mn) Comparison By Product Type (2016-2032)
- Table 113: Latin America Single Use Bioreactors Market Revenue (US$ Mn) Comparison By Cell Type (2016-2032)
- Table 114: Latin America Single Use Bioreactors Market Revenue (US$ Mn) Comparison By Molecule Type (2016-2032)
- Table 115: Latin America Single Use Bioreactors Market Revenue (US$ Mn) Comparison By Application (2016-2032)
- Table 116: Latin America Single Use Bioreactors Market Y-o-Y Growth Rate Comparison by Country (2016-2032)
- Table 117: Latin America Single Use Bioreactors Market Y-o-Y Growth Rate Comparison By Product Type (2016-2032)
- Table 118: Latin America Single Use Bioreactors Market Y-o-Y Growth Rate Comparison By Cell Type (2016-2032)
- Table 119: Latin America Single Use Bioreactors Market Y-o-Y Growth Rate Comparison By Molecule Type (2016-2032)
- Table 120: Latin America Single Use Bioreactors Market Y-o-Y Growth Rate Comparison By Application (2016-2032)
- Table 121: Latin America Single Use Bioreactors Market Share Comparison by Country (2016-2032)
- Table 122: Latin America Single Use Bioreactors Market Share Comparison By Product Type (2016-2032)
- Table 123: Latin America Single Use Bioreactors Market Share Comparison By Cell Type (2016-2032)
- Table 124: Latin America Single Use Bioreactors Market Share Comparison By Molecule Type (2016-2032)
- Table 125: Latin America Single Use Bioreactors Market Share Comparison By Application (2016-2032)
- Table 126: Middle East & Africa Single Use Bioreactors Market Comparison By Product Type (2016-2032)
- Table 127: Middle East & Africa Single Use Bioreactors Market Comparison By Cell Type (2016-2032)
- Table 128: Middle East & Africa Single Use Bioreactors Market Comparison By Molecule Type (2016-2032)
- Table 129: Middle East & Africa Single Use Bioreactors Market Comparison By Application (2016-2032)
- Table 130: Middle East & Africa Single Use Bioreactors Market Revenue (US$ Mn) Comparison by Country (2016-2032)
- Table 131: Middle East & Africa Single Use Bioreactors Market Revenue (US$ Mn) (2016-2032)
- Table 132: Middle East & Africa Single Use Bioreactors Market Revenue (US$ Mn) Comparison by Country (2016-2032)
- Table 133: Middle East & Africa Single Use Bioreactors Market Revenue (US$ Mn) Comparison By Product Type (2016-2032)
- Table 134: Middle East & Africa Single Use Bioreactors Market Revenue (US$ Mn) Comparison By Cell Type (2016-2032)
- Table 135: Middle East & Africa Single Use Bioreactors Market Revenue (US$ Mn) Comparison By Molecule Type (2016-2032)
- Table 136: Middle East & Africa Single Use Bioreactors Market Revenue (US$ Mn) Comparison By Application (2016-2032)
- Table 137: Middle East & Africa Single Use Bioreactors Market Y-o-Y Growth Rate Comparison by Country (2016-2032)
- Table 138: Middle East & Africa Single Use Bioreactors Market Y-o-Y Growth Rate Comparison By Product Type (2016-2032)
- Table 139: Middle East & Africa Single Use Bioreactors Market Y-o-Y Growth Rate Comparison By Cell Type (2016-2032)
- Table 140: Middle East & Africa Single Use Bioreactors Market Y-o-Y Growth Rate Comparison By Molecule Type (2016-2032)
- Table 141: Middle East & Africa Single Use Bioreactors Market Y-o-Y Growth Rate Comparison By Application (2016-2032)
- Table 142: Middle East & Africa Single Use Bioreactors Market Share Comparison by Country (2016-2032)
- Table 143: Middle East & Africa Single Use Bioreactors Market Share Comparison By Product Type (2016-2032)
- Table 144: Middle East & Africa Single Use Bioreactors Market Share Comparison By Cell Type (2016-2032)
- Table 145: Middle East & Africa Single Use Bioreactors Market Share Comparison By Molecule Type (2016-2032)
- Table 146: Middle East & Africa Single Use Bioreactors Market Share Comparison By Application (2016-2032)
- 1. Executive Summary
-
- Sartorius Stedim Biotech
- Merck Millipore
- GE Healthcare
- Danaher
- Thermo Fisher Scientific
- Parker Hannifin
- Applikon Biotechnology
- Eppendorf
- Cesco Bioengineering
- Cellexus
- Celltainer Biotech
- PBS Biotech
- Distek
- Solida Biotech
- Pierre Guerin.
Our Clients


View Our Licence Options
