Shapewear Market Report By Product Type (Bodysuits, Corsets, Control Panties, Long Leg Shapewear, Seamless Shapewear, Waist Cinchers, Others), By Material Type (Nylon, Cotton, Spandex, Others), By Distribution Channel (Online Stores, Offline Stores [Supermarkets/Hypermarkets, Specialty Stores, Departmental Stores, Others]), By End-User (Women, Men, Unisex), By Application (Outerwear, Innerwear), By Control Level (Light Control, Moderate Control, Firm Control), By Region and Companies - Industry Segment Outlook, Market Assessment, Competition Scenari
-
30164
-
August 2024
-
324
-


-
This report was compiled by Research Team Research team of over 50 passionate professionals leverages advanced research methodologies and analytical expertise to deliver insightful, data-driven market intelligence that empowers businesses across diverse industries to make strategic, well-informed Correspondence Research Team Linkedin | Detailed Market research Methodology Our methodology involves a mix of primary research, including interviews with leading mental health experts, and secondary research from reputable medical journals and databases. View Detailed Methodology Page
-
Quick Navigation
Report Overview
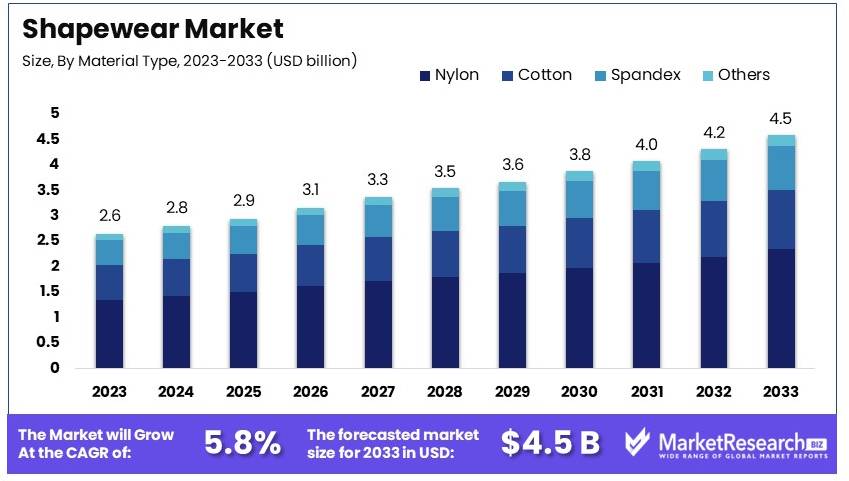
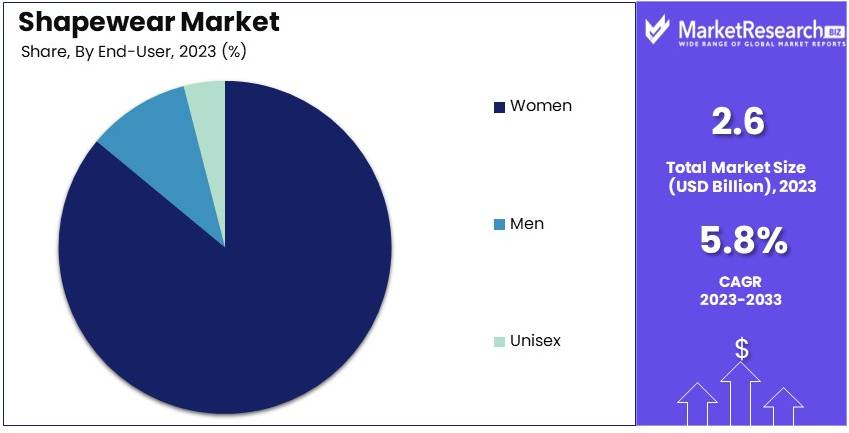
The Global Shapewear Market size is expected to be worth around USD 4.5 Billion by 2033, from USD 2.6 Billion in 2023, growing at a CAGR of 5.8% during the forecast period from 2024 to 2033.
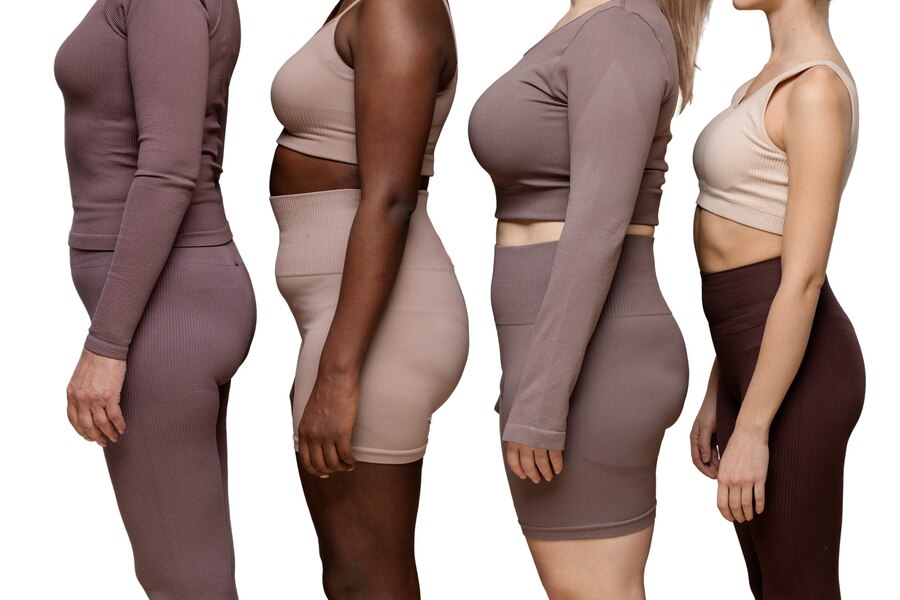
The Shapewear Market involves the production and sale of garments designed to shape and support the body. These products include bodysuits, control briefs, and compression garments. The market is driven by consumer desire for a slim and toned appearance and the influence of fashion trends.
Key consumers are women, although men’s shapewear is also gaining popularity. Major distribution channels include retail stores, e-commerce, and specialty boutiques. Innovation in materials and designs, such as breathable fabrics and seamless construction, enhances market appeal. Challenges include comfort and fit issues. The market is competitive with numerous brands offering diverse products. Growth is expected due to increasing body consciousness and fashion trends.
The shapewear market is witnessing steady growth, driven by increasing consumer demand for body-contouring apparel that enhances appearance and confidence. In the United States, the majority of shapewear products are categorized as “underwear,” reflecting their primary use for body shaping under regular clothing. However, the market shows diversity with 9% of shapewear considered as “hosiery,” 8% as “tops,” 5% as “bottoms,” and smaller segments in “all-in-ones” (4%), swimwear (2%), and dresses (1%).
The diverse categorization highlights the expanding application of shapewear across different types of apparel. This trend is influenced by the growing awareness of body positivity and the desire for functional yet fashionable clothing. The evolution of fabric technology and innovative designs also play a crucial role, offering consumers more comfortable and effective shapewear options.
In addition, the market is supported by increasing online retail sales, which provide consumers with easy access to a wide range of products and brands. This accessibility, coupled with targeted marketing campaigns on social media platforms, is driving consumer engagement and expanding market reach.
Companies in the shapewear market are focusing on product innovation and diversification to meet varied consumer needs. They are investing in research and development to create shapewear that offers better fit, comfort, and functionality. Sustainable materials and inclusive sizing are also becoming important trends, catering to a broader audience.
Key Takeaways
- Market Value: The Shapewear Market was valued at USD 2.6 billion in 2023 and is expected to grow to USD 4.5 billion by 2033, with a CAGR of 5.8%.
- Product Type Analysis: Bodysuits are most popular at 37.4%; favored for their full-body shaping effects.
- Material Type Analysis: Nylon is the leading material at 52.9%; chosen for its elasticity and comfort.
- Distribution Channel Analysis: Online Stores are the primary shopping venue at 58.7%; preferred for discreet purchases.
- End User Analysis: Women dominate the market at 86.4%; high demand driven by fashion trends.
- Application Analysis: Innerwear leads at 73.2%; essential for smooth lines under clothing.
Driving Factors
Body Positivity Movement Drives Market Growth
The body positivity movement has paradoxically fueled the growth of the shapewear market. This movement promotes acceptance of all body types and encourages individuals to feel confident in their appearance. Shapewear is increasingly viewed as a tool for enhancing confidence rather than changing one's body. Brands like Spanx have effectively marketed their products as "confidence boosters," appealing to those who want to feel more assured in their outfits.
This approach has broadened the appeal of shapewear beyond traditional body shaping needs, making it a popular choice for everyday wear. The body positivity movement's focus on self-acceptance aligns with the idea that shapewear can enhance natural body shapes rather than conforming to unrealistic standards. This synergy between body positivity and shapewear marketing has expanded the market by attracting a more diverse customer base.
Celebrity Endorsements and Influencer Marketing Drive Market Growth
Celebrity endorsements and influencer marketing are significantly boosting the popularity of shapewear. High-profile celebrities and influencers promote shapewear as a fashionable must-have, increasing its visibility and desirability. Kim Kardashian's SKIMS brand, for example, leverages her massive social media following to position shapewear as a trendy and essential item.
This marketing strategy taps into the influence of celebrities and social media stars, who often set trends and shape consumer preferences. The widespread reach of social media platforms allows these endorsements to have a substantial impact, driving sales and market growth. The association of shapewear with well-known personalities also helps to normalize its use and reduce any stigma associated with it.
Expansion into Everyday Wear Drives Market Growth
The expansion of shapewear into everyday wear is a significant driver of market growth. Brands are now creating comfortable, breathable shapewear designed for daily use, not just special occasions. Companies like Yummie have introduced shapewear that doubles as outerwear, such as shaping tank tops and leggings, broadening the market beyond traditional undergarments.
This shift reflects a growing demand for versatile and functional clothing that offers both comfort and shaping benefits. The ability to wear shapewear as part of regular outfits increases its appeal and usage frequency. This trend is further supported by advancements in fabric technology, which make shapewear more comfortable and suitable for long-term wear.
Restraining Factors
Health Concerns Restrain Market Growth
Health concerns surrounding shapewear use restrain market growth. There are ongoing debates about the potential health risks associated with frequent or prolonged shapewear use, including digestive issues and circulation problems. For example, a study published in the European Journal of Obstetrics & Gynecology and Reproductive Biology suggested that tight-fitting shapewear could exacerbate acid reflux and heartburn.
These health risks can deter consumers from using shapewear regularly, limiting its market growth. Consumers are increasingly aware of these potential issues, which may lead them to seek alternative products that do not pose such health risks.
Shift Towards Natural Body Acceptance Restrains Market Growth
The shift towards natural body acceptance significantly impacts the shapewear market. While the body positivity movement has paradoxically boosted shapewear sales, a growing subset of consumers is rejecting body-altering products in favor of embracing their natural shape. This trend could potentially limit market growth in certain segments.
As more consumers prioritize natural body acceptance, the demand for shapewear could decrease. This shift reflects a broader societal trend towards self-acceptance and away from products that alter one's natural appearance, posing a challenge for the shapewear market.
Product Type Analysis
Bodysuits dominate with 37.4% due to their versatility and full-body shaping benefits.
Bodysuits are the leading sub-segment in the shapewear market, holding a 37.4% share, primarily because they offer comprehensive body contouring capabilities, from chest to hips. This all-in-one feature is highly valued by consumers seeking a seamless and smooth silhouette under garments, making bodysuits a popular choice for both everyday wear and special occasions.
Corsets, constituting 18.6% of the product market, are favored for their traditional waist-cinching effects, enhancing body posture and providing back support. Control Panties, with a 15.3% market share, focus on the lower abdomen and buttocks, offering targeted shaping that is particularly appreciated under tight-fitting clothes.
Long Leg Shapewear and Waist Cinchers each capture about 12.2% and 9.7% of the market, respectively. Long Leg Shapewear is ideal for smoothing thighs and hips, while Waist Cinchers are sought for their ability to sculpt the waistline aggressively. Seamless Shapewear, holding 6.8%, is designed to be invisible under clothing, offering moderate shaping without seams.
The dominance of Bodysuits is supported by their ability to provide a smooth, contoured appearance across multiple body areas, enhancing the wearer’s confidence and comfort. Meanwhile, other types like Corsets and Control Panties play significant roles by catering to specific body shaping needs, thus enriching the product diversity within the shapewear market.
Material Type Analysis
Nylon dominates with 52.9% due to its durability and elasticity.
In the shapewear material segment, Nylon leads with a 52.9% market share. This prevalence is attributed to Nylon's high durability and superior elasticity, which are essential for effective body shaping. Nylon's ability to retain shape over long periods and under continuous stress makes it ideal for shapewear that requires firm control and resilience.
Spandex, holding a 31.2% share, is also crucial due to its exceptional stretchability, which enhances the comfort and flexibility of shapewear products. Cotton, making up 10.4% of the material market, is preferred for its breathability and softness, important for consumers who prioritize comfort, especially in warmer climates.
The 'Others' category, which includes materials like microfiber, accounts for 5.5% and is chosen for specific properties like moisture wicking and thermal control.
Nylon's dominance in the shapewear market is due to its foundational role in providing long-lasting, effective shaping solutions. However, the contributions of Spandex and Cotton are also vital, addressing the market’s demand for comfort and flexibility alongside shaping performance.
Distribution Channel Analysis
Online Stores dominate with 58.7% due to the convenience and privacy they offer.
Online Stores have become the dominant distribution channel in the shapewear market, capturing a 58.7% share. This shift towards digital shopping is driven by the convenience of browsing a wide selection of products from home and the privacy of purchasing intimate garments without the discomfort that some consumers might feel in physical stores.
Offline Stores, which include Supermarkets/Hypermarkets, Specialty Stores, and Departmental Stores, collectively hold a 41.3% market share. Specialty Stores, in particular, play a crucial role, making up 16.4% of the offline segment, as they offer personalized fitting services and expert advice, which are highly valued when purchasing shapewear.
The dominance of Online Stores highlights the changing consumer behavior towards more discreet and convenient shopping experiences. However, the role of Offline Stores remains significant, providing consumer education and personalized services that are sometimes necessary for purchasing the correct type of shapewear.
End-User Analysis
Women dominate the shapewear market with 86.4% due to the higher demand for body contouring garments.
Women are the largest end-user group in the shapewear market, accounting for 86.4%. This dominance is driven by the high demand among women for garments that offer body contouring and a streamlined silhouette, which are often sought for both fashion and confidence-enhancing reasons.
Men’s shapewear, making up 9.3% of the market, is growing as awareness and acceptance of male body shaping garments increase. Unisex products, holding 4.3%, cater to a niche market looking for versatility and non-gender-specific design in shapewear.
The significant market share of women’s shapewear is underpinned by the extensive range of products tailored specifically to women’s bodies and fashion needs. Meanwhile, the emerging segments for men and unisex shapewear reflect broader cultural shifts towards inclusive fashion and body positivity.
Application Analysis
Innerwear dominates with 73.2% due to its essential role in daily comfort and appearance enhancement.
Innerwear is the primary application of shapewear, holding a 73.2% market share. This category includes garments worn directly against the skin, under other clothing, where shapewear is most commonly used to enhance body shape discreetly. The demand for innerwear shapewear is driven by the desire for a polished appearance in professional and social settings.
Outerwear, which makes up 26.8% of the application market, consists of shapewear designed to be worn visibly and often features more decorative elements. This segment is growing as fashion trends increasingly incorporate shapewear as an outer garment or womens activewear, reflecting evolving attitudes towards body shaping and fashion.
The dominance of Innerwear is due to its foundational role in enhancing daily appearance and boosting confidence. In contrast, Outerwear is gaining traction as part of a fashion statement, demonstrating the versatility and expanding influence of shapewear in modern apparel.
Key Market Segments
By Product Type
- Bodysuits
- Corsets
- Control Panties
- Long Leg Shapewear
- Seamless Shapewear
- Waist Cinchers
- Others
By Material Type
- Nylon
- Cotton
- Spandex
- Others
By Distribution Channel
- Online Stores
- Offline Stores
- Supermarkets/Hypermarkets
- Specialty Stores
- Departmental Stores
- Others
By End-User
- Women
- Men
- Unisex
By Application
- Outerwear
- Innerwear
Growth Opportunities
Men's Shapewear Offers Growth Opportunity
The men's shapewear market presents an untapped growth opportunity. As male grooming and fashion consciousness rise, there is an increasing demand for men's shapewear. Brands like Spanx for Men and 2(X)IST are capitalizing on this trend, offering products designed to enhance physique and boost confidence.
This expanding segment caters to men seeking body-shaping solutions, from athletic to everyday wear. By targeting this growing demographic, shapewear brands can diversify their product lines and capture a significant new market share, driving overall market expansion.
Inclusive Sizing Offers Growth Opportunity
Offering inclusive sizing in shapewear presents a substantial growth opportunity. There is a growing demand for shapewear in a broader range of sizes, from petite to plus sizes. Brands like Honeylove, which offers sizes from XS to 3X, are meeting this demand and appealing to a wider consumer base.
Inclusive sizing allows brands to reach more customers, enhance satisfaction, and build loyalty. By catering to diverse body types, shapewear companies can tap into a larger market, boosting sales and expanding their consumer reach.
Trending Factors
Smart Shapewear Are Trending Factors
The integration of technology into shapewear is an emerging trend in the market. Smart shapewear with built-in cooling or heating elements, or pieces that track body metrics, offers innovative solutions for consumers. Companies like Myant are developing smart textile technologies that could be applied to shapewear, enhancing functionality and appeal.
This trend provides added value by combining fashion with technology, making shapewear more versatile and appealing. As smart shapewear evolves, it is expected to attract tech-savvy consumers, drive market innovation, and expand the market potential.
Shapewear as Outerwear Are Trending Factors
The trend of wearing shapewear as outerwear is growing, creating new market opportunities. Shapewear pieces designed to be worn as tops or dresses blur the lines between underwear and clothing. Brands like Kim Kardashian's SKIMS are at the forefront of this trend, offering stylish shapewear that can be showcased.
This trend expands the use of shapewear beyond traditional purposes, opening up new design possibilities and market segments. By tapping into this fashion-forward approach, shapewear brands can attract a broader audience, increase product versatility, and drive market growth.
Regional Analysis
North America Dominates with 38.2% Market Share in the Shapewear Market
North America's dominant 38.2% share of the global shapewear market is driven by high consumer demand for fashion and lifestyle products that enhance body image. The region has a significant influence of media and fashion industries which promote the use of shapewear among a wide demographic. Additionally, the presence of leading shapewear brands that focus on innovation and comfort contributes to sustained market growth.
The shapewear market in North America benefits from sophisticated retail infrastructure and extensive online shopping platforms that make it easy for consumers to access a wide range of products. Marketing strategies focusing on body positivity and inclusivity have broadened the consumer base, including younger demographics and men, expanding the market further.
Looking forward, the shapewear market in North America is expected to maintain its leadership position. Anticipated trends in fashion toward more body-conscious clothing and ongoing innovations in shapewear products, such as breathable and lightweight materials, are likely to continue driving growth. Additionally, increasing health consciousness and fitness trends will further promote the use of shapewear as a supportive garment during physical activities.
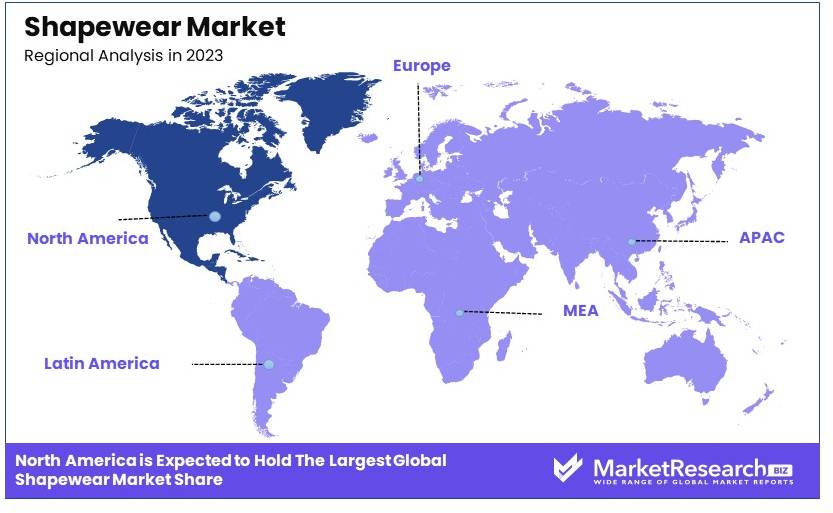
Regional Market Share AnalysisEurope: Holding approximately 25% of the global shapewear market, Europe's demand is driven by similar fashion trends and an increasing emphasis on appearance and wellness among consumers. European brands are known for their high-quality materials and craftsmanship, adding to the region's market strength.
Asia Pacific: This region accounts for about 20% of the market, with growth driven by increasing disposable incomes and changing fashion aesthetics, particularly in countries like South Korea and China. The rise in e-commerce sales also facilitates wider distribution and availability of shapewear products.
Middle East & Africa: With around 7% of the market share, the Middle East and Africa are seeing gradual growth due to rising awareness and changing attitudes towards body image and fitness, especially in urban areas.
Latin America: Representing about 10% of the market, Latin America's growth is fueled by the increasing influence of Western fashion trends and growing middle-class populations with disposable income to spend on luxury and lifestyle products.
Key Regions and Countries
- North America
- The US
- Canada
- Mexico
- Western Europe
- Germany
- France
- The UK
- Spain
- Italy
- Portugal
- Ireland
- Austria
- Switzerland
- Benelux
- Nordic
- Rest of Western Europe
- Eastern Europe
- Russia
- Poland
- The Czech Republic
- Greece
- Rest of Eastern Europe
- APAC
- China
- Japan
- South Korea
- India
- Australia & New Zealand
- Indonesia
- Malaysia
- Philippines
- Singapore
- Thailand
- Vietnam
- Rest of APAC
- Latin America
- Brazil
- Colombia
- Chile
- Argentina
- Costa Rica
- Rest of Latin America
- Middle East & Africa
- Algeria
- Egypt
- Israel
- Kuwait
- Nigeria
- Saudi Arabia
- South Africa
- Turkey
- United Arab Emirates
- Rest of MEA
Key Players Analysis
The shapewear market is driven by key players who focus on innovation, inclusivity, and consumer engagement. Spanx, Inc. leads with its pioneering products and strong brand identity. Hanesbrands Inc., through Maidenform Brands, Inc., combines comfort and functionality, appealing to a broad consumer base.
Wacoal Holdings Corporation and Jockey International, Inc. emphasize quality and fit, catering to diverse body types. Triumph International and Wolford AG offer premium shapewear, targeting the luxury segment. Leonisa SA and Ann Chery focus on innovative designs and effective shaping solutions.
Skims, founded by Kim Kardashian, brings a modern approach to shapewear with inclusive sizing and trendy designs. Miraclesuit (Swimwear Anywhere, Inc.) and Shapermint leverage strategic marketing to enhance brand visibility and consumer loyalty. Yummie by Heather Thomson and Naomi & Nicole emphasize comfort and versatility.
Marena Group, Inc. focuses on medical-grade compression garments, catering to post-surgical needs. These companies collectively drive the shapewear market through strategic positioning, product innovation, and consumer-centric approaches.
Market Key Players
- Spanx, Inc.
- Hanesbrands Inc.
- Wacoal Holdings Corporation
- Maidenform Brands, Inc. (Hanesbrands)
- Jockey International, Inc.
- Triumph International
- Wolford AG
- Leonisa SA
- Ann Chery
- Skims
- Miraclesuit (Swimwear Anywhere, Inc.)
- Shapermint
- Yummie by Heather Thomson
- Naomi & Nicole
- Marena Group, Inc.
Recent Developments
2024: Shapermint has introduced the Embrace Maternity Collection, featuring size-inclusive maternity shapewear. This collection aims to provide comfort and support for mothers at every stage of pregnancy, marking a significant expansion in Shapermint's product line.
2024: Lizzo's shapewear brand, Yitty, has launched its first swimwear collection, "Shaping Swim." The new line includes a variety of swimwear designed to shape and enhance body contours, reflecting the brand's commitment to body positivity and inclusivity.
Report Scope
Report Features Description Market Value (2023) USD 2.6 Billion Forecast Revenue (2033) USD 4.5 Billion CAGR (2024-2033) 5.8% Base Year for Estimation 2023 Historic Period 2018-2023 Forecast Period 2024-2033 Report Coverage Revenue Forecast, Market Dynamics, Competitive Landscape, Recent Developments Segments Covered By Product Type (Bodysuits, Corsets, Control Panties, Long Leg Shapewear, Seamless Shapewear, Waist Cinchers, Others), By Material Type (Nylon, Cotton, Spandex, Others), By Distribution Channel (Online Stores, Offline Stores [Supermarkets/Hypermarkets, Specialty Stores, Departmental Stores, Others]), By End-User (Women, Men, Unisex), By Application (Outerwear, Innerwear), By Control Level (Light Control, Moderate Control, Firm Control) Regional Analysis North America - The US, Canada, & Mexico; Western Europe - Germany, France, The UK, Spain, Italy, Portugal, Ireland, Austria, Switzerland, Benelux, Nordic, & Rest of Western Europe; Eastern Europe - Russia, Poland, The Czech Republic, Greece, & Rest of Eastern Europe; APAC - China, Japan, South Korea, India, Australia & New Zealand, Indonesia, Malaysia, Philippines, Singapore, Thailand, Vietnam, & Rest of APAC; Latin America - Brazil, Colombia, Chile, Argentina, Costa Rica, & Rest of Latin America; Middle East & Africa - Algeria, Egypt, Israel, Kuwait, Nigeria, Saudi Arabia, South Africa, Turkey, United Arab Emirates, & Rest of MEA Competitive Landscape Spanx, Inc., Hanesbrands Inc., Wacoal Holdings Corporation, Maidenform Brands, Inc. (Hanesbrands), Jockey International, Inc., Triumph International, Wolford AG, Leonisa SA, Ann Chery, Skims, Miraclesuit (Swimwear Anywhere, Inc.), Shapermint, Yummie by Heather Thomson, Naomi & Nicole, Marena Group, Inc. Customization Scope Customization for segments, region/country-level will be provided. Moreover, additional customization can be done based on the requirements. Purchase Options We have three licenses to opt for: Single User License, Multi-User License (Up to 5 Users), Corporate Use License (Unlimited User and Printable PDF) -
- 1. Executive Summary
- 1.1. Definition
- 1.2. Taxonomy
- 1.3. Research Scope
- 1.4. Key Analysis
- 1.5. Key Findings by Major Segments
- 1.6. Top strategies by Major Players
- 2. Global Shapewear Market Overview
- 2.1. Shapewear Market Dynamics
- 2.1.1. Drivers
- 2.1.2. Opportunities
- 2.1.3. Restraints
- 2.1.4. Challenges
- 2.2. Macro-economic Factors
- 2.3. Regulatory Framework
- 2.4. Market Investment Feasibility Index
- 2.5. PEST Analysis
- 2.6. PORTER’S Five Force Analysis
- 2.7. Drivers & Restraints Impact Analysis
- 2.8. Industry Chain Analysis
- 2.9. Cost Structure Analysis
- 2.10. Marketing Strategy
- 2.11. Russia-Ukraine War Impact Analysis
- 2.12. Opportunity Map Analysis
- 2.13. Market Competition Scenario Analysis
- 2.14. Product Life Cycle Analysis
- 2.15. Opportunity Orbits
- 2.16. Manufacturer Intensity Map
- 2.17. Major Companies sales by Value & Volume
- 2.1. Shapewear Market Dynamics
- 3. Global Shapewear Market Analysis, Opportunity and Forecast, 2016-2032
- 3.1. Global Shapewear Market Analysis, 2016-2021
- 3.2. Global Shapewear Market Opportunity and Forecast, 2023-2032
- 3.3. Global Shapewear Market Analysis, Opportunity and Forecast, By By Fabric Type Analysis, 2016-2032
- 3.3.1. Global Shapewear Market Analysis by By Fabric Type Analysis: Introduction
- 3.3.2. Market Size Absolute $ Opportunity Analysis and Forecast, By By Fabric Type Analysis, 2016-2032
- 3.3.3. Nylon
- 3.3.4. Spandex
- 3.3.5. Cotton
- 3.3.6. Lycra
- 3.4. Global Shapewear Market Analysis, Opportunity and Forecast, By By Distribution Channel Analysis, 2016-2032
- 3.4.1. Global Shapewear Market Analysis by By Distribution Channel Analysis: Introduction
- 3.4.2. Market Size Absolute $ Opportunity Analysis and Forecast, By By Distribution Channel Analysis, 2016-2032
- 3.4.3. Online
- 3.4.4. Supermarkets/ Hypermarkets
- 3.4.5. Specialty Stores
- 3.4.6. Other
- 3.5. Global Shapewear Market Analysis, Opportunity and Forecast, By End-User Analysis, 2016-2032
- 3.5.1. Global Shapewear Market Analysis by End-User Analysis: Introduction
- 3.5.2. Market Size Absolute $ Opportunity Analysis and Forecast, By End-User Analysis, 2016-2032
- 3.5.3. Women
- 3.5.4. Men
- 4. North America Shapewear Market Analysis, Opportunity and Forecast, 2016-2032
- 4.1. North America Shapewear Market Analysis, 2016-2021
- 4.2. North America Shapewear Market Opportunity and Forecast, 2023-2032
- 4.3. North America Shapewear Market Analysis, Opportunity and Forecast, By By Fabric Type Analysis, 2016-2032
- 4.3.1. North America Shapewear Market Analysis by By Fabric Type Analysis: Introduction
- 4.3.2. Market Size Absolute $ Opportunity Analysis and Forecast, By By Fabric Type Analysis, 2016-2032
- 4.3.3. Nylon
- 4.3.4. Spandex
- 4.3.5. Cotton
- 4.3.6. Lycra
- 4.4. North America Shapewear Market Analysis, Opportunity and Forecast, By By Distribution Channel Analysis, 2016-2032
- 4.4.1. North America Shapewear Market Analysis by By Distribution Channel Analysis: Introduction
- 4.4.2. Market Size Absolute $ Opportunity Analysis and Forecast, By By Distribution Channel Analysis, 2016-2032
- 4.4.3. Online
- 4.4.4. Supermarkets/ Hypermarkets
- 4.4.5. Specialty Stores
- 4.4.6. Other
- 4.5. North America Shapewear Market Analysis, Opportunity and Forecast, By End-User Analysis, 2016-2032
- 4.5.1. North America Shapewear Market Analysis by End-User Analysis: Introduction
- 4.5.2. Market Size Absolute $ Opportunity Analysis and Forecast, By End-User Analysis, 2016-2032
- 4.5.3. Women
- 4.5.4. Men
- 4.6. North America Shapewear Market Analysis, Opportunity and Forecast, By Country , 2016-2032
- 4.6.1. North America Shapewear Market Analysis by Country : Introduction
- 4.6.2. Market Size Absolute $ Opportunity Analysis and Forecast, Country , 2016-2032
- 4.6.2.1. The US
- 4.6.2.2. Canada
- 4.6.2.3. Mexico
- 5. Western Europe Shapewear Market Analysis, Opportunity and Forecast, 2016-2032
- 5.1. Western Europe Shapewear Market Analysis, 2016-2021
- 5.2. Western Europe Shapewear Market Opportunity and Forecast, 2023-2032
- 5.3. Western Europe Shapewear Market Analysis, Opportunity and Forecast, By By Fabric Type Analysis, 2016-2032
- 5.3.1. Western Europe Shapewear Market Analysis by By Fabric Type Analysis: Introduction
- 5.3.2. Market Size Absolute $ Opportunity Analysis and Forecast, By By Fabric Type Analysis, 2016-2032
- 5.3.3. Nylon
- 5.3.4. Spandex
- 5.3.5. Cotton
- 5.3.6. Lycra
- 5.4. Western Europe Shapewear Market Analysis, Opportunity and Forecast, By By Distribution Channel Analysis, 2016-2032
- 5.4.1. Western Europe Shapewear Market Analysis by By Distribution Channel Analysis: Introduction
- 5.4.2. Market Size Absolute $ Opportunity Analysis and Forecast, By By Distribution Channel Analysis, 2016-2032
- 5.4.3. Online
- 5.4.4. Supermarkets/ Hypermarkets
- 5.4.5. Specialty Stores
- 5.4.6. Other
- 5.5. Western Europe Shapewear Market Analysis, Opportunity and Forecast, By End-User Analysis, 2016-2032
- 5.5.1. Western Europe Shapewear Market Analysis by End-User Analysis: Introduction
- 5.5.2. Market Size Absolute $ Opportunity Analysis and Forecast, By End-User Analysis, 2016-2032
- 5.5.3. Women
- 5.5.4. Men
- 5.6. Western Europe Shapewear Market Analysis, Opportunity and Forecast, By Country , 2016-2032
- 5.6.1. Western Europe Shapewear Market Analysis by Country : Introduction
- 5.6.2. Market Size Absolute $ Opportunity Analysis and Forecast, Country , 2016-2032
- 5.6.2.1. Germany
- 5.6.2.2. France
- 5.6.2.3. The UK
- 5.6.2.4. Spain
- 5.6.2.5. Italy
- 5.6.2.6. Portugal
- 5.6.2.7. Ireland
- 5.6.2.8. Austria
- 5.6.2.9. Switzerland
- 5.6.2.10. Benelux
- 5.6.2.11. Nordic
- 5.6.2.12. Rest of Western Europe
- 6. Eastern Europe Shapewear Market Analysis, Opportunity and Forecast, 2016-2032
- 6.1. Eastern Europe Shapewear Market Analysis, 2016-2021
- 6.2. Eastern Europe Shapewear Market Opportunity and Forecast, 2023-2032
- 6.3. Eastern Europe Shapewear Market Analysis, Opportunity and Forecast, By By Fabric Type Analysis, 2016-2032
- 6.3.1. Eastern Europe Shapewear Market Analysis by By Fabric Type Analysis: Introduction
- 6.3.2. Market Size Absolute $ Opportunity Analysis and Forecast, By By Fabric Type Analysis, 2016-2032
- 6.3.3. Nylon
- 6.3.4. Spandex
- 6.3.5. Cotton
- 6.3.6. Lycra
- 6.4. Eastern Europe Shapewear Market Analysis, Opportunity and Forecast, By By Distribution Channel Analysis, 2016-2032
- 6.4.1. Eastern Europe Shapewear Market Analysis by By Distribution Channel Analysis: Introduction
- 6.4.2. Market Size Absolute $ Opportunity Analysis and Forecast, By By Distribution Channel Analysis, 2016-2032
- 6.4.3. Online
- 6.4.4. Supermarkets/ Hypermarkets
- 6.4.5. Specialty Stores
- 6.4.6. Other
- 6.5. Eastern Europe Shapewear Market Analysis, Opportunity and Forecast, By End-User Analysis, 2016-2032
- 6.5.1. Eastern Europe Shapewear Market Analysis by End-User Analysis: Introduction
- 6.5.2. Market Size Absolute $ Opportunity Analysis and Forecast, By End-User Analysis, 2016-2032
- 6.5.3. Women
- 6.5.4. Men
- 6.6. Eastern Europe Shapewear Market Analysis, Opportunity and Forecast, By Country , 2016-2032
- 6.6.1. Eastern Europe Shapewear Market Analysis by Country : Introduction
- 6.6.2. Market Size Absolute $ Opportunity Analysis and Forecast, Country , 2016-2032
- 6.6.2.1. Russia
- 6.6.2.2. Poland
- 6.6.2.3. The Czech Republic
- 6.6.2.4. Greece
- 6.6.2.5. Rest of Eastern Europe
- 7. APAC Shapewear Market Analysis, Opportunity and Forecast, 2016-2032
- 7.1. APAC Shapewear Market Analysis, 2016-2021
- 7.2. APAC Shapewear Market Opportunity and Forecast, 2023-2032
- 7.3. APAC Shapewear Market Analysis, Opportunity and Forecast, By By Fabric Type Analysis, 2016-2032
- 7.3.1. APAC Shapewear Market Analysis by By Fabric Type Analysis: Introduction
- 7.3.2. Market Size Absolute $ Opportunity Analysis and Forecast, By By Fabric Type Analysis, 2016-2032
- 7.3.3. Nylon
- 7.3.4. Spandex
- 7.3.5. Cotton
- 7.3.6. Lycra
- 7.4. APAC Shapewear Market Analysis, Opportunity and Forecast, By By Distribution Channel Analysis, 2016-2032
- 7.4.1. APAC Shapewear Market Analysis by By Distribution Channel Analysis: Introduction
- 7.4.2. Market Size Absolute $ Opportunity Analysis and Forecast, By By Distribution Channel Analysis, 2016-2032
- 7.4.3. Online
- 7.4.4. Supermarkets/ Hypermarkets
- 7.4.5. Specialty Stores
- 7.4.6. Other
- 7.5. APAC Shapewear Market Analysis, Opportunity and Forecast, By End-User Analysis, 2016-2032
- 7.5.1. APAC Shapewear Market Analysis by End-User Analysis: Introduction
- 7.5.2. Market Size Absolute $ Opportunity Analysis and Forecast, By End-User Analysis, 2016-2032
- 7.5.3. Women
- 7.5.4. Men
- 7.6. APAC Shapewear Market Analysis, Opportunity and Forecast, By Country , 2016-2032
- 7.6.1. APAC Shapewear Market Analysis by Country : Introduction
- 7.6.2. Market Size Absolute $ Opportunity Analysis and Forecast, Country , 2016-2032
- 7.6.2.1. China
- 7.6.2.2. Japan
- 7.6.2.3. South Korea
- 7.6.2.4. India
- 7.6.2.5. Australia & New Zeland
- 7.6.2.6. Indonesia
- 7.6.2.7. Malaysia
- 7.6.2.8. Philippines
- 7.6.2.9. Singapore
- 7.6.2.10. Thailand
- 7.6.2.11. Vietnam
- 7.6.2.12. Rest of APAC
- 8. Latin America Shapewear Market Analysis, Opportunity and Forecast, 2016-2032
- 8.1. Latin America Shapewear Market Analysis, 2016-2021
- 8.2. Latin America Shapewear Market Opportunity and Forecast, 2023-2032
- 8.3. Latin America Shapewear Market Analysis, Opportunity and Forecast, By By Fabric Type Analysis, 2016-2032
- 8.3.1. Latin America Shapewear Market Analysis by By Fabric Type Analysis: Introduction
- 8.3.2. Market Size Absolute $ Opportunity Analysis and Forecast, By By Fabric Type Analysis, 2016-2032
- 8.3.3. Nylon
- 8.3.4. Spandex
- 8.3.5. Cotton
- 8.3.6. Lycra
- 8.4. Latin America Shapewear Market Analysis, Opportunity and Forecast, By By Distribution Channel Analysis, 2016-2032
- 8.4.1. Latin America Shapewear Market Analysis by By Distribution Channel Analysis: Introduction
- 8.4.2. Market Size Absolute $ Opportunity Analysis and Forecast, By By Distribution Channel Analysis, 2016-2032
- 8.4.3. Online
- 8.4.4. Supermarkets/ Hypermarkets
- 8.4.5. Specialty Stores
- 8.4.6. Other
- 8.5. Latin America Shapewear Market Analysis, Opportunity and Forecast, By End-User Analysis, 2016-2032
- 8.5.1. Latin America Shapewear Market Analysis by End-User Analysis: Introduction
- 8.5.2. Market Size Absolute $ Opportunity Analysis and Forecast, By End-User Analysis, 2016-2032
- 8.5.3. Women
- 8.5.4. Men
- 8.6. Latin America Shapewear Market Analysis, Opportunity and Forecast, By Country , 2016-2032
- 8.6.1. Latin America Shapewear Market Analysis by Country : Introduction
- 8.6.2. Market Size Absolute $ Opportunity Analysis and Forecast, Country , 2016-2032
- 8.6.2.1. Brazil
- 8.6.2.2. Colombia
- 8.6.2.3. Chile
- 8.6.2.4. Argentina
- 8.6.2.5. Costa Rica
- 8.6.2.6. Rest of Latin America
- 9. Middle East & Africa Shapewear Market Analysis, Opportunity and Forecast, 2016-2032
- 9.1. Middle East & Africa Shapewear Market Analysis, 2016-2021
- 9.2. Middle East & Africa Shapewear Market Opportunity and Forecast, 2023-2032
- 9.3. Middle East & Africa Shapewear Market Analysis, Opportunity and Forecast, By By Fabric Type Analysis, 2016-2032
- 9.3.1. Middle East & Africa Shapewear Market Analysis by By Fabric Type Analysis: Introduction
- 9.3.2. Market Size Absolute $ Opportunity Analysis and Forecast, By By Fabric Type Analysis, 2016-2032
- 9.3.3. Nylon
- 9.3.4. Spandex
- 9.3.5. Cotton
- 9.3.6. Lycra
- 9.4. Middle East & Africa Shapewear Market Analysis, Opportunity and Forecast, By By Distribution Channel Analysis, 2016-2032
- 9.4.1. Middle East & Africa Shapewear Market Analysis by By Distribution Channel Analysis: Introduction
- 9.4.2. Market Size Absolute $ Opportunity Analysis and Forecast, By By Distribution Channel Analysis, 2016-2032
- 9.4.3. Online
- 9.4.4. Supermarkets/ Hypermarkets
- 9.4.5. Specialty Stores
- 9.4.6. Other
- 9.5. Middle East & Africa Shapewear Market Analysis, Opportunity and Forecast, By End-User Analysis, 2016-2032
- 9.5.1. Middle East & Africa Shapewear Market Analysis by End-User Analysis: Introduction
- 9.5.2. Market Size Absolute $ Opportunity Analysis and Forecast, By End-User Analysis, 2016-2032
- 9.5.3. Women
- 9.5.4. Men
- 9.6. Middle East & Africa Shapewear Market Analysis, Opportunity and Forecast, By Country , 2016-2032
- 9.6.1. Middle East & Africa Shapewear Market Analysis by Country : Introduction
- 9.6.2. Market Size Absolute $ Opportunity Analysis and Forecast, Country , 2016-2032
- 9.6.2.1. Algeria
- 9.6.2.2. Egypt
- 9.6.2.3. Israel
- 9.6.2.4. Kuwait
- 9.6.2.5. Nigeria
- 9.6.2.6. Saudi Arabia
- 9.6.2.7. South Africa
- 9.6.2.8. Turkey
- 9.6.2.9. The UAE
- 9.6.2.10. Rest of MEA
- 10. Global Shapewear Market Analysis, Opportunity and Forecast, By Region , 2016-2032
- 10.1. Global Shapewear Market Analysis by Region : Introduction
- 10.2. Market Size Absolute $ Opportunity Analysis and Forecast, By Region , 2016-2032
- 10.2.1. North America
- 10.2.2. Western Europe
- 10.2.3. Eastern Europe
- 10.2.4. APAC
- 10.2.5. Latin America
- 10.2.6. Middle East & Africa
- 11. Global Shapewear Market Competitive Landscape, Market Share Analysis, and Company Profiles
- 11.1. Market Share Analysis
- 11.2. Company Profiles
- 11.3. Spanx, Inc.
- 11.3.1. Company Overview
- 11.3.2. Financial Highlights
- 11.3.3. Product Portfolio
- 11.3.4. SWOT Analysis
- 11.3.5. Key Strategies and Developments
- 11.4. Leonisa
- 11.4.1. Company Overview
- 11.4.2. Financial Highlights
- 11.4.3. Product Portfolio
- 11.4.4. SWOT Analysis
- 11.4.5. Key Strategies and Developments
- 11.5. Ann Chery
- 11.5.1. Company Overview
- 11.5.2. Financial Highlights
- 11.5.3. Product Portfolio
- 11.5.4. SWOT Analysis
- 11.5.5. Key Strategies and Developments
- 11.6. Hanesbrands Inc.
- 11.6.1. Company Overview
- 11.6.2. Financial Highlights
- 11.6.3. Product Portfolio
- 11.6.4. SWOT Analysis
- 11.6.5. Key Strategies and Developments
- 11.7. Contourglobal PLC
- 11.7.1. Company Overview
- 11.7.2. Financial Highlights
- 11.7.3. Product Portfolio
- 11.7.4. SWOT Analysis
- 11.7.5. Key Strategies and Developments
- 11.8. Miraclesuit
- 11.8.1. Company Overview
- 11.8.2. Financial Highlights
- 11.8.3. Product Portfolio
- 11.8.4. SWOT Analysis
- 11.8.5. Key Strategies and Developments
- 11.9. CPS Shapers Pvt. Ltd.
- 11.9.1. Company Overview
- 11.9.2. Financial Highlights
- 11.9.3. Product Portfolio
- 11.9.4. SWOT Analysis
- 11.9.5. Key Strategies and Developments
- 11.10. Swee Shapewear Pvt Ltd
- 11.10.1. Company Overview
- 11.10.2. Financial Highlights
- 11.10.3. Product Portfolio
- 11.10.4. SWOT Analysis
- 11.10.5. Key Strategies and Developments
- 11.11. Triumph International
- 11.11.1. Company Overview
- 11.11.2. Financial Highlights
- 11.11.3. Product Portfolio
- 11.11.4. SWOT Analysis
- 11.11.5. Key Strategies and Developments
- 11.12. Jockey International, Inc.
- 11.12.1. Company Overview
- 11.12.2. Financial Highlights
- 11.12.3. Product Portfolio
- 11.12.4. SWOT Analysis
- 11.12.5. Key Strategies and Developments
- 11.13. Yummie
- 11.13.1. Company Overview
- 11.13.2. Financial Highlights
- 11.13.3. Product Portfolio
- 11.13.4. SWOT Analysis
- 11.13.5. Key Strategies and Developments
- 11.14. Other Players
- 11.14.1. Company Overview
- 11.14.2. Financial Highlights
- 11.14.3. Product Portfolio
- 11.14.4. SWOT Analysis
- 11.14.5. Key Strategies and Developments
- 12. Assumptions and Acronyms
- 13. Research Methodology
- 14. Contact
- List of Figures
- Figure 1: Global Shapewear Market Revenue (US$ Mn) Market Share by By Fabric Type Analysis in 2022
- Figure 2: Global Shapewear Market Attractiveness Analysis by By Fabric Type Analysis, 2016-2032
- Figure 3: Global Shapewear Market Revenue (US$ Mn) Market Share by By Distribution Channel Analysisin 2022
- Figure 4: Global Shapewear Market Attractiveness Analysis by By Distribution Channel Analysis, 2016-2032
- Figure 5: Global Shapewear Market Revenue (US$ Mn) Market Share by End-User Analysisin 2022
- Figure 6: Global Shapewear Market Attractiveness Analysis by End-User Analysis, 2016-2032
- Figure 7: Global Shapewear Market Revenue (US$ Mn) Market Share by Region in 2022
- Figure 8: Global Shapewear Market Attractiveness Analysis by Region, 2016-2032
- Figure 9: Global Shapewear Market Revenue (US$ Mn) (2016-2032)
- Figure 10: Global Shapewear Market Revenue (US$ Mn) Comparison by Region (2016-2032)
- Figure 11: Global Shapewear Market Revenue (US$ Mn) Comparison by By Fabric Type Analysis (2016-2032)
- Figure 12: Global Shapewear Market Revenue (US$ Mn) Comparison by By Distribution Channel Analysis (2016-2032)
- Figure 13: Global Shapewear Market Revenue (US$ Mn) Comparison by End-User Analysis (2016-2032)
- Figure 14: Global Shapewear Market Y-o-Y Growth Rate Comparison by Region (2016-2032)
- Figure 15: Global Shapewear Market Y-o-Y Growth Rate Comparison by By Fabric Type Analysis (2016-2032)
- Figure 16: Global Shapewear Market Y-o-Y Growth Rate Comparison by By Distribution Channel Analysis (2016-2032)
- Figure 17: Global Shapewear Market Y-o-Y Growth Rate Comparison by End-User Analysis (2016-2032)
- Figure 18: Global Shapewear Market Share Comparison by Region (2016-2032)
- Figure 19: Global Shapewear Market Share Comparison by By Fabric Type Analysis (2016-2032)
- Figure 20: Global Shapewear Market Share Comparison by By Distribution Channel Analysis (2016-2032)
- Figure 21: Global Shapewear Market Share Comparison by End-User Analysis (2016-2032)
- Figure 22: North America Shapewear Market Revenue (US$ Mn) Market Share by By Fabric Type Analysisin 2022
- Figure 23: North America Shapewear Market Attractiveness Analysis by By Fabric Type Analysis, 2016-2032
- Figure 24: North America Shapewear Market Revenue (US$ Mn) Market Share by By Distribution Channel Analysisin 2022
- Figure 25: North America Shapewear Market Attractiveness Analysis by By Distribution Channel Analysis, 2016-2032
- Figure 26: North America Shapewear Market Revenue (US$ Mn) Market Share by End-User Analysisin 2022
- Figure 27: North America Shapewear Market Attractiveness Analysis by End-User Analysis, 2016-2032
- Figure 28: North America Shapewear Market Revenue (US$ Mn) Market Share by Country in 2022
- Figure 29: North America Shapewear Market Attractiveness Analysis by Country, 2016-2032
- Figure 30: North America Shapewear Market Revenue (US$ Mn) (2016-2032)
- Figure 31: North America Shapewear Market Revenue (US$ Mn) Comparison by Country (2016-2032)
- Figure 32: North America Shapewear Market Revenue (US$ Mn) Comparison by By Fabric Type Analysis (2016-2032)
- Figure 33: North America Shapewear Market Revenue (US$ Mn) Comparison by By Distribution Channel Analysis (2016-2032)
- Figure 34: North America Shapewear Market Revenue (US$ Mn) Comparison by End-User Analysis (2016-2032)
- Figure 35: North America Shapewear Market Y-o-Y Growth Rate Comparison by Country (2016-2032)
- Figure 36: North America Shapewear Market Y-o-Y Growth Rate Comparison by By Fabric Type Analysis (2016-2032)
- Figure 37: North America Shapewear Market Y-o-Y Growth Rate Comparison by By Distribution Channel Analysis (2016-2032)
- Figure 38: North America Shapewear Market Y-o-Y Growth Rate Comparison by End-User Analysis (2016-2032)
- Figure 39: North America Shapewear Market Share Comparison by Country (2016-2032)
- Figure 40: North America Shapewear Market Share Comparison by By Fabric Type Analysis (2016-2032)
- Figure 41: North America Shapewear Market Share Comparison by By Distribution Channel Analysis (2016-2032)
- Figure 42: North America Shapewear Market Share Comparison by End-User Analysis (2016-2032)
- Figure 43: Western Europe Shapewear Market Revenue (US$ Mn) Market Share by By Fabric Type Analysisin 2022
- Figure 44: Western Europe Shapewear Market Attractiveness Analysis by By Fabric Type Analysis, 2016-2032
- Figure 45: Western Europe Shapewear Market Revenue (US$ Mn) Market Share by By Distribution Channel Analysisin 2022
- Figure 46: Western Europe Shapewear Market Attractiveness Analysis by By Distribution Channel Analysis, 2016-2032
- Figure 47: Western Europe Shapewear Market Revenue (US$ Mn) Market Share by End-User Analysisin 2022
- Figure 48: Western Europe Shapewear Market Attractiveness Analysis by End-User Analysis, 2016-2032
- Figure 49: Western Europe Shapewear Market Revenue (US$ Mn) Market Share by Country in 2022
- Figure 50: Western Europe Shapewear Market Attractiveness Analysis by Country, 2016-2032
- Figure 51: Western Europe Shapewear Market Revenue (US$ Mn) (2016-2032)
- Figure 52: Western Europe Shapewear Market Revenue (US$ Mn) Comparison by Country (2016-2032)
- Figure 53: Western Europe Shapewear Market Revenue (US$ Mn) Comparison by By Fabric Type Analysis (2016-2032)
- Figure 54: Western Europe Shapewear Market Revenue (US$ Mn) Comparison by By Distribution Channel Analysis (2016-2032)
- Figure 55: Western Europe Shapewear Market Revenue (US$ Mn) Comparison by End-User Analysis (2016-2032)
- Figure 56: Western Europe Shapewear Market Y-o-Y Growth Rate Comparison by Country (2016-2032)
- Figure 57: Western Europe Shapewear Market Y-o-Y Growth Rate Comparison by By Fabric Type Analysis (2016-2032)
- Figure 58: Western Europe Shapewear Market Y-o-Y Growth Rate Comparison by By Distribution Channel Analysis (2016-2032)
- Figure 59: Western Europe Shapewear Market Y-o-Y Growth Rate Comparison by End-User Analysis (2016-2032)
- Figure 60: Western Europe Shapewear Market Share Comparison by Country (2016-2032)
- Figure 61: Western Europe Shapewear Market Share Comparison by By Fabric Type Analysis (2016-2032)
- Figure 62: Western Europe Shapewear Market Share Comparison by By Distribution Channel Analysis (2016-2032)
- Figure 63: Western Europe Shapewear Market Share Comparison by End-User Analysis (2016-2032)
- Figure 64: Eastern Europe Shapewear Market Revenue (US$ Mn) Market Share by By Fabric Type Analysisin 2022
- Figure 65: Eastern Europe Shapewear Market Attractiveness Analysis by By Fabric Type Analysis, 2016-2032
- Figure 66: Eastern Europe Shapewear Market Revenue (US$ Mn) Market Share by By Distribution Channel Analysisin 2022
- Figure 67: Eastern Europe Shapewear Market Attractiveness Analysis by By Distribution Channel Analysis, 2016-2032
- Figure 68: Eastern Europe Shapewear Market Revenue (US$ Mn) Market Share by End-User Analysisin 2022
- Figure 69: Eastern Europe Shapewear Market Attractiveness Analysis by End-User Analysis, 2016-2032
- Figure 70: Eastern Europe Shapewear Market Revenue (US$ Mn) Market Share by Country in 2022
- Figure 71: Eastern Europe Shapewear Market Attractiveness Analysis by Country, 2016-2032
- Figure 72: Eastern Europe Shapewear Market Revenue (US$ Mn) (2016-2032)
- Figure 73: Eastern Europe Shapewear Market Revenue (US$ Mn) Comparison by Country (2016-2032)
- Figure 74: Eastern Europe Shapewear Market Revenue (US$ Mn) Comparison by By Fabric Type Analysis (2016-2032)
- Figure 75: Eastern Europe Shapewear Market Revenue (US$ Mn) Comparison by By Distribution Channel Analysis (2016-2032)
- Figure 76: Eastern Europe Shapewear Market Revenue (US$ Mn) Comparison by End-User Analysis (2016-2032)
- Figure 77: Eastern Europe Shapewear Market Y-o-Y Growth Rate Comparison by Country (2016-2032)
- Figure 78: Eastern Europe Shapewear Market Y-o-Y Growth Rate Comparison by By Fabric Type Analysis (2016-2032)
- Figure 79: Eastern Europe Shapewear Market Y-o-Y Growth Rate Comparison by By Distribution Channel Analysis (2016-2032)
- Figure 80: Eastern Europe Shapewear Market Y-o-Y Growth Rate Comparison by End-User Analysis (2016-2032)
- Figure 81: Eastern Europe Shapewear Market Share Comparison by Country (2016-2032)
- Figure 82: Eastern Europe Shapewear Market Share Comparison by By Fabric Type Analysis (2016-2032)
- Figure 83: Eastern Europe Shapewear Market Share Comparison by By Distribution Channel Analysis (2016-2032)
- Figure 84: Eastern Europe Shapewear Market Share Comparison by End-User Analysis (2016-2032)
- Figure 85: APAC Shapewear Market Revenue (US$ Mn) Market Share by By Fabric Type Analysisin 2022
- Figure 86: APAC Shapewear Market Attractiveness Analysis by By Fabric Type Analysis, 2016-2032
- Figure 87: APAC Shapewear Market Revenue (US$ Mn) Market Share by By Distribution Channel Analysisin 2022
- Figure 88: APAC Shapewear Market Attractiveness Analysis by By Distribution Channel Analysis, 2016-2032
- Figure 89: APAC Shapewear Market Revenue (US$ Mn) Market Share by End-User Analysisin 2022
- Figure 90: APAC Shapewear Market Attractiveness Analysis by End-User Analysis, 2016-2032
- Figure 91: APAC Shapewear Market Revenue (US$ Mn) Market Share by Country in 2022
- Figure 92: APAC Shapewear Market Attractiveness Analysis by Country, 2016-2032
- Figure 93: APAC Shapewear Market Revenue (US$ Mn) (2016-2032)
- Figure 94: APAC Shapewear Market Revenue (US$ Mn) Comparison by Country (2016-2032)
- Figure 95: APAC Shapewear Market Revenue (US$ Mn) Comparison by By Fabric Type Analysis (2016-2032)
- Figure 96: APAC Shapewear Market Revenue (US$ Mn) Comparison by By Distribution Channel Analysis (2016-2032)
- Figure 97: APAC Shapewear Market Revenue (US$ Mn) Comparison by End-User Analysis (2016-2032)
- Figure 98: APAC Shapewear Market Y-o-Y Growth Rate Comparison by Country (2016-2032)
- Figure 99: APAC Shapewear Market Y-o-Y Growth Rate Comparison by By Fabric Type Analysis (2016-2032)
- Figure 100: APAC Shapewear Market Y-o-Y Growth Rate Comparison by By Distribution Channel Analysis (2016-2032)
- Figure 101: APAC Shapewear Market Y-o-Y Growth Rate Comparison by End-User Analysis (2016-2032)
- Figure 102: APAC Shapewear Market Share Comparison by Country (2016-2032)
- Figure 103: APAC Shapewear Market Share Comparison by By Fabric Type Analysis (2016-2032)
- Figure 104: APAC Shapewear Market Share Comparison by By Distribution Channel Analysis (2016-2032)
- Figure 105: APAC Shapewear Market Share Comparison by End-User Analysis (2016-2032)
- Figure 106: Latin America Shapewear Market Revenue (US$ Mn) Market Share by By Fabric Type Analysisin 2022
- Figure 107: Latin America Shapewear Market Attractiveness Analysis by By Fabric Type Analysis, 2016-2032
- Figure 108: Latin America Shapewear Market Revenue (US$ Mn) Market Share by By Distribution Channel Analysisin 2022
- Figure 109: Latin America Shapewear Market Attractiveness Analysis by By Distribution Channel Analysis, 2016-2032
- Figure 110: Latin America Shapewear Market Revenue (US$ Mn) Market Share by End-User Analysisin 2022
- Figure 111: Latin America Shapewear Market Attractiveness Analysis by End-User Analysis, 2016-2032
- Figure 112: Latin America Shapewear Market Revenue (US$ Mn) Market Share by Country in 2022
- Figure 113: Latin America Shapewear Market Attractiveness Analysis by Country, 2016-2032
- Figure 114: Latin America Shapewear Market Revenue (US$ Mn) (2016-2032)
- Figure 115: Latin America Shapewear Market Revenue (US$ Mn) Comparison by Country (2016-2032)
- Figure 116: Latin America Shapewear Market Revenue (US$ Mn) Comparison by By Fabric Type Analysis (2016-2032)
- Figure 117: Latin America Shapewear Market Revenue (US$ Mn) Comparison by By Distribution Channel Analysis (2016-2032)
- Figure 118: Latin America Shapewear Market Revenue (US$ Mn) Comparison by End-User Analysis (2016-2032)
- Figure 119: Latin America Shapewear Market Y-o-Y Growth Rate Comparison by Country (2016-2032)
- Figure 120: Latin America Shapewear Market Y-o-Y Growth Rate Comparison by By Fabric Type Analysis (2016-2032)
- Figure 121: Latin America Shapewear Market Y-o-Y Growth Rate Comparison by By Distribution Channel Analysis (2016-2032)
- Figure 122: Latin America Shapewear Market Y-o-Y Growth Rate Comparison by End-User Analysis (2016-2032)
- Figure 123: Latin America Shapewear Market Share Comparison by Country (2016-2032)
- Figure 124: Latin America Shapewear Market Share Comparison by By Fabric Type Analysis (2016-2032)
- Figure 125: Latin America Shapewear Market Share Comparison by By Distribution Channel Analysis (2016-2032)
- Figure 126: Latin America Shapewear Market Share Comparison by End-User Analysis (2016-2032)
- Figure 127: Middle East & Africa Shapewear Market Revenue (US$ Mn) Market Share by By Fabric Type Analysisin 2022
- Figure 128: Middle East & Africa Shapewear Market Attractiveness Analysis by By Fabric Type Analysis, 2016-2032
- Figure 129: Middle East & Africa Shapewear Market Revenue (US$ Mn) Market Share by By Distribution Channel Analysisin 2022
- Figure 130: Middle East & Africa Shapewear Market Attractiveness Analysis by By Distribution Channel Analysis, 2016-2032
- Figure 131: Middle East & Africa Shapewear Market Revenue (US$ Mn) Market Share by End-User Analysisin 2022
- Figure 132: Middle East & Africa Shapewear Market Attractiveness Analysis by End-User Analysis, 2016-2032
- Figure 133: Middle East & Africa Shapewear Market Revenue (US$ Mn) Market Share by Country in 2022
- Figure 134: Middle East & Africa Shapewear Market Attractiveness Analysis by Country, 2016-2032
- Figure 135: Middle East & Africa Shapewear Market Revenue (US$ Mn) (2016-2032)
- Figure 136: Middle East & Africa Shapewear Market Revenue (US$ Mn) Comparison by Country (2016-2032)
- Figure 137: Middle East & Africa Shapewear Market Revenue (US$ Mn) Comparison by By Fabric Type Analysis (2016-2032)
- Figure 138: Middle East & Africa Shapewear Market Revenue (US$ Mn) Comparison by By Distribution Channel Analysis (2016-2032)
- Figure 139: Middle East & Africa Shapewear Market Revenue (US$ Mn) Comparison by End-User Analysis (2016-2032)
- Figure 140: Middle East & Africa Shapewear Market Y-o-Y Growth Rate Comparison by Country (2016-2032)
- Figure 141: Middle East & Africa Shapewear Market Y-o-Y Growth Rate Comparison by By Fabric Type Analysis (2016-2032)
- Figure 142: Middle East & Africa Shapewear Market Y-o-Y Growth Rate Comparison by By Distribution Channel Analysis (2016-2032)
- Figure 143: Middle East & Africa Shapewear Market Y-o-Y Growth Rate Comparison by End-User Analysis (2016-2032)
- Figure 144: Middle East & Africa Shapewear Market Share Comparison by Country (2016-2032)
- Figure 145: Middle East & Africa Shapewear Market Share Comparison by By Fabric Type Analysis (2016-2032)
- Figure 146: Middle East & Africa Shapewear Market Share Comparison by By Distribution Channel Analysis (2016-2032)
- Figure 147: Middle East & Africa Shapewear Market Share Comparison by End-User Analysis (2016-2032)
- List of Tables
- Table 1: Global Shapewear Market Comparison by By Fabric Type Analysis (2016-2032)
- Table 2: Global Shapewear Market Comparison by By Distribution Channel Analysis (2016-2032)
- Table 3: Global Shapewear Market Comparison by End-User Analysis (2016-2032)
- Table 4: Global Shapewear Market Revenue (US$ Mn) Comparison by Region (2016-2032)
- Table 5: Global Shapewear Market Revenue (US$ Mn) (2016-2032)
- Table 6: Global Shapewear Market Revenue (US$ Mn) Comparison by Region (2016-2032)
- Table 7: Global Shapewear Market Revenue (US$ Mn) Comparison by By Fabric Type Analysis (2016-2032)
- Table 8: Global Shapewear Market Revenue (US$ Mn) Comparison by By Distribution Channel Analysis (2016-2032)
- Table 9: Global Shapewear Market Revenue (US$ Mn) Comparison by End-User Analysis (2016-2032)
- Table 10: Global Shapewear Market Y-o-Y Growth Rate Comparison by Region (2016-2032)
- Table 11: Global Shapewear Market Y-o-Y Growth Rate Comparison by By Fabric Type Analysis (2016-2032)
- Table 12: Global Shapewear Market Y-o-Y Growth Rate Comparison by By Distribution Channel Analysis (2016-2032)
- Table 13: Global Shapewear Market Y-o-Y Growth Rate Comparison by End-User Analysis (2016-2032)
- Table 14: Global Shapewear Market Share Comparison by Region (2016-2032)
- Table 15: Global Shapewear Market Share Comparison by By Fabric Type Analysis (2016-2032)
- Table 16: Global Shapewear Market Share Comparison by By Distribution Channel Analysis (2016-2032)
- Table 17: Global Shapewear Market Share Comparison by End-User Analysis (2016-2032)
- Table 18: North America Shapewear Market Comparison by By Distribution Channel Analysis (2016-2032)
- Table 19: North America Shapewear Market Comparison by End-User Analysis (2016-2032)
- Table 20: North America Shapewear Market Revenue (US$ Mn) Comparison by Country (2016-2032)
- Table 21: North America Shapewear Market Revenue (US$ Mn) (2016-2032)
- Table 22: North America Shapewear Market Revenue (US$ Mn) Comparison by Country (2016-2032)
- Table 23: North America Shapewear Market Revenue (US$ Mn) Comparison by By Fabric Type Analysis (2016-2032)
- Table 24: North America Shapewear Market Revenue (US$ Mn) Comparison by By Distribution Channel Analysis (2016-2032)
- Table 25: North America Shapewear Market Revenue (US$ Mn) Comparison by End-User Analysis (2016-2032)
- Table 26: North America Shapewear Market Y-o-Y Growth Rate Comparison by Country (2016-2032)
- Table 27: North America Shapewear Market Y-o-Y Growth Rate Comparison by By Fabric Type Analysis (2016-2032)
- Table 28: North America Shapewear Market Y-o-Y Growth Rate Comparison by By Distribution Channel Analysis (2016-2032)
- Table 29: North America Shapewear Market Y-o-Y Growth Rate Comparison by End-User Analysis (2016-2032)
- Table 30: North America Shapewear Market Share Comparison by Country (2016-2032)
- Table 31: North America Shapewear Market Share Comparison by By Fabric Type Analysis (2016-2032)
- Table 32: North America Shapewear Market Share Comparison by By Distribution Channel Analysis (2016-2032)
- Table 33: North America Shapewear Market Share Comparison by End-User Analysis (2016-2032)
- Table 34: Western Europe Shapewear Market Comparison by By Fabric Type Analysis (2016-2032)
- Table 35: Western Europe Shapewear Market Comparison by By Distribution Channel Analysis (2016-2032)
- Table 36: Western Europe Shapewear Market Comparison by End-User Analysis (2016-2032)
- Table 37: Western Europe Shapewear Market Revenue (US$ Mn) Comparison by Country (2016-2032)
- Table 38: Western Europe Shapewear Market Revenue (US$ Mn) (2016-2032)
- Table 39: Western Europe Shapewear Market Revenue (US$ Mn) Comparison by Country (2016-2032)
- Table 40: Western Europe Shapewear Market Revenue (US$ Mn) Comparison by By Fabric Type Analysis (2016-2032)
- Table 41: Western Europe Shapewear Market Revenue (US$ Mn) Comparison by By Distribution Channel Analysis (2016-2032)
- Table 42: Western Europe Shapewear Market Revenue (US$ Mn) Comparison by End-User Analysis (2016-2032)
- Table 43: Western Europe Shapewear Market Y-o-Y Growth Rate Comparison by Country (2016-2032)
- Table 44: Western Europe Shapewear Market Y-o-Y Growth Rate Comparison by By Fabric Type Analysis (2016-2032)
- Table 45: Western Europe Shapewear Market Y-o-Y Growth Rate Comparison by By Distribution Channel Analysis (2016-2032)
- Table 46: Western Europe Shapewear Market Y-o-Y Growth Rate Comparison by End-User Analysis (2016-2032)
- Table 47: Western Europe Shapewear Market Share Comparison by Country (2016-2032)
- Table 48: Western Europe Shapewear Market Share Comparison by By Fabric Type Analysis (2016-2032)
- Table 49: Western Europe Shapewear Market Share Comparison by By Distribution Channel Analysis (2016-2032)
- Table 50: Western Europe Shapewear Market Share Comparison by End-User Analysis (2016-2032)
- Table 51: Eastern Europe Shapewear Market Comparison by By Fabric Type Analysis (2016-2032)
- Table 52: Eastern Europe Shapewear Market Comparison by By Distribution Channel Analysis (2016-2032)
- Table 53: Eastern Europe Shapewear Market Comparison by End-User Analysis (2016-2032)
- Table 54: Eastern Europe Shapewear Market Revenue (US$ Mn) Comparison by Country (2016-2032)
- Table 55: Eastern Europe Shapewear Market Revenue (US$ Mn) (2016-2032)
- Table 56: Eastern Europe Shapewear Market Revenue (US$ Mn) Comparison by Country (2016-2032)
- Table 57: Eastern Europe Shapewear Market Revenue (US$ Mn) Comparison by By Fabric Type Analysis (2016-2032)
- Table 58: Eastern Europe Shapewear Market Revenue (US$ Mn) Comparison by By Distribution Channel Analysis (2016-2032)
- Table 59: Eastern Europe Shapewear Market Revenue (US$ Mn) Comparison by End-User Analysis (2016-2032)
- Table 60: Eastern Europe Shapewear Market Y-o-Y Growth Rate Comparison by Country (2016-2032)
- Table 61: Eastern Europe Shapewear Market Y-o-Y Growth Rate Comparison by By Fabric Type Analysis (2016-2032)
- Table 62: Eastern Europe Shapewear Market Y-o-Y Growth Rate Comparison by By Distribution Channel Analysis (2016-2032)
- Table 63: Eastern Europe Shapewear Market Y-o-Y Growth Rate Comparison by End-User Analysis (2016-2032)
- Table 64: Eastern Europe Shapewear Market Share Comparison by Country (2016-2032)
- Table 65: Eastern Europe Shapewear Market Share Comparison by By Fabric Type Analysis (2016-2032)
- Table 66: Eastern Europe Shapewear Market Share Comparison by By Distribution Channel Analysis (2016-2032)
- Table 67: Eastern Europe Shapewear Market Share Comparison by End-User Analysis (2016-2032)
- Table 68: APAC Shapewear Market Comparison by By Fabric Type Analysis (2016-2032)
- Table 69: APAC Shapewear Market Comparison by By Distribution Channel Analysis (2016-2032)
- Table 70: APAC Shapewear Market Comparison by End-User Analysis (2016-2032)
- Table 71: APAC Shapewear Market Revenue (US$ Mn) Comparison by Country (2016-2032)
- Table 72: APAC Shapewear Market Revenue (US$ Mn) (2016-2032)
- Table 73: APAC Shapewear Market Revenue (US$ Mn) Comparison by Country (2016-2032)
- Table 74: APAC Shapewear Market Revenue (US$ Mn) Comparison by By Fabric Type Analysis (2016-2032)
- Table 75: APAC Shapewear Market Revenue (US$ Mn) Comparison by By Distribution Channel Analysis (2016-2032)
- Table 76: APAC Shapewear Market Revenue (US$ Mn) Comparison by End-User Analysis (2016-2032)
- Table 77: APAC Shapewear Market Y-o-Y Growth Rate Comparison by Country (2016-2032)
- Table 78: APAC Shapewear Market Y-o-Y Growth Rate Comparison by By Fabric Type Analysis (2016-2032)
- Table 79: APAC Shapewear Market Y-o-Y Growth Rate Comparison by By Distribution Channel Analysis (2016-2032)
- Table 80: APAC Shapewear Market Y-o-Y Growth Rate Comparison by End-User Analysis (2016-2032)
- Table 81: APAC Shapewear Market Share Comparison by Country (2016-2032)
- Table 82: APAC Shapewear Market Share Comparison by By Fabric Type Analysis (2016-2032)
- Table 83: APAC Shapewear Market Share Comparison by By Distribution Channel Analysis (2016-2032)
- Table 84: APAC Shapewear Market Share Comparison by End-User Analysis (2016-2032)
- Table 85: Latin America Shapewear Market Comparison by By Fabric Type Analysis (2016-2032)
- Table 86: Latin America Shapewear Market Comparison by By Distribution Channel Analysis (2016-2032)
- Table 87: Latin America Shapewear Market Comparison by End-User Analysis (2016-2032)
- Table 88: Latin America Shapewear Market Revenue (US$ Mn) Comparison by Country (2016-2032)
- Table 89: Latin America Shapewear Market Revenue (US$ Mn) (2016-2032)
- Table 90: Latin America Shapewear Market Revenue (US$ Mn) Comparison by Country (2016-2032)
- Table 91: Latin America Shapewear Market Revenue (US$ Mn) Comparison by By Fabric Type Analysis (2016-2032)
- Table 92: Latin America Shapewear Market Revenue (US$ Mn) Comparison by By Distribution Channel Analysis (2016-2032)
- Table 93: Latin America Shapewear Market Revenue (US$ Mn) Comparison by End-User Analysis (2016-2032)
- Table 94: Latin America Shapewear Market Y-o-Y Growth Rate Comparison by Country (2016-2032)
- Table 95: Latin America Shapewear Market Y-o-Y Growth Rate Comparison by By Fabric Type Analysis (2016-2032)
- Table 96: Latin America Shapewear Market Y-o-Y Growth Rate Comparison by By Distribution Channel Analysis (2016-2032)
- Table 97: Latin America Shapewear Market Y-o-Y Growth Rate Comparison by End-User Analysis (2016-2032)
- Table 98: Latin America Shapewear Market Share Comparison by Country (2016-2032)
- Table 99: Latin America Shapewear Market Share Comparison by By Fabric Type Analysis (2016-2032)
- Table 100: Latin America Shapewear Market Share Comparison by By Distribution Channel Analysis (2016-2032)
- Table 101: Latin America Shapewear Market Share Comparison by End-User Analysis (2016-2032)
- Table 102: Middle East & Africa Shapewear Market Comparison by By Fabric Type Analysis (2016-2032)
- Table 103: Middle East & Africa Shapewear Market Comparison by By Distribution Channel Analysis (2016-2032)
- Table 104: Middle East & Africa Shapewear Market Comparison by End-User Analysis (2016-2032)
- Table 105: Middle East & Africa Shapewear Market Revenue (US$ Mn) Comparison by Country (2016-2032)
- Table 106: Middle East & Africa Shapewear Market Revenue (US$ Mn) (2016-2032)
- Table 107: Middle East & Africa Shapewear Market Revenue (US$ Mn) Comparison by Country (2016-2032)
- Table 108: Middle East & Africa Shapewear Market Revenue (US$ Mn) Comparison by By Fabric Type Analysis (2016-2032)
- Table 109: Middle East & Africa Shapewear Market Revenue (US$ Mn) Comparison by By Distribution Channel Analysis (2016-2032)
- Table 110: Middle East & Africa Shapewear Market Revenue (US$ Mn) Comparison by End-User Analysis (2016-2032)
- Table 111: Middle East & Africa Shapewear Market Y-o-Y Growth Rate Comparison by Country (2016-2032)
- Table 112: Middle East & Africa Shapewear Market Y-o-Y Growth Rate Comparison by By Fabric Type Analysis (2016-2032)
- Table 113: Middle East & Africa Shapewear Market Y-o-Y Growth Rate Comparison by By Distribution Channel Analysis (2016-2032)
- Table 114: Middle East & Africa Shapewear Market Y-o-Y Growth Rate Comparison by End-User Analysis (2016-2032)
- Table 115: Middle East & Africa Shapewear Market Share Comparison by Country (2016-2032)
- Table 116: Middle East & Africa Shapewear Market Share Comparison by By Fabric Type Analysis (2016-2032)
- Table 117: Middle East & Africa Shapewear Market Share Comparison by By Distribution Channel Analysis (2016-2032)
- Table 118: Middle East & Africa Shapewear Market Share Comparison by End-User Analysis (2016-2032)
- 1. Executive Summary
-
- Spanx, Inc.
- Leonisa
- Ann Chery
- Hanesbrands Inc.
- Contourglobal PLC
- Miraclesuit
- CPS Shapers Pvt. Ltd.
- Swee Shapewear Pvt Ltd
- Triumph International
- Jockey International, Inc.
- Yummie
- Other Players
Our Clients


View Our Licence Options
