Women’s Activewear Market By Product Type (Activewear Tops, Activewear Bottoms, Activewear Outerwear, Sports Bras, Athleisure Wear, Yoga Wear, Running Apparel, Fitness Accessories), By Fabric Type (Polyester, Nylon, Cotton, Spandex, Polypropylene, Rayon, Others), By Distribution Channel (offline, online), By Region and Companies - Industry Segment Outlook, Market Assessment, Competition Scenario, Trends and Forecast 2024-2033
-
48182
-
June 2024
-
261
-


-
This report was compiled by Research Team Research team of over 50 passionate professionals leverages advanced research methodologies and analytical expertise to deliver insightful, data-driven market intelligence that empowers businesses across diverse industries to make strategic, well-informed Correspondence Research Team Linkedin | Detailed Market research Methodology Our methodology involves a mix of primary research, including interviews with leading mental health experts, and secondary research from reputable medical journals and databases. View Detailed Methodology Page
-
Quick Navigation
Report Overview
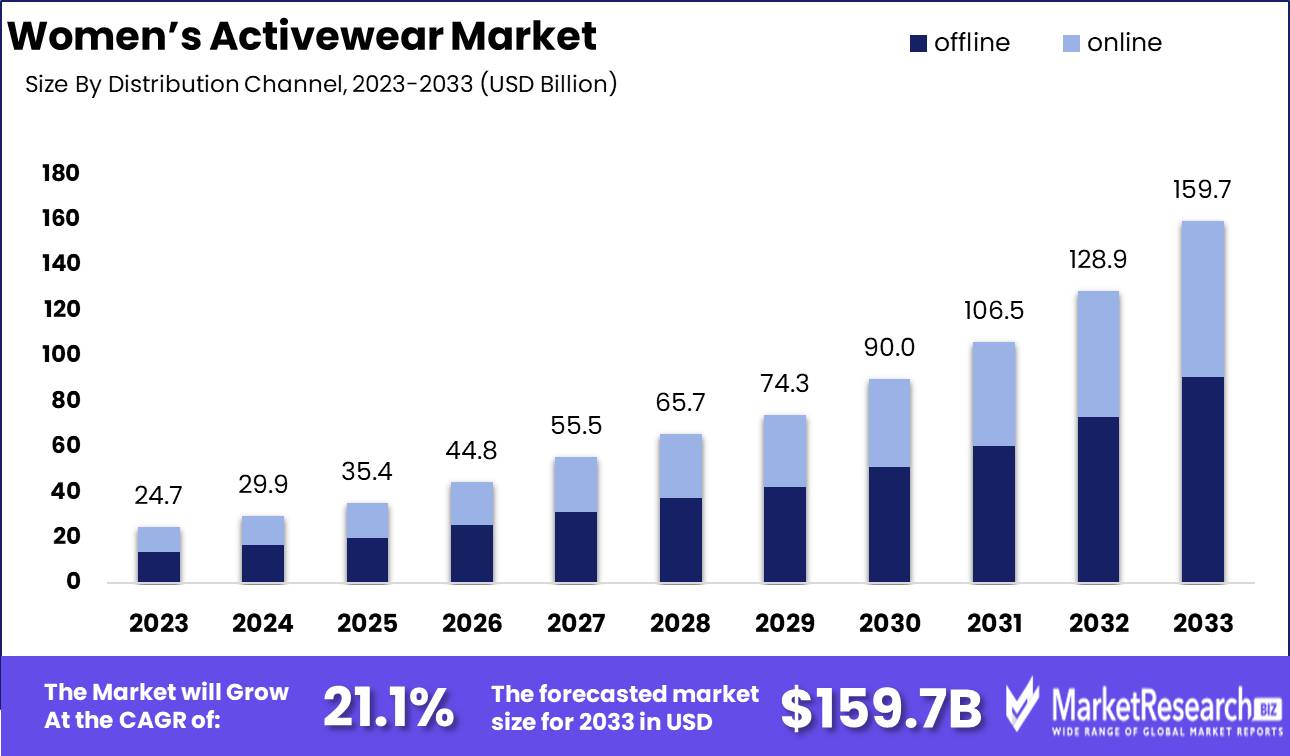
The Global Women’s Activewear Market was valued at USD 24.7 Bn in 2023. It is expected to reach USD 159.7 Bn by 2033, with a CAGR of 21.1% during the forecast period from 2024 to 2033.
The Women’s Activewear Market encompasses the production, distribution, and retail of apparel specifically designed for physical activities and sports, tailored to meet the needs of female consumers. This market includes a wide range of products such as sports bras, leggings, tops, shorts, and outerwear, engineered for performance, comfort, and style. Driven by increasing health awareness, the rise of athleisure trends, and advancements in fabric technology, the market is experiencing robust growth.
 The Women’s Activewear Market is poised for significant growth, driven by rising health consciousness, the athleisure trend, and continuous advancements in textile technology. The market's expansion is underpinned by innovations in manufacturing techniques, such as 3D printing and electrospinning, which enable the creation of specialized fabrics with unique properties like enhanced breathability, durability, and moisture-wicking capabilities. Sustainability has become a critical focus, with the introduction of technologies like CiCLO, launched in 2017, which integrates a textile ingredient designed to reduce synthetic microfibre pollution, addressing the growing concern over micro-plastics.
Key market players, including industry giants like Nike, Adidas, and Under Armour, are leveraging these technological advancements to develop high-performance, eco-friendly activewear that meets the evolving demands of consumers. These companies are not only driving innovation but also setting benchmarks for sustainability, appealing to a more environmentally conscious consumer base.
The market is witnessing a surge in demand for versatile activewear that transitions seamlessly from workouts to casual wear, fueled by the rise of remote work and a more flexible lifestyle. This trend is particularly pronounced among younger demographics who prioritize both functionality and style in their activewear choices.
Strategic marketing initiatives and collaborations with influencers and athletes further amplify brand visibility and consumer engagement. The competitive landscape is also shaped by emerging brands that focus on niche markets, offering specialized products and personalized shopping experiences.
Key Takeaways
- Market Value: The Global Women’s Activewear Market was valued at USD 24.7 Bn in 2023. It is expected to reach USD 159.7 Bn by 2033, with a CAGR of 21.1% during the forecast period from 2024 to 2033.
- By Product Type: Activewear Tops lead with a 25% market share, driven by their versatility and popularity for both fitness and casual wear.
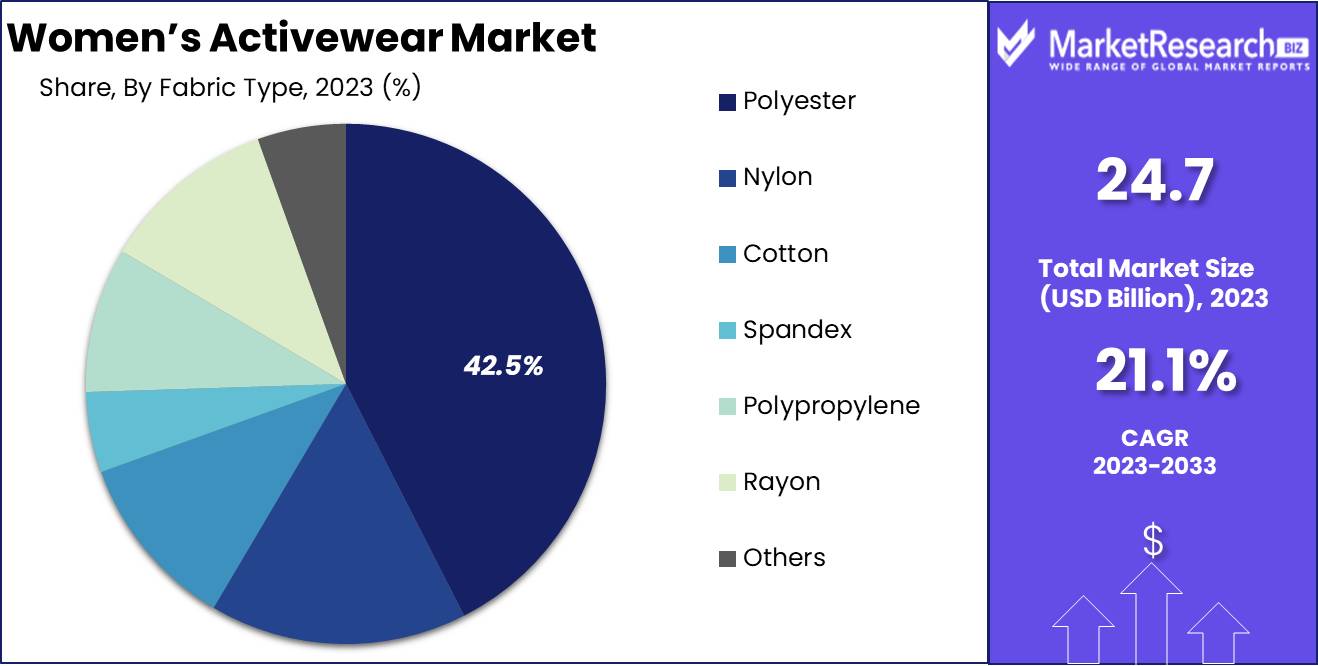
- By Fabric Type: Polyester dominates with a 30% market share, valued for its durability, moisture-wicking properties, and cost-effectiveness.
- By Distribution Channel: Online sales capture 57% of the market, reflecting the increasing preference for e-commerce due to its convenience and extensive product range.
- Regional Dominance: North America holds a 35% market share, supported by high consumer spending on fitness and a strong presence of leading brands.
- Growth Opportunity: Technological advancements in fabric innovation and sustainable materials present significant growth opportunities.
Driving factors
Health Consciousness
The increasing health consciousness among women is a primary driver of the Women’s Activewear Market. As more women adopt healthier lifestyles and integrate fitness routines into their daily lives, the demand for functional and comfortable activewear has surged. This trend is supported by the growing awareness of the benefits of regular exercise in preventing chronic diseases, improving mental health, and enhancing overall well-being. The market has responded with innovative products that cater to these needs, contributing significantly to its growth.
Sports Enthusiasm and Rising Participation Rates
The rising enthusiasm for sports and fitness activities is another critical factor propelling the market. There has been a notable increase in female participation in sports, fitness classes, and outdoor activities. According to recent statistics, sports participation rates among women have seen consistent growth, driving the demand for specialized activewear designed for various sports and physical activities. This trend is further supported by initiatives and programs encouraging women’s involvement in sports, leading to a steady increase in market size.
Advanced Activewear Technologies
The inherent advantages of modern activewear, such as enhanced comfort, flexibility, and performance, have played a pivotal role in market expansion. Technological advancements in fabric and garment design have led to the development of activewear that offers superior moisture-wicking, breathability, and durability. For instance, the use of polyester, which holds a 30% share in the fabric segment, exemplifies the industry's move towards materials that improve athletic performance and comfort. These advantages not only attract fitness enthusiasts but also appeal to the general population seeking high-quality, comfortable clothing for everyday wear.
Restraining Factors
High Design Costs
High design costs are a significant challenge for the Women’s Activewear Market. The process of creating high-quality, innovative activewear involves substantial investment in research and development, advanced manufacturing technologies, and skilled labor. Brands striving to stay competitive must continuously innovate in fabric technology, fit, and style, all of which drive up production costs.
The integration of advanced materials like moisture-wicking polyester, which holds a 30% share in the fabric segment, requires substantial financial resources. These costs can compress profit margins, especially for smaller brands or new entrants, potentially slowing market expansion. However, established brands often absorb these costs better, leveraging economies of scale and higher price points to maintain profitability.
Counterfeit Products
The proliferation of counterfeit products poses a significant threat to the Women’s Activewear Market. Counterfeit activewear, often sold at much lower prices, undermines the market by eroding consumer trust and devaluing authentic brands. This issue is particularly pronounced in online sales channels, which represent 57% of the market distribution.
Consumers duped by low-quality counterfeits may associate poor performance and durability with genuine brands, harming brand reputation and customer loyalty. Counterfeits can significantly impact sales revenues for legitimate brands, making it challenging for them to recoup the high design and production costs associated with producing authentic, high-performance activewear.
By Product Type Analysis
Activewear Tops dominated the By Product Type segment of the Women’s Activewear Market, capturing over 25% market share.
In 2023, Activewear Tops held a dominant market position in the By Product Type segment of the Women’s Activewear Market, capturing more than a 25% share. This leadership is attributed to the widespread adoption of tops designed for versatility, combining performance features with fashion-forward designs. Consumers increasingly seek tops that transition seamlessly from gym sessions to casual outings, driving demand for multifunctional apparel. The integration of advanced fabric technologies, such as moisture-wicking and odor-resistant materials, further enhances the appeal of activewear tops among fitness enthusiasts and everyday wearers.
Activewear Bottoms and Sports Bras also constitute significant segments within the market. Activewear Bottoms, including leggings and shorts, are essential for various fitness activities, emphasizing comfort, durability, and style. The trend towards high-waisted designs and the use of compression fabrics has bolstered their popularity. Meanwhile, Sports Bras have seen heightened demand due to increased awareness of the importance of support during physical activity. Innovations in design and materials, offering better support and comfort without compromising on aesthetics, have propelled this segment's growth.
Athleisure Wear, Yoga Wear, Running Apparel, and Fitness Accessories collectively contribute to the market's diversity and expansion. Athleisure Wear, blending athletic and leisure aesthetics, has gained substantial traction, driven by lifestyle shifts favoring casual, comfortable attire. Yoga Wear, characterized by soft, stretchable fabrics and ergonomic designs, caters to the growing popularity of yoga and mindfulness practices. Running Apparel emphasizes performance-enhancing features, such as breathability and lightweight materials, while Fitness Accessories, including items like gloves, headbands, and water bottles, complement the primary apparel categories, offering consumers a comprehensive fitness solution.
By Fabric Type Analysis
Polyester dominated the By Fabric Type segment of the Women’s Activewear Market in 2023, with 30% market share.
In 2023, Polyester held a dominant market position in the By Fabric Type segment of the Women’s Activewear Market, capturing more than a 30% share. Polyester's dominance is driven by its durability, moisture-wicking properties, and cost-effectiveness. It is widely used in various activewear products, including tops, bottoms, and outerwear, making it a staple fabric for both high-performance sportswear and everyday athleisure.
Nylon and Spandex are also key players in the market. Nylon is valued for its strength and lightweight nature, providing excellent support and flexibility, particularly in sports bras and leggings. Spandex, known for its exceptional elasticity, is often blended with other fabrics to enhance fit and comfort, critical for activities requiring a full range of motion, such as yoga and running.
Cotton, Polypropylene, and Rayon cater to niche segments within the market. Cotton, appreciated for its softness and breathability, is preferred for casual and low-intensity activities, although it is less common in high-performance gear due to its moisture retention properties. Polypropylene offers excellent insulation and moisture transfer, making it ideal for base layers in colder climates. Rayon, a semi-synthetic fiber, provides a silky feel and is often used in fashionable athleisure wear. Other specialty fabrics, including eco-friendly and technologically advanced materials, continue to emerge, catering to evolving consumer preferences for sustainability and innovation.
By Distribution Channel Analysis
Women’s Activewear Market saw the Online segment capture 57% of the distribution channel share.
In 2023, Online held a dominant market position in the By Distribution Channel segment of the Women’s Activewear Market, capturing more than a 57% share. The rise of e-commerce platforms and the increasing preference for online shopping have significantly boosted this segment. Consumers are drawn to the convenience, extensive product range, and competitive pricing offered by online retailers. Furthermore, advancements in technology, such as virtual fitting rooms and personalized shopping experiences, have enhanced the appeal of online shopping for activewear.The offline segment, while trailing, remains vital, especially in delivering personalized customer service and allowing consumers to try before they buy. Brick-and-mortar stores, including specialty sports stores and department stores, provide an experiential shopping environment that many customers value. These stores also offer immediate product availability and in-store promotions, which are significant advantages over online shopping.
The synergy between online and offline channels is becoming increasingly important, with omnichannel strategies emerging as a key trend. Retailers are integrating their online and offline presence to provide a seamless shopping experience. Click-and-collect services, where customers order online and pick up in-store, and augmented reality features in physical stores are examples of this integration. This approach not only maximizes customer convenience but also leverages the strengths of both distribution channels to capture a broader market share.
Key Market Segments
By Product Type
- Activewear Tops
- Activewear Bottoms
- Activewear Outerwear
- Sports Bras
- Athleisure Wear
- Yoga Wear
- Running Apparel
- Fitness Accessories
By Fabric Type
- Polyester
- Nylon
- Cotton
- Spandex
- Polypropylene
- Rayon
- Others
By Distribution Channel
- offline
- online
Growth Opportunity
Rising Youth Fitness Enthusiasm
The global Women’s Activewear Market in 2024 is poised for significant growth, driven in part by increasing fitness enthusiasm among youth. Younger demographics are more engaged in fitness activities, influenced by social media trends and a growing emphasis on health and wellness. This demographic shift is generating substantial demand for activewear that is not only functional but also stylish and versatile, aligning with the athleisure trend. Brands that can effectively cater to the preferences of younger consumers by offering trendy, high-performance apparel stand to gain a considerable market share.
Expanding Women's Sports Interest
The heightened interest in women’s sports also presents a lucrative opportunity for the market. There is a notable increase in female participation in sports and fitness activities globally, supported by various initiatives aimed at promoting women in sports. This surge in participation is driving the demand for specialized activewear designed for specific sports, such as running, yoga, and team sports.
The growing popularity of women’s football, basketball, and other competitive sports is creating a need for performance-driven apparel, which is a significant growth avenue for activewear brands.
Technological Innovations in Fabric and Design
Technological advancements in fabric technology and design continue to offer substantial growth opportunities. Innovations such as moisture-wicking materials, compression fabrics, and sustainable textiles are enhancing the appeal of activewear. The integration of these advanced materials not only improves performance and comfort but also caters to the growing consumer preference for eco-friendly products. Brands investing in R&D to develop innovative, high-quality activewear that meets these evolving consumer demands are likely to achieve significant market success.
Latest Trends
Smart Activewear
The advent of smart activewear is poised to revolutionize the Women’s Activewear Market in 2024. These technologically enhanced garments, embedded with sensors and connectivity features, offer real-time data on various fitness metrics such as heart rate, calories burned, and muscle engagement. Smart activewear caters to the tech-savvy consumer base seeking innovative ways to optimize their workouts and track their fitness progress.
This trend is driven by the increasing convergence of fitness and technology, with consumers desiring more personalized and efficient fitness solutions. Brands investing in the development of smart activewear, leveraging advancements in wearable technology, are likely to lead the market, providing unique value propositions that differentiate them from traditional activewear offerings.
Influencer Collaborations
Influencer collaborations continue to shape the market dynamics significantly. Collaborations with fitness influencers and celebrities amplify brand visibility and foster a strong connection with target audiences. Influencers bring authenticity and relatability, which resonate well with consumers, especially younger demographics. These collaborations often result in limited-edition collections that create buzz and drive sales.
A well-known influencer partnering with a brand to launch a signature line of activewear can generate substantial consumer interest and engagement, translating into higher sales and brand loyalty. As social media remains a powerful marketing tool, leveraging influencer collaborations effectively can provide brands with a competitive edge in the crowded market.
Regional Analysis
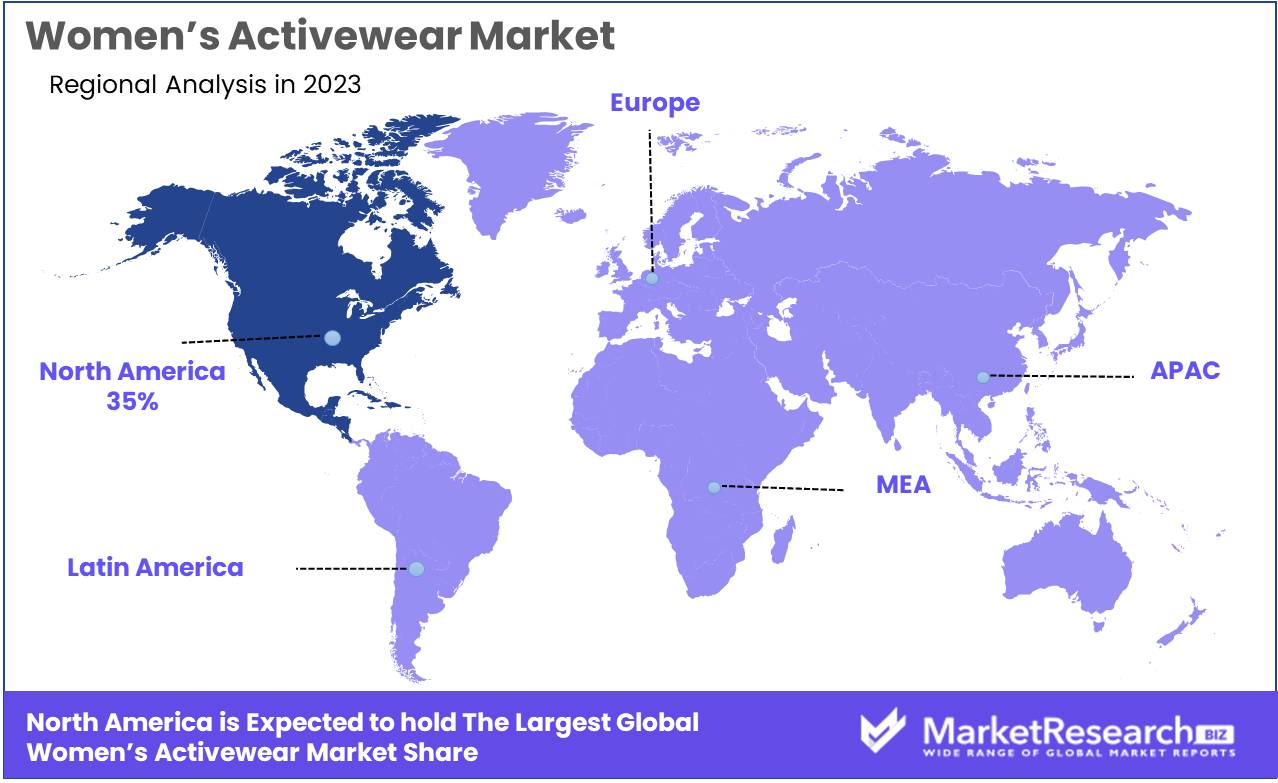
North America remains the dominant region with a 35% market share
The women's activewear market is witnessing robust growth across various regions, driven by increasing health consciousness, the rise of athleisure trends, and the growing participation of women in fitness activities. North America leads the market, accounting for 35% of the global share. This dominance is attributed to the high disposable incomes, a strong culture of fitness and sports, and the presence of key market players such as Nike and Under Armour. The region's focus on innovative product offerings and extensive marketing campaigns further fuels market expansion.
In Europe, the market is propelled by the rising awareness of a healthy lifestyle and the growing popularity of outdoor sports. The market in Europe is characterized by a strong preference for premium brands and an increasing trend towards eco-friendly materials.
Asia Pacific is experiencing the fastest growth, driven by increasing urbanization, a burgeoning middle class, and heightened health awareness. The rise of e-commerce and the penetration of international brands are also notable factors contributing to market growth in Asia Pacific. The region is witnessing a significant shift towards fashionable activewear, appealing to both fitness enthusiasts and casual wearers.
The Middle East & Africa region shows promising potential, driven by the rising adoption of western fitness trends and increasing investments in sports infrastructure. The UAE and South Africa are key markets, with a growing inclination towards premium and luxury activewear.
Latin America is gradually emerging as a lucrative market for women's activewear, supported by a rising focus on fitness and wellness. Brazil and Mexico are the major markets, with increasing participation in sports and fitness activities.
Key Regions and Countries
North America
- US
- Canada
- Mexico
Western Europe
- Germany
- France
- The UK
- Spain
- Italy
- Portugal
- Ireland
- Austria
- Switzerland
- Benelux
- Nordic
- Rest of Western Europe
Eastern Europe
- Russia
- Poland
- The Czech Republic
- Greece
- Rest of Eastern Europe
APAC
- China
- Japan
- South Korea
- India
- Australia & New Zealand
- Indonesia
- Malaysia
- Philippines
- Singapore
- Thailand
- Vietnam
- Rest of APAC
Latin America
- Brazil
- Colombia
- Chile
- Argentina
- Costa Rica
- Rest of Latin America
Middle East & Africa
- Algeria
- Egypt
- Israel
- Kuwait
- Nigeria
- Saudi Arabia
- South Africa
- Turkey
- United Arab Emirates
- Rest of MEA
Key Players Analysis
The global women's activewear market in 2024 is poised for substantial growth, with key players driving innovation and expanding their market presence. Companies such as Nike, Inc. and Adidas AG continue to dominate due to their extensive product lines, strong brand recognition, and strategic marketing initiatives. Nike’s focus on technological advancements in fabric and design, combined with its influential marketing campaigns, positions it as a market leader. Adidas, with its emphasis on sustainability and performance, appeals to a broad consumer base seeking both functionality and eco-conscious choices.
Under Armour, Inc. and PUMA SE are also significant contributors, leveraging their strong athletic endorsements and innovative product offerings. Under Armour’s commitment to performance gear and PUMA’s stylish yet functional activewear cater to a diverse demographic, enhancing their market footprint.
Decathlon and Gap Inc. have carved out substantial niches through their value-driven propositions. Decathlon’s extensive range of affordable, high-quality activewear attracts budget-conscious consumers, while Gap Inc.’s focus on trendy, accessible activewear aligns with the athleisure trend.
Columbia Sportswear Company, Patagonia, Inc., and Marmot Mountain, LLC, known for their outdoor and adventure-focused gear, are expanding their appeal by incorporating fashionable elements into their activewear lines. These brands benefit from a reputation for durability and quality, attracting consumers who prioritize long-lasting performance.
Emerging brands like VIE ACTIVE and 2XU are gaining traction by targeting niche markets with specialized offerings, such as high-performance compression wear and stylish activewear designed for specific activities. Their focus on innovation and targeted marketing strategies allows them to compete effectively against more established brands.
Hanesbrands Inc. and Jockey, traditionally known for their innerwear, are leveraging their expertise to expand into the activewear segment, offering comfortable and functional products that appeal to a broad consumer base.
Market Key Players
- Columbia Sportswear Company
- VIE ACTIVE
- Gramicci
- PUMA SE
- Decathlon
- Gap Inc
- Under Armour, Inc
- Jockey
- Mizuno Corporation
- NIKE, Inc.
- Marmot Mountain, LLC
- Patagonia, Inc.
- HANESBRANDS INC
- Adidas AG
- Amante
- 2XU
Recent Development
- In May 2024, Rhone launched a women's activewear line, leveraging expertise from new hires and board members from brands like Athleta and CorePower Yoga, addressing strong demand among their female customer base.
- In December 2023, BlissClub, a direct-to-consumer women's activewear brand, reported a four-fold revenue increase to Rs 68 crore in FY23, despite losses widening to Rs 36 crore, focusing on long-lasting women's apparel.
Report Scope
Report Features Description Market Value (2023) USD 24.7 Bn Forecast Revenue (2033) USD 159.7 Bn CAGR (2024-2033) 21.1% Base Year for Estimation 2023 Historic Period 2018-2023 Forecast Period 2024-2033 Report Coverage Revenue Forecast, Market Dynamics, Competitive Landscape, Recent Developments Segments Covered By Product Type (Activewear Tops, Activewear Bottoms, Activewear Outerwear, Sports Bras, Athleisure Wear, Yoga Wear, Running Apparel, Fitness Accessories), By Fabric Type (Polyester, Nylon, Cotton, Spandex, Polypropylene, Rayon, Others), By Distribution Channel (offline, online) Regional Analysis North America - The US, Canada, & Mexico; Western Europe - Germany, France, The UK, Spain, Italy, Portugal, Ireland, Austria, Switzerland, Benelux, Nordic, & Rest of Western Europe; Eastern Europe - Russia, Poland, The Czech Republic, Greece, & Rest of Eastern Europe; APAC - China, Japan, South Korea, India, Australia & New Zealand, Indonesia, Malaysia, Philippines, Singapore, Thailand, Vietnam, & Rest of APAC; Latin America - Brazil, Colombia, Chile, Argentina, Costa Rica, & Rest of Latin America; Middle East & Africa - Algeria, Egypt, Israel, Kuwait, Nigeria, Saudi Arabia, South Africa, Turkey, United Arab Emirates, & Rest of MEA Competitive Landscape Columbia Sportswear Company, VIE ACTIVE, Gramicci, PUMA SE, Decathlon, Gap Inc, Under Armour, Inc, Jockey, Mizuno Corporation, NIKE, Inc., Marmot Mountain, LLC, Patagonia, Inc., HANESBRANDS INC, Adidas AG, Amante, 2XU Customization Scope Customization for segments, region/country-level will be provided. Moreover, additional customization can be done based on the requirements. Purchase Options We have three licenses to opt for: Single User License, Multi-User License (Up to 5 Users), Corporate Use License (Unlimited User and Printable PDF) -
-
Our Clients


View Our Licence Options
