Ready To Assemble Furniture Market Report By Product Type (Desks, Chairs, Tables, Cabinets, Sofas, Beds, Others), By Material Type (Wood, Metal, Plastic, Glass, Others), By Distribution Channel, By End-User, By Region and Companies - Industry Segment Outlook, Market Assessment, Competition Scenario, Trends and Forecast 2024-2033
-
9623
-
May 2023
-
162
-


-
This report was compiled by Kalyani Khudsange Kalyani Khudsange is a Research Analyst at Prudour Pvt. Ltd. with 2.5 years of experience in market research and a strong technical background in Chemical Engineering and manufacturing. Correspondence Sr. Research Analyst Linkedin | Detailed Market research Methodology Our methodology involves a mix of primary research, including interviews with leading mental health experts, and secondary research from reputable medical journals and databases. View Detailed Methodology Page
-
Quick Navigation
Report Overview
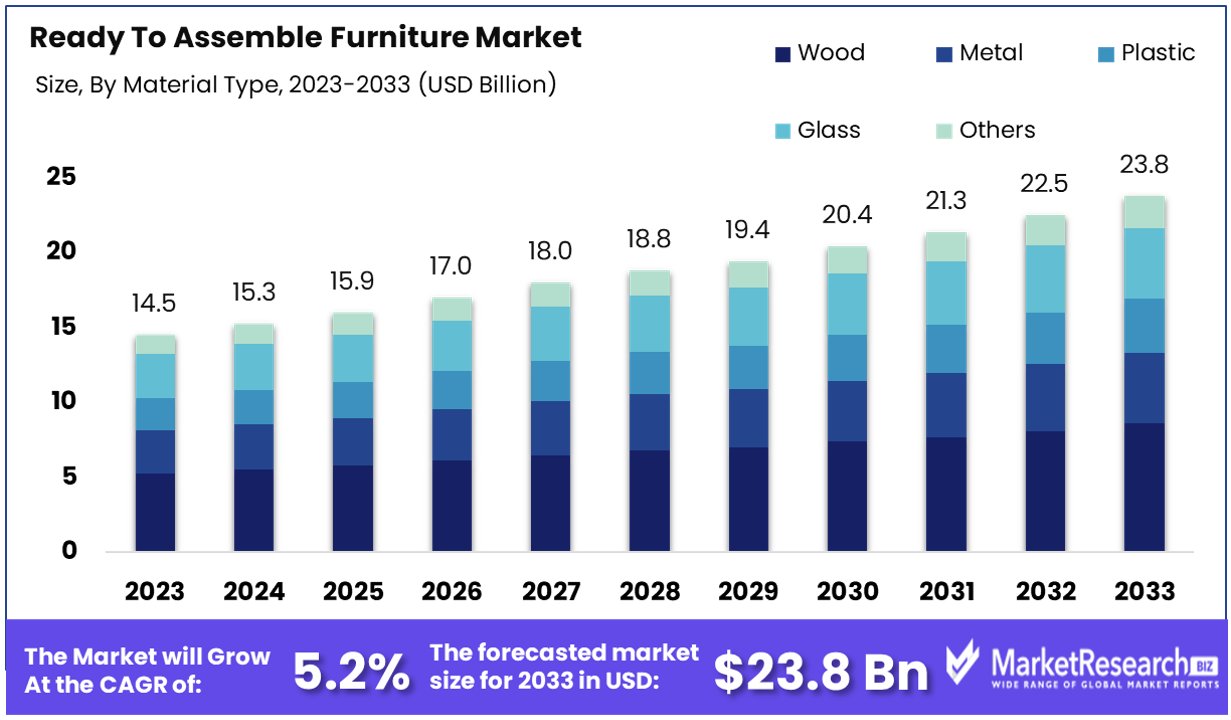
The Global Ready To Assemble Furniture Market size is expected to be worth around USD 23.8 Billion by 2033, from USD 14.5 Billion in 2023, growing at a CAGR of 5.20% during the forecast period from 2024 to 2033.
The Ready to Assemble (RTA) Furniture Market refers to a segment of the furniture industry focusing on furniture that is sold in parts and requires assembly by the customer. This market appeals to consumers seeking affordability, convenience, and style.
RTA furniture caters to a diverse range of settings, including homes, offices, and commercial spaces. The key attraction is the ease of shipping and handling, which reduces costs and appeals to a cost-conscious audience.
The Ready to Assemble (RTA) Furniture Market is positioned for substantial growth, driven by evolving consumer spending habits and preferences. A 2022 study by the National Association of Home Builders highlights a pivotal trend: new homeowners are investing significantly in their living spaces, with expenditures averaging about $12,000 on renovations, $5,000 on furnishings, and $4,000 on appliances within the first year of ownership.
This data underscores the burgeoning opportunity for the RTA furniture segment, especially as it aligns with the increasing demand for cost-effective, stylish, and easy-to-assemble options.
The market is further buoyed by the small space living trend, which necessitates sleek, minimalist bedroom furniture that is multipurpose in design. The growing consumer preference for sustainability is driving interest in bedroom sets made from recycled/upcycled materials and renewable resources like bamboo furniture. This shift not only reflects a change in consumer values but also opens new avenues for product innovation within the RTA furniture market.
Moreover, there is a notable rise in demand for customized furniture solutions. Approximately 30% of furniture buyers express interest in custom-made options, indicating a significant market segment that values personalization and uniqueness. This trend presents an opportunity for RTA furniture manufacturers to diversify their offerings and cater to this desire for customization, thereby enhancing consumer engagement and loyalty.
Key Takeaways
- Market Growth Projection: The Global Ready To Assemble (RTA) Furniture Market is poised for substantial growth, with an expected value of approximately USD 23.8 Billion by 2033, compared to USD 14.5 Billion in 2023, reflecting a steady Compound Annual Growth Rate (CAGR) of 5.20% from 2024 to 2033.
- Product Types: RTA furniture encompasses a diverse range of products, including desks, chairs, tables, cabinets, sofas, beds, and others, catering to various consumer needs and preferences.
- Material Diversity: Wood remains the dominant material choice in RTA furniture, followed by metal, plastic, glass, and other materials, reflecting a blend of traditional and contemporary design elements.
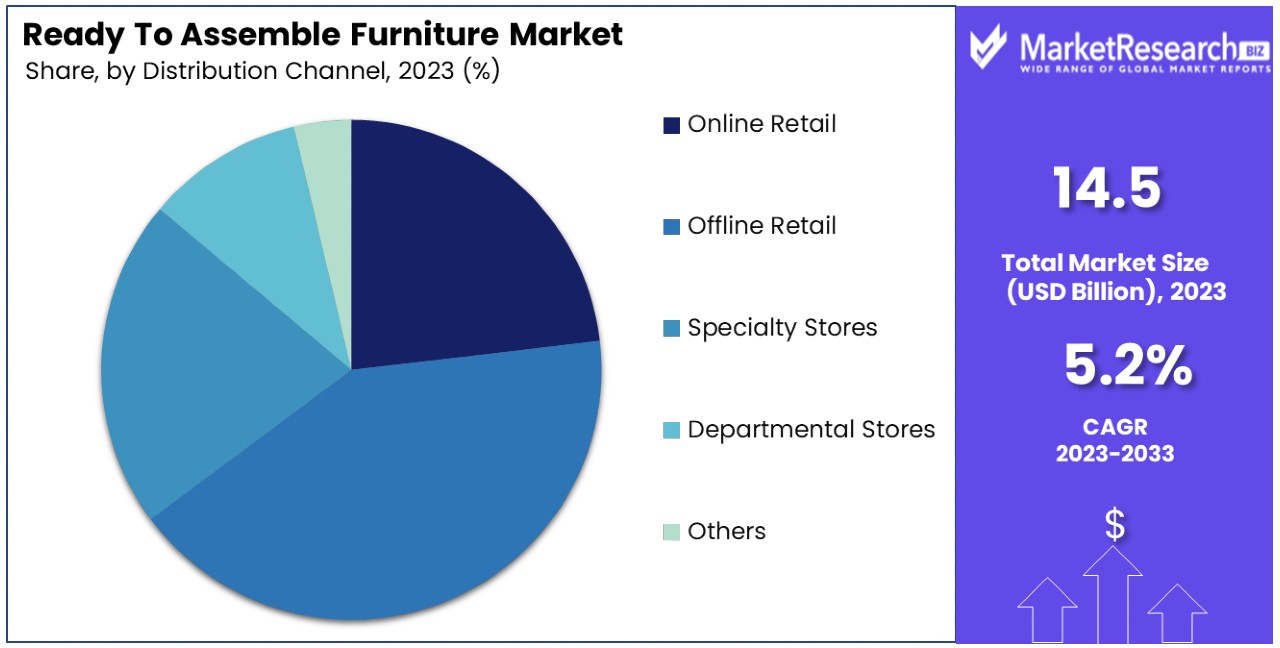
- Distribution Channels: While offline retail, particularly brick-and-mortar stores, currently dominates distribution, online retail is experiencing significant growth. Specialty stores, departmental stores, and other channels also contribute to market accessibility.
- End-User Segmentation: Residential consumers constitute the dominant end-user segment, reflecting the widespread adoption of RTA furniture in homes. However, commercial and institutional sectors also contribute to market demand.
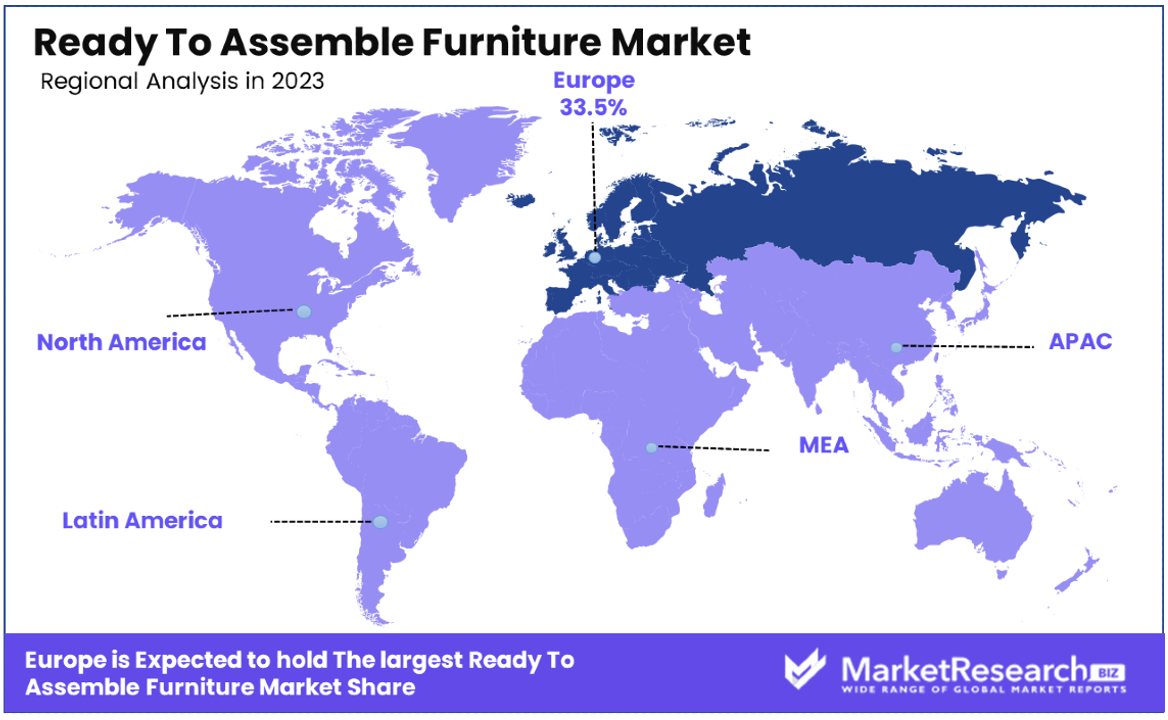
- Regional Analysis: Europe holds a significant market share of 33.5%, driven by consumer preferences for sustainable, affordable furniture solutions. Strong design heritage and a focus on eco-friendly materials contribute to Europe's leadership in the RTA furniture market.
Driving Factors
Increased Urbanization and Smaller Living Spaces Drive Market Growth
With the United Nations projecting that 60% of India's population will live in urban areas by 2050, the shift towards city living and consequently, smaller living spaces, is unmistakable. This trend significantly influences the Ready To Assemble (RTA) Furniture Market, as compact and flexible furniture solutions become essential for apartment and condo residents. RTA furniture, with its ease of customization, reconfiguration, and transportation, is perfectly aligned with the needs of urban dwellers, thereby driving market growth.
Cost Savings Fuel Market Expansion
RTA furniture, being 20-50% cheaper than fully assembled options, taps into the budget-conscious segment of the market, including first-time homeowners. The reduced costs, attributed to lower manufacturing and transportation expenses, not only make RTA furniture an attractive choice for consumers but also serve as a key growth driver in the market. This affordability, coupled with the rising cost of living, ensures that RTA furniture remains a preferred option among a broad base of customers, further fueling market expansion.
Growth of Online Furniture Shopping Enhances Accessibility
The surge in e-commerce has revolutionized the furniture buying experience, making RTA furniture more accessible to a wider audience. Major online retailers like IKEA, Amazon, and Wayfair have played pivotal roles in mainstreaming RTA furniture, thereby significantly contributing to market growth. This ease of access, combined with the convenience of home delivery and a wide range of options available online, has attracted a larger customer base, driving sales and market expansion.
Demand for Customization Attracts Millennials and Gen Z
The increasing demand for customization in RTA furniture, allowing customers to select configurations, finishes, and add-ons, resonates strongly with millennials and Gen Z consumers. This desire for smart furniture has not only expanded the market demographic but also encouraged innovation and product diversification within the industry. The flexibility offered by RTA furniture to meet individual tastes and preferences is a critical factor in its growing popularity and market growth.
Restraining Factors
Perception of Lower Quality Restrains Market Growth
The belief that Ready To Assemble (RTA) furniture is of inferior quality significantly impacts its market growth. This perception, often associated with the furniture being cheaply made and disposable, poses a substantial challenge in attracting higher-income demographics.
Consumers in this segment typically seek durability and high-quality finishes in their furniture choices, areas where RTA products are often mistakenly thought to fall short. Overcoming this stereotype is crucial for the RTA furniture market to expand its appeal beyond budget-conscious consumers and tap into a broader customer base seeking both affordability and quality.
Assembly Challenges Deter Consumer Engagement
The complexity and time investment required to assemble RTA furniture can act as a significant barrier to market growth. For some customers, the prospect of putting together furniture pieces is daunting and viewed as an inconvenience, overshadowing the benefits of cost savings and customization.
This assembly challenge can lead to customer frustration, negatively impacting their purchase experience and deterring future purchases. Addressing these concerns by simplifying the assembly process and providing clearer instructions or more intuitive designs is essential for the RTA furniture market to minimize this restraint and enhance overall customer satisfaction.
Product Type Analysis
In the Ready To Assemble (RTA) Furniture Market, desks emerge as the dominant sub-segment. This prominence is largely due to the increasing trend of remote work and home offices, necessitating ergonomic and space-saving furniture solutions. Desks in the RTA category satisfy these requirements with their affordability and ease of assembly, appealing particularly to consumers setting up home offices on a budget. The versatility and design innovations within this sub-segment cater to a wide range of consumer preferences, further fueling its growth.
Other significant segments include chairs, tables, cabinets, sofas, beds, and others, each contributing to the market's diversity. Chairs, particularly office and gaming chairs, have seen increased demand parallel to the rise in home office setups. Tables, including dining and coffee tables, cater to the multifunctional furniture trend, offering versatility for small living spaces.
Cabinets play a crucial role in storage solutions, especially in urban homes where space is limited. Sofas and beds, designed for comfort and space efficiency, address the needs of modern, minimalist living spaces. The "others" category, encompassing various niche products, indicates the market's capacity to innovate and adapt to specific consumer needs.
Material Type Analysis
Wood stands as the dominant material in the RTA Furniture Market, prized for its durability, aesthetic appeal, and versatility. Wood-based RTA furniture caters to a wide array of interior designs, from traditional to contemporary, making it a popular choice among consumers. The material's perceived value and sustainability, especially when sourced from certified forests, add to its appeal.
Metal, plastic, glass, and other materials also play vital roles in diversifying the RTA furniture offering. Metal is valued for its strength and modern look, fitting well in contemporary and industrial-style interiors. Plastic offers affordability and versatility in colors and designs, appealing to a cost-sensitive market segment.
Glass is used in combination with other materials to add elegance and lightness to furniture designs. The "others" category, which may include composite materials and textiles, reflects the industry's innovation in using various materials to enhance functionality, sustainability, and aesthetic appeal.
Distribution Channel Analysis
The Ready To Assemble (RTA) Furniture Market is significantly influenced by its distribution channels, with offline retail, comprising brick-and-mortar stores, standing as the dominant sub-segment. This dominance is attributed to consumer preference for physically examining furniture before purchase, seeking firsthand assurance of quality, comfort, and design suitability. Brick-and-mortar stores offer the tactile experience that many consumers value, especially when making decisions on substantial household items.
However, the market also sees substantial contributions from other distribution channels such as online retail, specialty stores, departmental stores, and others. Online retail has been growing rapidly, fueled by the convenience of shopping from home, a wider selection of products, and often, competitive pricing.
Specialty stores offer focused collections for specific needs, such as office furniture or outdoor setups, providing customers with expert advice and personalized service. Departmental stores, while not as specialized, offer the advantage of one-stop shopping for various household items, including RTA furniture. The "others" category includes various emerging retail formats that cater to niche markets or offer innovative shopping experiences.
End-User Analysis
In the Ready To Assemble (RTA) Furniture Market, the residential segment is the most significant end-user, driven by the continuous demand for home furnishings. This segment's growth is bolstered by factors such as the rising number of households, the trend towards home renovation and decoration, and the need for cost-effective furniture solutions that can be easily replaced or upgraded. RTA furniture meets these needs by offering a wide range of styles, functionality, and price points, making it an attractive option for residential consumers.
The commercial, institutional, and other segments also contribute to the market's diversity and growth. Commercial end-users, including offices, retail spaces, and hospitality industries, seek practical, stylish, and budget-friendly furniture solutions that RTA furniture can provide.
Institutional end-users, such as schools and hospitals, require durable and functional furniture that can withstand heavy use, a need that RTA furniture manufacturers are increasingly addressing with specialized product lines. The "others" category might include temporary setups, event management companies, and rental markets, each finding value in the flexibility and cost-effectiveness of RTA furniture.
Key Market Segments
By Product Type
- Desks
- Chairs
- Tables
- Cabinets
- Sofas
- Beds
- Others
By Material Type
- Wood
- Metal
- Plastic
- Glass
- Others
By Distribution Channel
- Online Retail
- Offline Retail
- Specialty Stores
- Departmental Stores
- Others
By End-User
- Residential
- Commercial
- Institutional
- Others
Growth Opportunities
Small Space/Multifunctional Furniture Offers Growth Opportunity
The trend towards rising urbanization has led to an increased demand for furniture that is adaptable to small living spaces. RTA brands are uniquely positioned to capitalize on this demand by creating innovative, multifunctional furniture pieces such as murphy beds, storage ottomans, and convertible coffee tables.
These products not only address the need for space-saving solutions in compact apartments and tiny homes but also cater to the modern consumer's desire for efficiency and functionality. By focusing on multifunctional furniture, RTA brands can tap into a growing segment of the market looking for smart, space-efficient living solutions, thereby driving market expansion.
Technology-Enabled Customization Offers Growth Opportunity
Advancements in technology, including digital printing, CNC machining, and 3D printing, have opened up new avenues for the mass customization of RTA furniture. This technological evolution allows consumers to personalize their furniture in ways previously not possible, adjusting everything from finishes to dimensions.
Such customization capabilities provide an engaging purchase experience and meet the growing consumer expectation for personalized products. The opportunity for RTA brands lies in leveraging these technologies to offer unique, customizable options, appealing to a broader demographic seeking individuality in their furniture choices.
Trending Factors
Direct-to-Consumer (DTC) Models Are Trending Factors
Direct-to-consumer (DTC) sales models are revolutionizing the Ready To Assemble (RTA) Furniture Market by enabling brands to directly control design, pricing, and the customer experience. This model eliminates retailer markup and bypasses traditional retail space constraints, allowing for more competitive pricing and innovative marketing strategies.
Brands like Burrow and Floyd leverage social media marketing to directly engage with consumers, enhancing brand visibility and customer loyalty. The DTC approach also opens avenues for subscription-based furniture models, catering to a growing consumer interest in flexibility and sustainability.
Green/Lean Supply Chains Are Trending Factors
The shift towards green and lean supply chains is a significant trending factor in the RTA Furniture Market. By optimizing packaging, simplifying SKUs, and digitally managing inventory, RTA brands can significantly reduce waste in production and delivery processes.
This efficiency is crucial for maintaining profit margins and meeting consumer demand for sustainable practices. Brands that prioritize environmentally friendly materials and efficient logistics, such as IKEA with its focus on sustainable sourcing and modular design, are setting industry standards. This trend not only appeals to environmentally conscious consumers but also aligns with global efforts to reduce carbon footprints and waste, making it a key factor in the market's ongoing evolution.
Regional Analysis
Europe Dominates with 33.5% Market Share
Europe's leading position in the Ready To Assemble (RTA) Furniture Market can be attributed to high consumer preference for sustainable and affordable furniture solutions, coupled with strong design heritage. European consumers value quality and sustainability, driving demand for RTA furniture made from eco-friendly materials. Major companies like IKEA, headquartered in Sweden, have significantly contributed to the market's growth through innovation and extensive distribution networks across the region.
The region benefits from advanced logistics, sophisticated e-commerce platforms, and high consumer spending power. The presence of numerous design schools and a rich history in furniture design also contribute to Europe's dominance, fostering innovation and setting trends in the RTA furniture industry.
Europe is expected to maintain its leadership position due to ongoing commitments to sustainability, design innovation, and the integration of digital technologies in retail. The market is likely to see increased competition and growth in eco-friendly product offerings.
North America
North America is a significant player in the RTA furniture market, driven by consumer preference for cost-effective and customizable furniture solutions. The U.S. sees major contributions from companies like Wayfair and Walmart, capitalizing on the e-commerce boom and DIY culture. The region's market is bolstered by technological advancements in manufacturing and a strong distribution network.
Asia Pacific
The Asia Pacific region is rapidly growing in the RTA furniture market, thanks to increasing urbanization and rising middle-class populations in countries like China and India. Local brands, alongside international ones, are expanding their footprint to meet the growing demand for affordable and space-saving furniture solutions.
Middle East & Africa
The Middle East & Africa region shows promising growth in the RTA furniture market, driven by urban development and an increasing number of expatriates. The demand for modern, stylish, and affordable furniture is rising, with Dubai and Saudi Arabia being notable markets for expansion.
Latin America
Latin America's RTA furniture market is expanding, with Brazil and Mexico leading the way. The growth is supported by increasing urbanization, a young population, and an interest in modern, sustainable living solutions. Local manufacturers and retailers are tapping into this trend, offering competitive and diverse RTA furniture options.
Key Regions and Countries
- North America
- The US
- Canada
- Mexico
- Western Europe
- Germany
- France
- The UK
- Spain
- Italy
- Portugal
- Ireland
- Austria
- Switzerland
- Benelux
- Nordic
- Rest of Western Europe
- Eastern Europe
- Russia
- Poland
- The Czech Republic
- Greece
- Rest of Eastern Europe
- APAC
- China
- Japan
- South Korea
- India
- Australia & New Zealand
- Indonesia
- Malaysia
- Philippines
- Singapore
- Thailand
- Vietnam
- Rest of APAC
- Latin America
- Brazil
- Colombia
- Chile
- Argentina
- Costa Rica
- Rest of Latin America
- Middle East & Africa
- Algeria
- Egypt
- Israel
- Kuwait
- Nigeria
- Saudi Arabia
- South Africa
- Turkey
- United Arab Emirates
- Rest of MEA
Key Players Analysis
In the Ready To Assemble (RTA) Furniture Market, key players such as Inter IKEA Systems B.V., Dorel Industries Inc, Steinhoff International, and Tvilum A/S, among others, play pivotal roles in shaping industry dynamics. Inter IKEA Systems B.V. stands out for its global reach and innovative approach to furniture design and sustainability, setting industry trends. Dorel Industries Inc and Sauder Woodworking Company are recognized for their extensive product lines that cater to a wide range of consumer preferences, from traditional to contemporary styles.
Steinhoff International and its subsidiary, Steinhoff Holding, leverage their global presence to offer a diverse portfolio of products, enhancing their market influence. Companies like Simplicity Sofas and Bush Industries, Inc. focus on niche markets, offering specialized products that emphasize customization and space efficiency. Whalen Furniture Manufacturing and Leicht Kuchen AG are noted for their quality craftsmanship and design excellence, appealing to higher-end markets.
South Shore Furniture and Flexsteel (Home Styles) contribute to the market with their focus on affordability and durability, targeting the budget-conscious segment. These companies' strategic positioning, from offering eco-friendly products to leveraging e-commerce for direct-to-consumer sales, significantly impacts the RTA furniture market. Their collective efforts in innovation, sustainability, and customer engagement drive the industry forward, meeting the evolving needs of consumers worldwide.
Market Key Players
- Inter IKEA Systems B.V.
- Dorel Industries Inc
- Steinhoff International
- Tvilum A/S
- Simplicity Sofas
- Sauder Woodworking Company
- Bush Industries, Inc.
- Whalen Furniture Manufacturing
- Steinhoff Holding
- Leicht Kuchen AG
- South Shore Furniture
- Flexsteel (Home Styles)
Recent Developments
- On November 2023, Kilim Mobilya, a well-established furniture company in Turkey, has recently introduced a new collection of smart and easy-to-assemble furniture featuring Välinge's innovative Threespine® technology. This collection, named "Kilim Klik," is the first to utilize the Threespine technology in Turkey.
- On June 2023, The Pioneer Woman, Ree Drummond, has recently launched a new line of ready-to-assemble furniture at Walmart. This collection includes items for various spaces in the home such as the kitchen, dining room, living room, office, and bedroom.
- On April 2023, Amazon is planning to introduce a furniture assembly service that allows customers to opt for assembling furniture or appliances as soon as they arrive at their homes. This premium service aims to enhance customer convenience and compete more effectively with other retailers like Wayfair, Best Buy, Home Depot, and Lowe's, which offer similar options.
Report Scope
Report Features Description Market Value (2023) USD 14.5 Billion Forecast Revenue (2033) USD 23.8 Billion CAGR (2024-2033) 5.20% Base Year for Estimation 2023 Historic Period 2018-2023 Forecast Period 2024-2033 Report Coverage Revenue Forecast, Market Dynamics, Competitive Landscape, Recent Developments Segments Covered By Product Type (Desks, Chairs, Tables, Cabinets, Sofas, Beds, Others), By Material Type (Wood, Metal, Plastic, Glass, Others), By Distribution Channel (Online Retail, Offline Retail, Specialty Stores, Departmental Stores, Others), By End-User (Residential, Commercial, Institutional, Others) Regional Analysis North America - The US, Canada, & Mexico; Western Europe - Germany, France, The UK, Spain, Italy, Portugal, Ireland, Austria, Switzerland, Benelux, Nordic, & Rest of Western Europe; Eastern Europe - Russia, Poland, The Czech Republic, Greece, & Rest of Eastern Europe; APAC - China, Japan, South Korea, India, Australia & New Zealand, Indonesia, Malaysia, Philippines, Singapore, Thailand, Vietnam, & Rest of APAC; Latin America - Brazil, Colombia, Chile, Argentina, Costa Rica, & Rest of Latin America; Middle East & Africa - Algeria, Egypt, Israel, Kuwait, Nigeria, Saudi Arabia, South Africa, Turkey, United Arab Emirates, & Rest of MEA Competitive Landscape Inter IKEA Systems B.V., Dorel Industries Inc, Steinhoff International, Tvilum A/S, Simplicity Sofas, Sauder Woodworking Company, Bush Industries, Inc., Whalen Furniture Manufacturing, Steinhoff Holding, Leicht Kuchen AG, South Shore Furniture, Flexsteel (Home Styles) Customization Scope Customization for segments, region/country-level will be provided. Moreover, additional customization can be done based on the requirements. Purchase Options We have three licenses to opt for: Single User License, Multi-User License (Up to 5 Users), Corporate Use License (Unlimited User and Printable PDF) -
- 1. Executive Summary
- 1.1. Definition
- 1.2. Taxonomy
- 1.3. Research Scope
- 1.4. Key Analysis
- 1.5. Key Findings by Major Segments
- 1.6. Top strategies by Major Players
- 2. Global Ready To Assemble Furniture Market Overview
- 2.1. Ready To Assemble Furniture Market Dynamics
- 2.1.1. Drivers
- 2.1.2. Opportunities
- 2.1.3. Restraints
- 2.1.4. Challenges
- 2.2. Macro-economic Factors
- 2.3. Regulatory Framework
- 2.4. Market Investment Feasibility Index
- 2.5. PEST Analysis
- 2.6. PORTER’S Five Force Analysis
- 2.7. Drivers & Restraints Impact Analysis
- 2.8. Industry Chain Analysis
- 2.9. Cost Structure Analysis
- 2.10. Marketing Strategy
- 2.11. Russia-Ukraine War Impact Analysis
- 2.12. Opportunity Map Analysis
- 2.13. Market Competition Scenario Analysis
- 2.14. Product Life Cycle Analysis
- 2.15. Opportunity Orbits
- 2.16. Manufacturer Intensity Map
- 2.17. Major Companies sales by Value & Volume
- 2.1. Ready To Assemble Furniture Market Dynamics
- 3. Global Ready To Assemble Furniture Market Analysis, Opportunity and Forecast, 2016-2032
- 3.1. Global Ready To Assemble Furniture Market Analysis, 2016-2021
- 3.2. Global Ready To Assemble Furniture Market Opportunity and Forecast, 2023-2032
- 3.3. Global Ready To Assemble Furniture Market Analysis, Opportunity and Forecast, By Product Type, 2016-2032
- 3.3.1. Global Ready To Assemble Furniture Market Analysis by Product Type: Introduction
- 3.3.2. Market Size Absolute $ Opportunity Analysis and Forecast, By Product Type, 2016-2032
- 3.3.3. Desks
- 3.3.4. Chairs
- 3.3.5. Tables
- 3.3.6. Cabinets
- 3.3.7. Sofas
- 3.3.8. Beds
- 3.3.9. Others
- 3.4. Global Ready To Assemble Furniture Market Analysis, Opportunity and Forecast, By Material Type, 2016-2032
- 3.4.1. Global Ready To Assemble Furniture Market Analysis by Material Type: Introduction
- 3.4.2. Market Size Absolute $ Opportunity Analysis and Forecast, By Material Type, 2016-2032
- 3.4.3. Wood
- 3.4.4. Metal
- 3.4.5. Plastic
- 3.4.6. Glass
- 3.4.7. Others
- 3.5. Global Ready To Assemble Furniture Market Analysis, Opportunity and Forecast, By Distribution Channel, 2016-2032
- 3.5.1. Global Ready To Assemble Furniture Market Analysis by Distribution Channel: Introduction
- 3.5.2. Market Size Absolute $ Opportunity Analysis and Forecast, By Distribution Channel, 2016-2032
- 3.5.3. Online Retail
- 3.5.4. Offline Retail
- 3.5.5. Specialty Stores
- 3.5.6. Departmental Stores
- 3.5.7. Others
- 3.6. Global Ready To Assemble Furniture Market Analysis, Opportunity and Forecast, By End-User, 2016-2032
- 3.6.1. Global Ready To Assemble Furniture Market Analysis by End-User: Introduction
- 3.6.2. Market Size Absolute $ Opportunity Analysis and Forecast, By End-User, 2016-2032
- 3.6.3. Residential
- 3.6.4. Commercial
- 3.6.5. Institutional
- 3.6.6. Others
- 4. North America Ready To Assemble Furniture Market Analysis, Opportunity and Forecast, 2016-2032
- 4.1. North America Ready To Assemble Furniture Market Analysis, 2016-2021
- 4.2. North America Ready To Assemble Furniture Market Opportunity and Forecast, 2023-2032
- 4.3. North America Ready To Assemble Furniture Market Analysis, Opportunity and Forecast, By Product Type, 2016-2032
- 4.3.1. North America Ready To Assemble Furniture Market Analysis by Product Type: Introduction
- 4.3.2. Market Size Absolute $ Opportunity Analysis and Forecast, By Product Type, 2016-2032
- 4.3.3. Desks
- 4.3.4. Chairs
- 4.3.5. Tables
- 4.3.6. Cabinets
- 4.3.7. Sofas
- 4.3.8. Beds
- 4.3.9. Others
- 4.4. North America Ready To Assemble Furniture Market Analysis, Opportunity and Forecast, By Material Type, 2016-2032
- 4.4.1. North America Ready To Assemble Furniture Market Analysis by Material Type: Introduction
- 4.4.2. Market Size Absolute $ Opportunity Analysis and Forecast, By Material Type, 2016-2032
- 4.4.3. Wood
- 4.4.4. Metal
- 4.4.5. Plastic
- 4.4.6. Glass
- 4.4.7. Others
- 4.5. North America Ready To Assemble Furniture Market Analysis, Opportunity and Forecast, By Distribution Channel, 2016-2032
- 4.5.1. North America Ready To Assemble Furniture Market Analysis by Distribution Channel: Introduction
- 4.5.2. Market Size Absolute $ Opportunity Analysis and Forecast, By Distribution Channel, 2016-2032
- 4.5.3. Online Retail
- 4.5.4. Offline Retail
- 4.5.5. Specialty Stores
- 4.5.6. Departmental Stores
- 4.5.7. Others
- 4.6. North America Ready To Assemble Furniture Market Analysis, Opportunity and Forecast, By End-User, 2016-2032
- 4.6.1. North America Ready To Assemble Furniture Market Analysis by End-User: Introduction
- 4.6.2. Market Size Absolute $ Opportunity Analysis and Forecast, By End-User, 2016-2032
- 4.6.3. Residential
- 4.6.4. Commercial
- 4.6.5. Institutional
- 4.6.6. Others
- 4.7. North America Ready To Assemble Furniture Market Analysis, Opportunity and Forecast, By Country , 2016-2032
- 4.7.1. North America Ready To Assemble Furniture Market Analysis by Country : Introduction
- 4.7.2. Market Size Absolute $ Opportunity Analysis and Forecast, Country , 2016-2032
- 4.7.2.1. The US
- 4.7.2.2. Canada
- 4.7.2.3. Mexico
- 5. Western Europe Ready To Assemble Furniture Market Analysis, Opportunity and Forecast, 2016-2032
- 5.1. Western Europe Ready To Assemble Furniture Market Analysis, 2016-2021
- 5.2. Western Europe Ready To Assemble Furniture Market Opportunity and Forecast, 2023-2032
- 5.3. Western Europe Ready To Assemble Furniture Market Analysis, Opportunity and Forecast, By Product Type, 2016-2032
- 5.3.1. Western Europe Ready To Assemble Furniture Market Analysis by Product Type: Introduction
- 5.3.2. Market Size Absolute $ Opportunity Analysis and Forecast, By Product Type, 2016-2032
- 5.3.3. Desks
- 5.3.4. Chairs
- 5.3.5. Tables
- 5.3.6. Cabinets
- 5.3.7. Sofas
- 5.3.8. Beds
- 5.3.9. Others
- 5.4. Western Europe Ready To Assemble Furniture Market Analysis, Opportunity and Forecast, By Material Type, 2016-2032
- 5.4.1. Western Europe Ready To Assemble Furniture Market Analysis by Material Type: Introduction
- 5.4.2. Market Size Absolute $ Opportunity Analysis and Forecast, By Material Type, 2016-2032
- 5.4.3. Wood
- 5.4.4. Metal
- 5.4.5. Plastic
- 5.4.6. Glass
- 5.4.7. Others
- 5.5. Western Europe Ready To Assemble Furniture Market Analysis, Opportunity and Forecast, By Distribution Channel, 2016-2032
- 5.5.1. Western Europe Ready To Assemble Furniture Market Analysis by Distribution Channel: Introduction
- 5.5.2. Market Size Absolute $ Opportunity Analysis and Forecast, By Distribution Channel, 2016-2032
- 5.5.3. Online Retail
- 5.5.4. Offline Retail
- 5.5.5. Specialty Stores
- 5.5.6. Departmental Stores
- 5.5.7. Others
- 5.6. Western Europe Ready To Assemble Furniture Market Analysis, Opportunity and Forecast, By End-User, 2016-2032
- 5.6.1. Western Europe Ready To Assemble Furniture Market Analysis by End-User: Introduction
- 5.6.2. Market Size Absolute $ Opportunity Analysis and Forecast, By End-User, 2016-2032
- 5.6.3. Residential
- 5.6.4. Commercial
- 5.6.5. Institutional
- 5.6.6. Others
- 5.7. Western Europe Ready To Assemble Furniture Market Analysis, Opportunity and Forecast, By Country , 2016-2032
- 5.7.1. Western Europe Ready To Assemble Furniture Market Analysis by Country : Introduction
- 5.7.2. Market Size Absolute $ Opportunity Analysis and Forecast, Country , 2016-2032
- 5.7.2.1. Germany
- 5.7.2.2. France
- 5.7.2.3. The UK
- 5.7.2.4. Spain
- 5.7.2.5. Italy
- 5.7.2.6. Portugal
- 5.7.2.7. Ireland
- 5.7.2.8. Austria
- 5.7.2.9. Switzerland
- 5.7.2.10. Benelux
- 5.7.2.11. Nordic
- 5.7.2.12. Rest of Western Europe
- 6. Eastern Europe Ready To Assemble Furniture Market Analysis, Opportunity and Forecast, 2016-2032
- 6.1. Eastern Europe Ready To Assemble Furniture Market Analysis, 2016-2021
- 6.2. Eastern Europe Ready To Assemble Furniture Market Opportunity and Forecast, 2023-2032
- 6.3. Eastern Europe Ready To Assemble Furniture Market Analysis, Opportunity and Forecast, By Product Type, 2016-2032
- 6.3.1. Eastern Europe Ready To Assemble Furniture Market Analysis by Product Type: Introduction
- 6.3.2. Market Size Absolute $ Opportunity Analysis and Forecast, By Product Type, 2016-2032
- 6.3.3. Desks
- 6.3.4. Chairs
- 6.3.5. Tables
- 6.3.6. Cabinets
- 6.3.7. Sofas
- 6.3.8. Beds
- 6.3.9. Others
- 6.4. Eastern Europe Ready To Assemble Furniture Market Analysis, Opportunity and Forecast, By Material Type, 2016-2032
- 6.4.1. Eastern Europe Ready To Assemble Furniture Market Analysis by Material Type: Introduction
- 6.4.2. Market Size Absolute $ Opportunity Analysis and Forecast, By Material Type, 2016-2032
- 6.4.3. Wood
- 6.4.4. Metal
- 6.4.5. Plastic
- 6.4.6. Glass
- 6.4.7. Others
- 6.5. Eastern Europe Ready To Assemble Furniture Market Analysis, Opportunity and Forecast, By Distribution Channel, 2016-2032
- 6.5.1. Eastern Europe Ready To Assemble Furniture Market Analysis by Distribution Channel: Introduction
- 6.5.2. Market Size Absolute $ Opportunity Analysis and Forecast, By Distribution Channel, 2016-2032
- 6.5.3. Online Retail
- 6.5.4. Offline Retail
- 6.5.5. Specialty Stores
- 6.5.6. Departmental Stores
- 6.5.7. Others
- 6.6. Eastern Europe Ready To Assemble Furniture Market Analysis, Opportunity and Forecast, By End-User, 2016-2032
- 6.6.1. Eastern Europe Ready To Assemble Furniture Market Analysis by End-User: Introduction
- 6.6.2. Market Size Absolute $ Opportunity Analysis and Forecast, By End-User, 2016-2032
- 6.6.3. Residential
- 6.6.4. Commercial
- 6.6.5. Institutional
- 6.6.6. Others
- 6.7. Eastern Europe Ready To Assemble Furniture Market Analysis, Opportunity and Forecast, By Country , 2016-2032
- 6.7.1. Eastern Europe Ready To Assemble Furniture Market Analysis by Country : Introduction
- 6.7.2. Market Size Absolute $ Opportunity Analysis and Forecast, Country , 2016-2032
- 6.7.2.1. Russia
- 6.7.2.2. Poland
- 6.7.2.3. The Czech Republic
- 6.7.2.4. Greece
- 6.7.2.5. Rest of Eastern Europe
- 7. APAC Ready To Assemble Furniture Market Analysis, Opportunity and Forecast, 2016-2032
- 7.1. APAC Ready To Assemble Furniture Market Analysis, 2016-2021
- 7.2. APAC Ready To Assemble Furniture Market Opportunity and Forecast, 2023-2032
- 7.3. APAC Ready To Assemble Furniture Market Analysis, Opportunity and Forecast, By Product Type, 2016-2032
- 7.3.1. APAC Ready To Assemble Furniture Market Analysis by Product Type: Introduction
- 7.3.2. Market Size Absolute $ Opportunity Analysis and Forecast, By Product Type, 2016-2032
- 7.3.3. Desks
- 7.3.4. Chairs
- 7.3.5. Tables
- 7.3.6. Cabinets
- 7.3.7. Sofas
- 7.3.8. Beds
- 7.3.9. Others
- 7.4. APAC Ready To Assemble Furniture Market Analysis, Opportunity and Forecast, By Material Type, 2016-2032
- 7.4.1. APAC Ready To Assemble Furniture Market Analysis by Material Type: Introduction
- 7.4.2. Market Size Absolute $ Opportunity Analysis and Forecast, By Material Type, 2016-2032
- 7.4.3. Wood
- 7.4.4. Metal
- 7.4.5. Plastic
- 7.4.6. Glass
- 7.4.7. Others
- 7.5. APAC Ready To Assemble Furniture Market Analysis, Opportunity and Forecast, By Distribution Channel, 2016-2032
- 7.5.1. APAC Ready To Assemble Furniture Market Analysis by Distribution Channel: Introduction
- 7.5.2. Market Size Absolute $ Opportunity Analysis and Forecast, By Distribution Channel, 2016-2032
- 7.5.3. Online Retail
- 7.5.4. Offline Retail
- 7.5.5. Specialty Stores
- 7.5.6. Departmental Stores
- 7.5.7. Others
- 7.6. APAC Ready To Assemble Furniture Market Analysis, Opportunity and Forecast, By End-User, 2016-2032
- 7.6.1. APAC Ready To Assemble Furniture Market Analysis by End-User: Introduction
- 7.6.2. Market Size Absolute $ Opportunity Analysis and Forecast, By End-User, 2016-2032
- 7.6.3. Residential
- 7.6.4. Commercial
- 7.6.5. Institutional
- 7.6.6. Others
- 7.7. APAC Ready To Assemble Furniture Market Analysis, Opportunity and Forecast, By Country , 2016-2032
- 7.7.1. APAC Ready To Assemble Furniture Market Analysis by Country : Introduction
- 7.7.2. Market Size Absolute $ Opportunity Analysis and Forecast, Country , 2016-2032
- 7.7.2.1. China
- 7.7.2.2. Japan
- 7.7.2.3. South Korea
- 7.7.2.4. India
- 7.7.2.5. Australia & New Zeland
- 7.7.2.6. Indonesia
- 7.7.2.7. Malaysia
- 7.7.2.8. Philippines
- 7.7.2.9. Singapore
- 7.7.2.10. Thailand
- 7.7.2.11. Vietnam
- 7.7.2.12. Rest of APAC
- 8. Latin America Ready To Assemble Furniture Market Analysis, Opportunity and Forecast, 2016-2032
- 8.1. Latin America Ready To Assemble Furniture Market Analysis, 2016-2021
- 8.2. Latin America Ready To Assemble Furniture Market Opportunity and Forecast, 2023-2032
- 8.3. Latin America Ready To Assemble Furniture Market Analysis, Opportunity and Forecast, By Product Type, 2016-2032
- 8.3.1. Latin America Ready To Assemble Furniture Market Analysis by Product Type: Introduction
- 8.3.2. Market Size Absolute $ Opportunity Analysis and Forecast, By Product Type, 2016-2032
- 8.3.3. Desks
- 8.3.4. Chairs
- 8.3.5. Tables
- 8.3.6. Cabinets
- 8.3.7. Sofas
- 8.3.8. Beds
- 8.3.9. Others
- 8.4. Latin America Ready To Assemble Furniture Market Analysis, Opportunity and Forecast, By Material Type, 2016-2032
- 8.4.1. Latin America Ready To Assemble Furniture Market Analysis by Material Type: Introduction
- 8.4.2. Market Size Absolute $ Opportunity Analysis and Forecast, By Material Type, 2016-2032
- 8.4.3. Wood
- 8.4.4. Metal
- 8.4.5. Plastic
- 8.4.6. Glass
- 8.4.7. Others
- 8.5. Latin America Ready To Assemble Furniture Market Analysis, Opportunity and Forecast, By Distribution Channel, 2016-2032
- 8.5.1. Latin America Ready To Assemble Furniture Market Analysis by Distribution Channel: Introduction
- 8.5.2. Market Size Absolute $ Opportunity Analysis and Forecast, By Distribution Channel, 2016-2032
- 8.5.3. Online Retail
- 8.5.4. Offline Retail
- 8.5.5. Specialty Stores
- 8.5.6. Departmental Stores
- 8.5.7. Others
- 8.6. Latin America Ready To Assemble Furniture Market Analysis, Opportunity and Forecast, By End-User, 2016-2032
- 8.6.1. Latin America Ready To Assemble Furniture Market Analysis by End-User: Introduction
- 8.6.2. Market Size Absolute $ Opportunity Analysis and Forecast, By End-User, 2016-2032
- 8.6.3. Residential
- 8.6.4. Commercial
- 8.6.5. Institutional
- 8.6.6. Others
- 8.7. Latin America Ready To Assemble Furniture Market Analysis, Opportunity and Forecast, By Country , 2016-2032
- 8.7.1. Latin America Ready To Assemble Furniture Market Analysis by Country : Introduction
- 8.7.2. Market Size Absolute $ Opportunity Analysis and Forecast, Country , 2016-2032
- 8.7.2.1. Brazil
- 8.7.2.2. Colombia
- 8.7.2.3. Chile
- 8.7.2.4. Argentina
- 8.7.2.5. Costa Rica
- 8.7.2.6. Rest of Latin America
- 9. Middle East & Africa Ready To Assemble Furniture Market Analysis, Opportunity and Forecast, 2016-2032
- 9.1. Middle East & Africa Ready To Assemble Furniture Market Analysis, 2016-2021
- 9.2. Middle East & Africa Ready To Assemble Furniture Market Opportunity and Forecast, 2023-2032
- 9.3. Middle East & Africa Ready To Assemble Furniture Market Analysis, Opportunity and Forecast, By Product Type, 2016-2032
- 9.3.1. Middle East & Africa Ready To Assemble Furniture Market Analysis by Product Type: Introduction
- 9.3.2. Market Size Absolute $ Opportunity Analysis and Forecast, By Product Type, 2016-2032
- 9.3.3. Desks
- 9.3.4. Chairs
- 9.3.5. Tables
- 9.3.6. Cabinets
- 9.3.7. Sofas
- 9.3.8. Beds
- 9.3.9. Others
- 9.4. Middle East & Africa Ready To Assemble Furniture Market Analysis, Opportunity and Forecast, By Material Type, 2016-2032
- 9.4.1. Middle East & Africa Ready To Assemble Furniture Market Analysis by Material Type: Introduction
- 9.4.2. Market Size Absolute $ Opportunity Analysis and Forecast, By Material Type, 2016-2032
- 9.4.3. Wood
- 9.4.4. Metal
- 9.4.5. Plastic
- 9.4.6. Glass
- 9.4.7. Others
- 9.5. Middle East & Africa Ready To Assemble Furniture Market Analysis, Opportunity and Forecast, By Distribution Channel, 2016-2032
- 9.5.1. Middle East & Africa Ready To Assemble Furniture Market Analysis by Distribution Channel: Introduction
- 9.5.2. Market Size Absolute $ Opportunity Analysis and Forecast, By Distribution Channel, 2016-2032
- 9.5.3. Online Retail
- 9.5.4. Offline Retail
- 9.5.5. Specialty Stores
- 9.5.6. Departmental Stores
- 9.5.7. Others
- 9.6. Middle East & Africa Ready To Assemble Furniture Market Analysis, Opportunity and Forecast, By End-User, 2016-2032
- 9.6.1. Middle East & Africa Ready To Assemble Furniture Market Analysis by End-User: Introduction
- 9.6.2. Market Size Absolute $ Opportunity Analysis and Forecast, By End-User, 2016-2032
- 9.6.3. Residential
- 9.6.4. Commercial
- 9.6.5. Institutional
- 9.6.6. Others
- 9.7. Middle East & Africa Ready To Assemble Furniture Market Analysis, Opportunity and Forecast, By Country , 2016-2032
- 9.7.1. Middle East & Africa Ready To Assemble Furniture Market Analysis by Country : Introduction
- 9.7.2. Market Size Absolute $ Opportunity Analysis and Forecast, Country , 2016-2032
- 9.7.2.1. Algeria
- 9.7.2.2. Egypt
- 9.7.2.3. Israel
- 9.7.2.4. Kuwait
- 9.7.2.5. Nigeria
- 9.7.2.6. Saudi Arabia
- 9.7.2.7. South Africa
- 9.7.2.8. Turkey
- 9.7.2.9. The UAE
- 9.7.2.10. Rest of MEA
- 10. Global Ready To Assemble Furniture Market Analysis, Opportunity and Forecast, By Region , 2016-2032
- 10.1. Global Ready To Assemble Furniture Market Analysis by Region : Introduction
- 10.2. Market Size Absolute $ Opportunity Analysis and Forecast, By Region , 2016-2032
- 10.2.1. North America
- 10.2.2. Western Europe
- 10.2.3. Eastern Europe
- 10.2.4. APAC
- 10.2.5. Latin America
- 10.2.6. Middle East & Africa
- 11. Global Ready To Assemble Furniture Market Competitive Landscape, Market Share Analysis, and Company Profiles
- 11.1. Market Share Analysis
- 11.2. Company Profiles
- 11.3. Inter IKEA Systems B.V.
- 11.3.1. Company Overview
- 11.3.2. Financial Highlights
- 11.3.3. Product Portfolio
- 11.3.4. SWOT Analysis
- 11.3.5. Key Strategies and Developments
- 11.4. Dorel Industries Inc
- 11.4.1. Company Overview
- 11.4.2. Financial Highlights
- 11.4.3. Product Portfolio
- 11.4.4. SWOT Analysis
- 11.4.5. Key Strategies and Developments
- 11.5. Steinhoff International
- 11.5.1. Company Overview
- 11.5.2. Financial Highlights
- 11.5.3. Product Portfolio
- 11.5.4. SWOT Analysis
- 11.5.5. Key Strategies and Developments
- 11.6. Tvilum A/S
- 11.6.1. Company Overview
- 11.6.2. Financial Highlights
- 11.6.3. Product Portfolio
- 11.6.4. SWOT Analysis
- 11.6.5. Key Strategies and Developments
- 11.7. Simplicity Sofas
- 11.7.1. Company Overview
- 11.7.2. Financial Highlights
- 11.7.3. Product Portfolio
- 11.7.4. SWOT Analysis
- 11.7.5. Key Strategies and Developments
- 11.8. Sauder Woodworking Company
- 11.8.1. Company Overview
- 11.8.2. Financial Highlights
- 11.8.3. Product Portfolio
- 11.8.4. SWOT Analysis
- 11.8.5. Key Strategies and Developments
- 11.9. Bush Industries, Inc.
- 11.9.1. Company Overview
- 11.9.2. Financial Highlights
- 11.9.3. Product Portfolio
- 11.9.4. SWOT Analysis
- 11.9.5. Key Strategies and Developments
- 11.10. Whalen Furniture Manufacturing
- 11.10.1. Company Overview
- 11.10.2. Financial Highlights
- 11.10.3. Product Portfolio
- 11.10.4. SWOT Analysis
- 11.10.5. Key Strategies and Developments
- 11.11. Steinhoff Holding
- 11.11.1. Company Overview
- 11.11.2. Financial Highlights
- 11.11.3. Product Portfolio
- 11.11.4. SWOT Analysis
- 11.11.5. Key Strategies and Developments
- 11.12. Leicht Kuchen AG
- 11.12.1. Company Overview
- 11.12.2. Financial Highlights
- 11.12.3. Product Portfolio
- 11.12.4. SWOT Analysis
- 11.12.5. Key Strategies and Developments
- 11.13.1. Company Overview
- 11.13.2. Financial Highlights
- 11.13.3. Product Portfolio
- 11.13.4. SWOT Analysis
- 11.13.5. Key Strategies and Developments
- 11.14. South Shore Furniture
- 11.14.1. Company Overview
- 11.14.2. Financial Highlights
- 11.14.3. Product Portfolio
- 11.14.4. SWOT Analysis
- 11.14.5. Key Strategies and Developments
- 12. Assumptions and Acronyms
- 13. Research Methodology
- 14. Contact
- List of Figures
- Figure 1: Global Ready To Assemble Furniture Market Revenue (US$ Mn) Market Share by Product Type in 2022
- Figure 2: Global Ready To Assemble Furniture Market Attractiveness Analysis by Product Type, 2016-2032
- Figure 3: Global Ready To Assemble Furniture Market Revenue (US$ Mn) Market Share by Material Typein 2022
- Figure 4: Global Ready To Assemble Furniture Market Attractiveness Analysis by Material Type, 2016-2032
- Figure 5: Global Ready To Assemble Furniture Market Revenue (US$ Mn) Market Share by Distribution Channelin 2022
- Figure 6: Global Ready To Assemble Furniture Market Attractiveness Analysis by Distribution Channel, 2016-2032
- Figure 7: Global Ready To Assemble Furniture Market Revenue (US$ Mn) Market Share by End-Userin 2022
- Figure 8: Global Ready To Assemble Furniture Market Attractiveness Analysis by End-User, 2016-2032
- Figure 9: Global Ready To Assemble Furniture Market Revenue (US$ Mn) Market Share by Region in 2022
- Figure 10: Global Ready To Assemble Furniture Market Attractiveness Analysis by Region, 2016-2032
- Figure 11: Global Ready To Assemble Furniture Market Revenue (US$ Mn) (2016-2032)
- Figure 12: Global Ready To Assemble Furniture Market Revenue (US$ Mn) Comparison by Region (2016-2032)
- Figure 13: Global Ready To Assemble Furniture Market Revenue (US$ Mn) Comparison by Product Type (2016-2032)
- Figure 14: Global Ready To Assemble Furniture Market Revenue (US$ Mn) Comparison by Material Type (2016-2032)
- Figure 15: Global Ready To Assemble Furniture Market Revenue (US$ Mn) Comparison by Distribution Channel (2016-2032)
- Figure 16: Global Ready To Assemble Furniture Market Revenue (US$ Mn) Comparison by End-User (2016-2032)
- Figure 17: Global Ready To Assemble Furniture Market Y-o-Y Growth Rate Comparison by Region (2016-2032)
- Figure 18: Global Ready To Assemble Furniture Market Y-o-Y Growth Rate Comparison by Product Type (2016-2032)
- Figure 19: Global Ready To Assemble Furniture Market Y-o-Y Growth Rate Comparison by Material Type (2016-2032)
- Figure 20: Global Ready To Assemble Furniture Market Y-o-Y Growth Rate Comparison by Distribution Channel (2016-2032)
- Figure 21: Global Ready To Assemble Furniture Market Y-o-Y Growth Rate Comparison by End-User (2016-2032)
- Figure 22: Global Ready To Assemble Furniture Market Share Comparison by Region (2016-2032)
- Figure 23: Global Ready To Assemble Furniture Market Share Comparison by Product Type (2016-2032)
- Figure 24: Global Ready To Assemble Furniture Market Share Comparison by Material Type (2016-2032)
- Figure 25: Global Ready To Assemble Furniture Market Share Comparison by Distribution Channel (2016-2032)
- Figure 26: Global Ready To Assemble Furniture Market Share Comparison by End-User (2016-2032)
- Figure 27: North America Ready To Assemble Furniture Market Revenue (US$ Mn) Market Share by Product Typein 2022
- Figure 28: North America Ready To Assemble Furniture Market Attractiveness Analysis by Product Type, 2016-2032
- Figure 29: North America Ready To Assemble Furniture Market Revenue (US$ Mn) Market Share by Material Typein 2022
- Figure 30: North America Ready To Assemble Furniture Market Attractiveness Analysis by Material Type, 2016-2032
- Figure 31: North America Ready To Assemble Furniture Market Revenue (US$ Mn) Market Share by Distribution Channelin 2022
- Figure 32: North America Ready To Assemble Furniture Market Attractiveness Analysis by Distribution Channel, 2016-2032
- Figure 33: North America Ready To Assemble Furniture Market Revenue (US$ Mn) Market Share by End-Userin 2022
- Figure 34: North America Ready To Assemble Furniture Market Attractiveness Analysis by End-User, 2016-2032
- Figure 35: North America Ready To Assemble Furniture Market Revenue (US$ Mn) Market Share by Country in 2022
- Figure 36: North America Ready To Assemble Furniture Market Attractiveness Analysis by Country, 2016-2032
- Figure 37: North America Ready To Assemble Furniture Market Revenue (US$ Mn) (2016-2032)
- Figure 38: North America Ready To Assemble Furniture Market Revenue (US$ Mn) Comparison by Country (2016-2032)
- Figure 39: North America Ready To Assemble Furniture Market Revenue (US$ Mn) Comparison by Product Type (2016-2032)
- Figure 40: North America Ready To Assemble Furniture Market Revenue (US$ Mn) Comparison by Material Type (2016-2032)
- Figure 41: North America Ready To Assemble Furniture Market Revenue (US$ Mn) Comparison by Distribution Channel (2016-2032)
- Figure 42: North America Ready To Assemble Furniture Market Revenue (US$ Mn) Comparison by End-User (2016-2032)
- Figure 43: North America Ready To Assemble Furniture Market Y-o-Y Growth Rate Comparison by Country (2016-2032)
- Figure 44: North America Ready To Assemble Furniture Market Y-o-Y Growth Rate Comparison by Product Type (2016-2032)
- Figure 45: North America Ready To Assemble Furniture Market Y-o-Y Growth Rate Comparison by Material Type (2016-2032)
- Figure 46: North America Ready To Assemble Furniture Market Y-o-Y Growth Rate Comparison by Distribution Channel (2016-2032)
- Figure 47: North America Ready To Assemble Furniture Market Y-o-Y Growth Rate Comparison by End-User (2016-2032)
- Figure 48: North America Ready To Assemble Furniture Market Share Comparison by Country (2016-2032)
- Figure 49: North America Ready To Assemble Furniture Market Share Comparison by Product Type (2016-2032)
- Figure 50: North America Ready To Assemble Furniture Market Share Comparison by Material Type (2016-2032)
- Figure 51: North America Ready To Assemble Furniture Market Share Comparison by Distribution Channel (2016-2032)
- Figure 52: North America Ready To Assemble Furniture Market Share Comparison by End-User (2016-2032)
- Figure 53: Western Europe Ready To Assemble Furniture Market Revenue (US$ Mn) Market Share by Product Typein 2022
- Figure 54: Western Europe Ready To Assemble Furniture Market Attractiveness Analysis by Product Type, 2016-2032
- Figure 55: Western Europe Ready To Assemble Furniture Market Revenue (US$ Mn) Market Share by Material Typein 2022
- Figure 56: Western Europe Ready To Assemble Furniture Market Attractiveness Analysis by Material Type, 2016-2032
- Figure 57: Western Europe Ready To Assemble Furniture Market Revenue (US$ Mn) Market Share by Distribution Channelin 2022
- Figure 58: Western Europe Ready To Assemble Furniture Market Attractiveness Analysis by Distribution Channel, 2016-2032
- Figure 59: Western Europe Ready To Assemble Furniture Market Revenue (US$ Mn) Market Share by End-Userin 2022
- Figure 60: Western Europe Ready To Assemble Furniture Market Attractiveness Analysis by End-User, 2016-2032
- Figure 61: Western Europe Ready To Assemble Furniture Market Revenue (US$ Mn) Market Share by Country in 2022
- Figure 62: Western Europe Ready To Assemble Furniture Market Attractiveness Analysis by Country, 2016-2032
- Figure 63: Western Europe Ready To Assemble Furniture Market Revenue (US$ Mn) (2016-2032)
- Figure 64: Western Europe Ready To Assemble Furniture Market Revenue (US$ Mn) Comparison by Country (2016-2032)
- Figure 65: Western Europe Ready To Assemble Furniture Market Revenue (US$ Mn) Comparison by Product Type (2016-2032)
- Figure 66: Western Europe Ready To Assemble Furniture Market Revenue (US$ Mn) Comparison by Material Type (2016-2032)
- Figure 67: Western Europe Ready To Assemble Furniture Market Revenue (US$ Mn) Comparison by Distribution Channel (2016-2032)
- Figure 68: Western Europe Ready To Assemble Furniture Market Revenue (US$ Mn) Comparison by End-User (2016-2032)
- Figure 69: Western Europe Ready To Assemble Furniture Market Y-o-Y Growth Rate Comparison by Country (2016-2032)
- Figure 70: Western Europe Ready To Assemble Furniture Market Y-o-Y Growth Rate Comparison by Product Type (2016-2032)
- Figure 71: Western Europe Ready To Assemble Furniture Market Y-o-Y Growth Rate Comparison by Material Type (2016-2032)
- Figure 72: Western Europe Ready To Assemble Furniture Market Y-o-Y Growth Rate Comparison by Distribution Channel (2016-2032)
- Figure 73: Western Europe Ready To Assemble Furniture Market Y-o-Y Growth Rate Comparison by End-User (2016-2032)
- Figure 74: Western Europe Ready To Assemble Furniture Market Share Comparison by Country (2016-2032)
- Figure 75: Western Europe Ready To Assemble Furniture Market Share Comparison by Product Type (2016-2032)
- Figure 76: Western Europe Ready To Assemble Furniture Market Share Comparison by Material Type (2016-2032)
- Figure 77: Western Europe Ready To Assemble Furniture Market Share Comparison by Distribution Channel (2016-2032)
- Figure 78: Western Europe Ready To Assemble Furniture Market Share Comparison by End-User (2016-2032)
- Figure 79: Eastern Europe Ready To Assemble Furniture Market Revenue (US$ Mn) Market Share by Product Typein 2022
- Figure 80: Eastern Europe Ready To Assemble Furniture Market Attractiveness Analysis by Product Type, 2016-2032
- Figure 81: Eastern Europe Ready To Assemble Furniture Market Revenue (US$ Mn) Market Share by Material Typein 2022
- Figure 82: Eastern Europe Ready To Assemble Furniture Market Attractiveness Analysis by Material Type, 2016-2032
- Figure 83: Eastern Europe Ready To Assemble Furniture Market Revenue (US$ Mn) Market Share by Distribution Channelin 2022
- Figure 84: Eastern Europe Ready To Assemble Furniture Market Attractiveness Analysis by Distribution Channel, 2016-2032
- Figure 85: Eastern Europe Ready To Assemble Furniture Market Revenue (US$ Mn) Market Share by End-Userin 2022
- Figure 86: Eastern Europe Ready To Assemble Furniture Market Attractiveness Analysis by End-User, 2016-2032
- Figure 87: Eastern Europe Ready To Assemble Furniture Market Revenue (US$ Mn) Market Share by Country in 2022
- Figure 88: Eastern Europe Ready To Assemble Furniture Market Attractiveness Analysis by Country, 2016-2032
- Figure 89: Eastern Europe Ready To Assemble Furniture Market Revenue (US$ Mn) (2016-2032)
- Figure 90: Eastern Europe Ready To Assemble Furniture Market Revenue (US$ Mn) Comparison by Country (2016-2032)
- Figure 91: Eastern Europe Ready To Assemble Furniture Market Revenue (US$ Mn) Comparison by Product Type (2016-2032)
- Figure 92: Eastern Europe Ready To Assemble Furniture Market Revenue (US$ Mn) Comparison by Material Type (2016-2032)
- Figure 93: Eastern Europe Ready To Assemble Furniture Market Revenue (US$ Mn) Comparison by Distribution Channel (2016-2032)
- Figure 94: Eastern Europe Ready To Assemble Furniture Market Revenue (US$ Mn) Comparison by End-User (2016-2032)
- Figure 95: Eastern Europe Ready To Assemble Furniture Market Y-o-Y Growth Rate Comparison by Country (2016-2032)
- Figure 96: Eastern Europe Ready To Assemble Furniture Market Y-o-Y Growth Rate Comparison by Product Type (2016-2032)
- Figure 97: Eastern Europe Ready To Assemble Furniture Market Y-o-Y Growth Rate Comparison by Material Type (2016-2032)
- Figure 98: Eastern Europe Ready To Assemble Furniture Market Y-o-Y Growth Rate Comparison by Distribution Channel (2016-2032)
- Figure 99: Eastern Europe Ready To Assemble Furniture Market Y-o-Y Growth Rate Comparison by End-User (2016-2032)
- Figure 100: Eastern Europe Ready To Assemble Furniture Market Share Comparison by Country (2016-2032)
- Figure 101: Eastern Europe Ready To Assemble Furniture Market Share Comparison by Product Type (2016-2032)
- Figure 102: Eastern Europe Ready To Assemble Furniture Market Share Comparison by Material Type (2016-2032)
- Figure 103: Eastern Europe Ready To Assemble Furniture Market Share Comparison by Distribution Channel (2016-2032)
- Figure 104: Eastern Europe Ready To Assemble Furniture Market Share Comparison by End-User (2016-2032)
- Figure 105: APAC Ready To Assemble Furniture Market Revenue (US$ Mn) Market Share by Product Typein 2022
- Figure 106: APAC Ready To Assemble Furniture Market Attractiveness Analysis by Product Type, 2016-2032
- Figure 107: APAC Ready To Assemble Furniture Market Revenue (US$ Mn) Market Share by Material Typein 2022
- Figure 108: APAC Ready To Assemble Furniture Market Attractiveness Analysis by Material Type, 2016-2032
- Figure 109: APAC Ready To Assemble Furniture Market Revenue (US$ Mn) Market Share by Distribution Channelin 2022
- Figure 110: APAC Ready To Assemble Furniture Market Attractiveness Analysis by Distribution Channel, 2016-2032
- Figure 111: APAC Ready To Assemble Furniture Market Revenue (US$ Mn) Market Share by End-Userin 2022
- Figure 112: APAC Ready To Assemble Furniture Market Attractiveness Analysis by End-User, 2016-2032
- Figure 113: APAC Ready To Assemble Furniture Market Revenue (US$ Mn) Market Share by Country in 2022
- Figure 114: APAC Ready To Assemble Furniture Market Attractiveness Analysis by Country, 2016-2032
- Figure 115: APAC Ready To Assemble Furniture Market Revenue (US$ Mn) (2016-2032)
- Figure 116: APAC Ready To Assemble Furniture Market Revenue (US$ Mn) Comparison by Country (2016-2032)
- Figure 117: APAC Ready To Assemble Furniture Market Revenue (US$ Mn) Comparison by Product Type (2016-2032)
- Figure 118: APAC Ready To Assemble Furniture Market Revenue (US$ Mn) Comparison by Material Type (2016-2032)
- Figure 119: APAC Ready To Assemble Furniture Market Revenue (US$ Mn) Comparison by Distribution Channel (2016-2032)
- Figure 120: APAC Ready To Assemble Furniture Market Revenue (US$ Mn) Comparison by End-User (2016-2032)
- Figure 121: APAC Ready To Assemble Furniture Market Y-o-Y Growth Rate Comparison by Country (2016-2032)
- Figure 122: APAC Ready To Assemble Furniture Market Y-o-Y Growth Rate Comparison by Product Type (2016-2032)
- Figure 123: APAC Ready To Assemble Furniture Market Y-o-Y Growth Rate Comparison by Material Type (2016-2032)
- Figure 124: APAC Ready To Assemble Furniture Market Y-o-Y Growth Rate Comparison by Distribution Channel (2016-2032)
- Figure 125: APAC Ready To Assemble Furniture Market Y-o-Y Growth Rate Comparison by End-User (2016-2032)
- Figure 126: APAC Ready To Assemble Furniture Market Share Comparison by Country (2016-2032)
- Figure 127: APAC Ready To Assemble Furniture Market Share Comparison by Product Type (2016-2032)
- Figure 128: APAC Ready To Assemble Furniture Market Share Comparison by Material Type (2016-2032)
- Figure 129: APAC Ready To Assemble Furniture Market Share Comparison by Distribution Channel (2016-2032)
- Figure 130: APAC Ready To Assemble Furniture Market Share Comparison by End-User (2016-2032)
- Figure 131: Latin America Ready To Assemble Furniture Market Revenue (US$ Mn) Market Share by Product Typein 2022
- Figure 132: Latin America Ready To Assemble Furniture Market Attractiveness Analysis by Product Type, 2016-2032
- Figure 133: Latin America Ready To Assemble Furniture Market Revenue (US$ Mn) Market Share by Material Typein 2022
- Figure 134: Latin America Ready To Assemble Furniture Market Attractiveness Analysis by Material Type, 2016-2032
- Figure 135: Latin America Ready To Assemble Furniture Market Revenue (US$ Mn) Market Share by Distribution Channelin 2022
- Figure 136: Latin America Ready To Assemble Furniture Market Attractiveness Analysis by Distribution Channel, 2016-2032
- Figure 137: Latin America Ready To Assemble Furniture Market Revenue (US$ Mn) Market Share by End-Userin 2022
- Figure 138: Latin America Ready To Assemble Furniture Market Attractiveness Analysis by End-User, 2016-2032
- Figure 139: Latin America Ready To Assemble Furniture Market Revenue (US$ Mn) Market Share by Country in 2022
- Figure 140: Latin America Ready To Assemble Furniture Market Attractiveness Analysis by Country, 2016-2032
- Figure 141: Latin America Ready To Assemble Furniture Market Revenue (US$ Mn) (2016-2032)
- Figure 142: Latin America Ready To Assemble Furniture Market Revenue (US$ Mn) Comparison by Country (2016-2032)
- Figure 143: Latin America Ready To Assemble Furniture Market Revenue (US$ Mn) Comparison by Product Type (2016-2032)
- Figure 144: Latin America Ready To Assemble Furniture Market Revenue (US$ Mn) Comparison by Material Type (2016-2032)
- Figure 145: Latin America Ready To Assemble Furniture Market Revenue (US$ Mn) Comparison by Distribution Channel (2016-2032)
- Figure 146: Latin America Ready To Assemble Furniture Market Revenue (US$ Mn) Comparison by End-User (2016-2032)
- Figure 147: Latin America Ready To Assemble Furniture Market Y-o-Y Growth Rate Comparison by Country (2016-2032)
- Figure 148: Latin America Ready To Assemble Furniture Market Y-o-Y Growth Rate Comparison by Product Type (2016-2032)
- Figure 149: Latin America Ready To Assemble Furniture Market Y-o-Y Growth Rate Comparison by Material Type (2016-2032)
- Figure 150: Latin America Ready To Assemble Furniture Market Y-o-Y Growth Rate Comparison by Distribution Channel (2016-2032)
- Figure 151: Latin America Ready To Assemble Furniture Market Y-o-Y Growth Rate Comparison by End-User (2016-2032)
- Figure 152: Latin America Ready To Assemble Furniture Market Share Comparison by Country (2016-2032)
- Figure 153: Latin America Ready To Assemble Furniture Market Share Comparison by Product Type (2016-2032)
- Figure 154: Latin America Ready To Assemble Furniture Market Share Comparison by Material Type (2016-2032)
- Figure 155: Latin America Ready To Assemble Furniture Market Share Comparison by Distribution Channel (2016-2032)
- Figure 156: Latin America Ready To Assemble Furniture Market Share Comparison by End-User (2016-2032)
- Figure 157: Middle East & Africa Ready To Assemble Furniture Market Revenue (US$ Mn) Market Share by Product Typein 2022
- Figure 158: Middle East & Africa Ready To Assemble Furniture Market Attractiveness Analysis by Product Type, 2016-2032
- Figure 159: Middle East & Africa Ready To Assemble Furniture Market Revenue (US$ Mn) Market Share by Material Typein 2022
- Figure 160: Middle East & Africa Ready To Assemble Furniture Market Attractiveness Analysis by Material Type, 2016-2032
- Figure 161: Middle East & Africa Ready To Assemble Furniture Market Revenue (US$ Mn) Market Share by Distribution Channelin 2022
- Figure 162: Middle East & Africa Ready To Assemble Furniture Market Attractiveness Analysis by Distribution Channel, 2016-2032
- Figure 163: Middle East & Africa Ready To Assemble Furniture Market Revenue (US$ Mn) Market Share by End-Userin 2022
- Figure 164: Middle East & Africa Ready To Assemble Furniture Market Attractiveness Analysis by End-User, 2016-2032
- Figure 165: Middle East & Africa Ready To Assemble Furniture Market Revenue (US$ Mn) Market Share by Country in 2022
- Figure 166: Middle East & Africa Ready To Assemble Furniture Market Attractiveness Analysis by Country, 2016-2032
- Figure 167: Middle East & Africa Ready To Assemble Furniture Market Revenue (US$ Mn) (2016-2032)
- Figure 168: Middle East & Africa Ready To Assemble Furniture Market Revenue (US$ Mn) Comparison by Country (2016-2032)
- Figure 169: Middle East & Africa Ready To Assemble Furniture Market Revenue (US$ Mn) Comparison by Product Type (2016-2032)
- Figure 170: Middle East & Africa Ready To Assemble Furniture Market Revenue (US$ Mn) Comparison by Material Type (2016-2032)
- Figure 171: Middle East & Africa Ready To Assemble Furniture Market Revenue (US$ Mn) Comparison by Distribution Channel (2016-2032)
- Figure 172: Middle East & Africa Ready To Assemble Furniture Market Revenue (US$ Mn) Comparison by End-User (2016-2032)
- Figure 173: Middle East & Africa Ready To Assemble Furniture Market Y-o-Y Growth Rate Comparison by Country (2016-2032)
- Figure 174: Middle East & Africa Ready To Assemble Furniture Market Y-o-Y Growth Rate Comparison by Product Type (2016-2032)
- Figure 175: Middle East & Africa Ready To Assemble Furniture Market Y-o-Y Growth Rate Comparison by Material Type (2016-2032)
- Figure 176: Middle East & Africa Ready To Assemble Furniture Market Y-o-Y Growth Rate Comparison by Distribution Channel (2016-2032)
- Figure 177: Middle East & Africa Ready To Assemble Furniture Market Y-o-Y Growth Rate Comparison by End-User (2016-2032)
- Figure 178: Middle East & Africa Ready To Assemble Furniture Market Share Comparison by Country (2016-2032)
- Figure 179: Middle East & Africa Ready To Assemble Furniture Market Share Comparison by Product Type (2016-2032)
- Figure 180: Middle East & Africa Ready To Assemble Furniture Market Share Comparison by Material Type (2016-2032)
- Figure 181: Middle East & Africa Ready To Assemble Furniture Market Share Comparison by Distribution Channel (2016-2032)
- Figure 182: Middle East & Africa Ready To Assemble Furniture Market Share Comparison by End-User (2016-2032)
- List of Tables
- Table 1: Global Ready To Assemble Furniture Market Comparison by Product Type (2016-2032)
- Table 2: Global Ready To Assemble Furniture Market Comparison by Material Type (2016-2032)
- Table 3: Global Ready To Assemble Furniture Market Comparison by Distribution Channel (2016-2032)
- Table 4: Global Ready To Assemble Furniture Market Comparison by End-User (2016-2032)
- Table 5: Global Ready To Assemble Furniture Market Revenue (US$ Mn) Comparison by Region (2016-2032)
- Table 6: Global Ready To Assemble Furniture Market Revenue (US$ Mn) (2016-2032)
- Table 7: Global Ready To Assemble Furniture Market Revenue (US$ Mn) Comparison by Region (2016-2032)
- Table 8: Global Ready To Assemble Furniture Market Revenue (US$ Mn) Comparison by Product Type (2016-2032)
- Table 9: Global Ready To Assemble Furniture Market Revenue (US$ Mn) Comparison by Material Type (2016-2032)
- Table 10: Global Ready To Assemble Furniture Market Revenue (US$ Mn) Comparison by Distribution Channel (2016-2032)
- Table 11: Global Ready To Assemble Furniture Market Revenue (US$ Mn) Comparison by End-User (2016-2032)
- Table 12: Global Ready To Assemble Furniture Market Y-o-Y Growth Rate Comparison by Region (2016-2032)
- Table 13: Global Ready To Assemble Furniture Market Y-o-Y Growth Rate Comparison by Product Type (2016-2032)
- Table 14: Global Ready To Assemble Furniture Market Y-o-Y Growth Rate Comparison by Material Type (2016-2032)
- Table 15: Global Ready To Assemble Furniture Market Y-o-Y Growth Rate Comparison by Distribution Channel (2016-2032)
- Table 16: Global Ready To Assemble Furniture Market Y-o-Y Growth Rate Comparison by End-User (2016-2032)
- Table 17: Global Ready To Assemble Furniture Market Share Comparison by Region (2016-2032)
- Table 18: Global Ready To Assemble Furniture Market Share Comparison by Product Type (2016-2032)
- Table 19: Global Ready To Assemble Furniture Market Share Comparison by Material Type (2016-2032)
- Table 20: Global Ready To Assemble Furniture Market Share Comparison by Distribution Channel (2016-2032)
- Table 21: Global Ready To Assemble Furniture Market Share Comparison by End-User (2016-2032)
- Table 22: North America Ready To Assemble Furniture Market Comparison by Material Type (2016-2032)
- Table 23: North America Ready To Assemble Furniture Market Comparison by Distribution Channel (2016-2032)
- Table 24: North America Ready To Assemble Furniture Market Comparison by End-User (2016-2032)
- Table 25: North America Ready To Assemble Furniture Market Revenue (US$ Mn) Comparison by Country (2016-2032)
- Table 26: North America Ready To Assemble Furniture Market Revenue (US$ Mn) (2016-2032)
- Table 27: North America Ready To Assemble Furniture Market Revenue (US$ Mn) Comparison by Country (2016-2032)
- Table 28: North America Ready To Assemble Furniture Market Revenue (US$ Mn) Comparison by Product Type (2016-2032)
- Table 29: North America Ready To Assemble Furniture Market Revenue (US$ Mn) Comparison by Material Type (2016-2032)
- Table 30: North America Ready To Assemble Furniture Market Revenue (US$ Mn) Comparison by Distribution Channel (2016-2032)
- Table 31: North America Ready To Assemble Furniture Market Revenue (US$ Mn) Comparison by End-User (2016-2032)
- Table 32: North America Ready To Assemble Furniture Market Y-o-Y Growth Rate Comparison by Country (2016-2032)
- Table 33: North America Ready To Assemble Furniture Market Y-o-Y Growth Rate Comparison by Product Type (2016-2032)
- Table 34: North America Ready To Assemble Furniture Market Y-o-Y Growth Rate Comparison by Material Type (2016-2032)
- Table 35: North America Ready To Assemble Furniture Market Y-o-Y Growth Rate Comparison by Distribution Channel (2016-2032)
- Table 36: North America Ready To Assemble Furniture Market Y-o-Y Growth Rate Comparison by End-User (2016-2032)
- Table 37: North America Ready To Assemble Furniture Market Share Comparison by Country (2016-2032)
- Table 38: North America Ready To Assemble Furniture Market Share Comparison by Product Type (2016-2032)
- Table 39: North America Ready To Assemble Furniture Market Share Comparison by Material Type (2016-2032)
- Table 40: North America Ready To Assemble Furniture Market Share Comparison by Distribution Channel (2016-2032)
- Table 41: North America Ready To Assemble Furniture Market Share Comparison by End-User (2016-2032)
- Table 42: Western Europe Ready To Assemble Furniture Market Comparison by Product Type (2016-2032)
- Table 43: Western Europe Ready To Assemble Furniture Market Comparison by Material Type (2016-2032)
- Table 44: Western Europe Ready To Assemble Furniture Market Comparison by Distribution Channel (2016-2032)
- Table 45: Western Europe Ready To Assemble Furniture Market Comparison by End-User (2016-2032)
- Table 46: Western Europe Ready To Assemble Furniture Market Revenue (US$ Mn) Comparison by Country (2016-2032)
- Table 47: Western Europe Ready To Assemble Furniture Market Revenue (US$ Mn) (2016-2032)
- Table 48: Western Europe Ready To Assemble Furniture Market Revenue (US$ Mn) Comparison by Country (2016-2032)
- Table 49: Western Europe Ready To Assemble Furniture Market Revenue (US$ Mn) Comparison by Product Type (2016-2032)
- Table 50: Western Europe Ready To Assemble Furniture Market Revenue (US$ Mn) Comparison by Material Type (2016-2032)
- Table 51: Western Europe Ready To Assemble Furniture Market Revenue (US$ Mn) Comparison by Distribution Channel (2016-2032)
- Table 52: Western Europe Ready To Assemble Furniture Market Revenue (US$ Mn) Comparison by End-User (2016-2032)
- Table 53: Western Europe Ready To Assemble Furniture Market Y-o-Y Growth Rate Comparison by Country (2016-2032)
- Table 54: Western Europe Ready To Assemble Furniture Market Y-o-Y Growth Rate Comparison by Product Type (2016-2032)
- Table 55: Western Europe Ready To Assemble Furniture Market Y-o-Y Growth Rate Comparison by Material Type (2016-2032)
- Table 56: Western Europe Ready To Assemble Furniture Market Y-o-Y Growth Rate Comparison by Distribution Channel (2016-2032)
- Table 57: Western Europe Ready To Assemble Furniture Market Y-o-Y Growth Rate Comparison by End-User (2016-2032)
- Table 58: Western Europe Ready To Assemble Furniture Market Share Comparison by Country (2016-2032)
- Table 59: Western Europe Ready To Assemble Furniture Market Share Comparison by Product Type (2016-2032)
- Table 60: Western Europe Ready To Assemble Furniture Market Share Comparison by Material Type (2016-2032)
- Table 61: Western Europe Ready To Assemble Furniture Market Share Comparison by Distribution Channel (2016-2032)
- Table 62: Western Europe Ready To Assemble Furniture Market Share Comparison by End-User (2016-2032)
- Table 63: Eastern Europe Ready To Assemble Furniture Market Comparison by Product Type (2016-2032)
- Table 64: Eastern Europe Ready To Assemble Furniture Market Comparison by Material Type (2016-2032)
- Table 65: Eastern Europe Ready To Assemble Furniture Market Comparison by Distribution Channel (2016-2032)
- Table 66: Eastern Europe Ready To Assemble Furniture Market Comparison by End-User (2016-2032)
- Table 67: Eastern Europe Ready To Assemble Furniture Market Revenue (US$ Mn) Comparison by Country (2016-2032)
- Table 68: Eastern Europe Ready To Assemble Furniture Market Revenue (US$ Mn) (2016-2032)
- Table 69: Eastern Europe Ready To Assemble Furniture Market Revenue (US$ Mn) Comparison by Country (2016-2032)
- Table 70: Eastern Europe Ready To Assemble Furniture Market Revenue (US$ Mn) Comparison by Product Type (2016-2032)
- Table 71: Eastern Europe Ready To Assemble Furniture Market Revenue (US$ Mn) Comparison by Material Type (2016-2032)
- Table 72: Eastern Europe Ready To Assemble Furniture Market Revenue (US$ Mn) Comparison by Distribution Channel (2016-2032)
- Table 73: Eastern Europe Ready To Assemble Furniture Market Revenue (US$ Mn) Comparison by End-User (2016-2032)
- Table 74: Eastern Europe Ready To Assemble Furniture Market Y-o-Y Growth Rate Comparison by Country (2016-2032)
- Table 75: Eastern Europe Ready To Assemble Furniture Market Y-o-Y Growth Rate Comparison by Product Type (2016-2032)
- Table 76: Eastern Europe Ready To Assemble Furniture Market Y-o-Y Growth Rate Comparison by Material Type (2016-2032)
- Table 77: Eastern Europe Ready To Assemble Furniture Market Y-o-Y Growth Rate Comparison by Distribution Channel (2016-2032)
- Table 78: Eastern Europe Ready To Assemble Furniture Market Y-o-Y Growth Rate Comparison by End-User (2016-2032)
- Table 79: Eastern Europe Ready To Assemble Furniture Market Share Comparison by Country (2016-2032)
- Table 80: Eastern Europe Ready To Assemble Furniture Market Share Comparison by Product Type (2016-2032)
- Table 81: Eastern Europe Ready To Assemble Furniture Market Share Comparison by Material Type (2016-2032)
- Table 82: Eastern Europe Ready To Assemble Furniture Market Share Comparison by Distribution Channel (2016-2032)
- Table 83: Eastern Europe Ready To Assemble Furniture Market Share Comparison by End-User (2016-2032)
- Table 84: APAC Ready To Assemble Furniture Market Comparison by Product Type (2016-2032)
- Table 85: APAC Ready To Assemble Furniture Market Comparison by Material Type (2016-2032)
- Table 86: APAC Ready To Assemble Furniture Market Comparison by Distribution Channel (2016-2032)
- Table 87: APAC Ready To Assemble Furniture Market Comparison by End-User (2016-2032)
- Table 88: APAC Ready To Assemble Furniture Market Revenue (US$ Mn) Comparison by Country (2016-2032)
- Table 89: APAC Ready To Assemble Furniture Market Revenue (US$ Mn) (2016-2032)
- Table 90: APAC Ready To Assemble Furniture Market Revenue (US$ Mn) Comparison by Country (2016-2032)
- Table 91: APAC Ready To Assemble Furniture Market Revenue (US$ Mn) Comparison by Product Type (2016-2032)
- Table 92: APAC Ready To Assemble Furniture Market Revenue (US$ Mn) Comparison by Material Type (2016-2032)
- Table 93: APAC Ready To Assemble Furniture Market Revenue (US$ Mn) Comparison by Distribution Channel (2016-2032)
- Table 94: APAC Ready To Assemble Furniture Market Revenue (US$ Mn) Comparison by End-User (2016-2032)
- Table 95: APAC Ready To Assemble Furniture Market Y-o-Y Growth Rate Comparison by Country (2016-2032)
- Table 96: APAC Ready To Assemble Furniture Market Y-o-Y Growth Rate Comparison by Product Type (2016-2032)
- Table 97: APAC Ready To Assemble Furniture Market Y-o-Y Growth Rate Comparison by Material Type (2016-2032)
- Table 98: APAC Ready To Assemble Furniture Market Y-o-Y Growth Rate Comparison by Distribution Channel (2016-2032)
- Table 99: APAC Ready To Assemble Furniture Market Y-o-Y Growth Rate Comparison by End-User (2016-2032)
- Table 100: APAC Ready To Assemble Furniture Market Share Comparison by Country (2016-2032)
- Table 101: APAC Ready To Assemble Furniture Market Share Comparison by Product Type (2016-2032)
- Table 102: APAC Ready To Assemble Furniture Market Share Comparison by Material Type (2016-2032)
- Table 103: APAC Ready To Assemble Furniture Market Share Comparison by Distribution Channel (2016-2032)
- Table 104: APAC Ready To Assemble Furniture Market Share Comparison by End-User (2016-2032)
- Table 105: Latin America Ready To Assemble Furniture Market Comparison by Product Type (2016-2032)
- Table 106: Latin America Ready To Assemble Furniture Market Comparison by Material Type (2016-2032)
- Table 107: Latin America Ready To Assemble Furniture Market Comparison by Distribution Channel (2016-2032)
- Table 108: Latin America Ready To Assemble Furniture Market Comparison by End-User (2016-2032)
- Table 109: Latin America Ready To Assemble Furniture Market Revenue (US$ Mn) Comparison by Country (2016-2032)
- Table 110: Latin America Ready To Assemble Furniture Market Revenue (US$ Mn) (2016-2032)
- Table 111: Latin America Ready To Assemble Furniture Market Revenue (US$ Mn) Comparison by Country (2016-2032)
- Table 112: Latin America Ready To Assemble Furniture Market Revenue (US$ Mn) Comparison by Product Type (2016-2032)
- Table 113: Latin America Ready To Assemble Furniture Market Revenue (US$ Mn) Comparison by Material Type (2016-2032)
- Table 114: Latin America Ready To Assemble Furniture Market Revenue (US$ Mn) Comparison by Distribution Channel (2016-2032)
- Table 115: Latin America Ready To Assemble Furniture Market Revenue (US$ Mn) Comparison by End-User (2016-2032)
- Table 116: Latin America Ready To Assemble Furniture Market Y-o-Y Growth Rate Comparison by Country (2016-2032)
- Table 117: Latin America Ready To Assemble Furniture Market Y-o-Y Growth Rate Comparison by Product Type (2016-2032)
- Table 118: Latin America Ready To Assemble Furniture Market Y-o-Y Growth Rate Comparison by Material Type (2016-2032)
- Table 119: Latin America Ready To Assemble Furniture Market Y-o-Y Growth Rate Comparison by Distribution Channel (2016-2032)
- Table 120: Latin America Ready To Assemble Furniture Market Y-o-Y Growth Rate Comparison by End-User (2016-2032)
- Table 121: Latin America Ready To Assemble Furniture Market Share Comparison by Country (2016-2032)
- Table 122: Latin America Ready To Assemble Furniture Market Share Comparison by Product Type (2016-2032)
- Table 123: Latin America Ready To Assemble Furniture Market Share Comparison by Material Type (2016-2032)
- Table 124: Latin America Ready To Assemble Furniture Market Share Comparison by Distribution Channel (2016-2032)
- Table 125: Latin America Ready To Assemble Furniture Market Share Comparison by End-User (2016-2032)
- Table 126: Middle East & Africa Ready To Assemble Furniture Market Comparison by Product Type (2016-2032)
- Table 127: Middle East & Africa Ready To Assemble Furniture Market Comparison by Material Type (2016-2032)
- Table 128: Middle East & Africa Ready To Assemble Furniture Market Comparison by Distribution Channel (2016-2032)
- Table 129: Middle East & Africa Ready To Assemble Furniture Market Comparison by End-User (2016-2032)
- Table 130: Middle East & Africa Ready To Assemble Furniture Market Revenue (US$ Mn) Comparison by Country (2016-2032)
- Table 131: Middle East & Africa Ready To Assemble Furniture Market Revenue (US$ Mn) (2016-2032)
- Table 132: Middle East & Africa Ready To Assemble Furniture Market Revenue (US$ Mn) Comparison by Country (2016-2032)
- Table 133: Middle East & Africa Ready To Assemble Furniture Market Revenue (US$ Mn) Comparison by Product Type (2016-2032)
- Table 134: Middle East & Africa Ready To Assemble Furniture Market Revenue (US$ Mn) Comparison by Material Type (2016-2032)
- Table 135: Middle East & Africa Ready To Assemble Furniture Market Revenue (US$ Mn) Comparison by Distribution Channel (2016-2032)
- Table 136: Middle East & Africa Ready To Assemble Furniture Market Revenue (US$ Mn) Comparison by End-User (2016-2032)
- Table 137: Middle East & Africa Ready To Assemble Furniture Market Y-o-Y Growth Rate Comparison by Country (2016-2032)
- Table 138: Middle East & Africa Ready To Assemble Furniture Market Y-o-Y Growth Rate Comparison by Product Type (2016-2032)
- Table 139: Middle East & Africa Ready To Assemble Furniture Market Y-o-Y Growth Rate Comparison by Material Type (2016-2032)
- Table 140: Middle East & Africa Ready To Assemble Furniture Market Y-o-Y Growth Rate Comparison by Distribution Channel (2016-2032)
- Table 141: Middle East & Africa Ready To Assemble Furniture Market Y-o-Y Growth Rate Comparison by End-User (2016-2032)
- Table 142: Middle East & Africa Ready To Assemble Furniture Market Share Comparison by Country (2016-2032)
- Table 143: Middle East & Africa Ready To Assemble Furniture Market Share Comparison by Product Type (2016-2032)
- Table 144: Middle East & Africa Ready To Assemble Furniture Market Share Comparison by Material Type (2016-2032)
- Table 145: Middle East & Africa Ready To Assemble Furniture Market Share Comparison by Distribution Channel (2016-2032)
- Table 146: Middle East & Africa Ready To Assemble Furniture Market Share Comparison by End-User (2016-2032)
- 1. Executive Summary
-
- Inter IKEA Systems B.V.
- Dorel Industries Inc.
- Ashley Home Stores, Ltd.
- Steinhoff International Holdings N.V.
- Tvilum A/S
- Simplicity Sofas
- Home Reserve, LLC
- Sauder Woodworking Company
- FabriTec Structures
- Bush Industries, Inc.
Our Clients


View Our Licence Options
