
Quantum Computing Market By Component (Hardware and Software), By Deployment(On-premise, and Cloud), By Application(Machine Learning ,Optimization, Biomedical Simulations and Other ), By End-user(Healthcare , BFSI, Automotive, and Other), By Region And Companies - Industry Segment Outlook, Market Assessment, Competition Scenario, Trends, And Forecast Period 2024-2033
-
50849
-
Sept 2024
-
253
-


-
This report was compiled by Vishwa Gaul Vishwa is an experienced market research and consulting professional with over 8 years of expertise in the ICT industry, contributing to over 700 reports across telecommunications, software, hardware, and digital solutions. Correspondence Team Lead- ICT Linkedin | Detailed Market research Methodology Our methodology involves a mix of primary research, including interviews with leading mental health experts, and secondary research from reputable medical journals and databases. View Detailed Methodology Page
-
Quick Navigation
Report Overview
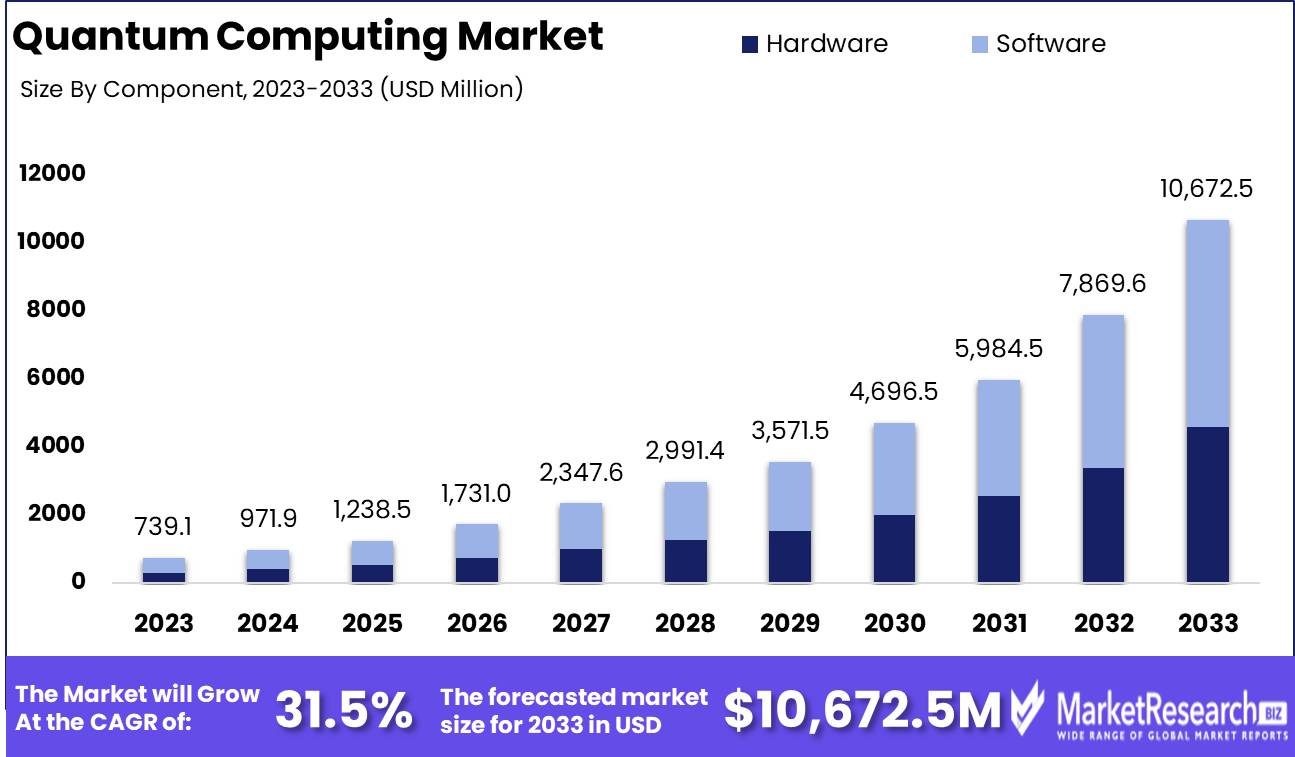
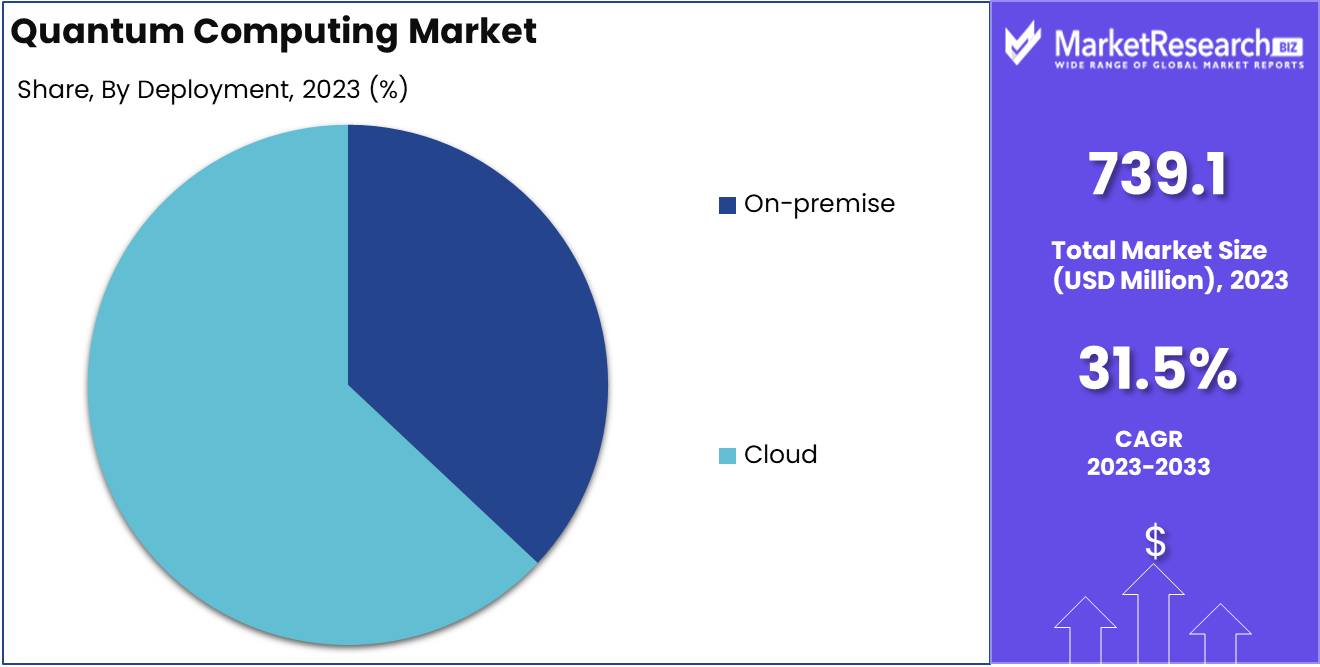
Quantum Computing Market was valued at USD 739.1 Million in 2023. It is expected to reach USD 10,672.5 Million by 2033, with a CAGR of 31.5% during the forecast period from 2024 to 2033.
The Quantum Computing Market represents a rapidly evolving sector focused on leveraging quantum mechanics to solve complex computational problems at unprecedented speeds. Unlike classical computing, which relies on binary data, quantum computing uses qubits to perform simultaneous calculations, potentially transforming industries such as cryptography, pharmaceuticals, and financial modeling. This market is driven by advancements in quantum algorithms, hardware development, and increasing investments from both private and public sectors. As organizations seek to gain competitive advantages through enhanced processing capabilities, the quantum computing market is poised for significant growth, fundamentally altering the landscape of technology and innovation.
The quantum computing market is poised at a critical inflection point, with significant advancements signaling the onset of tangible economic impacts across key industries. According to McKinsey's 2023 Quantum Technology Monitor, the automotive, chemicals, financial services, and life sciences sectors are expected to be the first to realize substantial gains from quantum computing, potentially unlocking up to $1.3 trillion in value by 2035. This projection underscores the strategic imperative for industry leaders to invest in quantum technologies to secure early-mover advantages. Notably, investor confidence is robust, as evidenced by the $2.35 billion invested in quantum technology start-ups in 2022 alone. This influx of capital highlights the market’s recognition of quantum computing transformative potential.
Recent developments further affirm the accelerated pace of innovation within this space. For instance, PsiQuantum's opening of an advanced R&D facility in the UK, backed by £9 million from the UK government, demonstrates the increasing global commitment to advancing quantum research and infrastructure. Concurrently, the quest for quantum supremacy continues to drive hardware innovation, with major players like Google, IBM, and Rigetti Computing achieving significant milestones. IBM’s introduction of the Quantum Hummingbird processor, featuring a higher qubit count, exemplifies the ongoing enhancements in quantum hardware, which are critical to achieving broader commercial viability. As these advancements converge, the quantum computing market is on the cusp of transitioning from experimental to practical applications, heralding a new era of technological disruption and value creation across multiple sectors.
Key Takeaways
- Market Growth: The Quantum Computing Market is projected to grow from USD 739.1 million in 2023 to USD 10,672.5 million by 2033, at a CAGR of 31.5%.
- Analyst Viewpoint: Quantum computing is at a pivotal stage, expected to generate up to $1.3 trillion in value by 2035, with significant early benefits in automotive, chemicals, financial services, and life sciences sectors.
- By Component Analysis: The software segment leads the quantum computing market, capturing 58.7% of the market share in 2023.
- By Deployment Analysis: Cloud deployment dominates the quantum computing market, holding a 63% share in 2023.
- By Application: Machine learning is the leading application of quantum computing, accounting for 42% of the market in 2023.
- By End-user: Healthcare is the top end-user in the quantum computing market, with a 28.2% share in 2023.
- Regional Dominance: North America is the leading region in the quantum computing market, representing 31.3% of the global market share.
- Driving Factor: Quantum cloud services are making quantum computing more accessible, driving market growth.
- Restraining Factor: Technical complexity and scalability issues are key obstacles to quantum computing adoption.
Driving factors
Emergence of Quantum Cloud Services
Increasing Demand Across Industries Fuels Quantum Computing Market Growth
The Quantum Computing Market is experiencing significant growth driven by the increasing demand across various industries, including healthcare, finance, automotive, and logistics. The healthcare industry, for example, is leveraging quantum computing to accelerate drug discovery processes and optimize treatment protocols, potentially reducing costs and improving patient outcomes. In the finance sector, quantum algorithms are being developed to enhance risk analysis and portfolio optimization, contributing to the market's expansion.Additionally, the automotive industry is exploring quantum computing for optimizing supply chain logistics and developing autonomous vehicle technologies, further driving market growth. This cross-industry demand is creating a robust foundation for the expansion of quantum computing applications, making it a key factor in the market's overall growth trajectory.
Emergence of Quantum Cloud Services Boosts Accessibility and Adoption
The emergence of quantum cloud services is another pivotal driving factor contributing to the growth of the Quantum Computing Market. These services enable businesses and research institutions to access quantum computing resources without the need for significant capital investment in hardware. Major players like IBM, Google, and Microsoft have introduced quantum cloud platforms, allowing users to experiment with quantum algorithms and develop applications across various sectors. This accessibility has led to a surge in quantum computing adoption, particularly in regions with strong IT infrastructure.
Moreover, government initiatives in countries like the United States and China, where significant funding is being allocated to quantum technology research, are further supporting the growth of quantum cloud services. These initiatives, combined with private sector investments, are creating a conducive environment for the widespread adoption of quantum computing, making it a critical factor in the market's expansion.
Restraining Factors
Technical Complexity and Scalability Limitations: A Barrier to Quantum Computing Adoption
The technical complexity and scalability limitations inherent in quantum computing serve as significant restraining factors for the market's growth. Quantum computers rely on qubits, which are highly sensitive to external disturbances, necessitating extremely precise control and error correction. This complexity not only limits the scalability of quantum systems but also increases the cost and time required for research and development (R&D).
A 2023 survey from the National Institute of Standards and Technology (NIST) highlights that only 12% of organizations exploring quantum computing have successfully scaled their quantum projects beyond experimental stages. This low scalability rate is a key barrier, impeding broader adoption across industries such as finance, healthcare, and logistics, which require scalable solutions to justify significant investments. Furthermore, this complexity demands highly specialized skills, contributing to a shortage of qualified professionals, which in turn slows market expansion. Despite the promising potential of quantum computing, these technical challenges continue to restrain the market by limiting the pace of commercialization.
High Resource Requirements: Elevated Costs and Infrastructure Demands
Quantum computing high resource requirements, particularly in terms of energy consumption, infrastructure, and specialized talent, are major restraining factors that limit its market growth. For instance, maintaining quantum computers at near absolute zero temperatures to prevent qubit decoherence demands highly advanced and expensive cooling systems. The energy costs alone can be prohibitive, with estimates suggesting that a fully operational quantum computer may require up to 10,000 times more energy than a conventional supercomputer, depending on the application.
In addition, significant investments in infrastructure are needed to house quantum systems. Data from the Quantum Computing Report (2023) indicates that setting up a basic quantum computing lab can cost upwards of $10 million, with operational costs adding an additional 20-30% annually. This level of financial commitment is often beyond the reach of smaller enterprises and even some larger organizations, leading to slower adoption rates across industries like automotive, aerospace, and pharmaceuticals.
Moreover, the private sector's cautious investment approach reflects these high costs. While government initiatives in countries like the U.S. and China have led to substantial public funding for quantum research, private investments remain comparatively conservative. In 2022, global private investments in quantum computing totaled approximately $2 billion, a fraction of the over $300 billion invested in artificial intelligence during the same period. This disparity highlights the perceived risks associated with the high resource demands of quantum computing, further restraining the market’s growth potential.
By Component Analysis
Software Segment Dominates with 58.7% Market Share in 2023
In 2023, the Software segment held a dominant position in the "By Component" segment of the Quantum Computing Market, capturing more than 58.7% of the market share. This significant share underscores the critical role software plays in the advancement and commercialization of quantum computing technologies. As quantum computing continues to evolve, software solutions are increasingly crucial for algorithm development, quantum simulation, and overall system optimization. The high demand for quantum software is driven by its applicability across various industries, such as pharmaceuticals, finance, and cryptography, where quantum algorithms are being developed to solve complex problems that classical computers cannot efficiently address.
Conversely, the Hardware segment, while also vital to the quantum computing ecosystem, accounted for a smaller portion of the market. Hardware development in quantum computing is inherently challenging due to the complexities involved in creating stable qubits and maintaining quantum coherence. Despite these challenges, the Hardware segment remains essential as advancements in quantum processors, error correction, and qubit technology are fundamental to the realization of fully functional quantum computers.
The Hardware segment is expected to witness steady growth as research progresses and more robust and scalable quantum systems are developed. However, in the current market landscape, software remains the driving force behind the practical application and adoption of quantum computing technologies, positioning it as the leading component within the industry.
By Deployment Analysis
Cloud Dominates the Quantum Computing Market by Deployment with a 63% Share in 2023
In 2023, the Quantum Computing Market saw significant segmentation in deployment methods, highlighting the prominence of cloud-based solutions. Notably, Cloud held a dominant market position in the "By Deployment" segment, capturing more than a 63% share. This substantial portion underscores the increasing reliance on cloud platforms for quantum computing operations, driven by their scalability, ease of access, and reduced overhead costs compared to traditional on-premise setups.
On the other hand, On-premise solutions, while still relevant, have observed a more limited adoption. The data suggests a gradual shift in preference towards cloud solutions, as organizations aim to leverage the advanced computational capabilities of quantum computing without the need for extensive physical infrastructure. This trend is indicative of a broader movement within the technology sector towards cloud-based services, offering a glimpse into the evolving dynamics of quantum computing deployment.
By Application
Machine Learning Dominates Quantum Computing Market in 2023 with 42% Share In 2023, Machine Learning held a dominant market position in the Quantum Computing Market by Application segment, capturing more than a 42% share. This leadership can be attributed to the growing demand for advanced data processing and predictive analytics across various industries, which quantum computing significantly enhances. The ability of quantum computing to process vast datasets and improve machine learning algorithms has accelerated adoption in this segment, making it the primary driver of market growth.
Optimization emerged as the second most significant application area, accounting for approximately 25% of the market share. Industries such as logistics, energy, and manufacturing increasingly rely on quantum optimization techniques to solve complex problems more efficiently than classical computing allows. The focus on reducing operational costs and improving efficiency has driven substantial investments in this area.
Biomedical Simulations followed, with around 15% of the market share, driven by the need for more accurate and faster simulations in drug discovery and personalized medicine. Quantum computing potential to simulate molecular interactions at a quantum level offers unprecedented precision, making it a vital tool in biomedical research.
Financial Services accounted for approximately 10% of the market, as the sector continues to explore quantum computing for risk analysis, fraud detection, and portfolio optimization. The financial industry's pursuit of faster, more accurate computational methods for managing complex financial models has spurred growth in this segment.
Electronic Material Discovery captured about 5% of the market share, driven by the need for advanced materials in electronics and semiconductors. Quantum computing enables the discovery of new materials with unique properties, enhancing the development of next-generation electronic devices.The remaining
Others category, which includes niche applications such as quantum cryptography and weather forecasting, represented the final 3% of the market. While these applications are still in the exploratory stage, their future potential could contribute significantly to the market as the technology matures.
By End-user
Healthcare Dominates the Quantum Computing Market with a 28.2% Share in 2023 In 2023, Healthcare held a dominant market position in the "By End-user" segment of the Quantum Computing Market, capturing more than a 28.2% share. This significant market presence is largely attributable to the sector's increasing reliance on quantum computing for advancements in drug discovery, personalized medicine, and complex data analysis. The ability of quantum computing to process and analyze vast datasets at unprecedented speeds has proven invaluable in addressing some of the most challenging problems in healthcare, such as genomic sequencing and the development of new treatment protocols.
Following Healthcare, the Banking, Financial Services, and Insurance (BFSI) sector emerged as a key player in the market, accounting for a substantial share. Quantum computing potential to revolutionize cryptography, optimize trading algorithms, and enhance risk management has driven its adoption within this industry. As financial institutions seek to secure sensitive data and optimize operations, this is becoming increasingly integral to their technological strategies.
The Automotive sector also demonstrated significant engagement with quantum computing, driven by the need for advanced simulation and optimization capabilities in areas such as autonomous vehicle development, battery research, and supply chain management. As the industry moves towards electric and self-driving vehicles, quantum computing offers critical support in solving complex optimization problems that traditional computing methods struggle to address.
Energy and Utilities is another key end-user segment leveraging quantum computing, particularly in areas like energy distribution, resource optimization, and the development of new materials for energy storage. The sector's push towards renewable energy sources and the optimization of existing infrastructure aligns well with the capabilities of quantum computing, enabling more efficient and sustainable energy solutions.
The Chemical industry has increasingly adopted quantum computing to accelerate research in molecular modeling and the development of new materials. The ability to simulate chemical reactions with high accuracy allows for more efficient experimentation and innovation, particularly in the development of pharmaceuticals, agrochemicals, and new materials.
Manufacturing is also tapping into quantum computing to enhance various aspects of production, from process optimization to the design of new products. By utilizing quantum algorithms, manufacturers can solve complex problems related to supply chain logistics, product design, and material science, leading to more efficient production cycles and innovative product offerings.
The Transportation and Logistics sector has begun to explore quantum computing as a means to optimize routing, scheduling, and supply chain management. As the demand for faster and more efficient logistics grows, quantum computing Industry offers a powerful tool to address these challenges, particularly in global logistics networks.
Finally, the "Others" category, which includes sectors such as retail, telecommunications, and government, is gradually recognizing the potential of quantum computing. Although these industries currently represent a smaller share of the market, their adoption of quantum technologies is expected to grow as they seek to leverage its advantages in areas such as data analysis, customer experience enhancement, and cybersecurity.
Key Market Segments
By Component
- Hardware
- Software
By Deployment
- On-premise
- Cloud
By Application
- Machine Learning
- Optimization
- Biomedical Simulations
- Financial Services
- Electronic Material Discovery
- Others
By End-user
- Healthcare
- BFSI
- Automotive
- Energy and Utilities
- Chemical
- Manufacturing
- Transportation and Logistics
- Others
Growth Opportunity
Expanding Technological Advancements
The global quantum computing market is poised for significant growth in 2024, driven by rapid technological advancements. Key innovations in quantum processors and quantum error correction are accelerating the development of more powerful and reliable quantum systems. This technological progress is expected to reduce the entry barriers for various industries, allowing more sectors to explore the applications.
Industries such as pharmaceuticals, finance, and materials science stand to benefit immensely from quantum computing ability to solve complex problems at unprecedented speeds. As a result, companies investing in quantum research and development are likely to gain a competitive edge in their respective markets.
Latest Trends
Growing Demand for Cybersecurity Solutions
The rising threat of cyberattacks is another critical factor driving growth in the quantum computing market. As traditional encryption methods become increasingly vulnerable to sophisticated hacking techniques, The market offers a promising solution. Quantum cryptography, specifically Quantum Key Distribution (QKD), is emerging as a game-changer in securing sensitive data against quantum-level threats.
Governments and enterprises worldwide are expected to increase investments in quantum-based cybersecurity solutions to protect critical infrastructure and confidential information. This surge in demand for robust cybersecurity measures is anticipated to be a significant growth driver for the market in 2024.
Advancements in Quantum Hardware and Software
The year 2024 is poised to be transformative for quantum computing, marked by significant advancements in both hardware and software. On the hardware front, the focus is shifting from merely increasing qubit count to improving qubit quality and coherence time, which are critical for achieving quantum supremacy. Innovations in error correction and noise reduction are expected to enhance the reliability and scalability of quantum systems.
Meanwhile, quantum software is becoming increasingly sophisticated, with improved algorithms and development environments that are more user-friendly. This evolution is lowering the barrier to entry for businesses, enabling more companies to explore quantum solutions. The convergence of these hardware and software advancements is anticipated to accelerate the deployment of quantum computing in real-world applications, bringing the technology closer to mainstream adoption.
Regional Analysis
North America
North America leads the global quantum computing market, accounting for 31.3% of the market largest share. This dominance is driven primarily by the United States, which is a hub for technological innovation and home to major companies and research institutions. The U.S. government and private sector investments, such as the National Quantum Initiative Act and funding from tech giants like IBM and Google, have accelerated the development and commercialization of quantum technologies. Canada also contributes significantly, with strong research programs and public-private partnerships in quantum computing. The region's advanced infrastructure and strong intellectual property laws further enhance its leadership position.Europe
Europe represents a significant portion of the quantum computing market, characterized by robust R&D initiatives and a supportive regulatory environment. Germany, France, and the UK are at the forefront, with substantial investments in national quantum strategies. Germany, in particular, has allocated significant funding to quantum research, positioning itself as a key player in the European quantum landscape. The UK, through its National Quantum Technologies Programme, and France, with its Quantum Plan, are also making substantial strides. Countries like Spain, the Netherlands, and Italy are fostering innovation through academic collaborations and government support. However, Europe faces challenges in matching North America’s pace due to fragmented efforts across the continent.Asia-Pacific
The Asia-Pacific region is experiencing rapid growth in the quantum computing market, driven by significant investments and strategic initiatives in countries like China, Japan, and South Korea. China, with its ambitious national strategies and substantial state funding, is emerging as a formidable competitor to North America, focusing on quantum supremacy and encryption technologies. Japan is advancing quantum research through government-industry collaborations, while South Korea is prioritizing quantum computing in its ICT strategies.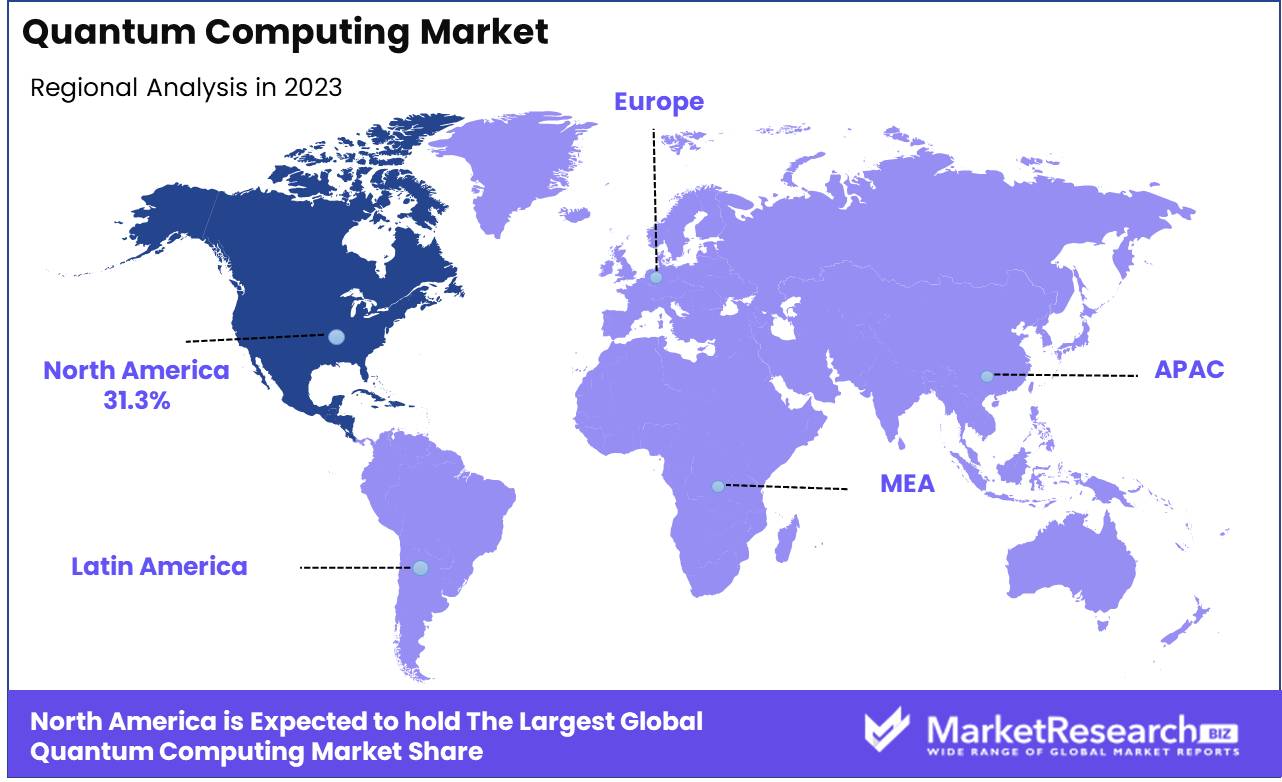
Key Regions and Countries
North America
- The US
- Canada
- Rest of North America
Europe
- Germany
- France
- The UK
- Spain
- Netherlands
- Russia
- Italy
- Rest of Europe
Asia-Pacific
- China
- Japan
- Singapore
- Thailand
- South Korea
- Vietnam
- India
- New Zealand
- Rest of Asia Pacific
Latin America
- Mexico
- Brazil
- Rest of Latin America
Middle East & Africa
- Saudi Arabia
- South Africa
- UAE
- Rest of Middle East & Africa
Key Players Analysis
As the global quantum computing market evolves rapidly in 2024, a few key players continue to shape the landscape, each bringing unique strengths and strategic initiatives to the table.
IBM Corporation stands out with its long-term commitment to quantum research, leveraging the IBM Quantum Network to foster an ecosystem of partners and clients exploring real-world applications. IBM's open-source quantum development platform, Qiskit, has solidified its role as a leader in quantum software.
Google Quantum AI has made significant strides, particularly with its quantum supremacy claim, which set a benchmark for computational power. The company’s focus on error correction and scalable quantum architectures positions it as a formidable competitor in the race towards practical quantum computing.
Microsoft Corporation differentiates itself with a full-stack approach, emphasizing its Azure Quantum service that integrates quantum computing with classical cloud infrastructure. This hybrid strategy enhances accessibility and practical application development, catering to a broad range of industries.
Amazon Web Services (AWS) continues to build on its cloud dominance, with Amazon Braket offering a diverse selection of quantum hardware and simulators, making quantum technology accessible to a wider audience of developers and researchers.
Market Key Players
- IBM Corporation
- Google Quantum AI
- Microsoft Corporation
- Amazon Web Services, Inc
- Atos Quantum
- D-Wave Quantum Inc.
- Intel
- Hitachi
- QC Ware
- Zapata Computing
- Toshiba Corporation
- Other Key Players
Recent Developments
- D-Wave Systems: In February 2024, D-Wave launched its latest 1,200+ qubit Advantage prototype, making it accessible through its Leap real-time quantum cloud service. This initiative provides users with immediate access to the cutting-edge hardware and includes complimentary usage for new subscribers.
- Rigetti Computing: In November 2023, Rigetti secured Phase 2 funding from DARPA, with a potential value of up to USD 1.5 million. This funding is intended to support the development of benchmarks for assessing the performance of large-scale quantum computers in practical, real-world scenarios.
- Google: In May 2023, Google committed USD 50 million towards quantum computing research and development, in collaboration with the University of Chicago and the University of Tokyo. This investment is part of Google’s broader strategy to advance quantum technologies and drive innovation in the field.
Report Scope
Report Features Description Market Value (2023) USD 739.1 Mn Forecast Revenue (2033) USD 10,672.5 Mn CAGR (2024-2032) 31.5% Base Year for Estimation 2023 Historic Period 2016-2023 Forecast Period 2024-2033 Report Coverage Revenue Forecast, Market Dynamics, COVID-19 Impact, Competitive Landscape, Recent Developments Segments Covered By Component Analysis(Hardware, Software), By Deployment(On-premise, Cloud), By Application(Machine Learning, Optimization, Biomedical Simulations, Financial Services, Electronic Material Discovery, Others ) By End-user(Healthcare, BFSI, Automotive, Energy and Utilities, Chemical, Manufacturing, Transportation and Logistics, Others ) Regional Analysis North America - The US, Canada, Rest of North America, Europe - Germany, France, The UK, Spain, Italy, Russia, Netherlands, Rest of Europe, Asia-Pacific - China, Japan, South Korea, India, New Zealand, Singapore, Thailand, Vietnam, Rest of Asia Pacific, Latin America - Brazil, Mexico, Rest of Latin America, Middle East & Africa - South Africa, Saudi Arabia, UAE, Rest of Middle East & Africa Competitive Landscape Oracle, IBM Corporation, Nuance Communications, Inc., LivePerson, AlphaChat, Chatfuel, Botsify, Amazon.com, Inc., Verint Systems, Inc., Inbenta Holdings Inc., Baidu Inc., NVIDIA Corporation Customization Scope Customization for segments, region/country-level will be provided. Moreover, additional customization can be done based on the requirements. Purchase Options We have three licenses to opt for Single User License, Multi-User License (Up to 5 Users), Corporate Use License (Unlimited User and Printable PDF) -
- 1. Executive Summary
- 1.1. Definition
- 1.2. Taxonomy
- 1.3. Research Scope
- 1.4. Key Analysis
- 1.5. Key Findings by Major Segments
- 1.6. Top strategies by Major Players
- 2. Global Quantum Computing Market Overview
- 2.1. Quantum Computing Market Dynamics
- 2.1.1. Drivers
- 2.1.2. Opportunities
- 2.1.3. Restraints
- 2.1.4. Challenges
- 2.2. Macro-economic Factors
- 2.3. Regulatory Framework
- 2.4. Market Investment Feasibility Index
- 2.5. PEST Analysis
- 2.6. PORTER’S Five Force Analysis
- 2.7. Drivers & Restraints Impact Analysis
- 2.8. Industry Chain Analysis
- 2.9. Cost Structure Analysis
- 2.10. Marketing Strategy
- 2.11. Russia-Ukraine War Impact Analysis
- 2.12. Opportunity Map Analysis
- 2.13. Market Competition Scenario Analysis
- 2.14. Product Life Cycle Analysis
- 2.15. Opportunity Orbits
- 2.16. Manufacturer Intensity Map
- 2.17. Major Companies sales by Value & Volume
- 2.1. Quantum Computing Market Dynamics
- 3. Global Quantum Computing Market Analysis, Opportunity and Forecast, 2016-2032
- 3.1. Global Quantum Computing Market Analysis, 2016-2021
- 3.2. Global Quantum Computing Market Opportunity and Forecast, 2023-2032
- 3.3. Global Quantum Computing Market Analysis, Opportunity and Forecast, By By Component, 2016-2032
- 3.3.1. Global Quantum Computing Market Analysis by By Component: Introduction
- 3.3.2. Market Size Absolute $ Opportunity Analysis and Forecast, By By Component, 2016-2032
- 3.3.3. Hardware
- 3.3.4. Software
- 3.4. Global Quantum Computing Market Analysis, Opportunity and Forecast, By By Deployment, 2016-2032
- 3.4.1. Global Quantum Computing Market Analysis by By Deployment: Introduction
- 3.4.2. Market Size Absolute $ Opportunity Analysis and Forecast, By By Deployment, 2016-2032
- 3.4.3. On-premise
- 3.4.4. Cloud
- 3.5. Global Quantum Computing Market Analysis, Opportunity and Forecast, By By Application, 2016-2032
- 3.5.1. Global Quantum Computing Market Analysis by By Application: Introduction
- 3.5.2. Market Size Absolute $ Opportunity Analysis and Forecast, By By Application, 2016-2032
- 3.5.3. Machine Learning
- 3.5.4. Optimization
- 3.5.5. Biomedical Simulations
- 3.5.6. Financial Services
- 3.5.7. Electronic Material Discovery
- 3.5.8. Others
- 3.6. Global Quantum Computing Market Analysis, Opportunity and Forecast, By By End-user, 2016-2032
- 3.6.1. Global Quantum Computing Market Analysis by By End-user: Introduction
- 3.6.2. Market Size Absolute $ Opportunity Analysis and Forecast, By By End-user, 2016-2032
- 3.6.3. Healthcare
- 3.6.4. BFSI
- 3.6.5. Automotive
- 3.6.6. Energy and Utilities
- 3.6.7. Chemical
- 3.6.8. Manufacturing
- 3.6.9. Transportation and Logistics
- 3.6.10. Others
- 4. North America Quantum Computing Market Analysis, Opportunity and Forecast, 2016-2032
- 4.1. North America Quantum Computing Market Analysis, 2016-2021
- 4.2. North America Quantum Computing Market Opportunity and Forecast, 2023-2032
- 4.3. North America Quantum Computing Market Analysis, Opportunity and Forecast, By By Component, 2016-2032
- 4.3.1. North America Quantum Computing Market Analysis by By Component: Introduction
- 4.3.2. Market Size Absolute $ Opportunity Analysis and Forecast, By By Component, 2016-2032
- 4.3.3. Hardware
- 4.3.4. Software
- 4.4. North America Quantum Computing Market Analysis, Opportunity and Forecast, By By Deployment, 2016-2032
- 4.4.1. North America Quantum Computing Market Analysis by By Deployment: Introduction
- 4.4.2. Market Size Absolute $ Opportunity Analysis and Forecast, By By Deployment, 2016-2032
- 4.4.3. On-premise
- 4.4.4. Cloud
- 4.5. North America Quantum Computing Market Analysis, Opportunity and Forecast, By By Application, 2016-2032
- 4.5.1. North America Quantum Computing Market Analysis by By Application: Introduction
- 4.5.2. Market Size Absolute $ Opportunity Analysis and Forecast, By By Application, 2016-2032
- 4.5.3. Machine Learning
- 4.5.4. Optimization
- 4.5.5. Biomedical Simulations
- 4.5.6. Financial Services
- 4.5.7. Electronic Material Discovery
- 4.5.8. Others
- 4.6. North America Quantum Computing Market Analysis, Opportunity and Forecast, By By End-user, 2016-2032
- 4.6.1. North America Quantum Computing Market Analysis by By End-user: Introduction
- 4.6.2. Market Size Absolute $ Opportunity Analysis and Forecast, By By End-user, 2016-2032
- 4.6.3. Healthcare
- 4.6.4. BFSI
- 4.6.5. Automotive
- 4.6.6. Energy and Utilities
- 4.6.7. Chemical
- 4.6.8. Manufacturing
- 4.6.9. Transportation and Logistics
- 4.6.10. Others
- 4.7. North America Quantum Computing Market Analysis, Opportunity and Forecast, By Country , 2016-2032
- 4.7.1. North America Quantum Computing Market Analysis by Country : Introduction
- 4.7.2. Market Size Absolute $ Opportunity Analysis and Forecast, Country , 2016-2032
- 4.7.2.1. The US
- 4.7.2.2. Canada
- 4.7.2.3. Mexico
- 5. Western Europe Quantum Computing Market Analysis, Opportunity and Forecast, 2016-2032
- 5.1. Western Europe Quantum Computing Market Analysis, 2016-2021
- 5.2. Western Europe Quantum Computing Market Opportunity and Forecast, 2023-2032
- 5.3. Western Europe Quantum Computing Market Analysis, Opportunity and Forecast, By By Component, 2016-2032
- 5.3.1. Western Europe Quantum Computing Market Analysis by By Component: Introduction
- 5.3.2. Market Size Absolute $ Opportunity Analysis and Forecast, By By Component, 2016-2032
- 5.3.3. Hardware
- 5.3.4. Software
- 5.4. Western Europe Quantum Computing Market Analysis, Opportunity and Forecast, By By Deployment, 2016-2032
- 5.4.1. Western Europe Quantum Computing Market Analysis by By Deployment: Introduction
- 5.4.2. Market Size Absolute $ Opportunity Analysis and Forecast, By By Deployment, 2016-2032
- 5.4.3. On-premise
- 5.4.4. Cloud
- 5.5. Western Europe Quantum Computing Market Analysis, Opportunity and Forecast, By By Application, 2016-2032
- 5.5.1. Western Europe Quantum Computing Market Analysis by By Application: Introduction
- 5.5.2. Market Size Absolute $ Opportunity Analysis and Forecast, By By Application, 2016-2032
- 5.5.3. Machine Learning
- 5.5.4. Optimization
- 5.5.5. Biomedical Simulations
- 5.5.6. Financial Services
- 5.5.7. Electronic Material Discovery
- 5.5.8. Others
- 5.6. Western Europe Quantum Computing Market Analysis, Opportunity and Forecast, By By End-user, 2016-2032
- 5.6.1. Western Europe Quantum Computing Market Analysis by By End-user: Introduction
- 5.6.2. Market Size Absolute $ Opportunity Analysis and Forecast, By By End-user, 2016-2032
- 5.6.3. Healthcare
- 5.6.4. BFSI
- 5.6.5. Automotive
- 5.6.6. Energy and Utilities
- 5.6.7. Chemical
- 5.6.8. Manufacturing
- 5.6.9. Transportation and Logistics
- 5.6.10. Others
- 5.7. Western Europe Quantum Computing Market Analysis, Opportunity and Forecast, By Country , 2016-2032
- 5.7.1. Western Europe Quantum Computing Market Analysis by Country : Introduction
- 5.7.2. Market Size Absolute $ Opportunity Analysis and Forecast, Country , 2016-2032
- 5.7.2.1. Germany
- 5.7.2.2. France
- 5.7.2.3. The UK
- 5.7.2.4. Spain
- 5.7.2.5. Italy
- 5.7.2.6. Portugal
- 5.7.2.7. Ireland
- 5.7.2.8. Austria
- 5.7.2.9. Switzerland
- 5.7.2.10. Benelux
- 5.7.2.11. Nordic
- 5.7.2.12. Rest of Western Europe
- 6. Eastern Europe Quantum Computing Market Analysis, Opportunity and Forecast, 2016-2032
- 6.1. Eastern Europe Quantum Computing Market Analysis, 2016-2021
- 6.2. Eastern Europe Quantum Computing Market Opportunity and Forecast, 2023-2032
- 6.3. Eastern Europe Quantum Computing Market Analysis, Opportunity and Forecast, By By Component, 2016-2032
- 6.3.1. Eastern Europe Quantum Computing Market Analysis by By Component: Introduction
- 6.3.2. Market Size Absolute $ Opportunity Analysis and Forecast, By By Component, 2016-2032
- 6.3.3. Hardware
- 6.3.4. Software
- 6.4. Eastern Europe Quantum Computing Market Analysis, Opportunity and Forecast, By By Deployment, 2016-2032
- 6.4.1. Eastern Europe Quantum Computing Market Analysis by By Deployment: Introduction
- 6.4.2. Market Size Absolute $ Opportunity Analysis and Forecast, By By Deployment, 2016-2032
- 6.4.3. On-premise
- 6.4.4. Cloud
- 6.5. Eastern Europe Quantum Computing Market Analysis, Opportunity and Forecast, By By Application, 2016-2032
- 6.5.1. Eastern Europe Quantum Computing Market Analysis by By Application: Introduction
- 6.5.2. Market Size Absolute $ Opportunity Analysis and Forecast, By By Application, 2016-2032
- 6.5.3. Machine Learning
- 6.5.4. Optimization
- 6.5.5. Biomedical Simulations
- 6.5.6. Financial Services
- 6.5.7. Electronic Material Discovery
- 6.5.8. Others
- 6.6. Eastern Europe Quantum Computing Market Analysis, Opportunity and Forecast, By By End-user, 2016-2032
- 6.6.1. Eastern Europe Quantum Computing Market Analysis by By End-user: Introduction
- 6.6.2. Market Size Absolute $ Opportunity Analysis and Forecast, By By End-user, 2016-2032
- 6.6.3. Healthcare
- 6.6.4. BFSI
- 6.6.5. Automotive
- 6.6.6. Energy and Utilities
- 6.6.7. Chemical
- 6.6.8. Manufacturing
- 6.6.9. Transportation and Logistics
- 6.6.10. Others
- 6.7. Eastern Europe Quantum Computing Market Analysis, Opportunity and Forecast, By Country , 2016-2032
- 6.7.1. Eastern Europe Quantum Computing Market Analysis by Country : Introduction
- 6.7.2. Market Size Absolute $ Opportunity Analysis and Forecast, Country , 2016-2032
- 6.7.2.1. Russia
- 6.7.2.2. Poland
- 6.7.2.3. The Czech Republic
- 6.7.2.4. Greece
- 6.7.2.5. Rest of Eastern Europe
- 7. APAC Quantum Computing Market Analysis, Opportunity and Forecast, 2016-2032
- 7.1. APAC Quantum Computing Market Analysis, 2016-2021
- 7.2. APAC Quantum Computing Market Opportunity and Forecast, 2023-2032
- 7.3. APAC Quantum Computing Market Analysis, Opportunity and Forecast, By By Component, 2016-2032
- 7.3.1. APAC Quantum Computing Market Analysis by By Component: Introduction
- 7.3.2. Market Size Absolute $ Opportunity Analysis and Forecast, By By Component, 2016-2032
- 7.3.3. Hardware
- 7.3.4. Software
- 7.4. APAC Quantum Computing Market Analysis, Opportunity and Forecast, By By Deployment, 2016-2032
- 7.4.1. APAC Quantum Computing Market Analysis by By Deployment: Introduction
- 7.4.2. Market Size Absolute $ Opportunity Analysis and Forecast, By By Deployment, 2016-2032
- 7.4.3. On-premise
- 7.4.4. Cloud
- 7.5. APAC Quantum Computing Market Analysis, Opportunity and Forecast, By By Application, 2016-2032
- 7.5.1. APAC Quantum Computing Market Analysis by By Application: Introduction
- 7.5.2. Market Size Absolute $ Opportunity Analysis and Forecast, By By Application, 2016-2032
- 7.5.3. Machine Learning
- 7.5.4. Optimization
- 7.5.5. Biomedical Simulations
- 7.5.6. Financial Services
- 7.5.7. Electronic Material Discovery
- 7.5.8. Others
- 7.6. APAC Quantum Computing Market Analysis, Opportunity and Forecast, By By End-user, 2016-2032
- 7.6.1. APAC Quantum Computing Market Analysis by By End-user: Introduction
- 7.6.2. Market Size Absolute $ Opportunity Analysis and Forecast, By By End-user, 2016-2032
- 7.6.3. Healthcare
- 7.6.4. BFSI
- 7.6.5. Automotive
- 7.6.6. Energy and Utilities
- 7.6.7. Chemical
- 7.6.8. Manufacturing
- 7.6.9. Transportation and Logistics
- 7.6.10. Others
- 7.7. APAC Quantum Computing Market Analysis, Opportunity and Forecast, By Country , 2016-2032
- 7.7.1. APAC Quantum Computing Market Analysis by Country : Introduction
- 7.7.2. Market Size Absolute $ Opportunity Analysis and Forecast, Country , 2016-2032
- 7.7.2.1. China
- 7.7.2.2. Japan
- 7.7.2.3. South Korea
- 7.7.2.4. India
- 7.7.2.5. Australia & New Zeland
- 7.7.2.6. Indonesia
- 7.7.2.7. Malaysia
- 7.7.2.8. Philippines
- 7.7.2.9. Singapore
- 7.7.2.10. Thailand
- 7.7.2.11. Vietnam
- 7.7.2.12. Rest of APAC
- 8. Latin America Quantum Computing Market Analysis, Opportunity and Forecast, 2016-2032
- 8.1. Latin America Quantum Computing Market Analysis, 2016-2021
- 8.2. Latin America Quantum Computing Market Opportunity and Forecast, 2023-2032
- 8.3. Latin America Quantum Computing Market Analysis, Opportunity and Forecast, By By Component, 2016-2032
- 8.3.1. Latin America Quantum Computing Market Analysis by By Component: Introduction
- 8.3.2. Market Size Absolute $ Opportunity Analysis and Forecast, By By Component, 2016-2032
- 8.3.3. Hardware
- 8.3.4. Software
- 8.4. Latin America Quantum Computing Market Analysis, Opportunity and Forecast, By By Deployment, 2016-2032
- 8.4.1. Latin America Quantum Computing Market Analysis by By Deployment: Introduction
- 8.4.2. Market Size Absolute $ Opportunity Analysis and Forecast, By By Deployment, 2016-2032
- 8.4.3. On-premise
- 8.4.4. Cloud
- 8.5. Latin America Quantum Computing Market Analysis, Opportunity and Forecast, By By Application, 2016-2032
- 8.5.1. Latin America Quantum Computing Market Analysis by By Application: Introduction
- 8.5.2. Market Size Absolute $ Opportunity Analysis and Forecast, By By Application, 2016-2032
- 8.5.3. Machine Learning
- 8.5.4. Optimization
- 8.5.5. Biomedical Simulations
- 8.5.6. Financial Services
- 8.5.7. Electronic Material Discovery
- 8.5.8. Others
- 8.6. Latin America Quantum Computing Market Analysis, Opportunity and Forecast, By By End-user, 2016-2032
- 8.6.1. Latin America Quantum Computing Market Analysis by By End-user: Introduction
- 8.6.2. Market Size Absolute $ Opportunity Analysis and Forecast, By By End-user, 2016-2032
- 8.6.3. Healthcare
- 8.6.4. BFSI
- 8.6.5. Automotive
- 8.6.6. Energy and Utilities
- 8.6.7. Chemical
- 8.6.8. Manufacturing
- 8.6.9. Transportation and Logistics
- 8.6.10. Others
- 8.7. Latin America Quantum Computing Market Analysis, Opportunity and Forecast, By Country , 2016-2032
- 8.7.1. Latin America Quantum Computing Market Analysis by Country : Introduction
- 8.7.2. Market Size Absolute $ Opportunity Analysis and Forecast, Country , 2016-2032
- 8.7.2.1. Brazil
- 8.7.2.2. Colombia
- 8.7.2.3. Chile
- 8.7.2.4. Argentina
- 8.7.2.5. Costa Rica
- 8.7.2.6. Rest of Latin America
- 9. Middle East & Africa Quantum Computing Market Analysis, Opportunity and Forecast, 2016-2032
- 9.1. Middle East & Africa Quantum Computing Market Analysis, 2016-2021
- 9.2. Middle East & Africa Quantum Computing Market Opportunity and Forecast, 2023-2032
- 9.3. Middle East & Africa Quantum Computing Market Analysis, Opportunity and Forecast, By By Component, 2016-2032
- 9.3.1. Middle East & Africa Quantum Computing Market Analysis by By Component: Introduction
- 9.3.2. Market Size Absolute $ Opportunity Analysis and Forecast, By By Component, 2016-2032
- 9.3.3. Hardware
- 9.3.4. Software
- 9.4. Middle East & Africa Quantum Computing Market Analysis, Opportunity and Forecast, By By Deployment, 2016-2032
- 9.4.1. Middle East & Africa Quantum Computing Market Analysis by By Deployment: Introduction
- 9.4.2. Market Size Absolute $ Opportunity Analysis and Forecast, By By Deployment, 2016-2032
- 9.4.3. On-premise
- 9.4.4. Cloud
- 9.5. Middle East & Africa Quantum Computing Market Analysis, Opportunity and Forecast, By By Application, 2016-2032
- 9.5.1. Middle East & Africa Quantum Computing Market Analysis by By Application: Introduction
- 9.5.2. Market Size Absolute $ Opportunity Analysis and Forecast, By By Application, 2016-2032
- 9.5.3. Machine Learning
- 9.5.4. Optimization
- 9.5.5. Biomedical Simulations
- 9.5.6. Financial Services
- 9.5.7. Electronic Material Discovery
- 9.5.8. Others
- 9.6. Middle East & Africa Quantum Computing Market Analysis, Opportunity and Forecast, By By End-user, 2016-2032
- 9.6.1. Middle East & Africa Quantum Computing Market Analysis by By End-user: Introduction
- 9.6.2. Market Size Absolute $ Opportunity Analysis and Forecast, By By End-user, 2016-2032
- 9.6.3. Healthcare
- 9.6.4. BFSI
- 9.6.5. Automotive
- 9.6.6. Energy and Utilities
- 9.6.7. Chemical
- 9.6.8. Manufacturing
- 9.6.9. Transportation and Logistics
- 9.6.10. Others
- 9.7. Middle East & Africa Quantum Computing Market Analysis, Opportunity and Forecast, By Country , 2016-2032
- 9.7.1. Middle East & Africa Quantum Computing Market Analysis by Country : Introduction
- 9.7.2. Market Size Absolute $ Opportunity Analysis and Forecast, Country , 2016-2032
- 9.7.2.1. Algeria
- 9.7.2.2. Egypt
- 9.7.2.3. Israel
- 9.7.2.4. Kuwait
- 9.7.2.5. Nigeria
- 9.7.2.6. Saudi Arabia
- 9.7.2.7. South Africa
- 9.7.2.8. Turkey
- 9.7.2.9. The UAE
- 9.7.2.10. Rest of MEA
- 10. Global Quantum Computing Market Analysis, Opportunity and Forecast, By Region , 2016-2032
- 10.1. Global Quantum Computing Market Analysis by Region : Introduction
- 10.2. Market Size Absolute $ Opportunity Analysis and Forecast, By Region , 2016-2032
- 10.2.1. North America
- 10.2.2. Western Europe
- 10.2.3. Eastern Europe
- 10.2.4. APAC
- 10.2.5. Latin America
- 10.2.6. Middle East & Africa
- 11. Global Quantum Computing Market Competitive Landscape, Market Share Analysis, and Company Profiles
- 11.1. Market Share Analysis
- 11.2. Company Profiles
- 11.3. IBM Corporation
- 11.3.1. Company Overview
- 11.3.2. Financial Highlights
- 11.3.3. Product Portfolio
- 11.3.4. SWOT Analysis
- 11.3.5. Key Strategies and Developments
- 11.4. Google Quantum AI
- 11.4.1. Company Overview
- 11.4.2. Financial Highlights
- 11.4.3. Product Portfolio
- 11.4.4. SWOT Analysis
- 11.4.5. Key Strategies and Developments
- 11.5. Microsoft Corporation
- 11.5.1. Company Overview
- 11.5.2. Financial Highlights
- 11.5.3. Product Portfolio
- 11.5.4. SWOT Analysis
- 11.5.5. Key Strategies and Developments
- 11.6. Amazon Web Services, Inc
- 11.6.1. Company Overview
- 11.6.2. Financial Highlights
- 11.6.3. Product Portfolio
- 11.6.4. SWOT Analysis
- 11.6.5. Key Strategies and Developments
- 11.7. Atos Quantum
- 11.7.1. Company Overview
- 11.7.2. Financial Highlights
- 11.7.3. Product Portfolio
- 11.7.4. SWOT Analysis
- 11.7.5. Key Strategies and Developments
- 11.8. D-Wave Quantum Inc.
- 11.8.1. Company Overview
- 11.8.2. Financial Highlights
- 11.8.3. Product Portfolio
- 11.8.4. SWOT Analysis
- 11.8.5. Key Strategies and Developments
- 11.9. Intel
- 11.9.1. Company Overview
- 11.9.2. Financial Highlights
- 11.9.3. Product Portfolio
- 11.9.4. SWOT Analysis
- 11.9.5. Key Strategies and Developments
- 11.10. Hitachi
- 11.10.1. Company Overview
- 11.10.2. Financial Highlights
- 11.10.3. Product Portfolio
- 11.10.4. SWOT Analysis
- 11.10.5. Key Strategies and Developments
- 11.11. QC Ware
- 11.11.1. Company Overview
- 11.11.2. Financial Highlights
- 11.11.3. Product Portfolio
- 11.11.4. SWOT Analysis
- 11.11.5. Key Strategies and Developments
- 11.12. Zapata Computing
- 11.12.1. Company Overview
- 11.12.2. Financial Highlights
- 11.12.3. Product Portfolio
- 11.12.4. SWOT Analysis
- 11.12.5. Key Strategies and Developments
- 11.13. Toshiba Corporation
- 11.13.1. Company Overview
- 11.13.2. Financial Highlights
- 11.13.3. Product Portfolio
- 11.13.4. SWOT Analysis
- 11.13.5. Key Strategies and Developments
- 11.14. Other Key Players
- 11.14.1. Company Overview
- 11.14.2. Financial Highlights
- 11.14.3. Product Portfolio
- 11.14.4. SWOT Analysis
- 11.14.5. Key Strategies and Developments
- 12. Assumptions and Acronyms
- 13. Research Methodology
- 14. Contact
List of Figures
-
- Figure 1: Global Quantum Computing Market Revenue (US$ Mn) Market Share by By Component in 2022
- Figure 2: Global Quantum Computing Market Market Attractiveness Analysis by By Component, 2016-2032
- Figure 3: Global Quantum Computing Market Revenue (US$ Mn) Market Share by By Deploymentin 2022
- Figure 4: Global Quantum Computing Market Market Attractiveness Analysis by By Deployment, 2016-2032
- Figure 5: Global Quantum Computing Market Revenue (US$ Mn) Market Share by By Applicationin 2022
- Figure 6: Global Quantum Computing Market Market Attractiveness Analysis by By Application, 2016-2032
- Figure 7: Global Quantum Computing Market Revenue (US$ Mn) Market Share by By End-userin 2022
- Figure 8: Global Quantum Computing Market Market Attractiveness Analysis by By End-user, 2016-2032
- Figure 9: Global Quantum Computing Market Revenue (US$ Mn) Market Share by Region in 2022
- Figure 10: Global Quantum Computing Market Market Attractiveness Analysis by Region, 2016-2032
- Figure 11: Global Quantum Computing Market Market Revenue (US$ Mn) (2016-2032)
- Figure 12: Global Quantum Computing Market Market Revenue (US$ Mn) Comparison by Region (2016-2032)
- Figure 13: Global Quantum Computing Market Market Revenue (US$ Mn) Comparison by By Component (2016-2032)
- Figure 14: Global Quantum Computing Market Market Revenue (US$ Mn) Comparison by By Deployment (2016-2032)
- Figure 15: Global Quantum Computing Market Market Revenue (US$ Mn) Comparison by By Application (2016-2032)
- Figure 16: Global Quantum Computing Market Market Revenue (US$ Mn) Comparison by By End-user (2016-2032)
- Figure 17: Global Quantum Computing Market Market Y-o-Y Growth Rate Comparison by Region (2016-2032)
- Figure 18: Global Quantum Computing Market Market Y-o-Y Growth Rate Comparison by By Component (2016-2032)
- Figure 19: Global Quantum Computing Market Market Y-o-Y Growth Rate Comparison by By Deployment (2016-2032)
- Figure 20: Global Quantum Computing Market Market Y-o-Y Growth Rate Comparison by By Application (2016-2032)
- Figure 21: Global Quantum Computing Market Market Y-o-Y Growth Rate Comparison by By End-user (2016-2032)
- Figure 22: Global Quantum Computing Market Market Share Comparison by Region (2016-2032)
- Figure 23: Global Quantum Computing Market Market Share Comparison by By Component (2016-2032)
- Figure 24: Global Quantum Computing Market Market Share Comparison by By Deployment (2016-2032)
- Figure 25: Global Quantum Computing Market Market Share Comparison by By Application (2016-2032)
- Figure 26: Global Quantum Computing Market Market Share Comparison by By End-user (2016-2032)
- Figure 27: North America Quantum Computing Market Revenue (US$ Mn) Market Share by By Componentin 2022
- Figure 28: North America Quantum Computing Market Market Attractiveness Analysis by By Component, 2016-2032
- Figure 29: North America Quantum Computing Market Revenue (US$ Mn) Market Share by By Deploymentin 2022
- Figure 30: North America Quantum Computing Market Market Attractiveness Analysis by By Deployment, 2016-2032
- Figure 31: North America Quantum Computing Market Revenue (US$ Mn) Market Share by By Applicationin 2022
- Figure 32: North America Quantum Computing Market Market Attractiveness Analysis by By Application, 2016-2032
- Figure 33: North America Quantum Computing Market Revenue (US$ Mn) Market Share by By End-userin 2022
- Figure 34: North America Quantum Computing Market Market Attractiveness Analysis by By End-user, 2016-2032
- Figure 35: North America Quantum Computing Market Revenue (US$ Mn) Market Share by Country in 2022
- Figure 36: North America Quantum Computing Market Market Attractiveness Analysis by Country, 2016-2032
- Figure 37: North America Quantum Computing Market Market Revenue (US$ Mn) (2016-2032)
- Figure 38: North America Quantum Computing Market Market Revenue (US$ Mn) Comparison by Country (2016-2032)
- Figure 39: North America Quantum Computing Market Market Revenue (US$ Mn) Comparison by By Component (2016-2032)
- Figure 40: North America Quantum Computing Market Market Revenue (US$ Mn) Comparison by By Deployment (2016-2032)
- Figure 41: North America Quantum Computing Market Market Revenue (US$ Mn) Comparison by By Application (2016-2032)
- Figure 42: North America Quantum Computing Market Market Revenue (US$ Mn) Comparison by By End-user (2016-2032)
- Figure 43: North America Quantum Computing Market Market Y-o-Y Growth Rate Comparison by Country (2016-2032)
- Figure 44: North America Quantum Computing Market Market Y-o-Y Growth Rate Comparison by By Component (2016-2032)
- Figure 45: North America Quantum Computing Market Market Y-o-Y Growth Rate Comparison by By Deployment (2016-2032)
- Figure 46: North America Quantum Computing Market Market Y-o-Y Growth Rate Comparison by By Application (2016-2032)
- Figure 47: North America Quantum Computing Market Market Y-o-Y Growth Rate Comparison by By End-user (2016-2032)
- Figure 48: North America Quantum Computing Market Market Share Comparison by Country (2016-2032)
- Figure 49: North America Quantum Computing Market Market Share Comparison by By Component (2016-2032)
- Figure 50: North America Quantum Computing Market Market Share Comparison by By Deployment (2016-2032)
- Figure 51: North America Quantum Computing Market Market Share Comparison by By Application (2016-2032)
- Figure 52: North America Quantum Computing Market Market Share Comparison by By End-user (2016-2032)
- Figure 53: Western Europe Quantum Computing Market Revenue (US$ Mn) Market Share by By Componentin 2022
- Figure 54: Western Europe Quantum Computing Market Market Attractiveness Analysis by By Component, 2016-2032
- Figure 55: Western Europe Quantum Computing Market Revenue (US$ Mn) Market Share by By Deploymentin 2022
- Figure 56: Western Europe Quantum Computing Market Market Attractiveness Analysis by By Deployment, 2016-2032
- Figure 57: Western Europe Quantum Computing Market Revenue (US$ Mn) Market Share by By Applicationin 2022
- Figure 58: Western Europe Quantum Computing Market Market Attractiveness Analysis by By Application, 2016-2032
- Figure 59: Western Europe Quantum Computing Market Revenue (US$ Mn) Market Share by By End-userin 2022
- Figure 60: Western Europe Quantum Computing Market Market Attractiveness Analysis by By End-user, 2016-2032
- Figure 61: Western Europe Quantum Computing Market Revenue (US$ Mn) Market Share by Country in 2022
- Figure 62: Western Europe Quantum Computing Market Market Attractiveness Analysis by Country, 2016-2032
- Figure 63: Western Europe Quantum Computing Market Market Revenue (US$ Mn) (2016-2032)
- Figure 64: Western Europe Quantum Computing Market Market Revenue (US$ Mn) Comparison by Country (2016-2032)
- Figure 65: Western Europe Quantum Computing Market Market Revenue (US$ Mn) Comparison by By Component (2016-2032)
- Figure 66: Western Europe Quantum Computing Market Market Revenue (US$ Mn) Comparison by By Deployment (2016-2032)
- Figure 67: Western Europe Quantum Computing Market Market Revenue (US$ Mn) Comparison by By Application (2016-2032)
- Figure 68: Western Europe Quantum Computing Market Market Revenue (US$ Mn) Comparison by By End-user (2016-2032)
- Figure 69: Western Europe Quantum Computing Market Market Y-o-Y Growth Rate Comparison by Country (2016-2032)
- Figure 70: Western Europe Quantum Computing Market Market Y-o-Y Growth Rate Comparison by By Component (2016-2032)
- Figure 71: Western Europe Quantum Computing Market Market Y-o-Y Growth Rate Comparison by By Deployment (2016-2032)
- Figure 72: Western Europe Quantum Computing Market Market Y-o-Y Growth Rate Comparison by By Application (2016-2032)
- Figure 73: Western Europe Quantum Computing Market Market Y-o-Y Growth Rate Comparison by By End-user (2016-2032)
- Figure 74: Western Europe Quantum Computing Market Market Share Comparison by Country (2016-2032)
- Figure 75: Western Europe Quantum Computing Market Market Share Comparison by By Component (2016-2032)
- Figure 76: Western Europe Quantum Computing Market Market Share Comparison by By Deployment (2016-2032)
- Figure 77: Western Europe Quantum Computing Market Market Share Comparison by By Application (2016-2032)
- Figure 78: Western Europe Quantum Computing Market Market Share Comparison by By End-user (2016-2032)
- Figure 79: Eastern Europe Quantum Computing Market Revenue (US$ Mn) Market Share by By Componentin 2022
- Figure 80: Eastern Europe Quantum Computing Market Market Attractiveness Analysis by By Component, 2016-2032
- Figure 81: Eastern Europe Quantum Computing Market Revenue (US$ Mn) Market Share by By Deploymentin 2022
- Figure 82: Eastern Europe Quantum Computing Market Market Attractiveness Analysis by By Deployment, 2016-2032
- Figure 83: Eastern Europe Quantum Computing Market Revenue (US$ Mn) Market Share by By Applicationin 2022
- Figure 84: Eastern Europe Quantum Computing Market Market Attractiveness Analysis by By Application, 2016-2032
- Figure 85: Eastern Europe Quantum Computing Market Revenue (US$ Mn) Market Share by By End-userin 2022
- Figure 86: Eastern Europe Quantum Computing Market Market Attractiveness Analysis by By End-user, 2016-2032
- Figure 87: Eastern Europe Quantum Computing Market Revenue (US$ Mn) Market Share by Country in 2022
- Figure 88: Eastern Europe Quantum Computing Market Market Attractiveness Analysis by Country, 2016-2032
- Figure 89: Eastern Europe Quantum Computing Market Market Revenue (US$ Mn) (2016-2032)
- Figure 90: Eastern Europe Quantum Computing Market Market Revenue (US$ Mn) Comparison by Country (2016-2032)
- Figure 91: Eastern Europe Quantum Computing Market Market Revenue (US$ Mn) Comparison by By Component (2016-2032)
- Figure 92: Eastern Europe Quantum Computing Market Market Revenue (US$ Mn) Comparison by By Deployment (2016-2032)
- Figure 93: Eastern Europe Quantum Computing Market Market Revenue (US$ Mn) Comparison by By Application (2016-2032)
- Figure 94: Eastern Europe Quantum Computing Market Market Revenue (US$ Mn) Comparison by By End-user (2016-2032)
- Figure 95: Eastern Europe Quantum Computing Market Market Y-o-Y Growth Rate Comparison by Country (2016-2032)
- Figure 96: Eastern Europe Quantum Computing Market Market Y-o-Y Growth Rate Comparison by By Component (2016-2032)
- Figure 97: Eastern Europe Quantum Computing Market Market Y-o-Y Growth Rate Comparison by By Deployment (2016-2032)
- Figure 98: Eastern Europe Quantum Computing Market Market Y-o-Y Growth Rate Comparison by By Application (2016-2032)
- Figure 99: Eastern Europe Quantum Computing Market Market Y-o-Y Growth Rate Comparison by By End-user (2016-2032)
- Figure 100: Eastern Europe Quantum Computing Market Market Share Comparison by Country (2016-2032)
- Figure 101: Eastern Europe Quantum Computing Market Market Share Comparison by By Component (2016-2032)
- Figure 102: Eastern Europe Quantum Computing Market Market Share Comparison by By Deployment (2016-2032)
- Figure 103: Eastern Europe Quantum Computing Market Market Share Comparison by By Application (2016-2032)
- Figure 104: Eastern Europe Quantum Computing Market Market Share Comparison by By End-user (2016-2032)
- Figure 105: APAC Quantum Computing Market Revenue (US$ Mn) Market Share by By Componentin 2022
- Figure 106: APAC Quantum Computing Market Market Attractiveness Analysis by By Component, 2016-2032
- Figure 107: APAC Quantum Computing Market Revenue (US$ Mn) Market Share by By Deploymentin 2022
- Figure 108: APAC Quantum Computing Market Market Attractiveness Analysis by By Deployment, 2016-2032
- Figure 109: APAC Quantum Computing Market Revenue (US$ Mn) Market Share by By Applicationin 2022
- Figure 110: APAC Quantum Computing Market Market Attractiveness Analysis by By Application, 2016-2032
- Figure 111: APAC Quantum Computing Market Revenue (US$ Mn) Market Share by By End-userin 2022
- Figure 112: APAC Quantum Computing Market Market Attractiveness Analysis by By End-user, 2016-2032
- Figure 113: APAC Quantum Computing Market Revenue (US$ Mn) Market Share by Country in 2022
- Figure 114: APAC Quantum Computing Market Market Attractiveness Analysis by Country, 2016-2032
- Figure 115: APAC Quantum Computing Market Market Revenue (US$ Mn) (2016-2032)
- Figure 116: APAC Quantum Computing Market Market Revenue (US$ Mn) Comparison by Country (2016-2032)
- Figure 117: APAC Quantum Computing Market Market Revenue (US$ Mn) Comparison by By Component (2016-2032)
- Figure 118: APAC Quantum Computing Market Market Revenue (US$ Mn) Comparison by By Deployment (2016-2032)
- Figure 119: APAC Quantum Computing Market Market Revenue (US$ Mn) Comparison by By Application (2016-2032)
- Figure 120: APAC Quantum Computing Market Market Revenue (US$ Mn) Comparison by By End-user (2016-2032)
- Figure 121: APAC Quantum Computing Market Market Y-o-Y Growth Rate Comparison by Country (2016-2032)
- Figure 122: APAC Quantum Computing Market Market Y-o-Y Growth Rate Comparison by By Component (2016-2032)
- Figure 123: APAC Quantum Computing Market Market Y-o-Y Growth Rate Comparison by By Deployment (2016-2032)
- Figure 124: APAC Quantum Computing Market Market Y-o-Y Growth Rate Comparison by By Application (2016-2032)
- Figure 125: APAC Quantum Computing Market Market Y-o-Y Growth Rate Comparison by By End-user (2016-2032)
- Figure 126: APAC Quantum Computing Market Market Share Comparison by Country (2016-2032)
- Figure 127: APAC Quantum Computing Market Market Share Comparison by By Component (2016-2032)
- Figure 128: APAC Quantum Computing Market Market Share Comparison by By Deployment (2016-2032)
- Figure 129: APAC Quantum Computing Market Market Share Comparison by By Application (2016-2032)
- Figure 130: APAC Quantum Computing Market Market Share Comparison by By End-user (2016-2032)
- Figure 131: Latin America Quantum Computing Market Revenue (US$ Mn) Market Share by By Componentin 2022
- Figure 132: Latin America Quantum Computing Market Market Attractiveness Analysis by By Component, 2016-2032
- Figure 133: Latin America Quantum Computing Market Revenue (US$ Mn) Market Share by By Deploymentin 2022
- Figure 134: Latin America Quantum Computing Market Market Attractiveness Analysis by By Deployment, 2016-2032
- Figure 135: Latin America Quantum Computing Market Revenue (US$ Mn) Market Share by By Applicationin 2022
- Figure 136: Latin America Quantum Computing Market Market Attractiveness Analysis by By Application, 2016-2032
- Figure 137: Latin America Quantum Computing Market Revenue (US$ Mn) Market Share by By End-userin 2022
- Figure 138: Latin America Quantum Computing Market Market Attractiveness Analysis by By End-user, 2016-2032
- Figure 139: Latin America Quantum Computing Market Revenue (US$ Mn) Market Share by Country in 2022
- Figure 140: Latin America Quantum Computing Market Market Attractiveness Analysis by Country, 2016-2032
- Figure 141: Latin America Quantum Computing Market Market Revenue (US$ Mn) (2016-2032)
- Figure 142: Latin America Quantum Computing Market Market Revenue (US$ Mn) Comparison by Country (2016-2032)
- Figure 143: Latin America Quantum Computing Market Market Revenue (US$ Mn) Comparison by By Component (2016-2032)
- Figure 144: Latin America Quantum Computing Market Market Revenue (US$ Mn) Comparison by By Deployment (2016-2032)
- Figure 145: Latin America Quantum Computing Market Market Revenue (US$ Mn) Comparison by By Application (2016-2032)
- Figure 146: Latin America Quantum Computing Market Market Revenue (US$ Mn) Comparison by By End-user (2016-2032)
- Figure 147: Latin America Quantum Computing Market Market Y-o-Y Growth Rate Comparison by Country (2016-2032)
- Figure 148: Latin America Quantum Computing Market Market Y-o-Y Growth Rate Comparison by By Component (2016-2032)
- Figure 149: Latin America Quantum Computing Market Market Y-o-Y Growth Rate Comparison by By Deployment (2016-2032)
- Figure 150: Latin America Quantum Computing Market Market Y-o-Y Growth Rate Comparison by By Application (2016-2032)
- Figure 151: Latin America Quantum Computing Market Market Y-o-Y Growth Rate Comparison by By End-user (2016-2032)
- Figure 152: Latin America Quantum Computing Market Market Share Comparison by Country (2016-2032)
- Figure 153: Latin America Quantum Computing Market Market Share Comparison by By Component (2016-2032)
- Figure 154: Latin America Quantum Computing Market Market Share Comparison by By Deployment (2016-2032)
- Figure 155: Latin America Quantum Computing Market Market Share Comparison by By Application (2016-2032)
- Figure 156: Latin America Quantum Computing Market Market Share Comparison by By End-user (2016-2032)
- Figure 157: Middle East & Africa Quantum Computing Market Revenue (US$ Mn) Market Share by By Componentin 2022
- Figure 158: Middle East & Africa Quantum Computing Market Market Attractiveness Analysis by By Component, 2016-2032
- Figure 159: Middle East & Africa Quantum Computing Market Revenue (US$ Mn) Market Share by By Deploymentin 2022
- Figure 160: Middle East & Africa Quantum Computing Market Market Attractiveness Analysis by By Deployment, 2016-2032
- Figure 161: Middle East & Africa Quantum Computing Market Revenue (US$ Mn) Market Share by By Applicationin 2022
- Figure 162: Middle East & Africa Quantum Computing Market Market Attractiveness Analysis by By Application, 2016-2032
- Figure 163: Middle East & Africa Quantum Computing Market Revenue (US$ Mn) Market Share by By End-userin 2022
- Figure 164: Middle East & Africa Quantum Computing Market Market Attractiveness Analysis by By End-user, 2016-2032
- Figure 165: Middle East & Africa Quantum Computing Market Revenue (US$ Mn) Market Share by Country in 2022
- Figure 166: Middle East & Africa Quantum Computing Market Market Attractiveness Analysis by Country, 2016-2032
- Figure 167: Middle East & Africa Quantum Computing Market Market Revenue (US$ Mn) (2016-2032)
- Figure 168: Middle East & Africa Quantum Computing Market Market Revenue (US$ Mn) Comparison by Country (2016-2032)
- Figure 169: Middle East & Africa Quantum Computing Market Market Revenue (US$ Mn) Comparison by By Component (2016-2032)
- Figure 170: Middle East & Africa Quantum Computing Market Market Revenue (US$ Mn) Comparison by By Deployment (2016-2032)
- Figure 171: Middle East & Africa Quantum Computing Market Market Revenue (US$ Mn) Comparison by By Application (2016-2032)
- Figure 172: Middle East & Africa Quantum Computing Market Market Revenue (US$ Mn) Comparison by By End-user (2016-2032)
- Figure 173: Middle East & Africa Quantum Computing Market Market Y-o-Y Growth Rate Comparison by Country (2016-2032)
- Figure 174: Middle East & Africa Quantum Computing Market Market Y-o-Y Growth Rate Comparison by By Component (2016-2032)
- Figure 175: Middle East & Africa Quantum Computing Market Market Y-o-Y Growth Rate Comparison by By Deployment (2016-2032)
- Figure 176: Middle East & Africa Quantum Computing Market Market Y-o-Y Growth Rate Comparison by By Application (2016-2032)
- Figure 177: Middle East & Africa Quantum Computing Market Market Y-o-Y Growth Rate Comparison by By End-user (2016-2032)
- Figure 178: Middle East & Africa Quantum Computing Market Market Share Comparison by Country (2016-2032)
- Figure 179: Middle East & Africa Quantum Computing Market Market Share Comparison by By Component (2016-2032)
- Figure 180: Middle East & Africa Quantum Computing Market Market Share Comparison by By Deployment (2016-2032)
- Figure 181: Middle East & Africa Quantum Computing Market Market Share Comparison by By Application (2016-2032)
- Figure 182: Middle East & Africa Quantum Computing Market Market Share Comparison by By End-user (2016-2032)
List of Tables
-
- Table 1: Global Quantum Computing Market Market Comparison by By Component (2016-2032)
- Table 2: Global Quantum Computing Market Market Comparison by By Deployment (2016-2032)
- Table 3: Global Quantum Computing Market Market Comparison by By Application (2016-2032)
- Table 4: Global Quantum Computing Market Market Comparison by By End-user (2016-2032)
- Table 5: Global Quantum Computing Market Revenue (US$ Mn) Comparison by Region (2016-2032)
- Table 6: Global Quantum Computing Market Market Revenue (US$ Mn) (2016-2032)
- Table 7: Global Quantum Computing Market Market Revenue (US$ Mn) Comparison by Region (2016-2032)
- Table 8: Global Quantum Computing Market Market Revenue (US$ Mn) Comparison by By Component (2016-2032)
- Table 9: Global Quantum Computing Market Market Revenue (US$ Mn) Comparison by By Deployment (2016-2032)
- Table 10: Global Quantum Computing Market Market Revenue (US$ Mn) Comparison by By Application (2016-2032)
- Table 11: Global Quantum Computing Market Market Revenue (US$ Mn) Comparison by By End-user (2016-2032)
- Table 12: Global Quantum Computing Market Market Y-o-Y Growth Rate Comparison by Region (2016-2032)
- Table 13: Global Quantum Computing Market Market Y-o-Y Growth Rate Comparison by By Component (2016-2032)
- Table 14: Global Quantum Computing Market Market Y-o-Y Growth Rate Comparison by By Deployment (2016-2032)
- Table 15: Global Quantum Computing Market Market Y-o-Y Growth Rate Comparison by By Application (2016-2032)
- Table 16: Global Quantum Computing Market Market Y-o-Y Growth Rate Comparison by By End-user (2016-2032)
- Table 17: Global Quantum Computing Market Market Share Comparison by Region (2016-2032)
- Table 18: Global Quantum Computing Market Market Share Comparison by By Component (2016-2032)
- Table 19: Global Quantum Computing Market Market Share Comparison by By Deployment (2016-2032)
- Table 20: Global Quantum Computing Market Market Share Comparison by By Application (2016-2032)
- Table 21: Global Quantum Computing Market Market Share Comparison by By End-user (2016-2032)
- Table 22: North America Quantum Computing Market Market Comparison by By Deployment (2016-2032)
- Table 23: North America Quantum Computing Market Market Comparison by By Application (2016-2032)
- Table 24: North America Quantum Computing Market Market Comparison by By End-user (2016-2032)
- Table 25: North America Quantum Computing Market Revenue (US$ Mn) Comparison by Country (2016-2032)
- Table 26: North America Quantum Computing Market Market Revenue (US$ Mn) (2016-2032)
- Table 27: North America Quantum Computing Market Market Revenue (US$ Mn) Comparison by Country (2016-2032)
- Table 28: North America Quantum Computing Market Market Revenue (US$ Mn) Comparison by By Component (2016-2032)
- Table 29: North America Quantum Computing Market Market Revenue (US$ Mn) Comparison by By Deployment (2016-2032)
- Table 30: North America Quantum Computing Market Market Revenue (US$ Mn) Comparison by By Application (2016-2032)
- Table 31: North America Quantum Computing Market Market Revenue (US$ Mn) Comparison by By End-user (2016-2032)
- Table 32: North America Quantum Computing Market Market Y-o-Y Growth Rate Comparison by Country (2016-2032)
- Table 33: North America Quantum Computing Market Market Y-o-Y Growth Rate Comparison by By Component (2016-2032)
- Table 34: North America Quantum Computing Market Market Y-o-Y Growth Rate Comparison by By Deployment (2016-2032)
- Table 35: North America Quantum Computing Market Market Y-o-Y Growth Rate Comparison by By Application (2016-2032)
- Table 36: North America Quantum Computing Market Market Y-o-Y Growth Rate Comparison by By End-user (2016-2032)
- Table 37: North America Quantum Computing Market Market Share Comparison by Country (2016-2032)
- Table 38: North America Quantum Computing Market Market Share Comparison by By Component (2016-2032)
- Table 39: North America Quantum Computing Market Market Share Comparison by By Deployment (2016-2032)
- Table 40: North America Quantum Computing Market Market Share Comparison by By Application (2016-2032)
- Table 41: North America Quantum Computing Market Market Share Comparison by By End-user (2016-2032)
- Table 42: Western Europe Quantum Computing Market Market Comparison by By Component (2016-2032)
- Table 43: Western Europe Quantum Computing Market Market Comparison by By Deployment (2016-2032)
- Table 44: Western Europe Quantum Computing Market Market Comparison by By Application (2016-2032)
- Table 45: Western Europe Quantum Computing Market Market Comparison by By End-user (2016-2032)
- Table 46: Western Europe Quantum Computing Market Revenue (US$ Mn) Comparison by Country (2016-2032)
- Table 47: Western Europe Quantum Computing Market Market Revenue (US$ Mn) (2016-2032)
- Table 48: Western Europe Quantum Computing Market Market Revenue (US$ Mn) Comparison by Country (2016-2032)
- Table 49: Western Europe Quantum Computing Market Market Revenue (US$ Mn) Comparison by By Component (2016-2032)
- Table 50: Western Europe Quantum Computing Market Market Revenue (US$ Mn) Comparison by By Deployment (2016-2032)
- Table 51: Western Europe Quantum Computing Market Market Revenue (US$ Mn) Comparison by By Application (2016-2032)
- Table 52: Western Europe Quantum Computing Market Market Revenue (US$ Mn) Comparison by By End-user (2016-2032)
- Table 53: Western Europe Quantum Computing Market Market Y-o-Y Growth Rate Comparison by Country (2016-2032)
- Table 54: Western Europe Quantum Computing Market Market Y-o-Y Growth Rate Comparison by By Component (2016-2032)
- Table 55: Western Europe Quantum Computing Market Market Y-o-Y Growth Rate Comparison by By Deployment (2016-2032)
- Table 56: Western Europe Quantum Computing Market Market Y-o-Y Growth Rate Comparison by By Application (2016-2032)
- Table 57: Western Europe Quantum Computing Market Market Y-o-Y Growth Rate Comparison by By End-user (2016-2032)
- Table 58: Western Europe Quantum Computing Market Market Share Comparison by Country (2016-2032)
- Table 59: Western Europe Quantum Computing Market Market Share Comparison by By Component (2016-2032)
- Table 60: Western Europe Quantum Computing Market Market Share Comparison by By Deployment (2016-2032)
- Table 61: Western Europe Quantum Computing Market Market Share Comparison by By Application (2016-2032)
- Table 62: Western Europe Quantum Computing Market Market Share Comparison by By End-user (2016-2032)
- Table 63: Eastern Europe Quantum Computing Market Market Comparison by By Component (2016-2032)
- Table 64: Eastern Europe Quantum Computing Market Market Comparison by By Deployment (2016-2032)
- Table 65: Eastern Europe Quantum Computing Market Market Comparison by By Application (2016-2032)
- Table 66: Eastern Europe Quantum Computing Market Market Comparison by By End-user (2016-2032)
- Table 67: Eastern Europe Quantum Computing Market Revenue (US$ Mn) Comparison by Country (2016-2032)
- Table 68: Eastern Europe Quantum Computing Market Market Revenue (US$ Mn) (2016-2032)
- Table 69: Eastern Europe Quantum Computing Market Market Revenue (US$ Mn) Comparison by Country (2016-2032)
- Table 70: Eastern Europe Quantum Computing Market Market Revenue (US$ Mn) Comparison by By Component (2016-2032)
- Table 71: Eastern Europe Quantum Computing Market Market Revenue (US$ Mn) Comparison by By Deployment (2016-2032)
- Table 72: Eastern Europe Quantum Computing Market Market Revenue (US$ Mn) Comparison by By Application (2016-2032)
- Table 73: Eastern Europe Quantum Computing Market Market Revenue (US$ Mn) Comparison by By End-user (2016-2032)
- Table 74: Eastern Europe Quantum Computing Market Market Y-o-Y Growth Rate Comparison by Country (2016-2032)
- Table 75: Eastern Europe Quantum Computing Market Market Y-o-Y Growth Rate Comparison by By Component (2016-2032)
- Table 76: Eastern Europe Quantum Computing Market Market Y-o-Y Growth Rate Comparison by By Deployment (2016-2032)
- Table 77: Eastern Europe Quantum Computing Market Market Y-o-Y Growth Rate Comparison by By Application (2016-2032)
- Table 78: Eastern Europe Quantum Computing Market Market Y-o-Y Growth Rate Comparison by By End-user (2016-2032)
- Table 79: Eastern Europe Quantum Computing Market Market Share Comparison by Country (2016-2032)
- Table 80: Eastern Europe Quantum Computing Market Market Share Comparison by By Component (2016-2032)
- Table 81: Eastern Europe Quantum Computing Market Market Share Comparison by By Deployment (2016-2032)
- Table 82: Eastern Europe Quantum Computing Market Market Share Comparison by By Application (2016-2032)
- Table 83: Eastern Europe Quantum Computing Market Market Share Comparison by By End-user (2016-2032)
- Table 84: APAC Quantum Computing Market Market Comparison by By Component (2016-2032)
- Table 85: APAC Quantum Computing Market Market Comparison by By Deployment (2016-2032)
- Table 86: APAC Quantum Computing Market Market Comparison by By Application (2016-2032)
- Table 87: APAC Quantum Computing Market Market Comparison by By End-user (2016-2032)
- Table 88: APAC Quantum Computing Market Revenue (US$ Mn) Comparison by Country (2016-2032)
- Table 89: APAC Quantum Computing Market Market Revenue (US$ Mn) (2016-2032)
- Table 90: APAC Quantum Computing Market Market Revenue (US$ Mn) Comparison by Country (2016-2032)
- Table 91: APAC Quantum Computing Market Market Revenue (US$ Mn) Comparison by By Component (2016-2032)
- Table 92: APAC Quantum Computing Market Market Revenue (US$ Mn) Comparison by By Deployment (2016-2032)
- Table 93: APAC Quantum Computing Market Market Revenue (US$ Mn) Comparison by By Application (2016-2032)
- Table 94: APAC Quantum Computing Market Market Revenue (US$ Mn) Comparison by By End-user (2016-2032)
- Table 95: APAC Quantum Computing Market Market Y-o-Y Growth Rate Comparison by Country (2016-2032)
- Table 96: APAC Quantum Computing Market Market Y-o-Y Growth Rate Comparison by By Component (2016-2032)
- Table 97: APAC Quantum Computing Market Market Y-o-Y Growth Rate Comparison by By Deployment (2016-2032)
- Table 98: APAC Quantum Computing Market Market Y-o-Y Growth Rate Comparison by By Application (2016-2032)
- Table 99: APAC Quantum Computing Market Market Y-o-Y Growth Rate Comparison by By End-user (2016-2032)
- Table 100: APAC Quantum Computing Market Market Share Comparison by Country (2016-2032)
- Table 101: APAC Quantum Computing Market Market Share Comparison by By Component (2016-2032)
- Table 102: APAC Quantum Computing Market Market Share Comparison by By Deployment (2016-2032)
- Table 103: APAC Quantum Computing Market Market Share Comparison by By Application (2016-2032)
- Table 104: APAC Quantum Computing Market Market Share Comparison by By End-user (2016-2032)
- Table 105: Latin America Quantum Computing Market Market Comparison by By Component (2016-2032)
- Table 106: Latin America Quantum Computing Market Market Comparison by By Deployment (2016-2032)
- Table 107: Latin America Quantum Computing Market Market Comparison by By Application (2016-2032)
- Table 108: Latin America Quantum Computing Market Market Comparison by By End-user (2016-2032)
- Table 109: Latin America Quantum Computing Market Revenue (US$ Mn) Comparison by Country (2016-2032)
- Table 110: Latin America Quantum Computing Market Market Revenue (US$ Mn) (2016-2032)
- Table 111: Latin America Quantum Computing Market Market Revenue (US$ Mn) Comparison by Country (2016-2032)
- Table 112: Latin America Quantum Computing Market Market Revenue (US$ Mn) Comparison by By Component (2016-2032)
- Table 113: Latin America Quantum Computing Market Market Revenue (US$ Mn) Comparison by By Deployment (2016-2032)
- Table 114: Latin America Quantum Computing Market Market Revenue (US$ Mn) Comparison by By Application (2016-2032)
- Table 115: Latin America Quantum Computing Market Market Revenue (US$ Mn) Comparison by By End-user (2016-2032)
- Table 116: Latin America Quantum Computing Market Market Y-o-Y Growth Rate Comparison by Country (2016-2032)
- Table 117: Latin America Quantum Computing Market Market Y-o-Y Growth Rate Comparison by By Component (2016-2032)
- Table 118: Latin America Quantum Computing Market Market Y-o-Y Growth Rate Comparison by By Deployment (2016-2032)
- Table 119: Latin America Quantum Computing Market Market Y-o-Y Growth Rate Comparison by By Application (2016-2032)
- Table 120: Latin America Quantum Computing Market Market Y-o-Y Growth Rate Comparison by By End-user (2016-2032)
- Table 121: Latin America Quantum Computing Market Market Share Comparison by Country (2016-2032)
- Table 122: Latin America Quantum Computing Market Market Share Comparison by By Component (2016-2032)
- Table 123: Latin America Quantum Computing Market Market Share Comparison by By Deployment (2016-2032)
- Table 124: Latin America Quantum Computing Market Market Share Comparison by By Application (2016-2032)
- Table 125: Latin America Quantum Computing Market Market Share Comparison by By End-user (2016-2032)
- Table 126: Middle East & Africa Quantum Computing Market Market Comparison by By Component (2016-2032)
- Table 127: Middle East & Africa Quantum Computing Market Market Comparison by By Deployment (2016-2032)
- Table 128: Middle East & Africa Quantum Computing Market Market Comparison by By Application (2016-2032)
- Table 129: Middle East & Africa Quantum Computing Market Market Comparison by By End-user (2016-2032)
- Table 130: Middle East & Africa Quantum Computing Market Revenue (US$ Mn) Comparison by Country (2016-2032)
- Table 131: Middle East & Africa Quantum Computing Market Market Revenue (US$ Mn) (2016-2032)
- Table 132: Middle East & Africa Quantum Computing Market Market Revenue (US$ Mn) Comparison by Country (2016-2032)
- Table 133: Middle East & Africa Quantum Computing Market Market Revenue (US$ Mn) Comparison by By Component (2016-2032)
- Table 134: Middle East & Africa Quantum Computing Market Market Revenue (US$ Mn) Comparison by By Deployment (2016-2032)
- Table 135: Middle East & Africa Quantum Computing Market Market Revenue (US$ Mn) Comparison by By Application (2016-2032)
- Table 136: Middle East & Africa Quantum Computing Market Market Revenue (US$ Mn) Comparison by By End-user (2016-2032)
- Table 137: Middle East & Africa Quantum Computing Market Market Y-o-Y Growth Rate Comparison by Country (2016-2032)
- Table 138: Middle East & Africa Quantum Computing Market Market Y-o-Y Growth Rate Comparison by By Component (2016-2032)
- Table 139: Middle East & Africa Quantum Computing Market Market Y-o-Y Growth Rate Comparison by By Deployment (2016-2032)
- Table 140: Middle East & Africa Quantum Computing Market Market Y-o-Y Growth Rate Comparison by By Application (2016-2032)
- Table 141: Middle East & Africa Quantum Computing Market Market Y-o-Y Growth Rate Comparison by By End-user (2016-2032)
- Table 142: Middle East & Africa Quantum Computing Market Market Share Comparison by Country (2016-2032)
- Table 143: Middle East & Africa Quantum Computing Market Market Share Comparison by By Component (2016-2032)
- Table 144: Middle East & Africa Quantum Computing Market Market Share Comparison by By Deployment (2016-2032)
- Table 145: Middle East & Africa Quantum Computing Market Market Share Comparison by By Application (2016-2032)
- Table 146: Middle East & Africa Quantum Computing Market Market Share Comparison by By End-user (2016-2032)
- 1. Executive Summary
-
- IBM Corporation
- Google Quantum AI
- Microsoft Corporation
- Amazon Web Services, Inc
- Atos Quantum
- D-Wave Quantum Inc.
- Intel
- Hitachi
- QC Ware
- Zapata Computing
- Toshiba Corporation
- Other Key Players
Our Clients


View Our Licence Options
