
Pulp Market By Type of Pulp (Wood Pulp and Non-Wood Pulp), By Grade (Chemical Pulp, Mechanical Pulp, Recycled Pulp), By End Use Industry (Packaging, Printing, Building and Construction), By Region And Companies - Industry Segment Outlook, Market Assessment, Competition Scenario, Trends, And Forecast 2024-2033
-
49162
-
July 2024
-
300
-


-
This report was compiled by Shreyas Rokade Shreyas Rokade is a seasoned Research Analyst with CMFE, bringing extensive expertise in market research and consulting, with a strong background in Chemical Engineering. Correspondence Team Lead-CMFE Linkedin | Detailed Market research Methodology Our methodology involves a mix of primary research, including interviews with leading mental health experts, and secondary research from reputable medical journals and databases. View Detailed Methodology Page
-
Quick Navigation
Report Overview
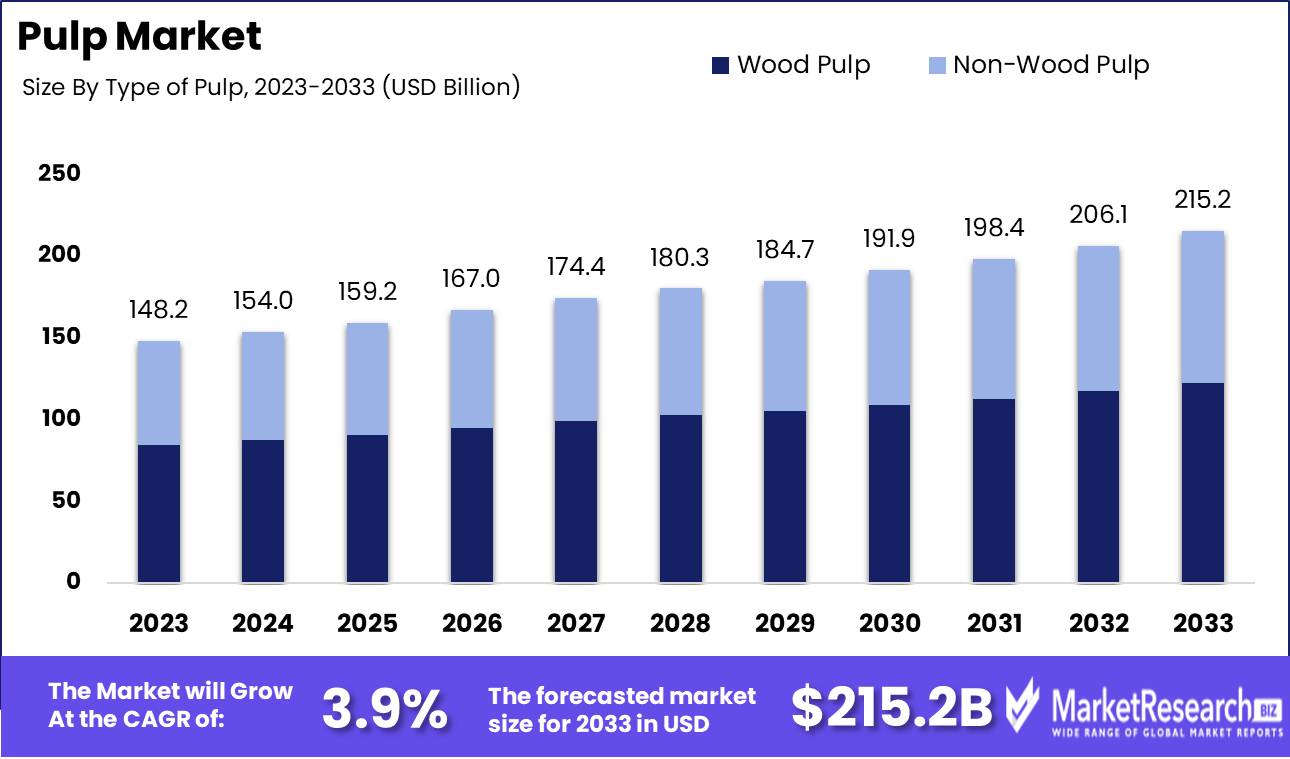
The Pulp Market was valued at USD 148.2 billion in 2023. It is expected to reach USD 215.2 billion by 2033, with a CAGR of 3.9% during the forecast period from 2024 to 2033.
The pulp market encompasses the global production and distribution of pulp, a fibrous material derived primarily from wood, but also from non-wood sources such as bamboo and recycled waste paper. This market is pivotal in the paper and textile industries, supplying raw materials essential for manufacturing paper, packaging, hygiene products, and specialty textiles. The demand within the pulp market is driven by factors including rising packaging needs due to e-commerce, sustainability trends favoring eco-friendly materials, and technological advancements in pulp production processes.
The global pulp market is positioned for steady growth, primarily influenced by an increasing consumer preference for sustainable packaging solutions and enhanced awareness of hygiene and sanitation. The shift toward environmentally friendly packaging is notably accelerating demand for paper-based products. As organizations and consumers alike seek alternatives that align with global sustainability goals, the pulp industry benefits significantly from this trend, given its critical role in the production of eco-friendly packaging materials.
Moreover, the rise in consumer awareness concerning hygiene has catalyzed the demand for tissue and hygiene products. This shift is not only a reflection of changing consumer habits but also of broader health and wellness trends that prioritize cleanliness and personal care. However, the industry faces challenges imposed by stricter environmental regulations, which mandate rigorous standards for waste management and sustainable practices. Despite these hurdles, the market's trajectory remains positive, with projections indicating robust growth in the demand for paper and paperboard products for both packaging and tissue applications. This growth is expected to be sustained by the ongoing innovations and adaptations within the industry, aimed at overcoming environmental challenges while meeting the escalating consumer demand.
Key Takeaways
- Market Growth: The Pulp Market was valued at USD 148.2 billion in 2023. It is expected to reach USD 215.2 billion by 2033, with a CAGR of 3.9% during the forecast period from 2024 to 2033.
- By Type of Pulp: Wood Pulp dominates the Pulp Market with sustainable, superior fiber quality.
- By Grade: Chemical Pulp dominates the Pulp Market, with Mechanical and Recycled following.
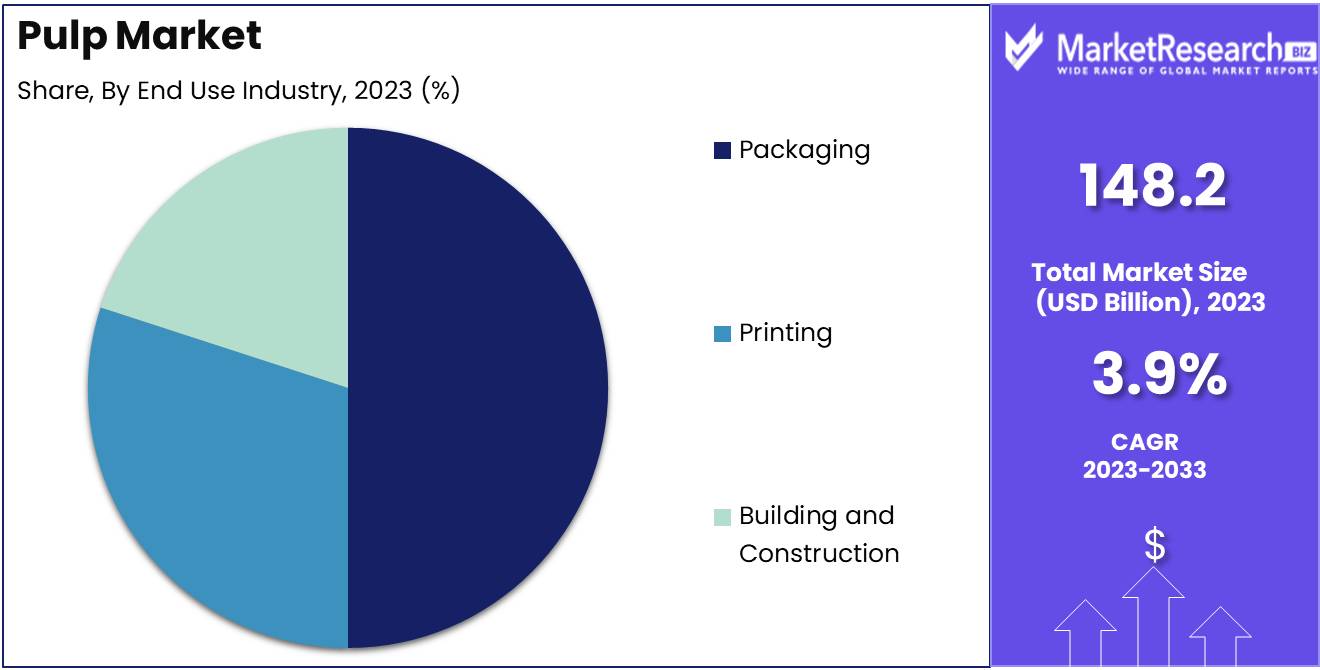
- By End Use Industry: Packaging dominates the Pulp Market, driven by sustainability and innovation.
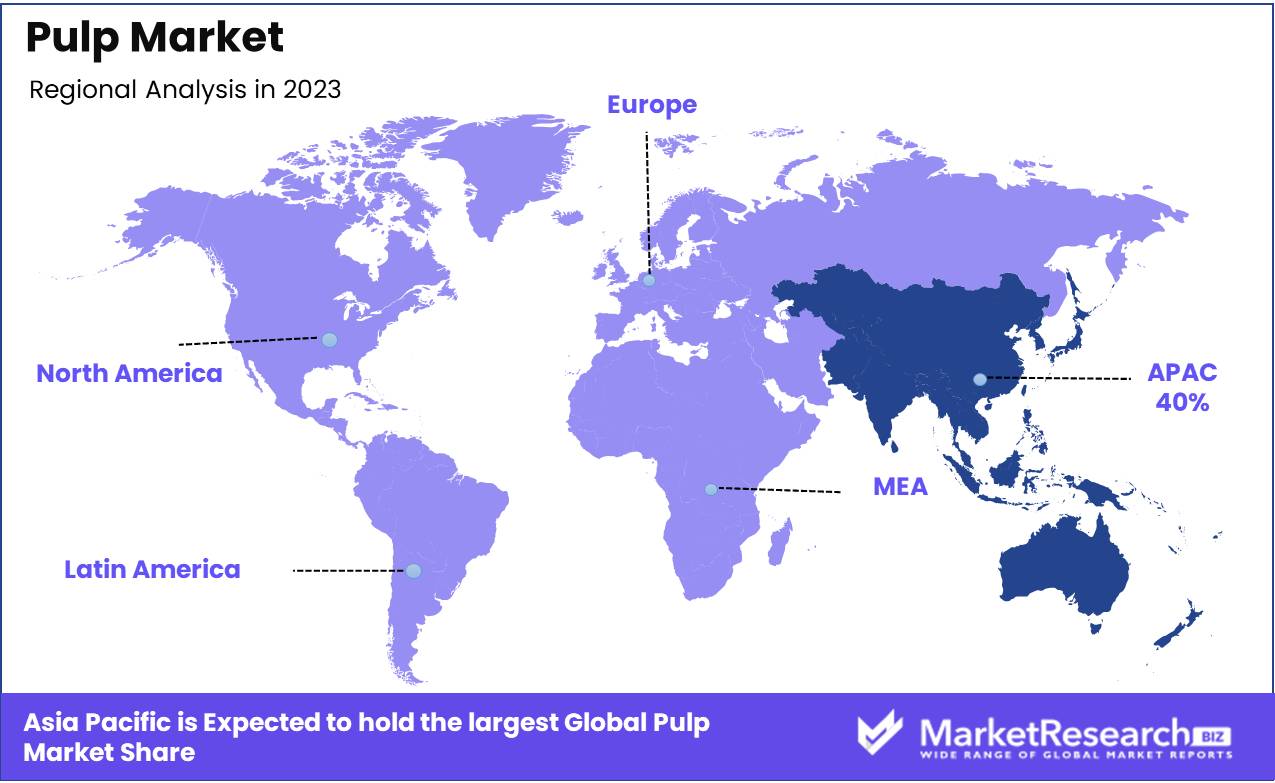
- Regional Dominance: Asia Pacific dominates the global pulp market, leading with a 40% largest share.
- Growth Opportunity: The global pulp market is set to grow significantly, driven by rising demands in personal care and chemical-grade pulp.
Driving factors
Increased Demand for Paper and Packaging Products
The pulp market is experiencing significant growth primarily due to the escalating demand for paper and packaging products. As global trade and e-commerce activities expand, there is a corresponding increase in the need for packaging solutions, which predominantly utilize pulp-based materials. This is particularly evident in sectors like retail and food services, where the demand for effective and sturdy packaging continues to rise. Statistically, the global packaging industry has witnessed growth rates of approximately 3-4% annually, a trend that is expected to persist, thereby directly influencing the pulp market's expansion.
Rising Demand for Sustainable and Eco-friendly Packaging
Environmental sustainability has become a central focus for industries and consumers alike, leading to a surge in demand for eco-friendly packaging solutions. Pulp-based packaging options are highly favored in this shift because they are biodegradable, recyclable, and generally have a lower carbon footprint compared to plastic alternatives. This trend is supported by increasing regulatory pressures and consumer preferences for sustainable products. For instance, several governments have implemented regulations that encourage the use of environmentally friendly materials, which has further propelled the growth of the pulp industry as manufacturers seek compliant, sustainable raw materials.
Heightened Consumption of Chemical Wood Pulp
Chemical wood pulp, known for its strength and high-quality finish, is increasingly preferred for various applications, including high-end paper products and specialty packaging. The demand for this type of pulp is driven by its superior properties, such as enhanced durability and better printability, which are essential for both consumer and industrial applications. The global market for chemical wood pulp has seen robust growth, with projections indicating continued expansion, spurred by innovations in pulp processing technologies that enhance its appeal and functionality.
Restraining Factors
High Initial Investment: A Barrier to Entry and Expansion
The pulp industry is characterized by significant capital requirements due to the high cost of establishing and maintaining pulp mills. These costs include the acquisition of advanced machinery, sustainable technologies, and compliance with environmental regulations. High initial investments act as a major barrier to entry for new players and can restrict the expansion capabilities of existing firms. This limitation affects market growth by reducing competition and innovation within the industry. The necessity for substantial financial resources can deter smaller players and startups from entering the market, thus potentially leading to a concentration of market power among a few large entities.
Availability of Wood Resources: A Critical Dependency with Geographic Limitations
The availability of wood resources is another crucial factor influencing the pulp market. Pulp production is heavily dependent on a steady supply of wood, which varies significantly by geographic region. Areas rich in forest resources have a competitive advantage, while regions with limited wood availability may face higher raw material costs due to the need for imports. This geographical disparity can lead to uneven market growth rates across different regions. Furthermore, factors such as deforestation, environmental regulations, and competition from other industries (like timber and paper) for wood resources compound the impact on the pulp market, limiting production capacities and elevating operational costs.
By Type of Pulp Analysis
Wood Pulp dominates the Pulp Market with sustainable, superior fiber quality.
In 2023, Wood Pulp held a dominant market position in the "By Type of Pulp" segment of the Pulp Market, which primarily includes Wood Pulp and Non-Wood Pulp categories. This predominance can be attributed to its extensive utilization across various industries, including paper manufacturing, textile production, and specialty cellulose products. Wood Pulp's significant market share is driven by its superior fiber quality, which is essential for producing high-strength paper products, and its sustainable sourcing practices, appealing to environmentally conscious consumers and businesses.
Conversely, the Non-Wood Pulp segment, comprising sources like bamboo, straw, and other fibrous materials, caters to a niche but growing market focused on sustainability and reduced environmental impact. Although this segment represents a smaller proportion of the market, it is gaining traction due to rising demand for eco-friendly and innovative pulp solutions, particularly in regions with limited wood resources but abundant agricultural waste products. The dynamic between these two segments underscores a broader industry trend toward diversification and sustainability in raw material sourcing.
By Grade Analysis
Chemical Pulp dominates the 2023 Pulp Market, with Mechanical and Recycled following.
In 2023, Chemical Pulp held a dominant market position in the By Grade segment of the Pulp Market, reflecting its extensive utility across various industries due to its superior strength and brightness, essential for high-quality paper production. Chemical pulp, processed using chemicals to break down the lignin and separate fibers, commands a significant market share due to its ability to produce a cleaner, more uniform texture, which is highly valued in paper manufacturing for printing and writing purposes.
Following closely, Mechanical Pulp is appreciated for its cost-effectiveness and high yield. This grade of pulp retains most of the wood's original structure, resulting in a product with a high retention of lignin, which imparts natural brightness but lower strength. Mechanical pulp is predominantly used in newsprint and other applications where strength is less critical.
Lastly, Recycled Pulp underscores the industry's shift towards sustainability. This segment has been gaining traction as environmental regulations tighten and consumer preference shifts towards eco-friendly products. Recycled pulp is primarily used in packaging solutions and tissue paper products, reflecting a robust commitment to reducing the industry's environmental footprint while meeting the economic criteria of various stakeholders.
By End Use Industry Analysis
Packaging dominates Pulp Market, driven by sustainability and innovation.
In 2023, Packaging held a dominant market position in the By End Use Industry segment of the Pulp Market. The prominence of packaging in this segment can be attributed to the increasing demand for sustainable packaging solutions across various sectors. Companies are transitioning towards eco-friendly packaging options to align with global sustainability goals, thereby fueling the growth in pulp demand for packaging applications. This trend is supported by innovations in packaging design and materials that leverage pulp due to its biodegradability and recyclability.
Additionally, the Printing segment also showcases considerable utilization of pulp, primarily driven by the need for high-quality, durable paper products in both commercial and educational sectors. Despite the digital transformation, specific niches within the printing industry, such as luxury packaging and specialty publications, continue to demand premium pulp-based paper.
The Building and Construction segment further integrates pulp primarily for specialty products like acoustical panels and insulation, aligning with the rising construction activities globally. Pulp's attributes of thermal insulation and soundproofing enhance its adoption in modern construction practices, marking its critical role across multiple facets of the industry.
Key Market Segments
By Type of Pulp
- Wood Pulp
- Non-Wood Pulp
By Grade
- Chemical Pulp
- Mechanical Pulp
- Recycled Pulp
By End Use Industry
- Packaging
- Printing
- Building and Construction
Growth Opportunity
Rising Demand for Personal Care and Hygiene Products
The global pulp market is poised for significant expansion, primarily driven by the surging demand for personal care and hygiene products. As global awareness and expenditures on health and hygiene continue to rise, manufacturers of personal care products are increasing their utilization of high-quality pulp to meet consumer expectations for softness, strength, and absorbency in products such as facial tissues, diapers, and sanitary pads. This trend is expected to significantly bolster market growth, as pulp remains a critical raw material for these products.
Adoption of Chemical Grade Pulp
Another pivotal growth opportunity within the pulp market stems from the increased adoption of chemical-grade pulp. This type of pulp is integral in producing higher-end and specialty paper products that require greater purity, such as filter papers and pharmaceutical products. The shift towards more sustainable and biodegradable products across various industries, including food and beverage, pharmaceuticals, and electronics, underpins the growing preference for chemical-grade pulp. Its enhanced properties, such as superior consistency and reduced impurities, make it increasingly preferred over mechanical pulp and recycled paper, thereby amplifying its market demand.
Latest Trends
Sustainable and Eco-Friendly Pulp Production
The pulp industry continues to evolve significantly with sustainability at its core. The push towards eco-friendly production practices is primarily driven by increasing environmental regulations and the growing consumer demand for sustainable products. Companies are investing in cleaner and more energy-efficient technologies to reduce the carbon footprint of pulp production processes. This trend is further supported by the adoption of closed-loop systems and the increased use of renewable energy sources in manufacturing facilities. The market's shift towards sustainable practices not only helps in meeting regulatory requirements but also enhances brand reputation and consumer loyalty, thereby potentially increasing market share in competitive sectors.
Digitalization and Changing Paper Consumption Patterns
Digitalization is significantly influencing the pulp market, altering traditional paper consumption patterns. As the world leans more towards digital media, the demand for traditional printing and writing paper has seen a relative decline. However, this trend has concurrently spurred growth in specialized pulp products designed for packaging and hygiene products, driven by the e-commerce boom and increased hygiene awareness post-pandemic. Advanced analytics and IoT integration in pulp production processes are enabling manufacturers to optimize operations and improve efficiency, leading to lower production costs and enhanced output quality. The industry's pivot towards digital solutions is not only a response to changing consumer habits but also a strategic move to harness technology for operational excellence and sustainability. This digital shift is expected to continue to reshape the pulp market landscape, with a focus on innovative uses for pulp and the development of new market segments.
Regional Analysis
Asia Pacific dominates the global pulp market, leading with a 40% largest share.
The global pulp market exhibits significant regional variations, with Asia Pacific leading the charge, accounting for over 40% of the global market share. This dominance is attributed to the region's robust demand from the paper and packaging industries, driven by rapid urbanization and increasing e-commerce activities. China and Indonesia are key players, with substantial investments in advanced pulp processing technologies enhancing their competitive edge.
North America, holding approximately 25% of the market share, follows as a major player, primarily due to the established presence of numerous paper manufacturing companies and the rising trend of sustainable packaging. The United States and Canada are pivotal markets within this region, benefiting from abundant raw material availability and technological advancements.
Europe, with a market share of around 20%, remains a significant contributor, supported by stringent environmental regulations promoting the use of recycled pulp. Germany, Sweden, and Finland are notable markets, given their strong industrial base and focus on eco-friendly practices.
Latin America and the Middle East & Africa, though smaller in comparison, are experiencing steady growth. Latin America, holding about 10% of the market share, is propelled by Brazil's vast forestry resources, while the Middle East & Africa region, accounting for roughly 5%, sees growth driven by increasing infrastructural developments and rising literacy rates.
Key Regions and Countries
North America
- The US
- Canada
- Rest of North America
Europe
- Germany
- France
- The UK
- Spain
- Netherlands
- Russia
- Italy
- Rest of Europe
Asia-Pacific
- China
- Japan
- Singapore
- Thailand
- South Korea
- Vietnam
- India
- New Zealand
- Rest of Asia Pacific
Latin America
- Mexico
- Brazil
- Rest of Latin America
Middle East & Africa
- Saudi Arabia
- South Africa
- UAE
- Rest of the Middle East & Africa
Key Players Analysis
In the global pulp market, International Paper remains a front-runner, leveraging extensive operations and strategic sustainability initiatives to meet the growing demand for eco-friendly paper products. Georgia-Pacific Corporation distinguishes itself with innovative production techniques that prioritize energy efficiency, reinforcing its commitment to reducing environmental impact.
Nine Dragons Paper (Holdings) Ltd. continues to dominate the Asian market, expanding its capacity to meet the burgeoning demand in the region. Stora Enso Oyj, based in Helsinki, Finland, excels in integrating digital technology into its operations, enhancing both efficiency and product quality.
Sappi Limited focuses on high-grade specialty pulp, catering to niche markets with specific quality requirements. Meanwhile, Kimberly-Clark Corporation uses its pulp primarily for the production of personal care products, staying ahead through constant innovation in material science.
UPM-Kymmene Oyj emphasizes sustainable forestry practices, aligning with global environmental standards to appeal to a conscientious consumer base. Svenska Cellulosa Aktiebolaget (SCA) invests heavily in eco-efficient technologies, maintaining a competitive edge in the sustainable products market.
Oji Holding Corporation and Nippon Paper Industries Co., Ltd. lead in technological advancements in Japan, focusing on diversified products including bio-materials. The Smurfit Kappa Group and WestRock capitalize on their global reach, offering tailored solutions across various regions, thus maintaining their significant influence in both emerging and established markets. Collectively, these key players drive innovation and sustainability, shaping the dynamics of the global pulp industry.
Market Key Players
- International Paper
- Georgia-Pacific Corporation
- Nine Dragon Paper (Holdings) Ltd.
- Stora Enso Oyj (Helsinki, Finland)
- Sappi Limited
- Kimberly-Clark Corporation
- UPM-KymmeneOyj
- Svenska CellulosaAktiebolaget (SCA)
- Oji Holding Corporation
- Nippon Paper Industries Co., Ltd.
- The Smurfit Kappa Group
- WestRock
Recent Development
- In April 2024, The UPM mill in Uruguay, with a capacity of 2.1 million tonnes, began operations. It is anticipated to reach full capacity by the end of the year, adding considerable volume to the global pulp supply.
- In March 2024, this project began ramping up, expecting to produce about 800,000 tonnes of bleached eucalyptus kraft (BEK) within the year. This expansion represents a significant boost in the global capacity for low-cost kraft pulp.
Report Scope
Report Features Description Market Value (2023) USD 148.2 Billion Forecast Revenue (2033) USD 215.2 Billion CAGR (2024-2032) 3.9% Base Year for Estimation 2023 Historic Period 2016-2023 Forecast Period 2024-2033 Report Coverage Revenue Forecast, Market Dynamics, COVID-19 Impact, Competitive Landscape, Recent Developments Segments Covered By Type of Pulp (Wood Pulp and Non-Wood Pulp), By Grade (Chemical Pulp, Mechanical Pulp, Recycled Pulp), By End Use Industry (Packaging, Printing, Building and Construction) Regional Analysis North America - The US, Canada, Rest of North America, Europe - Germany, France, The UK, Spain, Italy, Russia, Netherlands, Rest of Europe, Asia-Pacific - China, Japan, South Korea, India, New Zealand, Singapore, Thailand, Vietnam, Rest of Asia Pacific, Latin America - Brazil, Mexico, Rest of Latin America, Middle East & Africa - South Africa, Saudi Arabia, UAE, Rest of Middle East & Africa Competitive Landscape International Paper, Georgia-Pacific Corporation, Nine Dragon Paper (Holdings) Ltd., Stora Enso Oyj (Helsinki, Finland), Sappi Limited, Kimberly-Clark Corporation, UPM-KymmeneOyj, Svenska CellulosaAktiebolaget (SCA), Oji Holding Corporation, Nippon Paper Industries Co., Ltd., The Smurfit Kappa Group, WestRock Customization Scope Customization for segments, region/country-level will be provided. Moreover, additional customization can be done based on the requirements. Purchase Options We have three licenses to opt for Single User License, Multi-User License (Up to 5 Users), Corporate Use License (Unlimited User and Printable PDF) -
- 1. Executive Summary
- 1.1. Definition
- 1.2. Taxonomy
- 1.3. Research Scope
- 1.4. Key Analysis
- 1.5. Key Findings by Major Segments
- 1.6. Top strategies by Major Players
- 2. Global Pulp Market Overview
- 2.1. Pulp Market Dynamics
- 2.1.1. Drivers
- 2.1.2. Opportunities
- 2.1.3. Restraints
- 2.1.4. Challenges
- 2.2. Macro-economic Factors
- 2.3. Regulatory Framework
- 2.4. Market Investment Feasibility Index
- 2.5. PEST Analysis
- 2.6. PORTER’S Five Force Analysis
- 2.7. Drivers & Restraints Impact Analysis
- 2.8. Industry Chain Analysis
- 2.9. Cost Structure Analysis
- 2.10. Marketing Strategy
- 2.11. Russia-Ukraine War Impact Analysis
- 2.12. Opportunity Map Analysis
- 2.13. Market Competition Scenario Analysis
- 2.14. Product Life Cycle Analysis
- 2.15. Opportunity Orbits
- 2.16. Manufacturer Intensity Map
- 2.17. Major Companies sales by Value & Volume
- 2.1. Pulp Market Dynamics
- 3. Global Pulp Market Analysis, Opportunity and Forecast, 2016-2032
- 3.1. Global Pulp Market Analysis, 2016-2021
- 3.2. Global Pulp Market Opportunity and Forecast, 2023-2032
- 3.3. Global Pulp Market Analysis, Opportunity and Forecast, By Type of Pulp, 2016-2032
- 3.3.1. Global Pulp Market Analysis by Type of Pulp: Introduction
- 3.3.2. Market Size Absolute $ Opportunity Analysis and Forecast, By Type of Pulp, 2016-2032
- 3.3.3. Wood Pulp
- 3.3.4. Non-Wood Pulp
- 3.4. Global Pulp Market Analysis, Opportunity and Forecast, By Grade, 2016-2032
- 3.4.1. Global Pulp Market Analysis by Grade: Introduction
- 3.4.2. Market Size Absolute $ Opportunity Analysis and Forecast, By Grade, 2016-2032
- 3.4.3. Chemical Pulp
- 3.4.4. Mechanical Pulp
- 3.4.5. Recycled Pulp
- 3.5. Global Pulp Market Analysis, Opportunity and Forecast, By End Use Industry, 2016-2032
- 3.5.1. Global Pulp Market Analysis by End Use Industry: Introduction
- 3.5.2. Market Size Absolute $ Opportunity Analysis and Forecast, By End Use Industry, 2016-2032
- 3.5.3. Packaging
- 3.5.4. Printing
- 3.5.5. Building and Construction
- 4. North America Pulp Market Analysis, Opportunity and Forecast, 2016-2032
- 4.1. North America Pulp Market Analysis, 2016-2021
- 4.2. North America Pulp Market Opportunity and Forecast, 2023-2032
- 4.3. North America Pulp Market Analysis, Opportunity and Forecast, By Type of Pulp, 2016-2032
- 4.3.1. North America Pulp Market Analysis by Type of Pulp: Introduction
- 4.3.2. Market Size Absolute $ Opportunity Analysis and Forecast, By Type of Pulp, 2016-2032
- 4.3.3. Wood Pulp
- 4.3.4. Non-Wood Pulp
- 4.4. North America Pulp Market Analysis, Opportunity and Forecast, By Grade, 2016-2032
- 4.4.1. North America Pulp Market Analysis by Grade: Introduction
- 4.4.2. Market Size Absolute $ Opportunity Analysis and Forecast, By Grade, 2016-2032
- 4.4.3. Chemical Pulp
- 4.4.4. Mechanical Pulp
- 4.4.5. Recycled Pulp
- 4.5. North America Pulp Market Analysis, Opportunity and Forecast, By End Use Industry, 2016-2032
- 4.5.1. North America Pulp Market Analysis by End Use Industry: Introduction
- 4.5.2. Market Size Absolute $ Opportunity Analysis and Forecast, By End Use Industry, 2016-2032
- 4.5.3. Packaging
- 4.5.4. Printing
- 4.5.5. Building and Construction
- 4.6. North America Pulp Market Analysis, Opportunity and Forecast, By Country , 2016-2032
- 4.6.1. North America Pulp Market Analysis by Country : Introduction
- 4.6.2. Market Size Absolute $ Opportunity Analysis and Forecast, Country , 2016-2032
- 4.6.2.1. The US
- 4.6.2.2. Canada
- 4.6.2.3. Mexico
- 5. Western Europe Pulp Market Analysis, Opportunity and Forecast, 2016-2032
- 5.1. Western Europe Pulp Market Analysis, 2016-2021
- 5.2. Western Europe Pulp Market Opportunity and Forecast, 2023-2032
- 5.3. Western Europe Pulp Market Analysis, Opportunity and Forecast, By Type of Pulp, 2016-2032
- 5.3.1. Western Europe Pulp Market Analysis by Type of Pulp: Introduction
- 5.3.2. Market Size Absolute $ Opportunity Analysis and Forecast, By Type of Pulp, 2016-2032
- 5.3.3. Wood Pulp
- 5.3.4. Non-Wood Pulp
- 5.4. Western Europe Pulp Market Analysis, Opportunity and Forecast, By Grade, 2016-2032
- 5.4.1. Western Europe Pulp Market Analysis by Grade: Introduction
- 5.4.2. Market Size Absolute $ Opportunity Analysis and Forecast, By Grade, 2016-2032
- 5.4.3. Chemical Pulp
- 5.4.4. Mechanical Pulp
- 5.4.5. Recycled Pulp
- 5.5. Western Europe Pulp Market Analysis, Opportunity and Forecast, By End Use Industry, 2016-2032
- 5.5.1. Western Europe Pulp Market Analysis by End Use Industry: Introduction
- 5.5.2. Market Size Absolute $ Opportunity Analysis and Forecast, By End Use Industry, 2016-2032
- 5.5.3. Packaging
- 5.5.4. Printing
- 5.5.5. Building and Construction
- 5.6. Western Europe Pulp Market Analysis, Opportunity and Forecast, By Country , 2016-2032
- 5.6.1. Western Europe Pulp Market Analysis by Country : Introduction
- 5.6.2. Market Size Absolute $ Opportunity Analysis and Forecast, Country , 2016-2032
- 5.6.2.1. Germany
- 5.6.2.2. France
- 5.6.2.3. The UK
- 5.6.2.4. Spain
- 5.6.2.5. Italy
- 5.6.2.6. Portugal
- 5.6.2.7. Ireland
- 5.6.2.8. Austria
- 5.6.2.9. Switzerland
- 5.6.2.10. Benelux
- 5.6.2.11. Nordic
- 5.6.2.12. Rest of Western Europe
- 6. Eastern Europe Pulp Market Analysis, Opportunity and Forecast, 2016-2032
- 6.1. Eastern Europe Pulp Market Analysis, 2016-2021
- 6.2. Eastern Europe Pulp Market Opportunity and Forecast, 2023-2032
- 6.3. Eastern Europe Pulp Market Analysis, Opportunity and Forecast, By Type of Pulp, 2016-2032
- 6.3.1. Eastern Europe Pulp Market Analysis by Type of Pulp: Introduction
- 6.3.2. Market Size Absolute $ Opportunity Analysis and Forecast, By Type of Pulp, 2016-2032
- 6.3.3. Wood Pulp
- 6.3.4. Non-Wood Pulp
- 6.4. Eastern Europe Pulp Market Analysis, Opportunity and Forecast, By Grade, 2016-2032
- 6.4.1. Eastern Europe Pulp Market Analysis by Grade: Introduction
- 6.4.2. Market Size Absolute $ Opportunity Analysis and Forecast, By Grade, 2016-2032
- 6.4.3. Chemical Pulp
- 6.4.4. Mechanical Pulp
- 6.4.5. Recycled Pulp
- 6.5. Eastern Europe Pulp Market Analysis, Opportunity and Forecast, By End Use Industry, 2016-2032
- 6.5.1. Eastern Europe Pulp Market Analysis by End Use Industry: Introduction
- 6.5.2. Market Size Absolute $ Opportunity Analysis and Forecast, By End Use Industry, 2016-2032
- 6.5.3. Packaging
- 6.5.4. Printing
- 6.5.5. Building and Construction
- 6.6. Eastern Europe Pulp Market Analysis, Opportunity and Forecast, By Country , 2016-2032
- 6.6.1. Eastern Europe Pulp Market Analysis by Country : Introduction
- 6.6.2. Market Size Absolute $ Opportunity Analysis and Forecast, Country , 2016-2032
- 6.6.2.1. Russia
- 6.6.2.2. Poland
- 6.6.2.3. The Czech Republic
- 6.6.2.4. Greece
- 6.6.2.5. Rest of Eastern Europe
- 7. APAC Pulp Market Analysis, Opportunity and Forecast, 2016-2032
- 7.1. APAC Pulp Market Analysis, 2016-2021
- 7.2. APAC Pulp Market Opportunity and Forecast, 2023-2032
- 7.3. APAC Pulp Market Analysis, Opportunity and Forecast, By Type of Pulp, 2016-2032
- 7.3.1. APAC Pulp Market Analysis by Type of Pulp: Introduction
- 7.3.2. Market Size Absolute $ Opportunity Analysis and Forecast, By Type of Pulp, 2016-2032
- 7.3.3. Wood Pulp
- 7.3.4. Non-Wood Pulp
- 7.4. APAC Pulp Market Analysis, Opportunity and Forecast, By Grade, 2016-2032
- 7.4.1. APAC Pulp Market Analysis by Grade: Introduction
- 7.4.2. Market Size Absolute $ Opportunity Analysis and Forecast, By Grade, 2016-2032
- 7.4.3. Chemical Pulp
- 7.4.4. Mechanical Pulp
- 7.4.5. Recycled Pulp
- 7.5. APAC Pulp Market Analysis, Opportunity and Forecast, By End Use Industry, 2016-2032
- 7.5.1. APAC Pulp Market Analysis by End Use Industry: Introduction
- 7.5.2. Market Size Absolute $ Opportunity Analysis and Forecast, By End Use Industry, 2016-2032
- 7.5.3. Packaging
- 7.5.4. Printing
- 7.5.5. Building and Construction
- 7.6. APAC Pulp Market Analysis, Opportunity and Forecast, By Country , 2016-2032
- 7.6.1. APAC Pulp Market Analysis by Country : Introduction
- 7.6.2. Market Size Absolute $ Opportunity Analysis and Forecast, Country , 2016-2032
- 7.6.2.1. China
- 7.6.2.2. Japan
- 7.6.2.3. South Korea
- 7.6.2.4. India
- 7.6.2.5. Australia & New Zeland
- 7.6.2.6. Indonesia
- 7.6.2.7. Malaysia
- 7.6.2.8. Philippines
- 7.6.2.9. Singapore
- 7.6.2.10. Thailand
- 7.6.2.11. Vietnam
- 7.6.2.12. Rest of APAC
- 8. Latin America Pulp Market Analysis, Opportunity and Forecast, 2016-2032
- 8.1. Latin America Pulp Market Analysis, 2016-2021
- 8.2. Latin America Pulp Market Opportunity and Forecast, 2023-2032
- 8.3. Latin America Pulp Market Analysis, Opportunity and Forecast, By Type of Pulp, 2016-2032
- 8.3.1. Latin America Pulp Market Analysis by Type of Pulp: Introduction
- 8.3.2. Market Size Absolute $ Opportunity Analysis and Forecast, By Type of Pulp, 2016-2032
- 8.3.3. Wood Pulp
- 8.3.4. Non-Wood Pulp
- 8.4. Latin America Pulp Market Analysis, Opportunity and Forecast, By Grade, 2016-2032
- 8.4.1. Latin America Pulp Market Analysis by Grade: Introduction
- 8.4.2. Market Size Absolute $ Opportunity Analysis and Forecast, By Grade, 2016-2032
- 8.4.3. Chemical Pulp
- 8.4.4. Mechanical Pulp
- 8.4.5. Recycled Pulp
- 8.5. Latin America Pulp Market Analysis, Opportunity and Forecast, By End Use Industry, 2016-2032
- 8.5.1. Latin America Pulp Market Analysis by End Use Industry: Introduction
- 8.5.2. Market Size Absolute $ Opportunity Analysis and Forecast, By End Use Industry, 2016-2032
- 8.5.3. Packaging
- 8.5.4. Printing
- 8.5.5. Building and Construction
- 8.6. Latin America Pulp Market Analysis, Opportunity and Forecast, By Country , 2016-2032
- 8.6.1. Latin America Pulp Market Analysis by Country : Introduction
- 8.6.2. Market Size Absolute $ Opportunity Analysis and Forecast, Country , 2016-2032
- 8.6.2.1. Brazil
- 8.6.2.2. Colombia
- 8.6.2.3. Chile
- 8.6.2.4. Argentina
- 8.6.2.5. Costa Rica
- 8.6.2.6. Rest of Latin America
- 9. Middle East & Africa Pulp Market Analysis, Opportunity and Forecast, 2016-2032
- 9.1. Middle East & Africa Pulp Market Analysis, 2016-2021
- 9.2. Middle East & Africa Pulp Market Opportunity and Forecast, 2023-2032
- 9.3. Middle East & Africa Pulp Market Analysis, Opportunity and Forecast, By Type of Pulp, 2016-2032
- 9.3.1. Middle East & Africa Pulp Market Analysis by Type of Pulp: Introduction
- 9.3.2. Market Size Absolute $ Opportunity Analysis and Forecast, By Type of Pulp, 2016-2032
- 9.3.3. Wood Pulp
- 9.3.4. Non-Wood Pulp
- 9.4. Middle East & Africa Pulp Market Analysis, Opportunity and Forecast, By Grade, 2016-2032
- 9.4.1. Middle East & Africa Pulp Market Analysis by Grade: Introduction
- 9.4.2. Market Size Absolute $ Opportunity Analysis and Forecast, By Grade, 2016-2032
- 9.4.3. Chemical Pulp
- 9.4.4. Mechanical Pulp
- 9.4.5. Recycled Pulp
- 9.5. Middle East & Africa Pulp Market Analysis, Opportunity and Forecast, By End Use Industry, 2016-2032
- 9.5.1. Middle East & Africa Pulp Market Analysis by End Use Industry: Introduction
- 9.5.2. Market Size Absolute $ Opportunity Analysis and Forecast, By End Use Industry, 2016-2032
- 9.5.3. Packaging
- 9.5.4. Printing
- 9.5.5. Building and Construction
- 9.6. Middle East & Africa Pulp Market Analysis, Opportunity and Forecast, By Country , 2016-2032
- 9.6.1. Middle East & Africa Pulp Market Analysis by Country : Introduction
- 9.6.2. Market Size Absolute $ Opportunity Analysis and Forecast, Country , 2016-2032
- 9.6.2.1. Algeria
- 9.6.2.2. Egypt
- 9.6.2.3. Israel
- 9.6.2.4. Kuwait
- 9.6.2.5. Nigeria
- 9.6.2.6. Saudi Arabia
- 9.6.2.7. South Africa
- 9.6.2.8. Turkey
- 9.6.2.9. The UAE
- 9.6.2.10. Rest of MEA
- 10. Global Pulp Market Analysis, Opportunity and Forecast, By Region , 2016-2032
- 10.1. Global Pulp Market Analysis by Region : Introduction
- 10.2. Market Size Absolute $ Opportunity Analysis and Forecast, By Region , 2016-2032
- 10.2.1. North America
- 10.2.2. Western Europe
- 10.2.3. Eastern Europe
- 10.2.4. APAC
- 10.2.5. Latin America
- 10.2.6. Middle East & Africa
- 11. Global Pulp Market Competitive Landscape, Market Share Analysis, and Company Profiles
- 11.1. Market Share Analysis
- 11.2. Company Profiles
- 11.3. International Paper
- 11.3.1. Company Overview
- 11.3.2. Financial Highlights
- 11.3.3. Product Portfolio
- 11.3.4. SWOT Analysis
- 11.3.5. Key Strategies and Developments
- 11.4. Georgia-Pacific Corporation
- 11.4.1. Company Overview
- 11.4.2. Financial Highlights
- 11.4.3. Product Portfolio
- 11.4.4. SWOT Analysis
- 11.4.5. Key Strategies and Developments
- 11.5. Nine Dragon Paper (Holdings) Ltd.
- 11.5.1. Company Overview
- 11.5.2. Financial Highlights
- 11.5.3. Product Portfolio
- 11.5.4. SWOT Analysis
- 11.5.5. Key Strategies and Developments
- 11.6. Stora Enso Oyj (Helsinki, Finland)
- 11.6.1. Company Overview
- 11.6.2. Financial Highlights
- 11.6.3. Product Portfolio
- 11.6.4. SWOT Analysis
- 11.6.5. Key Strategies and Developments
- 11.7. Sappi Limited
- 11.7.1. Company Overview
- 11.7.2. Financial Highlights
- 11.7.3. Product Portfolio
- 11.7.4. SWOT Analysis
- 11.7.5. Key Strategies and Developments
- 11.8. Kimberly-Clark Corporation
- 11.8.1. Company Overview
- 11.8.2. Financial Highlights
- 11.8.3. Product Portfolio
- 11.8.4. SWOT Analysis
- 11.8.5. Key Strategies and Developments
- 11.9. UPM-KymmeneOyj
- 11.9.1. Company Overview
- 11.9.2. Financial Highlights
- 11.9.3. Product Portfolio
- 11.9.4. SWOT Analysis
- 11.9.5. Key Strategies and Developments
- 11.10. Svenska CellulosaAktiebolaget (SCA)
- 11.10.1. Company Overview
- 11.10.2. Financial Highlights
- 11.10.3. Product Portfolio
- 11.10.4. SWOT Analysis
- 11.10.5. Key Strategies and Developments
- 11.11. Oji Holding Corporation
- 11.11.1. Company Overview
- 11.11.2. Financial Highlights
- 11.11.3. Product Portfolio
- 11.11.4. SWOT Analysis
- 11.11.5. Key Strategies and Developments
- 11.12. Nippon Paper Industries Co., Ltd.
- 11.12.1. Company Overview
- 11.12.2. Financial Highlights
- 11.12.3. Product Portfolio
- 11.12.4. SWOT Analysis
- 11.12.5. Key Strategies and Developments
- 11.13.1. Company Overview
- 11.13.2. Financial Highlights
- 11.13.3. Product Portfolio
- 11.13.4. SWOT Analysis
- 11.13.5. Key Strategies and Developments
- 11.14. The Smurfit Kappa Group
- 11.14.1. Company Overview
- 11.14.2. Financial Highlights
- 11.14.3. Product Portfolio
- 11.14.4. SWOT Analysis
- 11.14.5. Key Strategies and Developments
- 12. Assumptions and Acronyms
- 13. Research Methodology
- 14. Contact
"
- List of Figures
- "
- Figure 1: Global Pulp Market Revenue (US$ Mn) Market Share by Type of Pulp in 2022
- Figure 2: Global Pulp Market Market Attractiveness Analysis by Type of Pulp, 2016-2032
- Figure 3: Global Pulp Market Revenue (US$ Mn) Market Share by Gradein 2022
- Figure 4: Global Pulp Market Market Attractiveness Analysis by Grade, 2016-2032
- Figure 5: Global Pulp Market Revenue (US$ Mn) Market Share by End Use Industryin 2022
- Figure 6: Global Pulp Market Market Attractiveness Analysis by End Use Industry, 2016-2032
- Figure 7: Global Pulp Market Revenue (US$ Mn) Market Share by Region in 2022
- Figure 8: Global Pulp Market Market Attractiveness Analysis by Region, 2016-2032
- Figure 9: Global Pulp Market Market Revenue (US$ Mn) (2016-2032)
- Figure 10: Global Pulp Market Market Revenue (US$ Mn) Comparison by Region (2016-2032)
- Figure 11: Global Pulp Market Market Revenue (US$ Mn) Comparison by Type of Pulp (2016-2032)
- Figure 12: Global Pulp Market Market Revenue (US$ Mn) Comparison by Grade (2016-2032)
- Figure 13: Global Pulp Market Market Revenue (US$ Mn) Comparison by End Use Industry (2016-2032)
- Figure 14: Global Pulp Market Market Y-o-Y Growth Rate Comparison by Region (2016-2032)
- Figure 15: Global Pulp Market Market Y-o-Y Growth Rate Comparison by Type of Pulp (2016-2032)
- Figure 16: Global Pulp Market Market Y-o-Y Growth Rate Comparison by Grade (2016-2032)
- Figure 17: Global Pulp Market Market Y-o-Y Growth Rate Comparison by End Use Industry (2016-2032)
- Figure 18: Global Pulp Market Market Share Comparison by Region (2016-2032)
- Figure 19: Global Pulp Market Market Share Comparison by Type of Pulp (2016-2032)
- Figure 20: Global Pulp Market Market Share Comparison by Grade (2016-2032)
- Figure 21: Global Pulp Market Market Share Comparison by End Use Industry (2016-2032)
- Figure 22: North America Pulp Market Revenue (US$ Mn) Market Share by Type of Pulpin 2022
- Figure 23: North America Pulp Market Market Attractiveness Analysis by Type of Pulp, 2016-2032
- Figure 24: North America Pulp Market Revenue (US$ Mn) Market Share by Gradein 2022
- Figure 25: North America Pulp Market Market Attractiveness Analysis by Grade, 2016-2032
- Figure 26: North America Pulp Market Revenue (US$ Mn) Market Share by End Use Industryin 2022
- Figure 27: North America Pulp Market Market Attractiveness Analysis by End Use Industry, 2016-2032
- Figure 28: North America Pulp Market Revenue (US$ Mn) Market Share by Country in 2022
- Figure 29: North America Pulp Market Market Attractiveness Analysis by Country, 2016-2032
- Figure 30: North America Pulp Market Market Revenue (US$ Mn) (2016-2032)
- Figure 31: North America Pulp Market Market Revenue (US$ Mn) Comparison by Country (2016-2032)
- Figure 32: North America Pulp Market Market Revenue (US$ Mn) Comparison by Type of Pulp (2016-2032)
- Figure 33: North America Pulp Market Market Revenue (US$ Mn) Comparison by Grade (2016-2032)
- Figure 34: North America Pulp Market Market Revenue (US$ Mn) Comparison by End Use Industry (2016-2032)
- Figure 35: North America Pulp Market Market Y-o-Y Growth Rate Comparison by Country (2016-2032)
- Figure 36: North America Pulp Market Market Y-o-Y Growth Rate Comparison by Type of Pulp (2016-2032)
- Figure 37: North America Pulp Market Market Y-o-Y Growth Rate Comparison by Grade (2016-2032)
- Figure 38: North America Pulp Market Market Y-o-Y Growth Rate Comparison by End Use Industry (2016-2032)
- Figure 39: North America Pulp Market Market Share Comparison by Country (2016-2032)
- Figure 40: North America Pulp Market Market Share Comparison by Type of Pulp (2016-2032)
- Figure 41: North America Pulp Market Market Share Comparison by Grade (2016-2032)
- Figure 42: North America Pulp Market Market Share Comparison by End Use Industry (2016-2032)
- Figure 43: Western Europe Pulp Market Revenue (US$ Mn) Market Share by Type of Pulpin 2022
- Figure 44: Western Europe Pulp Market Market Attractiveness Analysis by Type of Pulp, 2016-2032
- Figure 45: Western Europe Pulp Market Revenue (US$ Mn) Market Share by Gradein 2022
- Figure 46: Western Europe Pulp Market Market Attractiveness Analysis by Grade, 2016-2032
- Figure 47: Western Europe Pulp Market Revenue (US$ Mn) Market Share by End Use Industryin 2022
- Figure 48: Western Europe Pulp Market Market Attractiveness Analysis by End Use Industry, 2016-2032
- Figure 49: Western Europe Pulp Market Revenue (US$ Mn) Market Share by Country in 2022
- Figure 50: Western Europe Pulp Market Market Attractiveness Analysis by Country, 2016-2032
- Figure 51: Western Europe Pulp Market Market Revenue (US$ Mn) (2016-2032)
- Figure 52: Western Europe Pulp Market Market Revenue (US$ Mn) Comparison by Country (2016-2032)
- Figure 53: Western Europe Pulp Market Market Revenue (US$ Mn) Comparison by Type of Pulp (2016-2032)
- Figure 54: Western Europe Pulp Market Market Revenue (US$ Mn) Comparison by Grade (2016-2032)
- Figure 55: Western Europe Pulp Market Market Revenue (US$ Mn) Comparison by End Use Industry (2016-2032)
- Figure 56: Western Europe Pulp Market Market Y-o-Y Growth Rate Comparison by Country (2016-2032)
- Figure 57: Western Europe Pulp Market Market Y-o-Y Growth Rate Comparison by Type of Pulp (2016-2032)
- Figure 58: Western Europe Pulp Market Market Y-o-Y Growth Rate Comparison by Grade (2016-2032)
- Figure 59: Western Europe Pulp Market Market Y-o-Y Growth Rate Comparison by End Use Industry (2016-2032)
- Figure 60: Western Europe Pulp Market Market Share Comparison by Country (2016-2032)
- Figure 61: Western Europe Pulp Market Market Share Comparison by Type of Pulp (2016-2032)
- Figure 62: Western Europe Pulp Market Market Share Comparison by Grade (2016-2032)
- Figure 63: Western Europe Pulp Market Market Share Comparison by End Use Industry (2016-2032)
- Figure 64: Eastern Europe Pulp Market Revenue (US$ Mn) Market Share by Type of Pulpin 2022
- Figure 65: Eastern Europe Pulp Market Market Attractiveness Analysis by Type of Pulp, 2016-2032
- Figure 66: Eastern Europe Pulp Market Revenue (US$ Mn) Market Share by Gradein 2022
- Figure 67: Eastern Europe Pulp Market Market Attractiveness Analysis by Grade, 2016-2032
- Figure 68: Eastern Europe Pulp Market Revenue (US$ Mn) Market Share by End Use Industryin 2022
- Figure 69: Eastern Europe Pulp Market Market Attractiveness Analysis by End Use Industry, 2016-2032
- Figure 70: Eastern Europe Pulp Market Revenue (US$ Mn) Market Share by Country in 2022
- Figure 71: Eastern Europe Pulp Market Market Attractiveness Analysis by Country, 2016-2032
- Figure 72: Eastern Europe Pulp Market Market Revenue (US$ Mn) (2016-2032)
- Figure 73: Eastern Europe Pulp Market Market Revenue (US$ Mn) Comparison by Country (2016-2032)
- Figure 74: Eastern Europe Pulp Market Market Revenue (US$ Mn) Comparison by Type of Pulp (2016-2032)
- Figure 75: Eastern Europe Pulp Market Market Revenue (US$ Mn) Comparison by Grade (2016-2032)
- Figure 76: Eastern Europe Pulp Market Market Revenue (US$ Mn) Comparison by End Use Industry (2016-2032)
- Figure 77: Eastern Europe Pulp Market Market Y-o-Y Growth Rate Comparison by Country (2016-2032)
- Figure 78: Eastern Europe Pulp Market Market Y-o-Y Growth Rate Comparison by Type of Pulp (2016-2032)
- Figure 79: Eastern Europe Pulp Market Market Y-o-Y Growth Rate Comparison by Grade (2016-2032)
- Figure 80: Eastern Europe Pulp Market Market Y-o-Y Growth Rate Comparison by End Use Industry (2016-2032)
- Figure 81: Eastern Europe Pulp Market Market Share Comparison by Country (2016-2032)
- Figure 82: Eastern Europe Pulp Market Market Share Comparison by Type of Pulp (2016-2032)
- Figure 83: Eastern Europe Pulp Market Market Share Comparison by Grade (2016-2032)
- Figure 84: Eastern Europe Pulp Market Market Share Comparison by End Use Industry (2016-2032)
- Figure 85: APAC Pulp Market Revenue (US$ Mn) Market Share by Type of Pulpin 2022
- Figure 86: APAC Pulp Market Market Attractiveness Analysis by Type of Pulp, 2016-2032
- Figure 87: APAC Pulp Market Revenue (US$ Mn) Market Share by Gradein 2022
- Figure 88: APAC Pulp Market Market Attractiveness Analysis by Grade, 2016-2032
- Figure 89: APAC Pulp Market Revenue (US$ Mn) Market Share by End Use Industryin 2022
- Figure 90: APAC Pulp Market Market Attractiveness Analysis by End Use Industry, 2016-2032
- Figure 91: APAC Pulp Market Revenue (US$ Mn) Market Share by Country in 2022
- Figure 92: APAC Pulp Market Market Attractiveness Analysis by Country, 2016-2032
- Figure 93: APAC Pulp Market Market Revenue (US$ Mn) (2016-2032)
- Figure 94: APAC Pulp Market Market Revenue (US$ Mn) Comparison by Country (2016-2032)
- Figure 95: APAC Pulp Market Market Revenue (US$ Mn) Comparison by Type of Pulp (2016-2032)
- Figure 96: APAC Pulp Market Market Revenue (US$ Mn) Comparison by Grade (2016-2032)
- Figure 97: APAC Pulp Market Market Revenue (US$ Mn) Comparison by End Use Industry (2016-2032)
- Figure 98: APAC Pulp Market Market Y-o-Y Growth Rate Comparison by Country (2016-2032)
- Figure 99: APAC Pulp Market Market Y-o-Y Growth Rate Comparison by Type of Pulp (2016-2032)
- Figure 100: APAC Pulp Market Market Y-o-Y Growth Rate Comparison by Grade (2016-2032)
- Figure 101: APAC Pulp Market Market Y-o-Y Growth Rate Comparison by End Use Industry (2016-2032)
- Figure 102: APAC Pulp Market Market Share Comparison by Country (2016-2032)
- Figure 103: APAC Pulp Market Market Share Comparison by Type of Pulp (2016-2032)
- Figure 104: APAC Pulp Market Market Share Comparison by Grade (2016-2032)
- Figure 105: APAC Pulp Market Market Share Comparison by End Use Industry (2016-2032)
- Figure 106: Latin America Pulp Market Revenue (US$ Mn) Market Share by Type of Pulpin 2022
- Figure 107: Latin America Pulp Market Market Attractiveness Analysis by Type of Pulp, 2016-2032
- Figure 108: Latin America Pulp Market Revenue (US$ Mn) Market Share by Gradein 2022
- Figure 109: Latin America Pulp Market Market Attractiveness Analysis by Grade, 2016-2032
- Figure 110: Latin America Pulp Market Revenue (US$ Mn) Market Share by End Use Industryin 2022
- Figure 111: Latin America Pulp Market Market Attractiveness Analysis by End Use Industry, 2016-2032
- Figure 112: Latin America Pulp Market Revenue (US$ Mn) Market Share by Country in 2022
- Figure 113: Latin America Pulp Market Market Attractiveness Analysis by Country, 2016-2032
- Figure 114: Latin America Pulp Market Market Revenue (US$ Mn) (2016-2032)
- Figure 115: Latin America Pulp Market Market Revenue (US$ Mn) Comparison by Country (2016-2032)
- Figure 116: Latin America Pulp Market Market Revenue (US$ Mn) Comparison by Type of Pulp (2016-2032)
- Figure 117: Latin America Pulp Market Market Revenue (US$ Mn) Comparison by Grade (2016-2032)
- Figure 118: Latin America Pulp Market Market Revenue (US$ Mn) Comparison by End Use Industry (2016-2032)
- Figure 119: Latin America Pulp Market Market Y-o-Y Growth Rate Comparison by Country (2016-2032)
- Figure 120: Latin America Pulp Market Market Y-o-Y Growth Rate Comparison by Type of Pulp (2016-2032)
- Figure 121: Latin America Pulp Market Market Y-o-Y Growth Rate Comparison by Grade (2016-2032)
- Figure 122: Latin America Pulp Market Market Y-o-Y Growth Rate Comparison by End Use Industry (2016-2032)
- Figure 123: Latin America Pulp Market Market Share Comparison by Country (2016-2032)
- Figure 124: Latin America Pulp Market Market Share Comparison by Type of Pulp (2016-2032)
- Figure 125: Latin America Pulp Market Market Share Comparison by Grade (2016-2032)
- Figure 126: Latin America Pulp Market Market Share Comparison by End Use Industry (2016-2032)
- Figure 127: Middle East & Africa Pulp Market Revenue (US$ Mn) Market Share by Type of Pulpin 2022
- Figure 128: Middle East & Africa Pulp Market Market Attractiveness Analysis by Type of Pulp, 2016-2032
- Figure 129: Middle East & Africa Pulp Market Revenue (US$ Mn) Market Share by Gradein 2022
- Figure 130: Middle East & Africa Pulp Market Market Attractiveness Analysis by Grade, 2016-2032
- Figure 131: Middle East & Africa Pulp Market Revenue (US$ Mn) Market Share by End Use Industryin 2022
- Figure 132: Middle East & Africa Pulp Market Market Attractiveness Analysis by End Use Industry, 2016-2032
- Figure 133: Middle East & Africa Pulp Market Revenue (US$ Mn) Market Share by Country in 2022
- Figure 134: Middle East & Africa Pulp Market Market Attractiveness Analysis by Country, 2016-2032
- Figure 135: Middle East & Africa Pulp Market Market Revenue (US$ Mn) (2016-2032)
- Figure 136: Middle East & Africa Pulp Market Market Revenue (US$ Mn) Comparison by Country (2016-2032)
- Figure 137: Middle East & Africa Pulp Market Market Revenue (US$ Mn) Comparison by Type of Pulp (2016-2032)
- Figure 138: Middle East & Africa Pulp Market Market Revenue (US$ Mn) Comparison by Grade (2016-2032)
- Figure 139: Middle East & Africa Pulp Market Market Revenue (US$ Mn) Comparison by End Use Industry (2016-2032)
- Figure 140: Middle East & Africa Pulp Market Market Y-o-Y Growth Rate Comparison by Country (2016-2032)
- Figure 141: Middle East & Africa Pulp Market Market Y-o-Y Growth Rate Comparison by Type of Pulp (2016-2032)
- Figure 142: Middle East & Africa Pulp Market Market Y-o-Y Growth Rate Comparison by Grade (2016-2032)
- Figure 143: Middle East & Africa Pulp Market Market Y-o-Y Growth Rate Comparison by End Use Industry (2016-2032)
- Figure 144: Middle East & Africa Pulp Market Market Share Comparison by Country (2016-2032)
- Figure 145: Middle East & Africa Pulp Market Market Share Comparison by Type of Pulp (2016-2032)
- Figure 146: Middle East & Africa Pulp Market Market Share Comparison by Grade (2016-2032)
- Figure 147: Middle East & Africa Pulp Market Market Share Comparison by End Use Industry (2016-2032)
"
- List of Tables
- "
- Table 1: Global Pulp Market Market Comparison by Type of Pulp (2016-2032)
- Table 2: Global Pulp Market Market Comparison by Grade (2016-2032)
- Table 3: Global Pulp Market Market Comparison by End Use Industry (2016-2032)
- Table 4: Global Pulp Market Revenue (US$ Mn) Comparison by Region (2016-2032)
- Table 5: Global Pulp Market Market Revenue (US$ Mn) (2016-2032)
- Table 6: Global Pulp Market Market Revenue (US$ Mn) Comparison by Region (2016-2032)
- Table 7: Global Pulp Market Market Revenue (US$ Mn) Comparison by Type of Pulp (2016-2032)
- Table 8: Global Pulp Market Market Revenue (US$ Mn) Comparison by Grade (2016-2032)
- Table 9: Global Pulp Market Market Revenue (US$ Mn) Comparison by End Use Industry (2016-2032)
- Table 10: Global Pulp Market Market Y-o-Y Growth Rate Comparison by Region (2016-2032)
- Table 11: Global Pulp Market Market Y-o-Y Growth Rate Comparison by Type of Pulp (2016-2032)
- Table 12: Global Pulp Market Market Y-o-Y Growth Rate Comparison by Grade (2016-2032)
- Table 13: Global Pulp Market Market Y-o-Y Growth Rate Comparison by End Use Industry (2016-2032)
- Table 14: Global Pulp Market Market Share Comparison by Region (2016-2032)
- Table 15: Global Pulp Market Market Share Comparison by Type of Pulp (2016-2032)
- Table 16: Global Pulp Market Market Share Comparison by Grade (2016-2032)
- Table 17: Global Pulp Market Market Share Comparison by End Use Industry (2016-2032)
- Table 18: North America Pulp Market Market Comparison by Grade (2016-2032)
- Table 19: North America Pulp Market Market Comparison by End Use Industry (2016-2032)
- Table 20: North America Pulp Market Revenue (US$ Mn) Comparison by Country (2016-2032)
- Table 21: North America Pulp Market Market Revenue (US$ Mn) (2016-2032)
- Table 22: North America Pulp Market Market Revenue (US$ Mn) Comparison by Country (2016-2032)
- Table 23: North America Pulp Market Market Revenue (US$ Mn) Comparison by Type of Pulp (2016-2032)
- Table 24: North America Pulp Market Market Revenue (US$ Mn) Comparison by Grade (2016-2032)
- Table 25: North America Pulp Market Market Revenue (US$ Mn) Comparison by End Use Industry (2016-2032)
- Table 26: North America Pulp Market Market Y-o-Y Growth Rate Comparison by Country (2016-2032)
- Table 27: North America Pulp Market Market Y-o-Y Growth Rate Comparison by Type of Pulp (2016-2032)
- Table 28: North America Pulp Market Market Y-o-Y Growth Rate Comparison by Grade (2016-2032)
- Table 29: North America Pulp Market Market Y-o-Y Growth Rate Comparison by End Use Industry (2016-2032)
- Table 30: North America Pulp Market Market Share Comparison by Country (2016-2032)
- Table 31: North America Pulp Market Market Share Comparison by Type of Pulp (2016-2032)
- Table 32: North America Pulp Market Market Share Comparison by Grade (2016-2032)
- Table 33: North America Pulp Market Market Share Comparison by End Use Industry (2016-2032)
- Table 34: Western Europe Pulp Market Market Comparison by Type of Pulp (2016-2032)
- Table 35: Western Europe Pulp Market Market Comparison by Grade (2016-2032)
- Table 36: Western Europe Pulp Market Market Comparison by End Use Industry (2016-2032)
- Table 37: Western Europe Pulp Market Revenue (US$ Mn) Comparison by Country (2016-2032)
- Table 38: Western Europe Pulp Market Market Revenue (US$ Mn) (2016-2032)
- Table 39: Western Europe Pulp Market Market Revenue (US$ Mn) Comparison by Country (2016-2032)
- Table 40: Western Europe Pulp Market Market Revenue (US$ Mn) Comparison by Type of Pulp (2016-2032)
- Table 41: Western Europe Pulp Market Market Revenue (US$ Mn) Comparison by Grade (2016-2032)
- Table 42: Western Europe Pulp Market Market Revenue (US$ Mn) Comparison by End Use Industry (2016-2032)
- Table 43: Western Europe Pulp Market Market Y-o-Y Growth Rate Comparison by Country (2016-2032)
- Table 44: Western Europe Pulp Market Market Y-o-Y Growth Rate Comparison by Type of Pulp (2016-2032)
- Table 45: Western Europe Pulp Market Market Y-o-Y Growth Rate Comparison by Grade (2016-2032)
- Table 46: Western Europe Pulp Market Market Y-o-Y Growth Rate Comparison by End Use Industry (2016-2032)
- Table 47: Western Europe Pulp Market Market Share Comparison by Country (2016-2032)
- Table 48: Western Europe Pulp Market Market Share Comparison by Type of Pulp (2016-2032)
- Table 49: Western Europe Pulp Market Market Share Comparison by Grade (2016-2032)
- Table 50: Western Europe Pulp Market Market Share Comparison by End Use Industry (2016-2032)
- Table 51: Eastern Europe Pulp Market Market Comparison by Type of Pulp (2016-2032)
- Table 52: Eastern Europe Pulp Market Market Comparison by Grade (2016-2032)
- Table 53: Eastern Europe Pulp Market Market Comparison by End Use Industry (2016-2032)
- Table 54: Eastern Europe Pulp Market Revenue (US$ Mn) Comparison by Country (2016-2032)
- Table 55: Eastern Europe Pulp Market Market Revenue (US$ Mn) (2016-2032)
- Table 56: Eastern Europe Pulp Market Market Revenue (US$ Mn) Comparison by Country (2016-2032)
- Table 57: Eastern Europe Pulp Market Market Revenue (US$ Mn) Comparison by Type of Pulp (2016-2032)
- Table 58: Eastern Europe Pulp Market Market Revenue (US$ Mn) Comparison by Grade (2016-2032)
- Table 59: Eastern Europe Pulp Market Market Revenue (US$ Mn) Comparison by End Use Industry (2016-2032)
- Table 60: Eastern Europe Pulp Market Market Y-o-Y Growth Rate Comparison by Country (2016-2032)
- Table 61: Eastern Europe Pulp Market Market Y-o-Y Growth Rate Comparison by Type of Pulp (2016-2032)
- Table 62: Eastern Europe Pulp Market Market Y-o-Y Growth Rate Comparison by Grade (2016-2032)
- Table 63: Eastern Europe Pulp Market Market Y-o-Y Growth Rate Comparison by End Use Industry (2016-2032)
- Table 64: Eastern Europe Pulp Market Market Share Comparison by Country (2016-2032)
- Table 65: Eastern Europe Pulp Market Market Share Comparison by Type of Pulp (2016-2032)
- Table 66: Eastern Europe Pulp Market Market Share Comparison by Grade (2016-2032)
- Table 67: Eastern Europe Pulp Market Market Share Comparison by End Use Industry (2016-2032)
- Table 68: APAC Pulp Market Market Comparison by Type of Pulp (2016-2032)
- Table 69: APAC Pulp Market Market Comparison by Grade (2016-2032)
- Table 70: APAC Pulp Market Market Comparison by End Use Industry (2016-2032)
- Table 71: APAC Pulp Market Revenue (US$ Mn) Comparison by Country (2016-2032)
- Table 72: APAC Pulp Market Market Revenue (US$ Mn) (2016-2032)
- Table 73: APAC Pulp Market Market Revenue (US$ Mn) Comparison by Country (2016-2032)
- Table 74: APAC Pulp Market Market Revenue (US$ Mn) Comparison by Type of Pulp (2016-2032)
- Table 75: APAC Pulp Market Market Revenue (US$ Mn) Comparison by Grade (2016-2032)
- Table 76: APAC Pulp Market Market Revenue (US$ Mn) Comparison by End Use Industry (2016-2032)
- Table 77: APAC Pulp Market Market Y-o-Y Growth Rate Comparison by Country (2016-2032)
- Table 78: APAC Pulp Market Market Y-o-Y Growth Rate Comparison by Type of Pulp (2016-2032)
- Table 79: APAC Pulp Market Market Y-o-Y Growth Rate Comparison by Grade (2016-2032)
- Table 80: APAC Pulp Market Market Y-o-Y Growth Rate Comparison by End Use Industry (2016-2032)
- Table 81: APAC Pulp Market Market Share Comparison by Country (2016-2032)
- Table 82: APAC Pulp Market Market Share Comparison by Type of Pulp (2016-2032)
- Table 83: APAC Pulp Market Market Share Comparison by Grade (2016-2032)
- Table 84: APAC Pulp Market Market Share Comparison by End Use Industry (2016-2032)
- Table 85: Latin America Pulp Market Market Comparison by Type of Pulp (2016-2032)
- Table 86: Latin America Pulp Market Market Comparison by Grade (2016-2032)
- Table 87: Latin America Pulp Market Market Comparison by End Use Industry (2016-2032)
- Table 88: Latin America Pulp Market Revenue (US$ Mn) Comparison by Country (2016-2032)
- Table 89: Latin America Pulp Market Market Revenue (US$ Mn) (2016-2032)
- Table 90: Latin America Pulp Market Market Revenue (US$ Mn) Comparison by Country (2016-2032)
- Table 91: Latin America Pulp Market Market Revenue (US$ Mn) Comparison by Type of Pulp (2016-2032)
- Table 92: Latin America Pulp Market Market Revenue (US$ Mn) Comparison by Grade (2016-2032)
- Table 93: Latin America Pulp Market Market Revenue (US$ Mn) Comparison by End Use Industry (2016-2032)
- Table 94: Latin America Pulp Market Market Y-o-Y Growth Rate Comparison by Country (2016-2032)
- Table 95: Latin America Pulp Market Market Y-o-Y Growth Rate Comparison by Type of Pulp (2016-2032)
- Table 96: Latin America Pulp Market Market Y-o-Y Growth Rate Comparison by Grade (2016-2032)
- Table 97: Latin America Pulp Market Market Y-o-Y Growth Rate Comparison by End Use Industry (2016-2032)
- Table 98: Latin America Pulp Market Market Share Comparison by Country (2016-2032)
- Table 99: Latin America Pulp Market Market Share Comparison by Type of Pulp (2016-2032)
- Table 100: Latin America Pulp Market Market Share Comparison by Grade (2016-2032)
- Table 101: Latin America Pulp Market Market Share Comparison by End Use Industry (2016-2032)
- Table 102: Middle East & Africa Pulp Market Market Comparison by Type of Pulp (2016-2032)
- Table 103: Middle East & Africa Pulp Market Market Comparison by Grade (2016-2032)
- Table 104: Middle East & Africa Pulp Market Market Comparison by End Use Industry (2016-2032)
- Table 105: Middle East & Africa Pulp Market Revenue (US$ Mn) Comparison by Country (2016-2032)
- Table 106: Middle East & Africa Pulp Market Market Revenue (US$ Mn) (2016-2032)
- Table 107: Middle East & Africa Pulp Market Market Revenue (US$ Mn) Comparison by Country (2016-2032)
- Table 108: Middle East & Africa Pulp Market Market Revenue (US$ Mn) Comparison by Type of Pulp (2016-2032)
- Table 109: Middle East & Africa Pulp Market Market Revenue (US$ Mn) Comparison by Grade (2016-2032)
- Table 110: Middle East & Africa Pulp Market Market Revenue (US$ Mn) Comparison by End Use Industry (2016-2032)
- Table 111: Middle East & Africa Pulp Market Market Y-o-Y Growth Rate Comparison by Country (2016-2032)
- Table 112: Middle East & Africa Pulp Market Market Y-o-Y Growth Rate Comparison by Type of Pulp (2016-2032)
- Table 113: Middle East & Africa Pulp Market Market Y-o-Y Growth Rate Comparison by Grade (2016-2032)
- Table 114: Middle East & Africa Pulp Market Market Y-o-Y Growth Rate Comparison by End Use Industry (2016-2032)
- Table 115: Middle East & Africa Pulp Market Market Share Comparison by Country (2016-2032)
- Table 116: Middle East & Africa Pulp Market Market Share Comparison by Type of Pulp (2016-2032)
- Table 117: Middle East & Africa Pulp Market Market Share Comparison by Grade (2016-2032)
- Table 118: Middle East & Africa Pulp Market Market Share Comparison by End Use Industry (2016-2032)
- 1. Executive Summary
-
- International Paper
- Georgia-Pacific Corporation
- Nine Dragon Paper (Holdings) Ltd.
- Stora Enso Oyj (Helsinki, Finland)
- Sappi Limited
- Kimberly-Clark Corporation
- UPM-KymmeneOyj
- Svenska CellulosaAktiebolaget (SCA)
- Oji Holding Corporation
- Nippon Paper Industries Co., Ltd.
- The Smurfit Kappa Group
- WestRock
Our Clients


View Our Licence Options
