
Global Protective Textiles Market By Material(Aramid & Blends, Polyamide, Laminated Polyesters, Cotton Fibers, Polyolefin & Blends, Others), By Application(Mechanical, Thermal, Electrical, Chemical, Radiation, Others), By End-Use(Defence, Manufacturing and Construction, Mining, Oil and Gas, Space Exploration, Healthcare, Emergency Services, Others), By Region And Companies - Industry Segment Outlook, Market Assessment, Competition Scenario, Trends, And Forecast 2024-2033
-
7585
-
June 2024
-
300
-


-
This report was compiled by Research Team Research team of over 50 passionate professionals leverages advanced research methodologies and analytical expertise to deliver insightful, data-driven market intelligence that empowers businesses across diverse industries to make strategic, well-informed Correspondence Research Team Linkedin | Detailed Market research Methodology Our methodology involves a mix of primary research, including interviews with leading mental health experts, and secondary research from reputable medical journals and databases. View Detailed Methodology Page
-
Quick Navigation
Report Overview
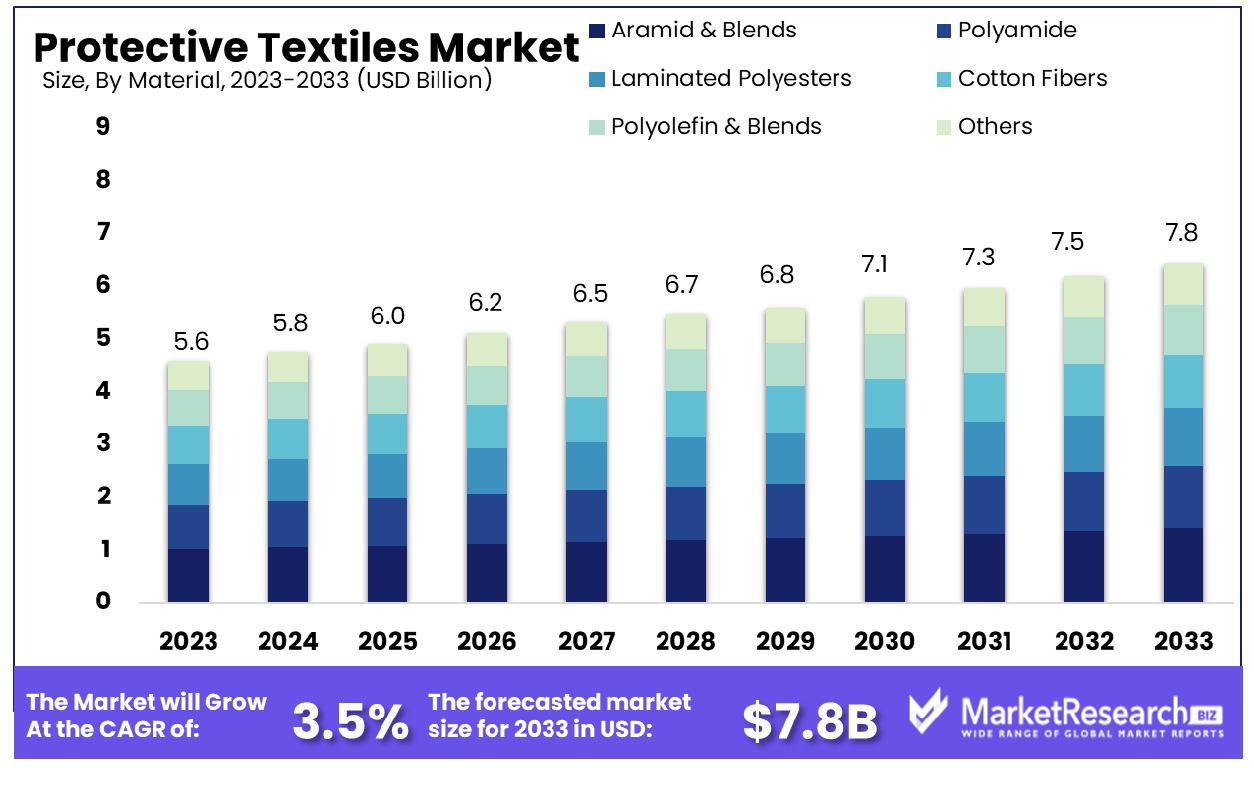
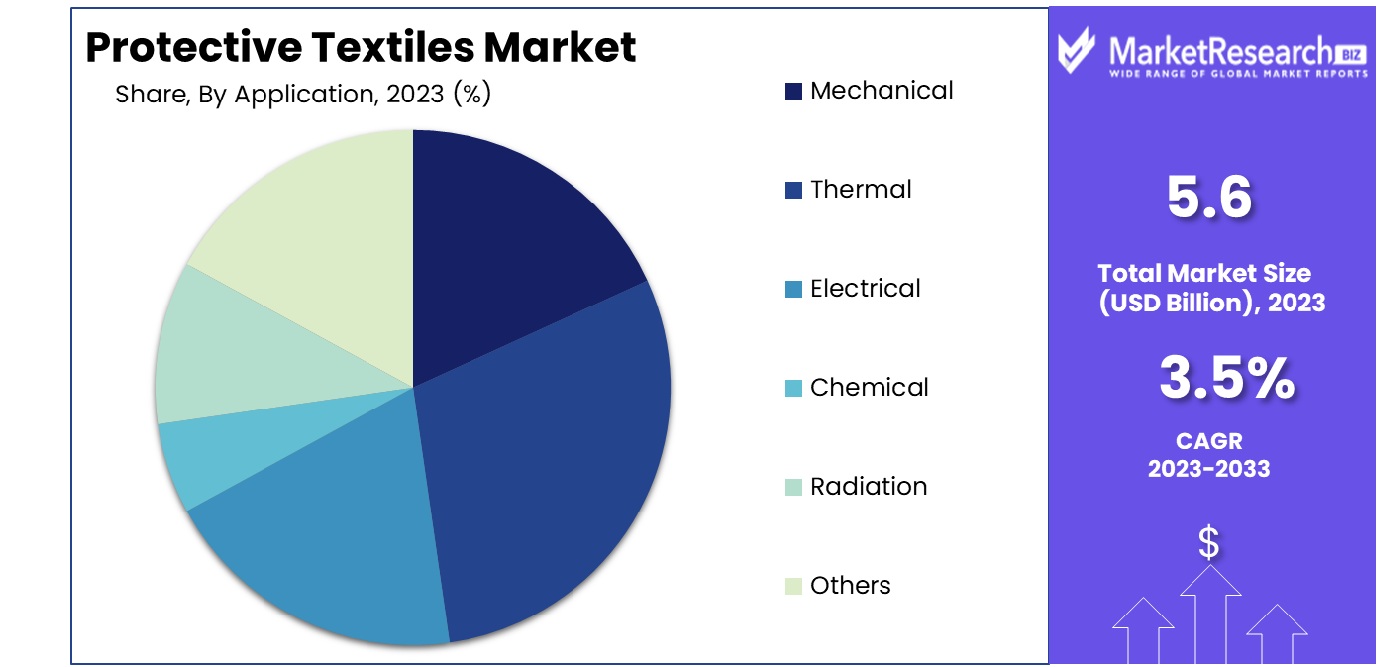
The Global Protective Textiles Market was valued at USD 5.6 billion in 2023. It is expected to reach USD 7.8 billion by 2033, with a CAGR of 3.5% during the forecast period from 2024 to 2033.
The Protective Textiles Market encompasses advanced fabric technologies designed to safeguard individuals from environmental hazards, including extreme temperatures, chemical exposures, and physical injuries. These textiles are integral to sectors such as defense, firefighting, healthcare, and construction, where safety is paramount. The market’s offerings include fire-resistant clothing, chemical-defensive gear, and ballistic protection, tailored to meet stringent safety standards.
As industries prioritize worker safety and regulatory compliance, the demand for these specialized textiles grows, presenting significant opportunities for innovation and market expansion. This market's evolution is crucial for companies looking to enhance occupational safety and reduce liability.
The Protective Textiles Market is positioned for substantial growth, driven by increasing demand across various industrial sectors prioritizing safety and regulatory compliance. As of 2020, the market was valued at approximately $16 billion and is anticipated to expand at a compound annual growth rate (CAGR) of 12-14%. By 2024, it is projected to reach a valuation of $20-23 billion. This growth trajectory is supported by technological advancements in material science, which enhance the protective capabilities of textiles used in hazardous environments.
Key sectors fueling this demand include construction, healthcare, defense, and firefighting. Companies operating in these industries seek innovative textile solutions that offer superior protection against a broad spectrum of threats, ranging from fire and chemicals to biological hazards and ballistic impacts. As these textiles evolve to meet stringent safety standards globally, they also open new avenues for market participants to innovate and capture emerging opportunities. Thus, stakeholders in the Protective Textiles Market must focus on scaling up production capabilities, enhancing material properties, and expanding their product offerings to leverage the growth potential fully.
Key Takeaways
- Market Growth: The Global Protective Textiles Market was valued at USD 5.6 billion in 2023. It is expected to reach USD 7.8 billion by 2033, with a CAGR of 3.5% during the forecast period from 2024 to 2033.
- Regional Dominance: Asia Pacific holds 45.2% of the global protective textiles market.
- By Material: Aramid & Blends dominated, holding a 40% market share in materials.
- By Application: Thermal application leads with 35% dominance in market usage.
- By End-Use: Manufacturing and construction lead, occupying 30% of market end-use share.
Driving factors
Increasing Safety Regulations and Standards in Industries
The enforcement of stringent safety regulations and standards across various industries fundamentally drives the demand for protective textiles. As governments globally intensify their focus on worker safety to mitigate occupational hazards, the market for protective textiles is experiencing substantial growth. For instance, regulations such as OSHA (Occupational Safety and Health Administration) in the United States mandate the use of protective clothing in several high-risk industries including construction, chemical, and oil and gas.
These regulations ensure a steady demand for protective textiles designed to shield workers from chemical exposure, extreme temperatures, and mechanical risks. This regulatory push is not only enhancing worker safety but also propelling the expansion of the protective textiles market.
Growing Demand from the Military and Defense Sector
The military and defense sector represents a significant driver of growth for the protective textiles market. With increasing geopolitical tensions and a heightened focus on personnel safety, there is a robust demand for advanced protective gear. Protective textiles are integral in manufacturing uniforms that offer ballistic protection, flame resistance, and chemical and biological hazard resistance.
The ongoing innovations and investments in military gear, aimed at improving the comfort and effectiveness of protective clothing, further stimulate market growth. The defense sector's stringent requirements for durable and technologically advanced textiles underscore its pivotal role in expanding the protective textiles market.
Technological Advancements in Textile Materials
Technological advancements in textile materials are revolutionizing the protective textiles market, enhancing both the functionality and appeal of these products. Innovations such as nanotechnology, which involves the manipulation of fibers at the molecular level, result in textiles that are lighter, stronger, and more adaptable to various environmental conditions.
For instance, the development of textiles that can change their properties in response to temperature fluctuations or exposure to hazardous chemicals is increasing their applicability across diverse industries. This technological progression not only meets the evolving demands of end-users but also opens new avenues for market growth by expanding the applications of protective textiles in emerging sectors like extreme sports and space exploration.
Restraining Factors
Impact of High Costs on Market Expansion for Protective Textiles
The high cost of advanced protective fabrics significantly influences the market dynamics of protective textiles. These textiles often incorporate specialized materials and technologies designed to ensure high performance in extreme conditions, such as resistance to chemicals, fire, and abrasion. The development and integration of these advanced features involve substantial research and development expenditures, alongside the use of costly raw materials.
Consequently, the final products are priced higher, potentially limiting their accessibility and adoption across various sectors, especially in cost-sensitive markets such as developing countries. This cost barrier can restrain market growth as potential buyers opt for less expensive, albeit less effective, alternatives. Therefore, managing and reducing production costs without compromising quality is pivotal for expanding market reach and enhancing the adoption rate of high-performance protective textiles.
Challenges in Recycling and Environmental Concerns
The environmental impact associated with synthetic protective textiles presents a significant challenge for the market. These materials are often non-biodegradable and complex to recycle, leading to considerable waste management issues. As environmental regulations become stricter and societal awareness increases, the demand for sustainable production practices and eco-friendly materials in the textile industry has surged. This shift is prompting companies to innovate in the areas of material sustainability and recycling technologies.
However, the transition involves complex technological upgrades and can be cost-intensive. The inability to effectively address these environmental concerns could hinder market growth, as consumers and regulatory bodies increasingly favor environmentally sustainable products. Conversely, addressing these challenges effectively can open new growth avenues through the adoption of green technologies and by meeting the rising demand for sustainable protective solutions.
By Material Analysis
Aramid & Blends dominated the material segment with a substantial 40% share in the market.
In 2023, Aramid & Blends held a dominant market position in the By Material segment of the Protective Textiles Market, capturing more than a 40% share. This prominence is attributed to the superior strength, durability, and resistance to high temperatures and chemicals offered by aramid fibers, making them ideal for applications in industries such as firefighting, military, and automotive.
Following Aramid & Blends, Polyamide accounted for approximately 25% of the market share. Specialty polyamide materials are favored for their excellent abrasion resistance and flexibility, which are essential for protective apparel in the construction and manufacturing sectors.
Laminated Polyesters have also carved a significant niche, securing about 15% of the market. These materials are primarily utilized for their waterproof and windproof properties in outdoor and weather-exposed environments.
Cotton Fibers, known for their comfort and breathability, maintained a 10% share of the market. Despite lower durability, their demand persists in less hazardous environments where comfort is prioritized.
Polyolefin & Blends, comprising around 7% of the market, are selected for their lightweight and non-conductive properties, particularly in electric hazard applications.
The remaining 3% is distributed among other materials, which include newer, innovative fabrics that are gaining traction for specific niche applications that require unique protective properties.
The dominance of Aramid & Blends in the market is reinforced by ongoing technological advancements and product innovations aimed at enhancing the performance characteristics of protective textiles. As industries continue to enforce stringent safety standards, the demand for advanced protective materials is expected to grow, further influencing market dynamics and investment trends in this sector.
By Application Analysis
In applications, thermal protective textiles led, accounting for 35% of the market dominance.
In 2023, the Protective Textiles Market was segmented by application into Mechanical, Thermal, Electrical, Chemical, Radiation, and Others. Among these, the Thermal segment held a dominant market position, capturing more than a 35% share. This significant market share can be attributed to the increasing demand for thermal protective clothing across various industries including firefighting, oil and gas, and construction, where protection against extreme heat and flames is critical.
The prominence of the Thermal segment is driven by technological advancements in material science that enhance the thermal resistance of fabrics while maintaining comfort and durability. Innovations such as the integration of nanotechnology and the development of hybrid materials have further boosted the efficacy and attractiveness of thermal protective textiles.
Meanwhile, the Mechanical segment also showed considerable growth, driven by the need for protection against mechanical hazards like abrasions, punctures, and cuts in sectors such as automotive, manufacturing, and construction. Electrical protective textiles are increasingly in demand due to the rising focus on safety standards in electrical and utility industries. Chemical and Radiation protective textiles are similarly advancing, with improvements in chemical resistance and the incorporation of materials that provide safety from hazardous exposures and radiological threats.
The segment labeled 'Others,' which includes applications such as biological protection and UV resistance, is growing as well, spurred by rising awareness of workplace safety and the diverse requirements of various industries. Each segment’s growth is supported by regulatory standards mandating higher safety measures, which influence the development and adoption of advanced protective textiles across the globe.
By End-Use Analysis
Manufacturing and construction emerged as the top end-use category, dominating 30% of the market.
In 2023, Manufacturing and Construction held a dominant market position in the By End-Use segment of the Protective Textiles Market, capturing more than a 30% share. This sector's significant share is primarily driven by the heightened need for protective apparel that shields against mechanical, chemical, and thermal hazards prevalent in these industries.
Defence followed, accounting for approximately 20% of the market. The demand in this sector is fueled by the critical need for ballistic protection, fire resistance, and chemical defense in military applications.
The Oil and Gas industry secured around 15% of the market share, where the requirement for protective clothing is essential to safeguard workers from oil-based hazards, fires, and extreme environmental conditions.
Mining industry contributions stood at 10%, driven by the necessity for durable and robust protective gear that offers high levels of safety against underground hazards, including falling objects and moisture.
Healthcare, which includes protective garments for biological and chemical protection, captured about 8% of the market, a figure that has been influenced by global health dynamics and heightened awareness of personal protective equipment.
Emergency Services accounted for 7% of the market, emphasizing the critical need for fire-resistant and waterproof materials in rescue and firefighting operations.
Space Exploration and Others, although smaller in their market share contributions at around 5% each, highlight niche areas with specialized requirements for high-tech protective solutions designed to withstand extreme conditions and provide maximum safety.
The dominance of the Manufacturing and Construction sector is likely to persist as technological advancements continue to introduce more durable, flexible, and safer materials, catering to stringent workplace safety regulations and evolving industry requirements.
Key Market Segments
By Material
- Aramid & Blends
- Polyamide
- Laminated Polyesters
- Cotton Fibers
- Polyolefin & Blends
- Others
By Application
- Mechanical
- Thermal
- Electrical
- Chemical
- Radiation
- Others
By End-Use
- Defence
- Manufacturing and Construction
- Mining
- Oil and Gas
- Space Exploration
- Healthcare
- Emergency Services
- Others
Growth Opportunity
Development of Lightweight and More Comfortable Protective Clothing
The global Protective Textiles Market stands at the cusp of transformation in 2023, largely propelled by the development of lightweight and more comfortable protective clothing. This evolution is not just a trend but a significant growth opportunity, as comfort and wearability directly influence user compliance and market penetration. Innovations that reduce the weight of protective garments while maintaining or enhancing their protective features cater to a broader range of industries, from healthcare to construction and beyond.
This shift towards more ergonomic protective solutions is likely to attract a wider demographic, including sectors that have traditionally hesitated to adopt standard protective gear due to discomfort and mobility restrictions. The strategic focus on lightweight materials could be particularly instrumental in boosting product adoption rates and expanding the market's footprint.
Expansion into Emerging Markets with Growing Industrial Sectors
2023 presents a substantial growth avenue for the Protective Textiles Market through expansion into emerging markets, which are witnessing rapid industrialization. Regions such as Asia-Pacific, Latin America, and parts of Africa are seeing an influx of industrial investments and a corresponding rise in labor-intensive industries. These markets offer untapped potential due to lower penetration of protective textiles and burgeoning awareness of worker safety norms.
Capitalizing on this opportunity involves navigating diverse regulatory landscapes and establishing robust distribution channels. However, the long-term benefits include establishing early dominance in these markets, fostering brand loyalty, and driving volume growth. As these emerging markets continue to develop their infrastructure and industrial capabilities, the demand for protective textiles is expected to surge, providing a sustained growth trajectory for the industry.
Latest Trends
Nanotechnology's Role in Enhancing Protective Textiles
In 2023, the incorporation of nanotechnology in protective textiles signifies a groundbreaking trend, transforming market prospects dramatically. Nanotechnology involves manipulating materials at an atomic or molecular scale to imbue textiles with enhanced properties such as increased strength, chemical resistance, and durability. These nano-enhanced fabrics are pivotal in sectors requiring high-performance gear, including military, firefighting, and healthcare.
By integrating nanotechnology, manufacturers are able to offer products that not only provide superior protection but also improve comfort and functionality, which is crucial for user acceptance and satisfaction. The adoption of this technology is poised to drive significant growth within the protective textiles market by fulfilling stringent safety standards and adapting to evolving industry requirements. This trend is expected to garner substantial investment as companies strive to innovate and capture market share in an increasingly competitive landscape.
Expansion Through Smart Textiles with Integrated Sensors
The rise in the adoption of smart textiles equipped with integrated sensors marks another prominent trend shaping the protective textiles market in 2023. These textiles are embedded with sensors that monitor various health and environmental parameters, offering real-time data to enhance safety and performance. Applications range from monitoring vital signs in healthcare settings to tracking hazardous exposures in industrial environments.
The integration of these technologies addresses the growing demand for interconnected, intelligent safety solutions, particularly in industries where real-time data can significantly impact safety outcomes and operational efficiency. As businesses increasingly prioritize worker safety and regulatory compliance, the market for smart protective textiles is expected to witness robust growth. This trend also aligns with the broader movement towards the Internet of Things (IoT), positioning smart textiles at the forefront of technological integration in protective gear.
Regional Analysis
In 2023, the Asia Pacific region held a 45.2% share of the global protective textiles market.
In North America, the market is characterized by a well-established industrial sector and stringent safety regulations which drive the demand for high-standard protective clothing. Advanced manufacturing techniques and the presence of leading market players also contribute to the robust market size in this region.
Europe follows closely, with a strong emphasis on safety standards and worker protection, especially in the industrial and chemical sectors. The European market benefits from proactive government policies that enforce strict safety and health protocols, fostering growth in the protective textiles sector.
Asia Pacific stands as the dominating region in the protective textiles market, holding a substantial 45.2% market share. This dominance is driven by rapid industrialization in emerging economies like China and India, coupled with increasing awareness regarding worker safety. The region's competitive manufacturing capabilities and expanding industrial workforce provide a fertile ground for the protective textiles market to thrive.
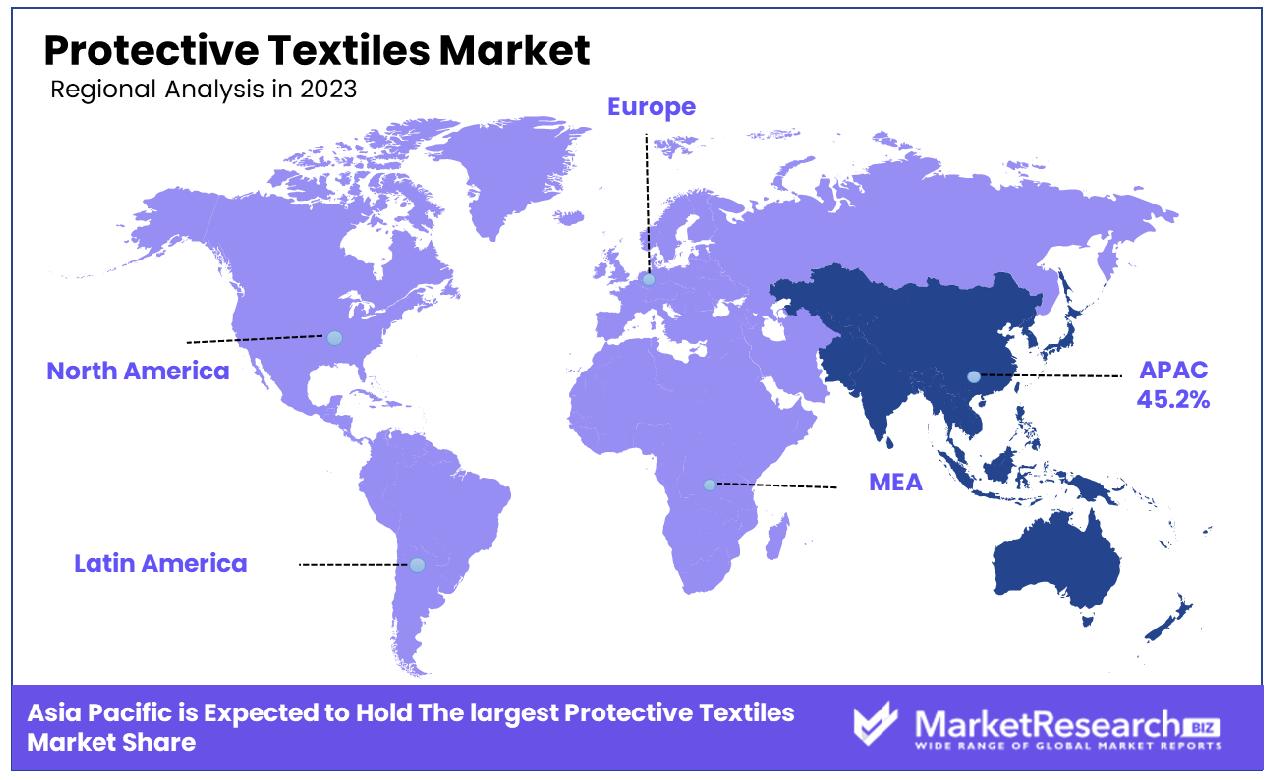
The Middle East & Africa and Latin America regions, though smaller in market size compared to others, are witnessing growth due to developing industrial sectors and rising standards for workplace safety. These regions present significant growth opportunities, driven by urbanization and governmental initiatives to enhance industrial safety standards.
Collectively, these regional markets underscore the global reach and diverse application spectrum of the Protective Textiles Market, each contributing uniquely to the industry's growth trajectory with Asia Pacific leading the charge due to its expansive industrial activities and escalating safety requirements.
Key Regions and Countries
North America
- The US
- Canada
- Rest of North America
Europe
- Germany
- France
- The UK
- Spain
- Netherlands
- Russia
- Italy
- Rest of Europe
Asia-Pacific
- China
- Japan
- Singapore
- Thailand
- South Korea
- Vietnam
- India
- New Zealand
- Rest of Asia Pacific
Latin America
- Mexico
- Brazil
- Rest of Latin America
Middle East & Africa
- Saudi Arabia
- South Africa
- UAE
- Rest of Middle East & Africa
Key Players Analysis
In 2023, the global protective textiles market will be influenced significantly by the activities and innovations of several key companies. DuPont, a leader in this sector, continues to drive advancements with its cutting-edge materials science expertise, enhancing the performance and durability of protective fabrics. Royal Ten Cate NV leverages its broad portfolio to cater to diverse industries, reinforcing its presence in global markets through strategic innovations and collaborations.
W. L. Gore & Associates, Inc. remains pivotal in shaping the market through their proprietary technologies in waterproof and breathable barriers, which are critical in protective clothing for extreme environments. Meanwhile, Kusumgar Corporates and DyStar Group are expanding their footprint by focusing on compliance with stringent environmental standards and enhancing the functional aspects of protective textiles.
Schoeller Textil AG stands out for its commitment to sustainability and technological integration, developing fabrics that offer both protection and comfort without compromising on environmental values. In contrast, ARGAR S.r.l specializes in technical knitted fabrics, providing tailored solutions that meet the specific needs of their clients, demonstrating flexibility and innovation in design.
Madhuram Fabrics Pvt. Ltd. and Teijin Limited are also noteworthy for their contributions to the market, with Teijin focusing on the integration of high-performance fibers to create advanced protective solutions. PBI Performance Products, Inc. emphasizes the development of high-heat-resistant fabrics, crucial for firefighting and industrial applications.
These companies collectively drive the protective textiles market forward through a blend of innovative material technologies, strategic market expansions, and a strong focus on sustainability and customer-specific solutions. Their efforts are set to not only lead but also transform the market landscape in 2023 and beyond.
Market Key Players
- DuPont
- Royal Ten Cate NV
- W. L. Gore & Associates, Inc.
- Kusumgar Corporates
- DyStar Group
- Schoeller Textil AG
- ARGAR S.r.l
- Madhuram Fabrics Pvt. Ltd.
- Teijin Limited
- PBI Performance Products, Inc., and more.
Recent Development
- In March 2024, Kusumgar Corporates received a $30 million investment in March 2024 to enhance their manufacturing facilities. This investment is aimed at boosting production capabilities for high-tech protective textiles used in military and aerospace applications.
- In February 2024, DuPont introduced a new line of fire-resistant fabrics under their renowned Nomex brand. This line enhances protection for workers in hazardous environments and represents a significant advancement in their protective textile offerings.
- In January 2024, DyStar Group announced in January 2024 the acquisition of a smaller chemical producer that specializes in environmentally friendly dyes for protective textiles. This acquisition is part of their strategy to offer more sustainable options in their product line.
Report Scope
Report Features Description Market Value (2023) USD 5.6 Billion Forecast Revenue (2033) USD 7.8 Billion CAGR (2024-2032) 3.5% Base Year for Estimation 2023 Historic Period 2016-2023 Forecast Period 2024-2033 Report Coverage Revenue Forecast, Market Dynamics, COVID-19 Impact, Competitive Landscape, Recent Developments Segments Covered By Material(Aramid & Blends, Polyamide, Laminated Polyesters, Cotton Fibers, Polyolefin & Blends, Others), By Application(Mechanical, Thermal, Electrical, Chemical, Radiation, Others), By End-Use(Defence, Manufacturing and Construction, Mining, Oil and Gas, Space Exploration, Healthcare, Emergency Services, Others) Regional Analysis North America - The US, Canada, Rest of North America, Europe - Germany, France, The UK, Spain, Italy, Russia, Netherlands, Rest of Europe, Asia-Pacific - China, Japan, South Korea, India, New Zealand, Singapore, Thailand, Vietnam, Rest of Asia Pacific, Latin America - Brazil, Mexico, Rest of Latin America, Middle East & Africa - South Africa, Saudi Arabia, UAE, Rest of Middle East & Africa Competitive Landscape DuPont, Royal Ten Cate NV, W. L. Gore & Associates, Inc., Kusumgar Corporates, DyStar Group, Schoeller Textil AG, ARGAR S.r.l, Madhuram Fabrics Pvt. Ltd., Teijin Limited, PBI Performance Products, Inc., and more. Customization Scope Customization for segments, region/country-level will be provided. Moreover, additional customization can be done based on the requirements. Purchase Options We have three licenses to opt for Single User License, Multi-User License (Up to 5 Users), Corporate Use License (Unlimited User and Printable PDF) -
- 1. Executive Summary
- 1.1. Definition
- 1.2. Taxonomy
- 1.3. Research Scope
- 1.4. Key Analysis
- 1.5. Key Findings by Major Segments
- 1.6. Top strategies by Major Players
- 2. Global Protective Textiles Market Overview
- 2.1. Protective Textiles Market Dynamics
- 2.1.1. Drivers
- 2.1.2. Opportunities
- 2.1.3. Restraints
- 2.1.4. Challenges
- 2.2. Macro-economic Factors
- 2.3. Regulatory Framework
- 2.4. Market Investment Feasibility Index
- 2.5. PEST Analysis
- 2.6. PORTER’S Five Force Analysis
- 2.7. Drivers & Restraints Impact Analysis
- 2.8. Industry Chain Analysis
- 2.9. Cost Structure Analysis
- 2.10. Marketing Strategy
- 2.11. Russia-Ukraine War Impact Analysis
- 2.12. Opportunity Map Analysis
- 2.13. Market Competition Scenario Analysis
- 2.14. Product Life Cycle Analysis
- 2.15. Opportunity Orbits
- 2.16. Manufacturer Intensity Map
- 2.17. Major Companies sales by Value & Volume
- 2.1. Protective Textiles Market Dynamics
- 3. Global Protective Textiles Market Analysis, Opportunity and Forecast, 2016-2032
- 3.1. Global Protective Textiles Market Analysis, 2016-2021
- 3.2. Global Protective Textiles Market Opportunity and Forecast, 2023-2032
- 3.3. Global Protective Textiles Market Analysis, Opportunity and Forecast, By By Material, 2016-2032
- 3.3.1. Global Protective Textiles Market Analysis by By Material: Introduction
- 3.3.2. Market Size Absolute $ Opportunity Analysis and Forecast, By By Material, 2016-2032
- 3.3.3. Aramid & Blends
- 3.3.4. Polyamide
- 3.3.5. Laminated Polyesters
- 3.3.6. Cotton Fibers
- 3.3.7. Polyolefin & Blends
- 3.3.8. Others
- 3.4. Global Protective Textiles Market Analysis, Opportunity and Forecast, By By Application, 2016-2032
- 3.4.1. Global Protective Textiles Market Analysis by By Application: Introduction
- 3.4.2. Market Size Absolute $ Opportunity Analysis and Forecast, By By Application, 2016-2032
- 3.4.3. Mechanical
- 3.4.4. Thermal
- 3.4.5. Electrical
- 3.4.6. Chemical
- 3.4.7. Radiation
- 3.4.8. Others
- 3.5. Global Protective Textiles Market Analysis, Opportunity and Forecast, By By End-Use, 2016-2032
- 3.5.1. Global Protective Textiles Market Analysis by By End-Use: Introduction
- 3.5.2. Market Size Absolute $ Opportunity Analysis and Forecast, By By End-Use, 2016-2032
- 3.5.3. Defence
- 3.5.4. Manufacturing and Construction
- 3.5.5. Mining
- 3.5.6. Oil and Gas
- 3.5.7. Space Exploration
- 3.5.8. Healthcare
- 3.5.9. Emergency Services
- 3.5.10. Others
- 4. North America Protective Textiles Market Analysis, Opportunity and Forecast, 2016-2032
- 4.1. North America Protective Textiles Market Analysis, 2016-2021
- 4.2. North America Protective Textiles Market Opportunity and Forecast, 2023-2032
- 4.3. North America Protective Textiles Market Analysis, Opportunity and Forecast, By By Material, 2016-2032
- 4.3.1. North America Protective Textiles Market Analysis by By Material: Introduction
- 4.3.2. Market Size Absolute $ Opportunity Analysis and Forecast, By By Material, 2016-2032
- 4.3.3. Aramid & Blends
- 4.3.4. Polyamide
- 4.3.5. Laminated Polyesters
- 4.3.6. Cotton Fibers
- 4.3.7. Polyolefin & Blends
- 4.3.8. Others
- 4.4. North America Protective Textiles Market Analysis, Opportunity and Forecast, By By Application, 2016-2032
- 4.4.1. North America Protective Textiles Market Analysis by By Application: Introduction
- 4.4.2. Market Size Absolute $ Opportunity Analysis and Forecast, By By Application, 2016-2032
- 4.4.3. Mechanical
- 4.4.4. Thermal
- 4.4.5. Electrical
- 4.4.6. Chemical
- 4.4.7. Radiation
- 4.4.8. Others
- 4.5. North America Protective Textiles Market Analysis, Opportunity and Forecast, By By End-Use, 2016-2032
- 4.5.1. North America Protective Textiles Market Analysis by By End-Use: Introduction
- 4.5.2. Market Size Absolute $ Opportunity Analysis and Forecast, By By End-Use, 2016-2032
- 4.5.3. Defence
- 4.5.4. Manufacturing and Construction
- 4.5.5. Mining
- 4.5.6. Oil and Gas
- 4.5.7. Space Exploration
- 4.5.8. Healthcare
- 4.5.9. Emergency Services
- 4.5.10. Others
- 4.6. North America Protective Textiles Market Analysis, Opportunity and Forecast, By Country , 2016-2032
- 4.6.1. North America Protective Textiles Market Analysis by Country : Introduction
- 4.6.2. Market Size Absolute $ Opportunity Analysis and Forecast, Country , 2016-2032
- 4.6.2.1. The US
- 4.6.2.2. Canada
- 4.6.2.3. Mexico
- 5. Western Europe Protective Textiles Market Analysis, Opportunity and Forecast, 2016-2032
- 5.1. Western Europe Protective Textiles Market Analysis, 2016-2021
- 5.2. Western Europe Protective Textiles Market Opportunity and Forecast, 2023-2032
- 5.3. Western Europe Protective Textiles Market Analysis, Opportunity and Forecast, By By Material, 2016-2032
- 5.3.1. Western Europe Protective Textiles Market Analysis by By Material: Introduction
- 5.3.2. Market Size Absolute $ Opportunity Analysis and Forecast, By By Material, 2016-2032
- 5.3.3. Aramid & Blends
- 5.3.4. Polyamide
- 5.3.5. Laminated Polyesters
- 5.3.6. Cotton Fibers
- 5.3.7. Polyolefin & Blends
- 5.3.8. Others
- 5.4. Western Europe Protective Textiles Market Analysis, Opportunity and Forecast, By By Application, 2016-2032
- 5.4.1. Western Europe Protective Textiles Market Analysis by By Application: Introduction
- 5.4.2. Market Size Absolute $ Opportunity Analysis and Forecast, By By Application, 2016-2032
- 5.4.3. Mechanical
- 5.4.4. Thermal
- 5.4.5. Electrical
- 5.4.6. Chemical
- 5.4.7. Radiation
- 5.4.8. Others
- 5.5. Western Europe Protective Textiles Market Analysis, Opportunity and Forecast, By By End-Use, 2016-2032
- 5.5.1. Western Europe Protective Textiles Market Analysis by By End-Use: Introduction
- 5.5.2. Market Size Absolute $ Opportunity Analysis and Forecast, By By End-Use, 2016-2032
- 5.5.3. Defence
- 5.5.4. Manufacturing and Construction
- 5.5.5. Mining
- 5.5.6. Oil and Gas
- 5.5.7. Space Exploration
- 5.5.8. Healthcare
- 5.5.9. Emergency Services
- 5.5.10. Others
- 5.6. Western Europe Protective Textiles Market Analysis, Opportunity and Forecast, By Country , 2016-2032
- 5.6.1. Western Europe Protective Textiles Market Analysis by Country : Introduction
- 5.6.2. Market Size Absolute $ Opportunity Analysis and Forecast, Country , 2016-2032
- 5.6.2.1. Germany
- 5.6.2.2. France
- 5.6.2.3. The UK
- 5.6.2.4. Spain
- 5.6.2.5. Italy
- 5.6.2.6. Portugal
- 5.6.2.7. Ireland
- 5.6.2.8. Austria
- 5.6.2.9. Switzerland
- 5.6.2.10. Benelux
- 5.6.2.11. Nordic
- 5.6.2.12. Rest of Western Europe
- 6. Eastern Europe Protective Textiles Market Analysis, Opportunity and Forecast, 2016-2032
- 6.1. Eastern Europe Protective Textiles Market Analysis, 2016-2021
- 6.2. Eastern Europe Protective Textiles Market Opportunity and Forecast, 2023-2032
- 6.3. Eastern Europe Protective Textiles Market Analysis, Opportunity and Forecast, By By Material, 2016-2032
- 6.3.1. Eastern Europe Protective Textiles Market Analysis by By Material: Introduction
- 6.3.2. Market Size Absolute $ Opportunity Analysis and Forecast, By By Material, 2016-2032
- 6.3.3. Aramid & Blends
- 6.3.4. Polyamide
- 6.3.5. Laminated Polyesters
- 6.3.6. Cotton Fibers
- 6.3.7. Polyolefin & Blends
- 6.3.8. Others
- 6.4. Eastern Europe Protective Textiles Market Analysis, Opportunity and Forecast, By By Application, 2016-2032
- 6.4.1. Eastern Europe Protective Textiles Market Analysis by By Application: Introduction
- 6.4.2. Market Size Absolute $ Opportunity Analysis and Forecast, By By Application, 2016-2032
- 6.4.3. Mechanical
- 6.4.4. Thermal
- 6.4.5. Electrical
- 6.4.6. Chemical
- 6.4.7. Radiation
- 6.4.8. Others
- 6.5. Eastern Europe Protective Textiles Market Analysis, Opportunity and Forecast, By By End-Use, 2016-2032
- 6.5.1. Eastern Europe Protective Textiles Market Analysis by By End-Use: Introduction
- 6.5.2. Market Size Absolute $ Opportunity Analysis and Forecast, By By End-Use, 2016-2032
- 6.5.3. Defence
- 6.5.4. Manufacturing and Construction
- 6.5.5. Mining
- 6.5.6. Oil and Gas
- 6.5.7. Space Exploration
- 6.5.8. Healthcare
- 6.5.9. Emergency Services
- 6.5.10. Others
- 6.6. Eastern Europe Protective Textiles Market Analysis, Opportunity and Forecast, By Country , 2016-2032
- 6.6.1. Eastern Europe Protective Textiles Market Analysis by Country : Introduction
- 6.6.2. Market Size Absolute $ Opportunity Analysis and Forecast, Country , 2016-2032
- 6.6.2.1. Russia
- 6.6.2.2. Poland
- 6.6.2.3. The Czech Republic
- 6.6.2.4. Greece
- 6.6.2.5. Rest of Eastern Europe
- 7. APAC Protective Textiles Market Analysis, Opportunity and Forecast, 2016-2032
- 7.1. APAC Protective Textiles Market Analysis, 2016-2021
- 7.2. APAC Protective Textiles Market Opportunity and Forecast, 2023-2032
- 7.3. APAC Protective Textiles Market Analysis, Opportunity and Forecast, By By Material, 2016-2032
- 7.3.1. APAC Protective Textiles Market Analysis by By Material: Introduction
- 7.3.2. Market Size Absolute $ Opportunity Analysis and Forecast, By By Material, 2016-2032
- 7.3.3. Aramid & Blends
- 7.3.4. Polyamide
- 7.3.5. Laminated Polyesters
- 7.3.6. Cotton Fibers
- 7.3.7. Polyolefin & Blends
- 7.3.8. Others
- 7.4. APAC Protective Textiles Market Analysis, Opportunity and Forecast, By By Application, 2016-2032
- 7.4.1. APAC Protective Textiles Market Analysis by By Application: Introduction
- 7.4.2. Market Size Absolute $ Opportunity Analysis and Forecast, By By Application, 2016-2032
- 7.4.3. Mechanical
- 7.4.4. Thermal
- 7.4.5. Electrical
- 7.4.6. Chemical
- 7.4.7. Radiation
- 7.4.8. Others
- 7.5. APAC Protective Textiles Market Analysis, Opportunity and Forecast, By By End-Use, 2016-2032
- 7.5.1. APAC Protective Textiles Market Analysis by By End-Use: Introduction
- 7.5.2. Market Size Absolute $ Opportunity Analysis and Forecast, By By End-Use, 2016-2032
- 7.5.3. Defence
- 7.5.4. Manufacturing and Construction
- 7.5.5. Mining
- 7.5.6. Oil and Gas
- 7.5.7. Space Exploration
- 7.5.8. Healthcare
- 7.5.9. Emergency Services
- 7.5.10. Others
- 7.6. APAC Protective Textiles Market Analysis, Opportunity and Forecast, By Country , 2016-2032
- 7.6.1. APAC Protective Textiles Market Analysis by Country : Introduction
- 7.6.2. Market Size Absolute $ Opportunity Analysis and Forecast, Country , 2016-2032
- 7.6.2.1. China
- 7.6.2.2. Japan
- 7.6.2.3. South Korea
- 7.6.2.4. India
- 7.6.2.5. Australia & New Zeland
- 7.6.2.6. Indonesia
- 7.6.2.7. Malaysia
- 7.6.2.8. Philippines
- 7.6.2.9. Singapore
- 7.6.2.10. Thailand
- 7.6.2.11. Vietnam
- 7.6.2.12. Rest of APAC
- 8. Latin America Protective Textiles Market Analysis, Opportunity and Forecast, 2016-2032
- 8.1. Latin America Protective Textiles Market Analysis, 2016-2021
- 8.2. Latin America Protective Textiles Market Opportunity and Forecast, 2023-2032
- 8.3. Latin America Protective Textiles Market Analysis, Opportunity and Forecast, By By Material, 2016-2032
- 8.3.1. Latin America Protective Textiles Market Analysis by By Material: Introduction
- 8.3.2. Market Size Absolute $ Opportunity Analysis and Forecast, By By Material, 2016-2032
- 8.3.3. Aramid & Blends
- 8.3.4. Polyamide
- 8.3.5. Laminated Polyesters
- 8.3.6. Cotton Fibers
- 8.3.7. Polyolefin & Blends
- 8.3.8. Others
- 8.4. Latin America Protective Textiles Market Analysis, Opportunity and Forecast, By By Application, 2016-2032
- 8.4.1. Latin America Protective Textiles Market Analysis by By Application: Introduction
- 8.4.2. Market Size Absolute $ Opportunity Analysis and Forecast, By By Application, 2016-2032
- 8.4.3. Mechanical
- 8.4.4. Thermal
- 8.4.5. Electrical
- 8.4.6. Chemical
- 8.4.7. Radiation
- 8.4.8. Others
- 8.5. Latin America Protective Textiles Market Analysis, Opportunity and Forecast, By By End-Use, 2016-2032
- 8.5.1. Latin America Protective Textiles Market Analysis by By End-Use: Introduction
- 8.5.2. Market Size Absolute $ Opportunity Analysis and Forecast, By By End-Use, 2016-2032
- 8.5.3. Defence
- 8.5.4. Manufacturing and Construction
- 8.5.5. Mining
- 8.5.6. Oil and Gas
- 8.5.7. Space Exploration
- 8.5.8. Healthcare
- 8.5.9. Emergency Services
- 8.5.10. Others
- 8.6. Latin America Protective Textiles Market Analysis, Opportunity and Forecast, By Country , 2016-2032
- 8.6.1. Latin America Protective Textiles Market Analysis by Country : Introduction
- 8.6.2. Market Size Absolute $ Opportunity Analysis and Forecast, Country , 2016-2032
- 8.6.2.1. Brazil
- 8.6.2.2. Colombia
- 8.6.2.3. Chile
- 8.6.2.4. Argentina
- 8.6.2.5. Costa Rica
- 8.6.2.6. Rest of Latin America
- 9. Middle East & Africa Protective Textiles Market Analysis, Opportunity and Forecast, 2016-2032
- 9.1. Middle East & Africa Protective Textiles Market Analysis, 2016-2021
- 9.2. Middle East & Africa Protective Textiles Market Opportunity and Forecast, 2023-2032
- 9.3. Middle East & Africa Protective Textiles Market Analysis, Opportunity and Forecast, By By Material, 2016-2032
- 9.3.1. Middle East & Africa Protective Textiles Market Analysis by By Material: Introduction
- 9.3.2. Market Size Absolute $ Opportunity Analysis and Forecast, By By Material, 2016-2032
- 9.3.3. Aramid & Blends
- 9.3.4. Polyamide
- 9.3.5. Laminated Polyesters
- 9.3.6. Cotton Fibers
- 9.3.7. Polyolefin & Blends
- 9.3.8. Others
- 9.4. Middle East & Africa Protective Textiles Market Analysis, Opportunity and Forecast, By By Application, 2016-2032
- 9.4.1. Middle East & Africa Protective Textiles Market Analysis by By Application: Introduction
- 9.4.2. Market Size Absolute $ Opportunity Analysis and Forecast, By By Application, 2016-2032
- 9.4.3. Mechanical
- 9.4.4. Thermal
- 9.4.5. Electrical
- 9.4.6. Chemical
- 9.4.7. Radiation
- 9.4.8. Others
- 9.5. Middle East & Africa Protective Textiles Market Analysis, Opportunity and Forecast, By By End-Use, 2016-2032
- 9.5.1. Middle East & Africa Protective Textiles Market Analysis by By End-Use: Introduction
- 9.5.2. Market Size Absolute $ Opportunity Analysis and Forecast, By By End-Use, 2016-2032
- 9.5.3. Defence
- 9.5.4. Manufacturing and Construction
- 9.5.5. Mining
- 9.5.6. Oil and Gas
- 9.5.7. Space Exploration
- 9.5.8. Healthcare
- 9.5.9. Emergency Services
- 9.5.10. Others
- 9.6. Middle East & Africa Protective Textiles Market Analysis, Opportunity and Forecast, By Country , 2016-2032
- 9.6.1. Middle East & Africa Protective Textiles Market Analysis by Country : Introduction
- 9.6.2. Market Size Absolute $ Opportunity Analysis and Forecast, Country , 2016-2032
- 9.6.2.1. Algeria
- 9.6.2.2. Egypt
- 9.6.2.3. Israel
- 9.6.2.4. Kuwait
- 9.6.2.5. Nigeria
- 9.6.2.6. Saudi Arabia
- 9.6.2.7. South Africa
- 9.6.2.8. Turkey
- 9.6.2.9. The UAE
- 9.6.2.10. Rest of MEA
- 10. Global Protective Textiles Market Analysis, Opportunity and Forecast, By Region , 2016-2032
- 10.1. Global Protective Textiles Market Analysis by Region : Introduction
- 10.2. Market Size Absolute $ Opportunity Analysis and Forecast, By Region , 2016-2032
- 10.2.1. North America
- 10.2.2. Western Europe
- 10.2.3. Eastern Europe
- 10.2.4. APAC
- 10.2.5. Latin America
- 10.2.6. Middle East & Africa
- 11. Global Protective Textiles Market Competitive Landscape, Market Share Analysis, and Company Profiles
- 11.1. Market Share Analysis
- 11.2. Company Profiles
- 11.3. DuPont
- 11.3.1. Company Overview
- 11.3.2. Financial Highlights
- 11.3.3. Product Portfolio
- 11.3.4. SWOT Analysis
- 11.3.5. Key Strategies and Developments
- 11.4. Royal Ten Cate NV
- 11.4.1. Company Overview
- 11.4.2. Financial Highlights
- 11.4.3. Product Portfolio
- 11.4.4. SWOT Analysis
- 11.4.5. Key Strategies and Developments
- 11.5. W. L. Gore & Associates, Inc.
- 11.5.1. Company Overview
- 11.5.2. Financial Highlights
- 11.5.3. Product Portfolio
- 11.5.4. SWOT Analysis
- 11.5.5. Key Strategies and Developments
- 11.6. Kusumgar Corporates
- 11.6.1. Company Overview
- 11.6.2. Financial Highlights
- 11.6.3. Product Portfolio
- 11.6.4. SWOT Analysis
- 11.6.5. Key Strategies and Developments
- 11.7. DyStar Group
- 11.7.1. Company Overview
- 11.7.2. Financial Highlights
- 11.7.3. Product Portfolio
- 11.7.4. SWOT Analysis
- 11.7.5. Key Strategies and Developments
- 11.8. Schoeller Textil AG
- 11.8.1. Company Overview
- 11.8.2. Financial Highlights
- 11.8.3. Product Portfolio
- 11.8.4. SWOT Analysis
- 11.8.5. Key Strategies and Developments
- 11.9. ARGAR S.r.l
- 11.9.1. Company Overview
- 11.9.2. Financial Highlights
- 11.9.3. Product Portfolio
- 11.9.4. SWOT Analysis
- 11.9.5. Key Strategies and Developments
- 11.10. Madhuram Fabrics Pvt. Ltd.
- 11.10.1. Company Overview
- 11.10.2. Financial Highlights
- 11.10.3. Product Portfolio
- 11.10.4. SWOT Analysis
- 11.10.5. Key Strategies and Developments
- 11.11. Teijin Limited
- 11.11.1. Company Overview
- 11.11.2. Financial Highlights
- 11.11.3. Product Portfolio
- 11.11.4. SWOT Analysis
- 11.11.5. Key Strategies and Developments
- 11.12. PBI Performance Products, Inc., and more.
- 11.12.1. Company Overview
- 11.12.2. Financial Highlights
- 11.12.3. Product Portfolio
- 11.12.4. SWOT Analysis
- 11.12.5. Key Strategies and Developments
- 11.13.1. Company Overview
- 11.13.2. Financial Highlights
- 11.13.3. Product Portfolio
- 11.13.4. SWOT Analysis
- 11.13.5. Key Strategies and Developments
- 12. Assumptions and Acronyms
- 13. Research Methodology
- 14. Contact
"
- List of Figures
- "
- Figure 1: Global Protective Textiles Market Revenue (US$ Mn) Market Share by By Material in 2022
- Figure 2: Global Protective Textiles Market Market Attractiveness Analysis by By Material, 2016-2032
- Figure 3: Global Protective Textiles Market Revenue (US$ Mn) Market Share by By Applicationin 2022
- Figure 4: Global Protective Textiles Market Market Attractiveness Analysis by By Application, 2016-2032
- Figure 5: Global Protective Textiles Market Revenue (US$ Mn) Market Share by By End-Usein 2022
- Figure 6: Global Protective Textiles Market Market Attractiveness Analysis by By End-Use, 2016-2032
- Figure 7: Global Protective Textiles Market Revenue (US$ Mn) Market Share by Region in 2022
- Figure 8: Global Protective Textiles Market Market Attractiveness Analysis by Region, 2016-2032
- Figure 9: Global Protective Textiles Market Market Revenue (US$ Mn) (2016-2032)
- Figure 10: Global Protective Textiles Market Market Revenue (US$ Mn) Comparison by Region (2016-2032)
- Figure 11: Global Protective Textiles Market Market Revenue (US$ Mn) Comparison by By Material (2016-2032)
- Figure 12: Global Protective Textiles Market Market Revenue (US$ Mn) Comparison by By Application (2016-2032)
- Figure 13: Global Protective Textiles Market Market Revenue (US$ Mn) Comparison by By End-Use (2016-2032)
- Figure 14: Global Protective Textiles Market Market Y-o-Y Growth Rate Comparison by Region (2016-2032)
- Figure 15: Global Protective Textiles Market Market Y-o-Y Growth Rate Comparison by By Material (2016-2032)
- Figure 16: Global Protective Textiles Market Market Y-o-Y Growth Rate Comparison by By Application (2016-2032)
- Figure 17: Global Protective Textiles Market Market Y-o-Y Growth Rate Comparison by By End-Use (2016-2032)
- Figure 18: Global Protective Textiles Market Market Share Comparison by Region (2016-2032)
- Figure 19: Global Protective Textiles Market Market Share Comparison by By Material (2016-2032)
- Figure 20: Global Protective Textiles Market Market Share Comparison by By Application (2016-2032)
- Figure 21: Global Protective Textiles Market Market Share Comparison by By End-Use (2016-2032)
- Figure 22: North America Protective Textiles Market Revenue (US$ Mn) Market Share by By Materialin 2022
- Figure 23: North America Protective Textiles Market Market Attractiveness Analysis by By Material, 2016-2032
- Figure 24: North America Protective Textiles Market Revenue (US$ Mn) Market Share by By Applicationin 2022
- Figure 25: North America Protective Textiles Market Market Attractiveness Analysis by By Application, 2016-2032
- Figure 26: North America Protective Textiles Market Revenue (US$ Mn) Market Share by By End-Usein 2022
- Figure 27: North America Protective Textiles Market Market Attractiveness Analysis by By End-Use, 2016-2032
- Figure 28: North America Protective Textiles Market Revenue (US$ Mn) Market Share by Country in 2022
- Figure 29: North America Protective Textiles Market Market Attractiveness Analysis by Country, 2016-2032
- Figure 30: North America Protective Textiles Market Market Revenue (US$ Mn) (2016-2032)
- Figure 31: North America Protective Textiles Market Market Revenue (US$ Mn) Comparison by Country (2016-2032)
- Figure 32: North America Protective Textiles Market Market Revenue (US$ Mn) Comparison by By Material (2016-2032)
- Figure 33: North America Protective Textiles Market Market Revenue (US$ Mn) Comparison by By Application (2016-2032)
- Figure 34: North America Protective Textiles Market Market Revenue (US$ Mn) Comparison by By End-Use (2016-2032)
- Figure 35: North America Protective Textiles Market Market Y-o-Y Growth Rate Comparison by Country (2016-2032)
- Figure 36: North America Protective Textiles Market Market Y-o-Y Growth Rate Comparison by By Material (2016-2032)
- Figure 37: North America Protective Textiles Market Market Y-o-Y Growth Rate Comparison by By Application (2016-2032)
- Figure 38: North America Protective Textiles Market Market Y-o-Y Growth Rate Comparison by By End-Use (2016-2032)
- Figure 39: North America Protective Textiles Market Market Share Comparison by Country (2016-2032)
- Figure 40: North America Protective Textiles Market Market Share Comparison by By Material (2016-2032)
- Figure 41: North America Protective Textiles Market Market Share Comparison by By Application (2016-2032)
- Figure 42: North America Protective Textiles Market Market Share Comparison by By End-Use (2016-2032)
- Figure 43: Western Europe Protective Textiles Market Revenue (US$ Mn) Market Share by By Materialin 2022
- Figure 44: Western Europe Protective Textiles Market Market Attractiveness Analysis by By Material, 2016-2032
- Figure 45: Western Europe Protective Textiles Market Revenue (US$ Mn) Market Share by By Applicationin 2022
- Figure 46: Western Europe Protective Textiles Market Market Attractiveness Analysis by By Application, 2016-2032
- Figure 47: Western Europe Protective Textiles Market Revenue (US$ Mn) Market Share by By End-Usein 2022
- Figure 48: Western Europe Protective Textiles Market Market Attractiveness Analysis by By End-Use, 2016-2032
- Figure 49: Western Europe Protective Textiles Market Revenue (US$ Mn) Market Share by Country in 2022
- Figure 50: Western Europe Protective Textiles Market Market Attractiveness Analysis by Country, 2016-2032
- Figure 51: Western Europe Protective Textiles Market Market Revenue (US$ Mn) (2016-2032)
- Figure 52: Western Europe Protective Textiles Market Market Revenue (US$ Mn) Comparison by Country (2016-2032)
- Figure 53: Western Europe Protective Textiles Market Market Revenue (US$ Mn) Comparison by By Material (2016-2032)
- Figure 54: Western Europe Protective Textiles Market Market Revenue (US$ Mn) Comparison by By Application (2016-2032)
- Figure 55: Western Europe Protective Textiles Market Market Revenue (US$ Mn) Comparison by By End-Use (2016-2032)
- Figure 56: Western Europe Protective Textiles Market Market Y-o-Y Growth Rate Comparison by Country (2016-2032)
- Figure 57: Western Europe Protective Textiles Market Market Y-o-Y Growth Rate Comparison by By Material (2016-2032)
- Figure 58: Western Europe Protective Textiles Market Market Y-o-Y Growth Rate Comparison by By Application (2016-2032)
- Figure 59: Western Europe Protective Textiles Market Market Y-o-Y Growth Rate Comparison by By End-Use (2016-2032)
- Figure 60: Western Europe Protective Textiles Market Market Share Comparison by Country (2016-2032)
- Figure 61: Western Europe Protective Textiles Market Market Share Comparison by By Material (2016-2032)
- Figure 62: Western Europe Protective Textiles Market Market Share Comparison by By Application (2016-2032)
- Figure 63: Western Europe Protective Textiles Market Market Share Comparison by By End-Use (2016-2032)
- Figure 64: Eastern Europe Protective Textiles Market Revenue (US$ Mn) Market Share by By Materialin 2022
- Figure 65: Eastern Europe Protective Textiles Market Market Attractiveness Analysis by By Material, 2016-2032
- Figure 66: Eastern Europe Protective Textiles Market Revenue (US$ Mn) Market Share by By Applicationin 2022
- Figure 67: Eastern Europe Protective Textiles Market Market Attractiveness Analysis by By Application, 2016-2032
- Figure 68: Eastern Europe Protective Textiles Market Revenue (US$ Mn) Market Share by By End-Usein 2022
- Figure 69: Eastern Europe Protective Textiles Market Market Attractiveness Analysis by By End-Use, 2016-2032
- Figure 70: Eastern Europe Protective Textiles Market Revenue (US$ Mn) Market Share by Country in 2022
- Figure 71: Eastern Europe Protective Textiles Market Market Attractiveness Analysis by Country, 2016-2032
- Figure 72: Eastern Europe Protective Textiles Market Market Revenue (US$ Mn) (2016-2032)
- Figure 73: Eastern Europe Protective Textiles Market Market Revenue (US$ Mn) Comparison by Country (2016-2032)
- Figure 74: Eastern Europe Protective Textiles Market Market Revenue (US$ Mn) Comparison by By Material (2016-2032)
- Figure 75: Eastern Europe Protective Textiles Market Market Revenue (US$ Mn) Comparison by By Application (2016-2032)
- Figure 76: Eastern Europe Protective Textiles Market Market Revenue (US$ Mn) Comparison by By End-Use (2016-2032)
- Figure 77: Eastern Europe Protective Textiles Market Market Y-o-Y Growth Rate Comparison by Country (2016-2032)
- Figure 78: Eastern Europe Protective Textiles Market Market Y-o-Y Growth Rate Comparison by By Material (2016-2032)
- Figure 79: Eastern Europe Protective Textiles Market Market Y-o-Y Growth Rate Comparison by By Application (2016-2032)
- Figure 80: Eastern Europe Protective Textiles Market Market Y-o-Y Growth Rate Comparison by By End-Use (2016-2032)
- Figure 81: Eastern Europe Protective Textiles Market Market Share Comparison by Country (2016-2032)
- Figure 82: Eastern Europe Protective Textiles Market Market Share Comparison by By Material (2016-2032)
- Figure 83: Eastern Europe Protective Textiles Market Market Share Comparison by By Application (2016-2032)
- Figure 84: Eastern Europe Protective Textiles Market Market Share Comparison by By End-Use (2016-2032)
- Figure 85: APAC Protective Textiles Market Revenue (US$ Mn) Market Share by By Materialin 2022
- Figure 86: APAC Protective Textiles Market Market Attractiveness Analysis by By Material, 2016-2032
- Figure 87: APAC Protective Textiles Market Revenue (US$ Mn) Market Share by By Applicationin 2022
- Figure 88: APAC Protective Textiles Market Market Attractiveness Analysis by By Application, 2016-2032
- Figure 89: APAC Protective Textiles Market Revenue (US$ Mn) Market Share by By End-Usein 2022
- Figure 90: APAC Protective Textiles Market Market Attractiveness Analysis by By End-Use, 2016-2032
- Figure 91: APAC Protective Textiles Market Revenue (US$ Mn) Market Share by Country in 2022
- Figure 92: APAC Protective Textiles Market Market Attractiveness Analysis by Country, 2016-2032
- Figure 93: APAC Protective Textiles Market Market Revenue (US$ Mn) (2016-2032)
- Figure 94: APAC Protective Textiles Market Market Revenue (US$ Mn) Comparison by Country (2016-2032)
- Figure 95: APAC Protective Textiles Market Market Revenue (US$ Mn) Comparison by By Material (2016-2032)
- Figure 96: APAC Protective Textiles Market Market Revenue (US$ Mn) Comparison by By Application (2016-2032)
- Figure 97: APAC Protective Textiles Market Market Revenue (US$ Mn) Comparison by By End-Use (2016-2032)
- Figure 98: APAC Protective Textiles Market Market Y-o-Y Growth Rate Comparison by Country (2016-2032)
- Figure 99: APAC Protective Textiles Market Market Y-o-Y Growth Rate Comparison by By Material (2016-2032)
- Figure 100: APAC Protective Textiles Market Market Y-o-Y Growth Rate Comparison by By Application (2016-2032)
- Figure 101: APAC Protective Textiles Market Market Y-o-Y Growth Rate Comparison by By End-Use (2016-2032)
- Figure 102: APAC Protective Textiles Market Market Share Comparison by Country (2016-2032)
- Figure 103: APAC Protective Textiles Market Market Share Comparison by By Material (2016-2032)
- Figure 104: APAC Protective Textiles Market Market Share Comparison by By Application (2016-2032)
- Figure 105: APAC Protective Textiles Market Market Share Comparison by By End-Use (2016-2032)
- Figure 106: Latin America Protective Textiles Market Revenue (US$ Mn) Market Share by By Materialin 2022
- Figure 107: Latin America Protective Textiles Market Market Attractiveness Analysis by By Material, 2016-2032
- Figure 108: Latin America Protective Textiles Market Revenue (US$ Mn) Market Share by By Applicationin 2022
- Figure 109: Latin America Protective Textiles Market Market Attractiveness Analysis by By Application, 2016-2032
- Figure 110: Latin America Protective Textiles Market Revenue (US$ Mn) Market Share by By End-Usein 2022
- Figure 111: Latin America Protective Textiles Market Market Attractiveness Analysis by By End-Use, 2016-2032
- Figure 112: Latin America Protective Textiles Market Revenue (US$ Mn) Market Share by Country in 2022
- Figure 113: Latin America Protective Textiles Market Market Attractiveness Analysis by Country, 2016-2032
- Figure 114: Latin America Protective Textiles Market Market Revenue (US$ Mn) (2016-2032)
- Figure 115: Latin America Protective Textiles Market Market Revenue (US$ Mn) Comparison by Country (2016-2032)
- Figure 116: Latin America Protective Textiles Market Market Revenue (US$ Mn) Comparison by By Material (2016-2032)
- Figure 117: Latin America Protective Textiles Market Market Revenue (US$ Mn) Comparison by By Application (2016-2032)
- Figure 118: Latin America Protective Textiles Market Market Revenue (US$ Mn) Comparison by By End-Use (2016-2032)
- Figure 119: Latin America Protective Textiles Market Market Y-o-Y Growth Rate Comparison by Country (2016-2032)
- Figure 120: Latin America Protective Textiles Market Market Y-o-Y Growth Rate Comparison by By Material (2016-2032)
- Figure 121: Latin America Protective Textiles Market Market Y-o-Y Growth Rate Comparison by By Application (2016-2032)
- Figure 122: Latin America Protective Textiles Market Market Y-o-Y Growth Rate Comparison by By End-Use (2016-2032)
- Figure 123: Latin America Protective Textiles Market Market Share Comparison by Country (2016-2032)
- Figure 124: Latin America Protective Textiles Market Market Share Comparison by By Material (2016-2032)
- Figure 125: Latin America Protective Textiles Market Market Share Comparison by By Application (2016-2032)
- Figure 126: Latin America Protective Textiles Market Market Share Comparison by By End-Use (2016-2032)
- Figure 127: Middle East & Africa Protective Textiles Market Revenue (US$ Mn) Market Share by By Materialin 2022
- Figure 128: Middle East & Africa Protective Textiles Market Market Attractiveness Analysis by By Material, 2016-2032
- Figure 129: Middle East & Africa Protective Textiles Market Revenue (US$ Mn) Market Share by By Applicationin 2022
- Figure 130: Middle East & Africa Protective Textiles Market Market Attractiveness Analysis by By Application, 2016-2032
- Figure 131: Middle East & Africa Protective Textiles Market Revenue (US$ Mn) Market Share by By End-Usein 2022
- Figure 132: Middle East & Africa Protective Textiles Market Market Attractiveness Analysis by By End-Use, 2016-2032
- Figure 133: Middle East & Africa Protective Textiles Market Revenue (US$ Mn) Market Share by Country in 2022
- Figure 134: Middle East & Africa Protective Textiles Market Market Attractiveness Analysis by Country, 2016-2032
- Figure 135: Middle East & Africa Protective Textiles Market Market Revenue (US$ Mn) (2016-2032)
- Figure 136: Middle East & Africa Protective Textiles Market Market Revenue (US$ Mn) Comparison by Country (2016-2032)
- Figure 137: Middle East & Africa Protective Textiles Market Market Revenue (US$ Mn) Comparison by By Material (2016-2032)
- Figure 138: Middle East & Africa Protective Textiles Market Market Revenue (US$ Mn) Comparison by By Application (2016-2032)
- Figure 139: Middle East & Africa Protective Textiles Market Market Revenue (US$ Mn) Comparison by By End-Use (2016-2032)
- Figure 140: Middle East & Africa Protective Textiles Market Market Y-o-Y Growth Rate Comparison by Country (2016-2032)
- Figure 141: Middle East & Africa Protective Textiles Market Market Y-o-Y Growth Rate Comparison by By Material (2016-2032)
- Figure 142: Middle East & Africa Protective Textiles Market Market Y-o-Y Growth Rate Comparison by By Application (2016-2032)
- Figure 143: Middle East & Africa Protective Textiles Market Market Y-o-Y Growth Rate Comparison by By End-Use (2016-2032)
- Figure 144: Middle East & Africa Protective Textiles Market Market Share Comparison by Country (2016-2032)
- Figure 145: Middle East & Africa Protective Textiles Market Market Share Comparison by By Material (2016-2032)
- Figure 146: Middle East & Africa Protective Textiles Market Market Share Comparison by By Application (2016-2032)
- Figure 147: Middle East & Africa Protective Textiles Market Market Share Comparison by By End-Use (2016-2032)
"
- List of Tables
- "
- Table 1: Global Protective Textiles Market Market Comparison by By Material (2016-2032)
- Table 2: Global Protective Textiles Market Market Comparison by By Application (2016-2032)
- Table 3: Global Protective Textiles Market Market Comparison by By End-Use (2016-2032)
- Table 4: Global Protective Textiles Market Revenue (US$ Mn) Comparison by Region (2016-2032)
- Table 5: Global Protective Textiles Market Market Revenue (US$ Mn) (2016-2032)
- Table 6: Global Protective Textiles Market Market Revenue (US$ Mn) Comparison by Region (2016-2032)
- Table 7: Global Protective Textiles Market Market Revenue (US$ Mn) Comparison by By Material (2016-2032)
- Table 8: Global Protective Textiles Market Market Revenue (US$ Mn) Comparison by By Application (2016-2032)
- Table 9: Global Protective Textiles Market Market Revenue (US$ Mn) Comparison by By End-Use (2016-2032)
- Table 10: Global Protective Textiles Market Market Y-o-Y Growth Rate Comparison by Region (2016-2032)
- Table 11: Global Protective Textiles Market Market Y-o-Y Growth Rate Comparison by By Material (2016-2032)
- Table 12: Global Protective Textiles Market Market Y-o-Y Growth Rate Comparison by By Application (2016-2032)
- Table 13: Global Protective Textiles Market Market Y-o-Y Growth Rate Comparison by By End-Use (2016-2032)
- Table 14: Global Protective Textiles Market Market Share Comparison by Region (2016-2032)
- Table 15: Global Protective Textiles Market Market Share Comparison by By Material (2016-2032)
- Table 16: Global Protective Textiles Market Market Share Comparison by By Application (2016-2032)
- Table 17: Global Protective Textiles Market Market Share Comparison by By End-Use (2016-2032)
- Table 18: North America Protective Textiles Market Market Comparison by By Application (2016-2032)
- Table 19: North America Protective Textiles Market Market Comparison by By End-Use (2016-2032)
- Table 20: North America Protective Textiles Market Revenue (US$ Mn) Comparison by Country (2016-2032)
- Table 21: North America Protective Textiles Market Market Revenue (US$ Mn) (2016-2032)
- Table 22: North America Protective Textiles Market Market Revenue (US$ Mn) Comparison by Country (2016-2032)
- Table 23: North America Protective Textiles Market Market Revenue (US$ Mn) Comparison by By Material (2016-2032)
- Table 24: North America Protective Textiles Market Market Revenue (US$ Mn) Comparison by By Application (2016-2032)
- Table 25: North America Protective Textiles Market Market Revenue (US$ Mn) Comparison by By End-Use (2016-2032)
- Table 26: North America Protective Textiles Market Market Y-o-Y Growth Rate Comparison by Country (2016-2032)
- Table 27: North America Protective Textiles Market Market Y-o-Y Growth Rate Comparison by By Material (2016-2032)
- Table 28: North America Protective Textiles Market Market Y-o-Y Growth Rate Comparison by By Application (2016-2032)
- Table 29: North America Protective Textiles Market Market Y-o-Y Growth Rate Comparison by By End-Use (2016-2032)
- Table 30: North America Protective Textiles Market Market Share Comparison by Country (2016-2032)
- Table 31: North America Protective Textiles Market Market Share Comparison by By Material (2016-2032)
- Table 32: North America Protective Textiles Market Market Share Comparison by By Application (2016-2032)
- Table 33: North America Protective Textiles Market Market Share Comparison by By End-Use (2016-2032)
- Table 34: Western Europe Protective Textiles Market Market Comparison by By Material (2016-2032)
- Table 35: Western Europe Protective Textiles Market Market Comparison by By Application (2016-2032)
- Table 36: Western Europe Protective Textiles Market Market Comparison by By End-Use (2016-2032)
- Table 37: Western Europe Protective Textiles Market Revenue (US$ Mn) Comparison by Country (2016-2032)
- Table 38: Western Europe Protective Textiles Market Market Revenue (US$ Mn) (2016-2032)
- Table 39: Western Europe Protective Textiles Market Market Revenue (US$ Mn) Comparison by Country (2016-2032)
- Table 40: Western Europe Protective Textiles Market Market Revenue (US$ Mn) Comparison by By Material (2016-2032)
- Table 41: Western Europe Protective Textiles Market Market Revenue (US$ Mn) Comparison by By Application (2016-2032)
- Table 42: Western Europe Protective Textiles Market Market Revenue (US$ Mn) Comparison by By End-Use (2016-2032)
- Table 43: Western Europe Protective Textiles Market Market Y-o-Y Growth Rate Comparison by Country (2016-2032)
- Table 44: Western Europe Protective Textiles Market Market Y-o-Y Growth Rate Comparison by By Material (2016-2032)
- Table 45: Western Europe Protective Textiles Market Market Y-o-Y Growth Rate Comparison by By Application (2016-2032)
- Table 46: Western Europe Protective Textiles Market Market Y-o-Y Growth Rate Comparison by By End-Use (2016-2032)
- Table 47: Western Europe Protective Textiles Market Market Share Comparison by Country (2016-2032)
- Table 48: Western Europe Protective Textiles Market Market Share Comparison by By Material (2016-2032)
- Table 49: Western Europe Protective Textiles Market Market Share Comparison by By Application (2016-2032)
- Table 50: Western Europe Protective Textiles Market Market Share Comparison by By End-Use (2016-2032)
- Table 51: Eastern Europe Protective Textiles Market Market Comparison by By Material (2016-2032)
- Table 52: Eastern Europe Protective Textiles Market Market Comparison by By Application (2016-2032)
- Table 53: Eastern Europe Protective Textiles Market Market Comparison by By End-Use (2016-2032)
- Table 54: Eastern Europe Protective Textiles Market Revenue (US$ Mn) Comparison by Country (2016-2032)
- Table 55: Eastern Europe Protective Textiles Market Market Revenue (US$ Mn) (2016-2032)
- Table 56: Eastern Europe Protective Textiles Market Market Revenue (US$ Mn) Comparison by Country (2016-2032)
- Table 57: Eastern Europe Protective Textiles Market Market Revenue (US$ Mn) Comparison by By Material (2016-2032)
- Table 58: Eastern Europe Protective Textiles Market Market Revenue (US$ Mn) Comparison by By Application (2016-2032)
- Table 59: Eastern Europe Protective Textiles Market Market Revenue (US$ Mn) Comparison by By End-Use (2016-2032)
- Table 60: Eastern Europe Protective Textiles Market Market Y-o-Y Growth Rate Comparison by Country (2016-2032)
- Table 61: Eastern Europe Protective Textiles Market Market Y-o-Y Growth Rate Comparison by By Material (2016-2032)
- Table 62: Eastern Europe Protective Textiles Market Market Y-o-Y Growth Rate Comparison by By Application (2016-2032)
- Table 63: Eastern Europe Protective Textiles Market Market Y-o-Y Growth Rate Comparison by By End-Use (2016-2032)
- Table 64: Eastern Europe Protective Textiles Market Market Share Comparison by Country (2016-2032)
- Table 65: Eastern Europe Protective Textiles Market Market Share Comparison by By Material (2016-2032)
- Table 66: Eastern Europe Protective Textiles Market Market Share Comparison by By Application (2016-2032)
- Table 67: Eastern Europe Protective Textiles Market Market Share Comparison by By End-Use (2016-2032)
- Table 68: APAC Protective Textiles Market Market Comparison by By Material (2016-2032)
- Table 69: APAC Protective Textiles Market Market Comparison by By Application (2016-2032)
- Table 70: APAC Protective Textiles Market Market Comparison by By End-Use (2016-2032)
- Table 71: APAC Protective Textiles Market Revenue (US$ Mn) Comparison by Country (2016-2032)
- Table 72: APAC Protective Textiles Market Market Revenue (US$ Mn) (2016-2032)
- Table 73: APAC Protective Textiles Market Market Revenue (US$ Mn) Comparison by Country (2016-2032)
- Table 74: APAC Protective Textiles Market Market Revenue (US$ Mn) Comparison by By Material (2016-2032)
- Table 75: APAC Protective Textiles Market Market Revenue (US$ Mn) Comparison by By Application (2016-2032)
- Table 76: APAC Protective Textiles Market Market Revenue (US$ Mn) Comparison by By End-Use (2016-2032)
- Table 77: APAC Protective Textiles Market Market Y-o-Y Growth Rate Comparison by Country (2016-2032)
- Table 78: APAC Protective Textiles Market Market Y-o-Y Growth Rate Comparison by By Material (2016-2032)
- Table 79: APAC Protective Textiles Market Market Y-o-Y Growth Rate Comparison by By Application (2016-2032)
- Table 80: APAC Protective Textiles Market Market Y-o-Y Growth Rate Comparison by By End-Use (2016-2032)
- Table 81: APAC Protective Textiles Market Market Share Comparison by Country (2016-2032)
- Table 82: APAC Protective Textiles Market Market Share Comparison by By Material (2016-2032)
- Table 83: APAC Protective Textiles Market Market Share Comparison by By Application (2016-2032)
- Table 84: APAC Protective Textiles Market Market Share Comparison by By End-Use (2016-2032)
- Table 85: Latin America Protective Textiles Market Market Comparison by By Material (2016-2032)
- Table 86: Latin America Protective Textiles Market Market Comparison by By Application (2016-2032)
- Table 87: Latin America Protective Textiles Market Market Comparison by By End-Use (2016-2032)
- Table 88: Latin America Protective Textiles Market Revenue (US$ Mn) Comparison by Country (2016-2032)
- Table 89: Latin America Protective Textiles Market Market Revenue (US$ Mn) (2016-2032)
- Table 90: Latin America Protective Textiles Market Market Revenue (US$ Mn) Comparison by Country (2016-2032)
- Table 91: Latin America Protective Textiles Market Market Revenue (US$ Mn) Comparison by By Material (2016-2032)
- Table 92: Latin America Protective Textiles Market Market Revenue (US$ Mn) Comparison by By Application (2016-2032)
- Table 93: Latin America Protective Textiles Market Market Revenue (US$ Mn) Comparison by By End-Use (2016-2032)
- Table 94: Latin America Protective Textiles Market Market Y-o-Y Growth Rate Comparison by Country (2016-2032)
- Table 95: Latin America Protective Textiles Market Market Y-o-Y Growth Rate Comparison by By Material (2016-2032)
- Table 96: Latin America Protective Textiles Market Market Y-o-Y Growth Rate Comparison by By Application (2016-2032)
- Table 97: Latin America Protective Textiles Market Market Y-o-Y Growth Rate Comparison by By End-Use (2016-2032)
- Table 98: Latin America Protective Textiles Market Market Share Comparison by Country (2016-2032)
- Table 99: Latin America Protective Textiles Market Market Share Comparison by By Material (2016-2032)
- Table 100: Latin America Protective Textiles Market Market Share Comparison by By Application (2016-2032)
- Table 101: Latin America Protective Textiles Market Market Share Comparison by By End-Use (2016-2032)
- Table 102: Middle East & Africa Protective Textiles Market Market Comparison by By Material (2016-2032)
- Table 103: Middle East & Africa Protective Textiles Market Market Comparison by By Application (2016-2032)
- Table 104: Middle East & Africa Protective Textiles Market Market Comparison by By End-Use (2016-2032)
- Table 105: Middle East & Africa Protective Textiles Market Revenue (US$ Mn) Comparison by Country (2016-2032)
- Table 106: Middle East & Africa Protective Textiles Market Market Revenue (US$ Mn) (2016-2032)
- Table 107: Middle East & Africa Protective Textiles Market Market Revenue (US$ Mn) Comparison by Country (2016-2032)
- Table 108: Middle East & Africa Protective Textiles Market Market Revenue (US$ Mn) Comparison by By Material (2016-2032)
- Table 109: Middle East & Africa Protective Textiles Market Market Revenue (US$ Mn) Comparison by By Application (2016-2032)
- Table 110: Middle East & Africa Protective Textiles Market Market Revenue (US$ Mn) Comparison by By End-Use (2016-2032)
- Table 111: Middle East & Africa Protective Textiles Market Market Y-o-Y Growth Rate Comparison by Country (2016-2032)
- Table 112: Middle East & Africa Protective Textiles Market Market Y-o-Y Growth Rate Comparison by By Material (2016-2032)
- Table 113: Middle East & Africa Protective Textiles Market Market Y-o-Y Growth Rate Comparison by By Application (2016-2032)
- Table 114: Middle East & Africa Protective Textiles Market Market Y-o-Y Growth Rate Comparison by By End-Use (2016-2032)
- Table 115: Middle East & Africa Protective Textiles Market Market Share Comparison by Country (2016-2032)
- Table 116: Middle East & Africa Protective Textiles Market Market Share Comparison by By Material (2016-2032)
- Table 117: Middle East & Africa Protective Textiles Market Market Share Comparison by By Application (2016-2032)
- Table 118: Middle East & Africa Protective Textiles Market Market Share Comparison by By End-Use (2016-2032)
- 1. Executive Summary
-
- DuPont
- Royal Ten Cate NV
- W. L. Gore & Associates, Inc.
- Kusumgar Corporates
- DyStar Group
- Schoeller Textil AG
- ARGAR S.r.l
- Madhuram Fabrics Pvt. Ltd.
- Teijin Limited
- PBI Performance Products, Inc., and more.
Our Clients


View Our Licence Options
