Probiotics Market By Strain Type (Lactobacillus, Bifidobacterium, Streptococcus, Saccharomyces), By Distribution Channel (Supermarkets and Hypermarkets, Pharmacies and Drugstores, Online Retailers), By Region And Companies - Industry Segment Outlook, Market Assessment, Competition Scenario, Trends, And Forecast 2023-2032
-
3293
-
Oct 2023
-
177
-


-
This report was compiled by Shreyas Rokade Shreyas Rokade is a seasoned Research Analyst with CMFE, bringing extensive expertise in market research and consulting, with a strong background in Chemical Engineering. Correspondence Team Lead-CMFE Linkedin | Detailed Market research Methodology Our methodology involves a mix of primary research, including interviews with leading mental health experts, and secondary research from reputable medical journals and databases. View Detailed Methodology Page
-
Quick Navigation
Report Overview
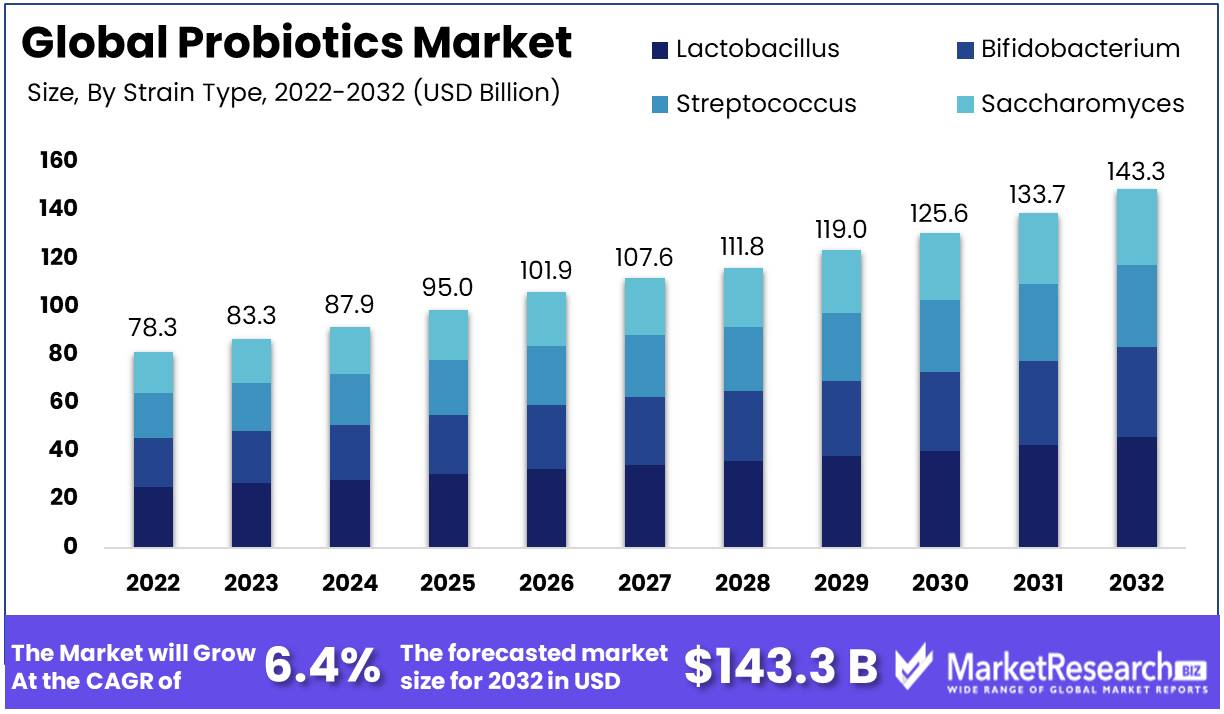
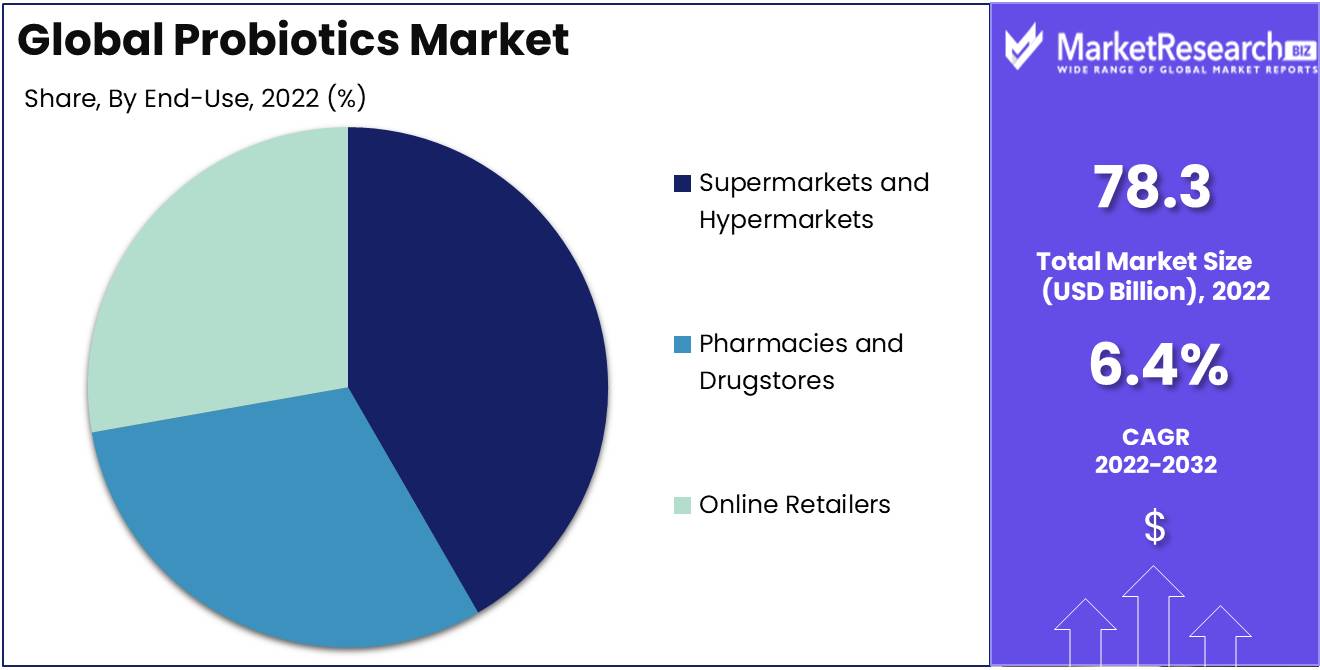
The Probiotics Market size is expected to be worth around USD 143.3 Bn by 2032 from USD 78.3 Bn in 2022, growing at a CAGR of 6.4% during the forecast period from 2023 to 2032.
The probiotics market growth is being fueled by a growing understanding of the numerous benefits of promoting digestive health. Probiotics, these effervescent microorganisms that manifest healthful effects upon adequate ingestion, have become a subject of unwavering fascination among consumers who seek digestive prowess and holistic vitality in the products they favor.
The probiotics industry is experiencing a meteoric rise as food and supplement manufacturers enthusiastically incorporate these microscopic organisms into their product lines. The paramount purpose of probiotics, which is to promote a balanced intestinal microbiota and optimize digestive function, highlights their vital importance. These microbial companions possess a vast array of abilities, ranging from bolstering the immune system and aiding in weight management to promoting cognitive health and inhibiting inflammatory processes.
Progressive advances in probiotic technology gravitate toward the production of robust strains with enhanced potency, thereby bolstering their resistance to the stringent rigors of the gastrointestinal environment. The applications of probiotics are expanding in a kaleidoscopic manner, whether through innovative breakthroughs that go beyond the confines of traditional dietary supplements and fermented foods or personalized probiotic products tailored to the specific needs of individual health requirements.
Probiotics have been gaining immense popularity in recent years for their wide-ranging health benefits. As the public becomes more aware of gut health, the demand for probiotics has steadily increased. Probiotics are live microorganisms that provide benefits when consumed in adequate amounts. They can help improve Digestive Juices and overall digestive function. Probiotics may also help reduce Oxidative Damage in the body caused by stress and poor diet.
Major food and beverage companies are responding to this demand by incorporating probiotics into Innovative Products like yogurts, cheeses, granola bars, and even Green Tea Garden. The Inclusion Of Probiotics in our diet can aid in boosting immunity, enhancing nutrient absorption, alleviating digestive issues, and promoting overall health. With the rising consumer interest in functional foods, the probiotics market is poised for further growth and diversification. Probiotics are certainly one healthy trend that is here to stay.
Driving Factors
The Rising Prevalence of Digestive Disorders and Gut Related Diseases
The Probiotics market is expanding as a result of the rising prevalence of digestive disorders and diseases related to the intestines. Demand for probiotics as a natural remedy to promote digestive health increases proportionally with the number of individuals experiencing gastrointestinal problems. To address these concerns and preserve a balanced gastrointestinal microbiome, consumers are increasingly turning to probiotic supplements and foods.
Rising Demand for Animal Probiotics in Animal Nutrition and Feed Additives
Animal Probiotics are becoming increasingly popular in the probiotic market. The Demand For Animal Probiotics has been rising steadily over the past few years. This is due to the numerous benefits that probiotics can provide to livestock and pets. Probiotics are now commonly being added to Animal Feed as they can improve gut health, enhance digestion, and boost immunity in animals. The use of Probiotics In Animal Feed has been shown to increase weight gain and feed conversion rates in livestock animals.
Additionally, probiotics can help reduce instances of diarrhea and other digestive issues commonly faced by livestock and pets. The growing consumer demand for antibiotic-free animal products is further fueling the demand for animal probiotics globally. As the probiotic market expands, animal nutrition and feed additives are expected to be the key application sectors driving future growth.
Shift Towards Natural and Organic Products
The demand for probiotics has significantly increased as consumers shift their preferences toward organic and natural products. As consumers become more aware of the potential health hazards associated with synthetic ingredients, they gravitate toward probiotic products derived from natural and organic sources. This predilection is consistent with the prevailing trend of adopting a more sustainable and environmentally friendly consumption strategy.
Plant-Based and Eco-Friendly Probiotics
With the adoption of plant-based and eco-friendly probiotics, the probiotics market has significant growth potential. Consumers are more likely to prefer probiotics derived from plant-based ingredients as the demand for sustainable and environmentally conscious products rises. This change correlates with the larger trend toward a more eco-friendly lifestyle and resonates with the values of a growing segment of consumers.
Personalized Nutrition and Healthy Lifestyle
The trend toward personalized nutrition and the adoption of healthful lifestyles have the potential to benefit the probiotics market. As individuals strive to improve their immune health, they turn to probiotics to maintain a healthy intestinal microbiome. This inclination toward preventative healthcare and the pursuit of personalized wellness creates opportunities for the Probiotics market to satisfy the diverse requirements and preferences of consumers.
Restraining Factors
The Rising Prevalence of Digestive Disorders and Gut Related Diseases
The Probiotics market is expanding as a result of the rising prevalence of digestive disorders and diseases related to the intestines. Demand for probiotics as a natural remedy to promote digestive health increases proportionally with the number of individuals experiencing gastrointestinal problems. To address these concerns and preserve a balanced gastrointestinal microbiome, consumers are increasingly turning to probiotic supplements and foods.
Animal Nutrition and Feed Additives
The increased use of probiotics in animal nutrition is also advantageous to the Probiotics market. The addition of probiotic feed additives improves digestion and contributes to the animals' overall health. This development has resulted in an increase in demand for animal feed products containing probiotics, thereby bolstering the growth trajectory of the market.
Shift Towards Natural and Organic Products
The demand for probiotics is driven by a significant shift in consumer preference toward natural and organic products. As consumers become more aware of the potential health issues associated with synthetic ingredients, they gravitate toward probiotic products derived from natural and organic sources. This predilection is consistent with the prevailing trend of adopting a more sustainable and environmentally friendly consumption strategy.
Plant-Based and Eco-Friendly Probiotics
With the adoption of plant-based and eco-friendly probiotics, the Probiotics market has significant growth potential. Consumers are more likely to prefer probiotics derived from plant-based ingredients as the demand for sustainable and environmentally conscious products rises. This change correlates with the larger trend toward a more eco-friendly lifestyle and resonates with the values of a growing segment of consumers.
Personalized Nutrition and Healthy Lifestyle
The trend toward personalized nutrition and the adoption of healthful lifestyles have the potential to benefit the probiotics market. As individuals strive to improve their health, they turn to probiotics to maintain a healthy intestinal microbiome. This inclination toward preventative healthcare and the pursuit of personalized wellness creates opportunities for the Probiotics market to satisfy the diverse requirements and preferences of consumers.
Strain Type Analysis
The Probiotics Market is acquiring traction rapidly among global consumers, with the Lactobacillus segment dominating the industry. In the future years, the Lactobacillus segment is anticipated to experience the highest annual growth rate.
The Lactobacillus segment dominates the global probiotics market. This segment contains multiple strains, including Lactobacillus acidophilus, Lactobacillus casei, Lactobacillus reuteri, Lactobacillus plantarum, and Lactobacillus rhamnosus, to name a few. Lactobacillus acidophilus is the most common strain within the Lactobacillus segment.
The growth of economies in emerging markets is propelling the adoption of the Lactobacillus segment. In emerging economies, the probiotics market is increasing in popularity due to a growing middle class and increased demand for healthy dietary options. In a number of these nations, Lactobacillus-based products are less expensive, making them accessible to a greater number of consumers.
Form Analysis
The global probiotics market is dominated by the Liquid segment which holds the largest probiotics market share. This segment includes drinkable yogurts, kefir, kombucha, and probiotic injections, among others. Consuming probiotics in liquid form is the most convenient.
The economic growth of emerging markets is propelling the adoption of the Liquid segment. With an expanding middle class and a greater emphasis on health, liquid probiotic products are gaining in popularity. Liquid-based products are optimal for individuals with busy lifestyles due to their portability.
Consumer trends and behavior toward the Liquid segment are continuously evolving. Numerous individuals pursue quick and easy ways to maintain a healthy lifestyle, as convenience is a crucial factor for modern consumers. The liquid form is simple to ingest and requires no preparation, making it an excellent option for many consumers.
Application Analysis
The Food & Beverages segment dominates the global probiotics market. This segment includes yogurt, kefir, and additional fermented foods and beverages. As the most traditional method to consume probiotics, the Food & Beverages segment has the largest market share.
The adoption of the Food and beverages segment is influenced by the economic growth of emerging economies. The probiotics market is gaining prominence globally due to a growing middle class and increased demand for healthy dietary options. Due to their low cost and accessibility, probiotic foods and beverages are becoming increasingly popular in emerging economies.
Trends and consumer behavior pertaining to the Food & Beverages segment are continuously evolving. Consumers are incorporating probiotics into their daily diets as they become more aware of their health benefits. Additionally, the versatility of the segment's products allows consumers to implement probiotics into a variety of meals.
Distribution Channel Analysis
The global probiotic market is dominated by the Supermarkets segment. This segment consists of a variety of businesses, including large corporations, independent shops, and discount retailers.
The adoption of the Supermarkets segment is influenced by economic growth in emerging economies. Due to the expansion of the middle class and rising consumer demand, supermarkets are abundant in emergent economies. The accessibility of probiotic products has been facilitated by their availability in supermarkets.
Consumer trends and behavior toward the Supermarkets segment are continuously evolving. Supermarkets are the most popular retail channel on a global scale, as consumers seek convenience and accessibility. The availability of probiotic products in supermarkets has made it simple for consumers to incorporate them into their daily regimens.
Key Market Segments
By Strain Type
- Lactobacillus
- Bifidobacterium
- Streptococcus
- Saccharomyces
By Ingredient
- Bacteria
- Yeast
By Form
- Liquid
- Dry
By Application
- Food & Beverages
- Dietary Supplements
- Animal Feed
By Distribution Channel
- Supermarkets and Hypermarkets
- Pharmacies and Drugstores
- Online Retailers
- Retail Stores
Growth Opportunity
Newly-Formed Economies Demand for Probiotics Increasing
The global probiotics industry growth has been fuelled by the emergence of new and emerging economies, along with rising health concerns and awareness. China, India, and Brazil are anticipated to experience significant increases in probiotics demand. In these economies, consumers are becoming increasingly health-conscious, and the significance of maintaining a healthy intestinal microbiota is becoming increasingly apparent. The rising demand for probiotics in these markets presents a substantial opportunity for the global probiotics market to expand.
Innovative Strains of Probiotics
Innovation is crucial to the expansion of the probiotics market. Demand for probiotics is being driven by scientific breakthroughs in the creation of novel and innovative probiotic strains that provide distinct health benefits. Researchers and manufacturers are perpetually searching for novel and improved methods of probiotic delivery to consumers. As a result, there is a growing emphasis on the development of strains that can withstand the harsh conditions of the human gut, endure digestion, and provide potent health benefits.
Infant and Maternal Health
The use of probiotics in infant nutrition has also contributed to the expansion of the probiotics market. Probiotics have been shown to reduce the incidence of a number of health problems in neonates, including eczema, digestive issues, and respiratory infections. Additionally, probiotics can reduce the risk of premature births and enhance breastfeeding outcomes. As a result, interest in the use of probiotics in infant formula and other infant products has increased.
Opportunities for Probiotics and Feed Manufacturers
The growth of the probiotic market creates opportunities for both Probiotic manufacturers and feed manufacturers. Probiotic manufacturers are investing in new product development and increased production capabilities to meet the rising demand. Meanwhile, feed manufacturers are incorporating more probiotic strains into their animal feed products to cater to the increased consumer demand for antibiotic-free animal products. The symbiotic relationship between probiotics and feed manufacturers will continue to expand the probiotic market.
Latest Trends
Rising Popularity of Plant-Based and Vegan Probiotics
As more individuals become aware of the gut-health benefits of probiotics, many are also becoming more aware of the origin of their probiotics. Vegan probiotics derived from non-animal sources, such as fermented fruits, vegetables, and cereals, are becoming increasingly popular. Vegan and plant-based probiotics are excellent options for those who wish to follow a vegan or plant-based diet while still obtaining the benefits of probiotics. These probiotics are also suitable for individuals with lactose intolerance or dairy sensitivity.
Increasing Use of Probiotics in Sports Nutrition
The increasing use of probiotics in sports nutrition is an additional significant industry trend in the probiotics market. By bolstering the immune system, lowering inflammation, and increasing nutrient assimilation, probiotics can help enhance athletic performance. As athletes need to maintain optimal digestive health to perform at their peak, probiotics and sports nutrition go hand in hand. As a consequence, many sports nutrition products, such as protein powders, energy bars, and sports drinks, now contain probiotics.
Growing Demand for Probiotics in Beauty and Personal Care Products
Probiotics are beneficial not only for digestive health but also for epidermis health. Probiotics can help restore the skin's natural bacterial balance, thereby reducing inflammation, irritation, and acne. Consequently, the demand for probiotics in cosmetics and personal care products such as face creams, serums, and cleansers is increasing. People with sensitive skin favor probiotic beauty products because they are typically milder than conventional beauty products.
Development of Next-Generation Probiotics with Improved Functionality
Scientists continually investigate and develop new probiotics with enhanced functionality. Probiotics of the next generation are being developed to treat specific diseases, such as inflammatory bowel disease, allergies, and even melancholy. Probiotics of the next generation are also being engineered to withstand the harsh conditions of the digestive system, enabling them to reach the intestines and provide the greatest health benefits. These probiotics may be administered in novel forms, including time-release capsules, granules, and even edible films.
The Growing Use of Probiotics in Food Preservation and Fermentation
Probiotics have been used in food preservation and fermentation for centuries, and their use is growing. Probiotics can aid in food preservation by preventing the growth of harmful bacteria, thereby reducing the risk of foodborne infection. Probiotics are also utilized in the fermentation process, which is used to produce foods such as yogurt, pickles, and sauerkraut. In addition to preserving food, the fermentation process increases its nutritional value, making it simpler for the body to digest.
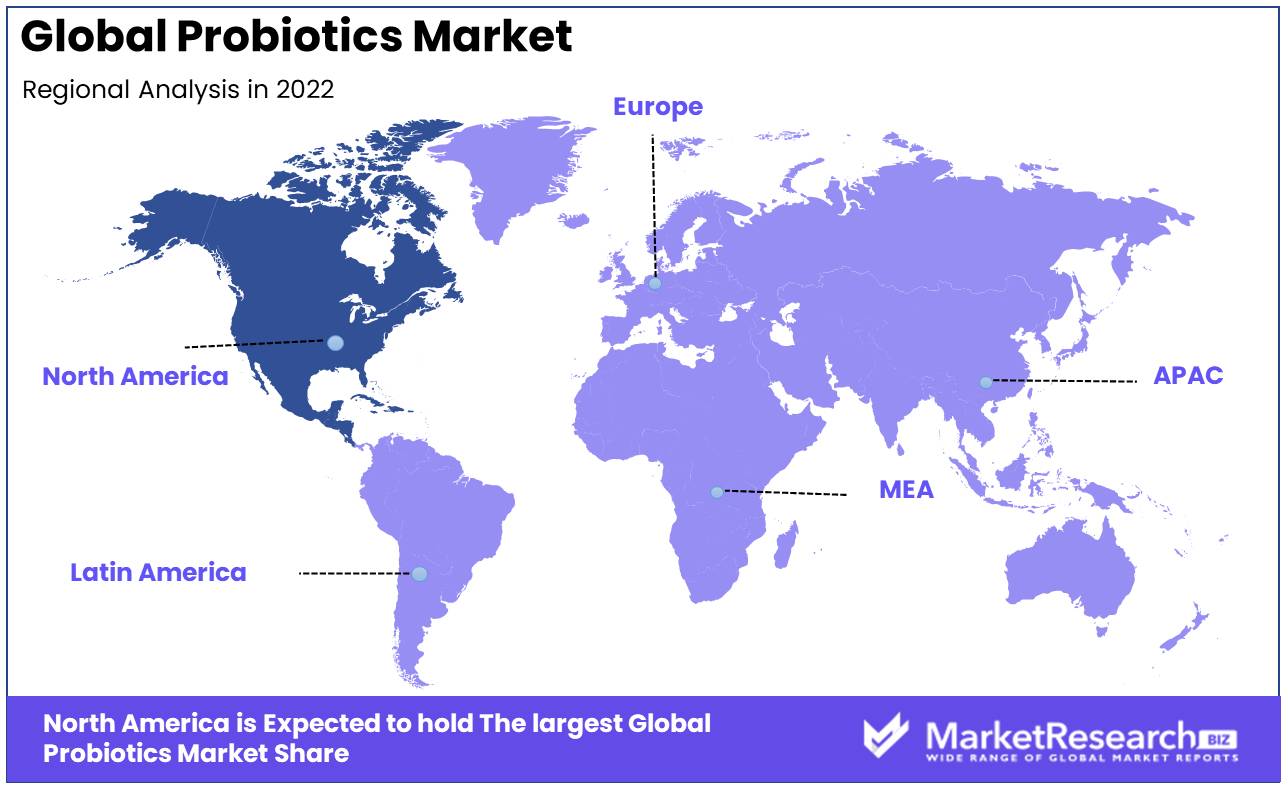
Regional Analysis
North America has emerged as a dominant force in the global Probiotics market, commanding a sizable share and demonstrating remarkable expansion. Numerous important factors contribute to North America's dominance in this booming industry.
The region's strong consumer awareness and demand for probiotic products is one of the main factors contributing to North America's dominance in the Probiotics market. Consumers in North America are well-informed about the benefits of probiotics for promoting digestive health and general health. They actively pursue probiotic supplements, functional foods, and beverages to incorporate into their daily routines, thereby driving market expansion.
Combined with a strong emphasis on research and development, North America has a highly advanced healthcare infrastructure. This favorable ecosystem fosters innovation and enables the timely launch of cutting-edge probiotic products. The region's renowned medical institutions and research centers conduct extensive studies on the effectiveness of probiotics, generating valuable scientific insights that foster consumer confidence and market growth.
North America's Probiotics market benefits from the presence of well-established and influential market participants. The region is home to market-leading companies with comprehensive research and development capabilities, extensive distribution networks, and strong brand recognition. The combination of their market expertise and substantial investments in product development and marketing enables them to effectively meet consumer demands and maintain a competitive edge, thereby consolidating North America's dominance.
North America offers a wide variety of probiotic products, Lifeway Foods Inc. including supplements, functional foods, beverages, and pet nutrition. This extensive selection of products caters to various consumer preferences and lifestyles, assuring complete market coverage. Consumers in North America have access to a variety of probiotic options, allowing them to select products that meet their specific requirements and preferences.
Key Regions and Countries
North America
- US
- Canada
- Mexico
Western Europe
- Germany
- France
- The UK
- Spain
- Italy
- Portugal
- Ireland
- Austria
- Switzerland
- Benelux
- Nordic
- Rest of Western Europe
Eastern Europe
- Russia
- Poland
- The Czech Republic
- Greece
- Rest of Eastern Europe
APAC
- China
- Japan
- South Korea
- India
- Australia & New Zealand
- Indonesia
- Malaysia
- Philippines
- Singapore
- Thailand
- Vietnam
- Rest of APAC
Latin America
- Brazil
- Colombia
- Chile
- Argentina
- Costa Rica
- Rest of Latin America
Middle East & Africa
- Algeria
- Egypt
- Israel
- Kuwait
- Nigeria
- Saudi Arabia
- South Africa
- Turkey
- United Arab Emirates
- Rest of MEA
Key Players Analysis
Danone S.A. (France), a multinational corporation in the food and beverage industry, dominates the Probiotics market. Under its own brand names, such as Activia, Actimel, and DanActive, the corporation offers a variety of probiotic products. In the Probiotics industry, Danone's extensive research and development capabilities, combined with its global presence and strong brand reputation, contribute to its market leadership.
Nestlé SA, a multinational Swiss food and beverage corporation, has a significant presence in the Probiotics market. The business offers probiotic products under a variety of brand names, including Nestlé Yogurt, NesProteins, and Nestlé Nutrition. Nestlé maintains a strong position in the Probiotics industry due to its extensive product offering, global distribution channels, and ongoing research and development investments.
Yakult is the signature product of the Japanese probiotics manufacturer Yakult Honsha Co., Ltd. The company specializes in the production of probiotic beverages containing the patented Lactobacillus casei Shirota strain. Strong brand recognition and an emphasis on digestive health have contributed to Yakult's significant market presence, especially in Asian markets.
Chr Hansen Holding A/S, a Danish bioscience company, is a prominent player in the Probiotics market, offering a comprehensive selection of probiotic solutions. The company specializes in developing and manufacturing probiotic strains for dietary supplements, neonatal nutrition, and dairy products, among other applications. Chr Hansen's expertise in microbial cultures and dedication to innovation have positioned the company as a global leader in probiotics.
Probi AB, a Swedish biotechnology company, concentrates on probiotic product research, development, and manufacturing. The company collaborates with collaborators in the food, healthcare, and pharmaceutical companies to integrate its proprietary probiotic strains into a variety of applications. Probi AB's emphasis on scientific research and its robust portfolio of clinically documented probiotic strains have positioned the company as a dominant player in the Probiotics market.
Top Key Major Players in Probiotics Market
- BioGaia AB
- Danone S.A.
- Hansen Holding A/S
- Yakult Honsha Co. Ltd.
- Probi AB
- Lifeway Foods Inc.
- MORINAGA MILK INDUSTRY CO.
- Nestle S.A.
- Ganeden Inc.
- I. du Pont de Nemours and Company
- Protexin
Recent Development
- In March 2021, Nestle Health Science's acquisition of the probiotics supplement brand Zenpep was one of the main developments. The move is anticipated to strengthen Nestle's market position and broaden its product portfolio.
- In February 2021, The launch of Kerry Group's ProActive probiotics brand was another significant occurrence month. Through its selection of probiotic products, the brand seeks to improve digestive health and boost overall well-being.
- In November 2020, DuPont Nutrition & Biosciences acquired the probiotics manufacturer International Dehydrated Foods. The acquisition is anticipated to help DuPont expand its probiotic offerings and strengthen its industry standing.
- In September 2020, Yakult Honsha Co., Ltd. also made an impact on the market with the introduction of its Yakult Light fermented probiotic beverage in the United States. The beverage contains vitamin D and is intended for health-conscious consumers.
- In June 2020, ADM increased its market presence by acquiring the probiotics supplement brand Probiotics International Limited. The acquisition is anticipated to allow ADM to diversify its product line and meet the rising demand for probiotic dietary supplements.
Report Scope:
Report Features Description Market Value (2022) USD 78.3 Bn Forecast Revenue (2032) USD 143.3 Bn CAGR (2023-2032) 6.4% Base Year for Estimation 2022 Historic Period 2016-2022 Forecast Period 2023-2032 Report Coverage Revenue Forecast, Market Dynamics, COVID-19 Impact, Competitive Landscape, Recent Developments Segments Covered By Strain Type (Lactobacillus, Bifidobacterium, Streptococcus, Saccharomyces), By Ingredient (Bacteria, Yeast)
By Form (Liquid, Dry), By Application (Food and beverages, Dietary Supplements, Animal Feed), By Distribution Channel (Supermarkets and Hypermarkets, Pharmacies and Drugstores, Online Retailers, Retail store)Regional Analysis North America – The United States, Canada, & Mexico; Western Europe – Germany, France, The UK, Spain, Italy, Portugal, Ireland, Austria, Switzerland, Benelux, Nordic, & Rest of Western Europe; Eastern Europe – Russia, Poland, The Czech Republic, Greece, & Rest of Eastern Europe; APAC – China, Japan, South Korea, India, Australia & New Zealand, Indonesia, Malaysia, Philippines, Singapore, Thailand, Vietnam, & Rest of APAC; Latin America – Brazil, Colombia, Chile, Argentina, Costa Rica, & Rest of Latin America; the Middle East & Africa – Algeria, Egypt, Israel, Kuwait, Nigeria, Saudi Arabia, South Africa, Turkey, United Arab Emirates, & Rest of MEA Competitive Landscape BioGaia AB, Danone Chr., Hansen Holding A/S, Yakult Honsha Co. Ltd., Probi AB, Lifeway Foods Inc., Nestle S.A., Ganeden Inc., I. du Pont de Nemours, and Company, Protexin Customization Scope Customization for segments, region/country-level will be provided. Moreover, additional customization can be done based on the requirements. Purchase Options We have three licenses to opt for Single User License, Multi-User License (Up to 5 Users), Corporate Use License (Unlimited User and Printable PDF) -
- 1. Executive Summary
- 1.1. Definition
- 1.2. Taxonomy
- 1.3. Research Scope
- 1.4. Key Analysis
- 1.5. Key Findings by Major Segments
- 1.6. Top strategies by Major Players
- 2. Global Probiotics Market Overview
- 2.1. Probiotics Market Dynamics
- 2.1.1. Drivers
- 2.1.2. Opportunities
- 2.1.3. Restraints
- 2.1.4. Challenges
- 2.2. Macro-economic Factors
- 2.3. Regulatory Framework
- 2.4. Market Investment Feasibility Index
- 2.5. PEST Analysis
- 2.6. PORTER’S Five Force Analysis
- 2.7. Drivers & Restraints Impact Analysis
- 2.8. Industry Chain Analysis
- 2.9. Cost Structure Analysis
- 2.10. Marketing Strategy
- 2.11. Russia-Ukraine War Impact Analysis
- 2.12. Opportunity Map Analysis
- 2.13. Market Competition Scenario Analysis
- 2.14. Product Life Cycle Analysis
- 2.15. Opportunity Orbits
- 2.16. Manufacturer Intensity Map
- 2.17. Major Companies sales by Value & Volume
- 2.1. Probiotics Market Dynamics
- 3. Global Probiotics Market Analysis, Opportunity and Forecast, 2016-2032
- 3.1. Global Probiotics Market Analysis, 2016-2021
- 3.2. Global Probiotics Market Opportunity and Forecast, 2023-2032
- 3.3. Global Probiotics Market Analysis, Opportunity and Forecast, By By Strain Type, 2016-2032
- 3.3.1. Global Probiotics Market Analysis by By Strain Type: Introduction
- 3.3.2. Market Size Absolute $ Opportunity Analysis and Forecast, By By Strain Type, 2016-2032
- 3.3.3. Lactobacillus
- 3.3.4. Bifidobacterium
- 3.3.5. Streptococcus
- 3.3.6. Saccharomyces
- 3.4. Global Probiotics Market Analysis, Opportunity and Forecast, By By Ingredient, 2016-2032
- 3.4.1. Global Probiotics Market Analysis by By Ingredient: Introduction
- 3.4.2. Market Size Absolute $ Opportunity Analysis and Forecast, By By Ingredient, 2016-2032
- 3.4.3. Bacteria
- 3.4.4. Yeast
- 3.5. Global Probiotics Market Analysis, Opportunity and Forecast, By By Form, 2016-2032
- 3.5.1. Global Probiotics Market Analysis by By Form: Introduction
- 3.5.2. Market Size Absolute $ Opportunity Analysis and Forecast, By By Form, 2016-2032
- 3.5.3. Liquid
- 3.5.4. Dry
- 3.6. Global Probiotics Market Analysis, Opportunity and Forecast, By By Application, 2016-2032
- 3.6.1. Global Probiotics Market Analysis by By Application: Introduction
- 3.6.2. Market Size Absolute $ Opportunity Analysis and Forecast, By By Application, 2016-2032
- 3.6.3. Food & Beverages
- 3.6.4. Dietary Supplements
- 3.6.5. Animal Feed
- 3.7. Global Probiotics Market Analysis, Opportunity and Forecast, By By Distribution Channel, 2016-2032
- 3.7.1. Global Probiotics Market Analysis by By Distribution Channel: Introduction
- 3.7.2. Market Size Absolute $ Opportunity Analysis and Forecast, By By Distribution Channel, 2016-2032
- 3.7.3. Supermarkets and Hypermarkets
- 3.7.4. Pharmacies and Drugstores
- 3.7.5. Online Retailers
- 4. North America Probiotics Market Analysis, Opportunity and Forecast, 2016-2032
- 4.1. North America Probiotics Market Analysis, 2016-2021
- 4.2. North America Probiotics Market Opportunity and Forecast, 2023-2032
- 4.3. North America Probiotics Market Analysis, Opportunity and Forecast, By By Strain Type, 2016-2032
- 4.3.1. North America Probiotics Market Analysis by By Strain Type: Introduction
- 4.3.2. Market Size Absolute $ Opportunity Analysis and Forecast, By By Strain Type, 2016-2032
- 4.3.3. Lactobacillus
- 4.3.4. Bifidobacterium
- 4.3.5. Streptococcus
- 4.3.6. Saccharomyces
- 4.4. North America Probiotics Market Analysis, Opportunity and Forecast, By By Ingredient, 2016-2032
- 4.4.1. North America Probiotics Market Analysis by By Ingredient: Introduction
- 4.4.2. Market Size Absolute $ Opportunity Analysis and Forecast, By By Ingredient, 2016-2032
- 4.4.3. Bacteria
- 4.4.4. Yeast
- 4.5. North America Probiotics Market Analysis, Opportunity and Forecast, By By Form, 2016-2032
- 4.5.1. North America Probiotics Market Analysis by By Form: Introduction
- 4.5.2. Market Size Absolute $ Opportunity Analysis and Forecast, By By Form, 2016-2032
- 4.5.3. Liquid
- 4.5.4. Dry
- 4.6. North America Probiotics Market Analysis, Opportunity and Forecast, By By Application, 2016-2032
- 4.6.1. North America Probiotics Market Analysis by By Application: Introduction
- 4.6.2. Market Size Absolute $ Opportunity Analysis and Forecast, By By Application, 2016-2032
- 4.6.3. Food & Beverages
- 4.6.4. Dietary Supplements
- 4.6.5. Animal Feed
- 4.7. North America Probiotics Market Analysis, Opportunity and Forecast, By By Distribution Channel, 2016-2032
- 4.7.1. North America Probiotics Market Analysis by By Distribution Channel: Introduction
- 4.7.2. Market Size Absolute $ Opportunity Analysis and Forecast, By By Distribution Channel, 2016-2032
- 4.7.3. Supermarkets and Hypermarkets
- 4.7.4. Pharmacies and Drugstores
- 4.7.5. Online Retailers
- 4.8. North America Probiotics Market Analysis, Opportunity and Forecast, By Country, 2016-2032
- 4.8.1. North America Probiotics Market Analysis by Country : Introduction
- 4.8.2. Market Size Absolute $ Opportunity Analysis and Forecast, Country, 2016-2032
- 4.8.2.1. The US
- 4.8.2.2. Canada
- 4.8.2.3. Mexico
- 5. Western Europe Probiotics Market Analysis, Opportunity and Forecast, 2016-2032
- 5.1. Western Europe Probiotics Market Analysis, 2016-2021
- 5.2. Western Europe Probiotics Market Opportunity and Forecast, 2023-2032
- 5.3. Western Europe Probiotics Market Analysis, Opportunity and Forecast, By By Strain Type, 2016-2032
- 5.3.1. Western Europe Probiotics Market Analysis by By Strain Type: Introduction
- 5.3.2. Market Size Absolute $ Opportunity Analysis and Forecast, By By Strain Type, 2016-2032
- 5.3.3. Lactobacillus
- 5.3.4. Bifidobacterium
- 5.3.5. Streptococcus
- 5.3.6. Saccharomyces
- 5.4. Western Europe Probiotics Market Analysis, Opportunity and Forecast, By By Ingredient, 2016-2032
- 5.4.1. Western Europe Probiotics Market Analysis by By Ingredient: Introduction
- 5.4.2. Market Size Absolute $ Opportunity Analysis and Forecast, By By Ingredient, 2016-2032
- 5.4.3. Bacteria
- 5.4.4. Yeast
- 5.5. Western Europe Probiotics Market Analysis, Opportunity and Forecast, By By Form, 2016-2032
- 5.5.1. Western Europe Probiotics Market Analysis by By Form: Introduction
- 5.5.2. Market Size Absolute $ Opportunity Analysis and Forecast, By By Form, 2016-2032
- 5.5.3. Liquid
- 5.5.4. Dry
- 5.6. Western Europe Probiotics Market Analysis, Opportunity and Forecast, By By Application, 2016-2032
- 5.6.1. Western Europe Probiotics Market Analysis by By Application: Introduction
- 5.6.2. Market Size Absolute $ Opportunity Analysis and Forecast, By By Application, 2016-2032
- 5.6.3. Food & Beverages
- 5.6.4. Dietary Supplements
- 5.6.5. Animal Feed
- 5.7. Western Europe Probiotics Market Analysis, Opportunity and Forecast, By By Distribution Channel, 2016-2032
- 5.7.1. Western Europe Probiotics Market Analysis by By Distribution Channel: Introduction
- 5.7.2. Market Size Absolute $ Opportunity Analysis and Forecast, By By Distribution Channel, 2016-2032
- 5.7.3. Supermarkets and Hypermarkets
- 5.7.4. Pharmacies and Drugstores
- 5.7.5. Online Retailers
- 5.8. Western Europe Probiotics Market Analysis, Opportunity and Forecast, By Country, 2016-2032
- 5.8.1. Western Europe Probiotics Market Analysis by Country : Introduction
- 5.8.2. Market Size Absolute $ Opportunity Analysis and Forecast, Country, 2016-2032
- 5.8.2.1. Germany
- 5.8.2.2. France
- 5.8.2.3. The UK
- 5.8.2.4. Spain
- 5.8.2.5. Italy
- 5.8.2.6. Portugal
- 5.8.2.7. Ireland
- 5.8.2.8. Austria
- 5.8.2.9. Switzerland
- 5.8.2.10. Benelux
- 5.8.2.11. Nordic
- 5.8.2.12. Rest of Western Europe
- 6. Eastern Europe Probiotics Market Analysis, Opportunity and Forecast, 2016-2032
- 6.1. Eastern Europe Probiotics Market Analysis, 2016-2021
- 6.2. Eastern Europe Probiotics Market Opportunity and Forecast, 2023-2032
- 6.3. Eastern Europe Probiotics Market Analysis, Opportunity and Forecast, By By Strain Type, 2016-2032
- 6.3.1. Eastern Europe Probiotics Market Analysis by By Strain Type: Introduction
- 6.3.2. Market Size Absolute $ Opportunity Analysis and Forecast, By By Strain Type, 2016-2032
- 6.3.3. Lactobacillus
- 6.3.4. Bifidobacterium
- 6.3.5. Streptococcus
- 6.3.6. Saccharomyces
- 6.4. Eastern Europe Probiotics Market Analysis, Opportunity and Forecast, By By Ingredient, 2016-2032
- 6.4.1. Eastern Europe Probiotics Market Analysis by By Ingredient: Introduction
- 6.4.2. Market Size Absolute $ Opportunity Analysis and Forecast, By By Ingredient, 2016-2032
- 6.4.3. Bacteria
- 6.4.4. Yeast
- 6.5. Eastern Europe Probiotics Market Analysis, Opportunity and Forecast, By By Form, 2016-2032
- 6.5.1. Eastern Europe Probiotics Market Analysis by By Form: Introduction
- 6.5.2. Market Size Absolute $ Opportunity Analysis and Forecast, By By Form, 2016-2032
- 6.5.3. Liquid
- 6.5.4. Dry
- 6.6. Eastern Europe Probiotics Market Analysis, Opportunity and Forecast, By By Application, 2016-2032
- 6.6.1. Eastern Europe Probiotics Market Analysis by By Application: Introduction
- 6.6.2. Market Size Absolute $ Opportunity Analysis and Forecast, By By Application, 2016-2032
- 6.6.3. Food & Beverages
- 6.6.4. Dietary Supplements
- 6.6.5. Animal Feed
- 6.7. Eastern Europe Probiotics Market Analysis, Opportunity and Forecast, By By Distribution Channel, 2016-2032
- 6.7.1. Eastern Europe Probiotics Market Analysis by By Distribution Channel: Introduction
- 6.7.2. Market Size Absolute $ Opportunity Analysis and Forecast, By By Distribution Channel, 2016-2032
- 6.7.3. Supermarkets and Hypermarkets
- 6.7.4. Pharmacies and Drugstores
- 6.7.5. Online Retailers
- 6.8. Eastern Europe Probiotics Market Analysis, Opportunity and Forecast, By Country, 2016-2032
- 6.8.1. Eastern Europe Probiotics Market Analysis by Country : Introduction
- 6.8.2. Market Size Absolute $ Opportunity Analysis and Forecast, Country, 2016-2032
- 6.8.2.1. Russia
- 6.8.2.2. Poland
- 6.8.2.3. The Czech Republic
- 6.8.2.4. Greece
- 6.8.2.5. Rest of Eastern Europe
- 7. APAC Probiotics Market Analysis, Opportunity and Forecast, 2016-2032
- 7.1. APAC Probiotics Market Analysis, 2016-2021
- 7.2. APAC Probiotics Market Opportunity and Forecast, 2023-2032
- 7.3. APAC Probiotics Market Analysis, Opportunity and Forecast, By By Strain Type, 2016-2032
- 7.3.1. APAC Probiotics Market Analysis by By Strain Type: Introduction
- 7.3.2. Market Size Absolute $ Opportunity Analysis and Forecast, By By Strain Type, 2016-2032
- 7.3.3. Lactobacillus
- 7.3.4. Bifidobacterium
- 7.3.5. Streptococcus
- 7.3.6. Saccharomyces
- 7.4. APAC Probiotics Market Analysis, Opportunity and Forecast, By By Ingredient, 2016-2032
- 7.4.1. APAC Probiotics Market Analysis by By Ingredient: Introduction
- 7.4.2. Market Size Absolute $ Opportunity Analysis and Forecast, By By Ingredient, 2016-2032
- 7.4.3. Bacteria
- 7.4.4. Yeast
- 7.5. APAC Probiotics Market Analysis, Opportunity and Forecast, By By Form, 2016-2032
- 7.5.1. APAC Probiotics Market Analysis by By Form: Introduction
- 7.5.2. Market Size Absolute $ Opportunity Analysis and Forecast, By By Form, 2016-2032
- 7.5.3. Liquid
- 7.5.4. Dry
- 7.6. APAC Probiotics Market Analysis, Opportunity and Forecast, By By Application, 2016-2032
- 7.6.1. APAC Probiotics Market Analysis by By Application: Introduction
- 7.6.2. Market Size Absolute $ Opportunity Analysis and Forecast, By By Application, 2016-2032
- 7.6.3. Food & Beverages
- 7.6.4. Dietary Supplements
- 7.6.5. Animal Feed
- 7.7. APAC Probiotics Market Analysis, Opportunity and Forecast, By By Distribution Channel, 2016-2032
- 7.7.1. APAC Probiotics Market Analysis by By Distribution Channel: Introduction
- 7.7.2. Market Size Absolute $ Opportunity Analysis and Forecast, By By Distribution Channel, 2016-2032
- 7.7.3. Supermarkets and Hypermarkets
- 7.7.4. Pharmacies and Drugstores
- 7.7.5. Online Retailers
- 7.8. APAC Probiotics Market Analysis, Opportunity and Forecast, By Country, 2016-2032
- 7.8.1. APAC Probiotics Market Analysis by Country : Introduction
- 7.8.2. Market Size Absolute $ Opportunity Analysis and Forecast, Country, 2016-2032
- 7.8.2.1. China
- 7.8.2.2. Japan
- 7.8.2.3. South Korea
- 7.8.2.4. India
- 7.8.2.5. Australia & New Zeland
- 7.8.2.6. Indonesia
- 7.8.2.7. Malaysia
- 7.8.2.8. Philippines
- 7.8.2.9. Singapore
- 7.8.2.10. Thailand
- 7.8.2.11. Vietnam
- 7.8.2.12. Rest of APAC
- 8. Latin America Probiotics Market Analysis, Opportunity and Forecast, 2016-2032
- 8.1. Latin America Probiotics Market Analysis, 2016-2021
- 8.2. Latin America Probiotics Market Opportunity and Forecast, 2023-2032
- 8.3. Latin America Probiotics Market Analysis, Opportunity and Forecast, By By Strain Type, 2016-2032
- 8.3.1. Latin America Probiotics Market Analysis by By Strain Type: Introduction
- 8.3.2. Market Size Absolute $ Opportunity Analysis and Forecast, By By Strain Type, 2016-2032
- 8.3.3. Lactobacillus
- 8.3.4. Bifidobacterium
- 8.3.5. Streptococcus
- 8.3.6. Saccharomyces
- 8.4. Latin America Probiotics Market Analysis, Opportunity and Forecast, By By Ingredient, 2016-2032
- 8.4.1. Latin America Probiotics Market Analysis by By Ingredient: Introduction
- 8.4.2. Market Size Absolute $ Opportunity Analysis and Forecast, By By Ingredient, 2016-2032
- 8.4.3. Bacteria
- 8.4.4. Yeast
- 8.5. Latin America Probiotics Market Analysis, Opportunity and Forecast, By By Form, 2016-2032
- 8.5.1. Latin America Probiotics Market Analysis by By Form: Introduction
- 8.5.2. Market Size Absolute $ Opportunity Analysis and Forecast, By By Form, 2016-2032
- 8.5.3. Liquid
- 8.5.4. Dry
- 8.6. Latin America Probiotics Market Analysis, Opportunity and Forecast, By By Application, 2016-2032
- 8.6.1. Latin America Probiotics Market Analysis by By Application: Introduction
- 8.6.2. Market Size Absolute $ Opportunity Analysis and Forecast, By By Application, 2016-2032
- 8.6.3. Food & Beverages
- 8.6.4. Dietary Supplements
- 8.6.5. Animal Feed
- 8.7. Latin America Probiotics Market Analysis, Opportunity and Forecast, By By Distribution Channel, 2016-2032
- 8.7.1. Latin America Probiotics Market Analysis by By Distribution Channel: Introduction
- 8.7.2. Market Size Absolute $ Opportunity Analysis and Forecast, By By Distribution Channel, 2016-2032
- 8.7.3. Supermarkets and Hypermarkets
- 8.7.4. Pharmacies and Drugstores
- 8.7.5. Online Retailers
- 8.8. Latin America Probiotics Market Analysis, Opportunity and Forecast, By Country, 2016-2032
- 8.8.1. Latin America Probiotics Market Analysis by Country : Introduction
- 8.8.2. Market Size Absolute $ Opportunity Analysis and Forecast, Country, 2016-2032
- 8.8.2.1. Brazil
- 8.8.2.2. Colombia
- 8.8.2.3. Chile
- 8.8.2.4. Argentina
- 8.8.2.5. Costa Rica
- 8.8.2.6. Rest of Latin America
- 9. Middle East & Africa Probiotics Market Analysis, Opportunity and Forecast, 2016-2032
- 9.1. Middle East & Africa Probiotics Market Analysis, 2016-2021
- 9.2. Middle East & Africa Probiotics Market Opportunity and Forecast, 2023-2032
- 9.3. Middle East & Africa Probiotics Market Analysis, Opportunity and Forecast, By By Strain Type, 2016-2032
- 9.3.1. Middle East & Africa Probiotics Market Analysis by By Strain Type: Introduction
- 9.3.2. Market Size Absolute $ Opportunity Analysis and Forecast, By By Strain Type, 2016-2032
- 9.3.3. Lactobacillus
- 9.3.4. Bifidobacterium
- 9.3.5. Streptococcus
- 9.3.6. Saccharomyces
- 9.4. Middle East & Africa Probiotics Market Analysis, Opportunity and Forecast, By By Ingredient, 2016-2032
- 9.4.1. Middle East & Africa Probiotics Market Analysis by By Ingredient: Introduction
- 9.4.2. Market Size Absolute $ Opportunity Analysis and Forecast, By By Ingredient, 2016-2032
- 9.4.3. Bacteria
- 9.4.4. Yeast
- 9.5. Middle East & Africa Probiotics Market Analysis, Opportunity and Forecast, By By Form, 2016-2032
- 9.5.1. Middle East & Africa Probiotics Market Analysis by By Form: Introduction
- 9.5.2. Market Size Absolute $ Opportunity Analysis and Forecast, By By Form, 2016-2032
- 9.5.3. Liquid
- 9.5.4. Dry
- 9.6. Middle East & Africa Probiotics Market Analysis, Opportunity and Forecast, By By Application, 2016-2032
- 9.6.1. Middle East & Africa Probiotics Market Analysis by By Application: Introduction
- 9.6.2. Market Size Absolute $ Opportunity Analysis and Forecast, By By Application, 2016-2032
- 9.6.3. Food & Beverages
- 9.6.4. Dietary Supplements
- 9.6.5. Animal Feed
- 9.7. Middle East & Africa Probiotics Market Analysis, Opportunity and Forecast, By By Distribution Channel, 2016-2032
- 9.7.1. Middle East & Africa Probiotics Market Analysis by By Distribution Channel: Introduction
- 9.7.2. Market Size Absolute $ Opportunity Analysis and Forecast, By By Distribution Channel, 2016-2032
- 9.7.3. Supermarkets and Hypermarkets
- 9.7.4. Pharmacies and Drugstores
- 9.7.5. Online Retailers
- 9.8. Middle East & Africa Probiotics Market Analysis, Opportunity and Forecast, By Country, 2016-2032
- 9.8.1. Middle East & Africa Probiotics Market Analysis by Country : Introduction
- 9.8.2. Market Size Absolute $ Opportunity Analysis and Forecast, Country, 2016-2032
- 9.8.2.1. Algeria
- 9.8.2.2. Egypt
- 9.8.2.3. Israel
- 9.8.2.4. Kuwait
- 9.8.2.5. Nigeria
- 9.8.2.6. Saudi Arabia
- 9.8.2.7. South Africa
- 9.8.2.8. Turkey
- 9.8.2.9. The UAE
- 9.8.2.10. Rest of MEA
- 10. Global Probiotics Market Analysis, Opportunity and Forecast, By Region, 2016-2032
- 10.1. Global Probiotics Market Analysis by Region : Introduction
- 10.2. Market Size Absolute $ Opportunity Analysis and Forecast, By Region, 2016-2032
- 10.2.1. North America
- 10.2.2. Western Europe
- 10.2.3. Eastern Europe
- 10.2.4. APAC
- 10.2.5. Latin America
- 10.2.6. Middle East & Africa
- 11. Global Probiotics Market Competitive Landscape, Market Share Analysis, and Company Profiles
- 11.1. Market Share Analysis
- 11.2. Company Profiles
- 11.3. BioGaia AB
- 11.3.1. Company Overview
- 11.3.2. Financial Highlights
- 11.3.3. Product Portfolio
- 11.3.4. SWOT Analysis
- 11.3.5. Key Strategies and Developments
- 11.4. Danone Chr.
- 11.4.1. Company Overview
- 11.4.2. Financial Highlights
- 11.4.3. Product Portfolio
- 11.4.4. SWOT Analysis
- 11.4.5. Key Strategies and Developments
- 11.5. Hansen Holding A/S
- 11.5.1. Company Overview
- 11.5.2. Financial Highlights
- 11.5.3. Product Portfolio
- 11.5.4. SWOT Analysis
- 11.5.5. Key Strategies and Developments
- 11.6. Yakult Honsha Co. Ltd.
- 11.6.1. Company Overview
- 11.6.2. Financial Highlights
- 11.6.3. Product Portfolio
- 11.6.4. SWOT Analysis
- 11.6.5. Key Strategies and Developments
- 11.7. Probi AB
- 11.7.1. Company Overview
- 11.7.2. Financial Highlights
- 11.7.3. Product Portfolio
- 11.7.4. SWOT Analysis
- 11.7.5. Key Strategies and Developments
- 11.8. Lifeway Foods Inc.
- 11.8.1. Company Overview
- 11.8.2. Financial Highlights
- 11.8.3. Product Portfolio
- 11.8.4. SWOT Analysis
- 11.8.5. Key Strategies and Developments
- 11.9. Nestle S.A.
- 11.9.1. Company Overview
- 11.9.2. Financial Highlights
- 11.9.3. Product Portfolio
- 11.9.4. SWOT Analysis
- 11.9.5. Key Strategies and Developments
- 11.10. Ganeden Inc.
- 11.10.1. Company Overview
- 11.10.2. Financial Highlights
- 11.10.3. Product Portfolio
- 11.10.4. SWOT Analysis
- 11.10.5. Key Strategies and Developments
- 11.11. I. du Pont de Nemours and Company
- 11.11.1. Company Overview
- 11.11.2. Financial Highlights
- 11.11.3. Product Portfolio
- 11.11.4. SWOT Analysis
- 11.11.5. Key Strategies and Developments
- 11.12. Protexin
- 11.12.1. Company Overview
- 11.12.2. Financial Highlights
- 11.12.3. Product Portfolio
- 11.12.4. SWOT Analysis
- 11.12.5. Key Strategies and Developments
- 12. Assumptions and Acronyms
- 13. Research Methodology
- 14. Contact
List of Figures
- Figure 1: Global Probiotics Market Revenue (US$ Mn) Market Share by By Strain Type in 2022
- Figure 2: Global Probiotics Market Attractiveness Analysis by By Strain Type, 2016-2032
- Figure 3: Global Probiotics Market Revenue (US$ Mn) Market Share by By Ingredientin 2022
- Figure 4: Global Probiotics Market Attractiveness Analysis by By Ingredient, 2016-2032
- Figure 5: Global Probiotics Market Revenue (US$ Mn) Market Share by By Formin 2022
- Figure 6: Global Probiotics Market Attractiveness Analysis by By Form, 2016-2032
- Figure 7: Global Probiotics Market Revenue (US$ Mn) Market Share by By Applicationin 2022
- Figure 8: Global Probiotics Market Attractiveness Analysis by By Application, 2016-2032
- Figure 9: Global Probiotics Market Revenue (US$ Mn) Market Share by By Distribution Channelin 2022
- Figure 10: Global Probiotics Market Attractiveness Analysis by By Distribution Channel, 2016-2032
- Figure 11: Global Probiotics Market Revenue (US$ Mn) Market Share by Region in 2022
- Figure 12: Global Probiotics Market Attractiveness Analysis by Region, 2016-2032
- Figure 13: Global Probiotics Market Revenue (US$ Mn) (2016-2032)
- Figure 14: Global Probiotics Market Revenue (US$ Mn) Comparison by Region (2016-2032)
- Figure 15: Global Probiotics Market Revenue (US$ Mn) Comparison by By Strain Type (2016-2032)
- Figure 16: Global Probiotics Market Revenue (US$ Mn) Comparison by By Ingredient (2016-2032)
- Figure 17: Global Probiotics Market Revenue (US$ Mn) Comparison by By Form (2016-2032)
- Figure 18: Global Probiotics Market Revenue (US$ Mn) Comparison by By Application (2016-2032)
- Figure 19: Global Probiotics Market Revenue (US$ Mn) Comparison by By Distribution Channel (2016-2032)
- Figure 20: Global Probiotics Market Y-o-Y Growth Rate Comparison by Region (2016-2032)
- Figure 21: Global Probiotics Market Y-o-Y Growth Rate Comparison by By Strain Type (2016-2032)
- Figure 22: Global Probiotics Market Y-o-Y Growth Rate Comparison by By Ingredient (2016-2032)
- Figure 23: Global Probiotics Market Y-o-Y Growth Rate Comparison by By Form (2016-2032)
- Figure 24: Global Probiotics Market Y-o-Y Growth Rate Comparison by By Application (2016-2032)
- Figure 25: Global Probiotics Market Y-o-Y Growth Rate Comparison by By Distribution Channel (2016-2032)
- Figure 26: Global Probiotics Market Share Comparison by Region (2016-2032)
- Figure 27: Global Probiotics Market Share Comparison by By Strain Type (2016-2032)
- Figure 28: Global Probiotics Market Share Comparison by By Ingredient (2016-2032)
- Figure 29: Global Probiotics Market Share Comparison by By Form (2016-2032)
- Figure 30: Global Probiotics Market Share Comparison by By Application (2016-2032)
- Figure 31: Global Probiotics Market Share Comparison by By Distribution Channel (2016-2032)
- Figure 32: North America Probiotics Market Revenue (US$ Mn) Market Share by By Strain Typein 2022
- Figure 33: North America Probiotics Market Attractiveness Analysis by By Strain Type, 2016-2032
- Figure 34: North America Probiotics Market Revenue (US$ Mn) Market Share by By Ingredientin 2022
- Figure 35: North America Probiotics Market Attractiveness Analysis by By Ingredient, 2016-2032
- Figure 36: North America Probiotics Market Revenue (US$ Mn) Market Share by By Formin 2022
- Figure 37: North America Probiotics Market Attractiveness Analysis by By Form, 2016-2032
- Figure 38: North America Probiotics Market Revenue (US$ Mn) Market Share by By Applicationin 2022
- Figure 39: North America Probiotics Market Attractiveness Analysis by By Application, 2016-2032
- Figure 40: North America Probiotics Market Revenue (US$ Mn) Market Share by By Distribution Channelin 2022
- Figure 41: North America Probiotics Market Attractiveness Analysis by By Distribution Channel, 2016-2032
- Figure 42: North America Probiotics Market Revenue (US$ Mn) Market Share by Country in 2022
- Figure 43: North America Probiotics Market Attractiveness Analysis by Country, 2016-2032
- Figure 44: North America Probiotics Market Revenue (US$ Mn) (2016-2032)
- Figure 45: North America Probiotics Market Revenue (US$ Mn) Comparison by Country (2016-2032)
- Figure 46: North America Probiotics Market Revenue (US$ Mn) Comparison by By Strain Type (2016-2032)
- Figure 47: North America Probiotics Market Revenue (US$ Mn) Comparison by By Ingredient (2016-2032)
- Figure 48: North America Probiotics Market Revenue (US$ Mn) Comparison by By Form (2016-2032)
- Figure 49: North America Probiotics Market Revenue (US$ Mn) Comparison by By Application (2016-2032)
- Figure 50: North America Probiotics Market Revenue (US$ Mn) Comparison by By Distribution Channel (2016-2032)
- Figure 51: North America Probiotics Market Y-o-Y Growth Rate Comparison by Country (2016-2032)
- Figure 52: North America Probiotics Market Y-o-Y Growth Rate Comparison by By Strain Type (2016-2032)
- Figure 53: North America Probiotics Market Y-o-Y Growth Rate Comparison by By Ingredient (2016-2032)
- Figure 54: North America Probiotics Market Y-o-Y Growth Rate Comparison by By Form (2016-2032)
- Figure 55: North America Probiotics Market Y-o-Y Growth Rate Comparison by By Application (2016-2032)
- Figure 56: North America Probiotics Market Y-o-Y Growth Rate Comparison by By Distribution Channel (2016-2032)
- Figure 57: North America Probiotics Market Share Comparison by Country (2016-2032)
- Figure 58: North America Probiotics Market Share Comparison by By Strain Type (2016-2032)
- Figure 59: North America Probiotics Market Share Comparison by By Ingredient (2016-2032)
- Figure 60: North America Probiotics Market Share Comparison by By Form (2016-2032)
- Figure 61: North America Probiotics Market Share Comparison by By Application (2016-2032)
- Figure 62: North America Probiotics Market Share Comparison by By Distribution Channel (2016-2032)
- Figure 63: Western Europe Probiotics Market Revenue (US$ Mn) Market Share by By Strain Typein 2022
- Figure 64: Western Europe Probiotics Market Attractiveness Analysis by By Strain Type, 2016-2032
- Figure 65: Western Europe Probiotics Market Revenue (US$ Mn) Market Share by By Ingredientin 2022
- Figure 66: Western Europe Probiotics Market Attractiveness Analysis by By Ingredient, 2016-2032
- Figure 67: Western Europe Probiotics Market Revenue (US$ Mn) Market Share by By Formin 2022
- Figure 68: Western Europe Probiotics Market Attractiveness Analysis by By Form, 2016-2032
- Figure 69: Western Europe Probiotics Market Revenue (US$ Mn) Market Share by By Applicationin 2022
- Figure 70: Western Europe Probiotics Market Attractiveness Analysis by By Application, 2016-2032
- Figure 71: Western Europe Probiotics Market Revenue (US$ Mn) Market Share by By Distribution Channelin 2022
- Figure 72: Western Europe Probiotics Market Attractiveness Analysis by By Distribution Channel, 2016-2032
- Figure 73: Western Europe Probiotics Market Revenue (US$ Mn) Market Share by Country in 2022
- Figure 74: Western Europe Probiotics Market Attractiveness Analysis by Country, 2016-2032
- Figure 75: Western Europe Probiotics Market Revenue (US$ Mn) (2016-2032)
- Figure 76: Western Europe Probiotics Market Revenue (US$ Mn) Comparison by Country (2016-2032)
- Figure 77: Western Europe Probiotics Market Revenue (US$ Mn) Comparison by By Strain Type (2016-2032)
- Figure 78: Western Europe Probiotics Market Revenue (US$ Mn) Comparison by By Ingredient (2016-2032)
- Figure 79: Western Europe Probiotics Market Revenue (US$ Mn) Comparison by By Form (2016-2032)
- Figure 80: Western Europe Probiotics Market Revenue (US$ Mn) Comparison by By Application (2016-2032)
- Figure 81: Western Europe Probiotics Market Revenue (US$ Mn) Comparison by By Distribution Channel (2016-2032)
- Figure 82: Western Europe Probiotics Market Y-o-Y Growth Rate Comparison by Country (2016-2032)
- Figure 83: Western Europe Probiotics Market Y-o-Y Growth Rate Comparison by By Strain Type (2016-2032)
- Figure 84: Western Europe Probiotics Market Y-o-Y Growth Rate Comparison by By Ingredient (2016-2032)
- Figure 85: Western Europe Probiotics Market Y-o-Y Growth Rate Comparison by By Form (2016-2032)
- Figure 86: Western Europe Probiotics Market Y-o-Y Growth Rate Comparison by By Application (2016-2032)
- Figure 87: Western Europe Probiotics Market Y-o-Y Growth Rate Comparison by By Distribution Channel (2016-2032)
- Figure 88: Western Europe Probiotics Market Share Comparison by Country (2016-2032)
- Figure 89: Western Europe Probiotics Market Share Comparison by By Strain Type (2016-2032)
- Figure 90: Western Europe Probiotics Market Share Comparison by By Ingredient (2016-2032)
- Figure 91: Western Europe Probiotics Market Share Comparison by By Form (2016-2032)
- Figure 92: Western Europe Probiotics Market Share Comparison by By Application (2016-2032)
- Figure 93: Western Europe Probiotics Market Share Comparison by By Distribution Channel (2016-2032)
- Figure 94: Eastern Europe Probiotics Market Revenue (US$ Mn) Market Share by By Strain Typein 2022
- Figure 95: Eastern Europe Probiotics Market Attractiveness Analysis by By Strain Type, 2016-2032
- Figure 96: Eastern Europe Probiotics Market Revenue (US$ Mn) Market Share by By Ingredientin 2022
- Figure 97: Eastern Europe Probiotics Market Attractiveness Analysis by By Ingredient, 2016-2032
- Figure 98: Eastern Europe Probiotics Market Revenue (US$ Mn) Market Share by By Formin 2022
- Figure 99: Eastern Europe Probiotics Market Attractiveness Analysis by By Form, 2016-2032
- Figure 100: Eastern Europe Probiotics Market Revenue (US$ Mn) Market Share by By Applicationin 2022
- Figure 101: Eastern Europe Probiotics Market Attractiveness Analysis by By Application, 2016-2032
- Figure 102: Eastern Europe Probiotics Market Revenue (US$ Mn) Market Share by By Distribution Channelin 2022
- Figure 103: Eastern Europe Probiotics Market Attractiveness Analysis by By Distribution Channel, 2016-2032
- Figure 104: Eastern Europe Probiotics Market Revenue (US$ Mn) Market Share by Country in 2022
- Figure 105: Eastern Europe Probiotics Market Attractiveness Analysis by Country, 2016-2032
- Figure 106: Eastern Europe Probiotics Market Revenue (US$ Mn) (2016-2032)
- Figure 107: Eastern Europe Probiotics Market Revenue (US$ Mn) Comparison by Country (2016-2032)
- Figure 108: Eastern Europe Probiotics Market Revenue (US$ Mn) Comparison by By Strain Type (2016-2032)
- Figure 109: Eastern Europe Probiotics Market Revenue (US$ Mn) Comparison by By Ingredient (2016-2032)
- Figure 110: Eastern Europe Probiotics Market Revenue (US$ Mn) Comparison by By Form (2016-2032)
- Figure 111: Eastern Europe Probiotics Market Revenue (US$ Mn) Comparison by By Application (2016-2032)
- Figure 112: Eastern Europe Probiotics Market Revenue (US$ Mn) Comparison by By Distribution Channel (2016-2032)
- Figure 113: Eastern Europe Probiotics Market Y-o-Y Growth Rate Comparison by Country (2016-2032)
- Figure 114: Eastern Europe Probiotics Market Y-o-Y Growth Rate Comparison by By Strain Type (2016-2032)
- Figure 115: Eastern Europe Probiotics Market Y-o-Y Growth Rate Comparison by By Ingredient (2016-2032)
- Figure 116: Eastern Europe Probiotics Market Y-o-Y Growth Rate Comparison by By Form (2016-2032)
- Figure 117: Eastern Europe Probiotics Market Y-o-Y Growth Rate Comparison by By Application (2016-2032)
- Figure 118: Eastern Europe Probiotics Market Y-o-Y Growth Rate Comparison by By Distribution Channel (2016-2032)
- Figure 119: Eastern Europe Probiotics Market Share Comparison by Country (2016-2032)
- Figure 120: Eastern Europe Probiotics Market Share Comparison by By Strain Type (2016-2032)
- Figure 121: Eastern Europe Probiotics Market Share Comparison by By Ingredient (2016-2032)
- Figure 122: Eastern Europe Probiotics Market Share Comparison by By Form (2016-2032)
- Figure 123: Eastern Europe Probiotics Market Share Comparison by By Application (2016-2032)
- Figure 124: Eastern Europe Probiotics Market Share Comparison by By Distribution Channel (2016-2032)
- Figure 125: APAC Probiotics Market Revenue (US$ Mn) Market Share by By Strain Typein 2022
- Figure 126: APAC Probiotics Market Attractiveness Analysis by By Strain Type, 2016-2032
- Figure 127: APAC Probiotics Market Revenue (US$ Mn) Market Share by By Ingredientin 2022
- Figure 128: APAC Probiotics Market Attractiveness Analysis by By Ingredient, 2016-2032
- Figure 129: APAC Probiotics Market Revenue (US$ Mn) Market Share by By Formin 2022
- Figure 130: APAC Probiotics Market Attractiveness Analysis by By Form, 2016-2032
- Figure 131: APAC Probiotics Market Revenue (US$ Mn) Market Share by By Applicationin 2022
- Figure 132: APAC Probiotics Market Attractiveness Analysis by By Application, 2016-2032
- Figure 133: APAC Probiotics Market Revenue (US$ Mn) Market Share by By Distribution Channelin 2022
- Figure 134: APAC Probiotics Market Attractiveness Analysis by By Distribution Channel, 2016-2032
- Figure 135: APAC Probiotics Market Revenue (US$ Mn) Market Share by Country in 2022
- Figure 136: APAC Probiotics Market Attractiveness Analysis by Country, 2016-2032
- Figure 137: APAC Probiotics Market Revenue (US$ Mn) (2016-2032)
- Figure 138: APAC Probiotics Market Revenue (US$ Mn) Comparison by Country (2016-2032)
- Figure 139: APAC Probiotics Market Revenue (US$ Mn) Comparison by By Strain Type (2016-2032)
- Figure 140: APAC Probiotics Market Revenue (US$ Mn) Comparison by By Ingredient (2016-2032)
- Figure 141: APAC Probiotics Market Revenue (US$ Mn) Comparison by By Form (2016-2032)
- Figure 142: APAC Probiotics Market Revenue (US$ Mn) Comparison by By Application (2016-2032)
- Figure 143: APAC Probiotics Market Revenue (US$ Mn) Comparison by By Distribution Channel (2016-2032)
- Figure 144: APAC Probiotics Market Y-o-Y Growth Rate Comparison by Country (2016-2032)
- Figure 145: APAC Probiotics Market Y-o-Y Growth Rate Comparison by By Strain Type (2016-2032)
- Figure 146: APAC Probiotics Market Y-o-Y Growth Rate Comparison by By Ingredient (2016-2032)
- Figure 147: APAC Probiotics Market Y-o-Y Growth Rate Comparison by By Form (2016-2032)
- Figure 148: APAC Probiotics Market Y-o-Y Growth Rate Comparison by By Application (2016-2032)
- Figure 149: APAC Probiotics Market Y-o-Y Growth Rate Comparison by By Distribution Channel (2016-2032)
- Figure 150: APAC Probiotics Market Share Comparison by Country (2016-2032)
- Figure 151: APAC Probiotics Market Share Comparison by By Strain Type (2016-2032)
- Figure 152: APAC Probiotics Market Share Comparison by By Ingredient (2016-2032)
- Figure 153: APAC Probiotics Market Share Comparison by By Form (2016-2032)
- Figure 154: APAC Probiotics Market Share Comparison by By Application (2016-2032)
- Figure 155: APAC Probiotics Market Share Comparison by By Distribution Channel (2016-2032)
- Figure 156: Latin America Probiotics Market Revenue (US$ Mn) Market Share by By Strain Typein 2022
- Figure 157: Latin America Probiotics Market Attractiveness Analysis by By Strain Type, 2016-2032
- Figure 158: Latin America Probiotics Market Revenue (US$ Mn) Market Share by By Ingredientin 2022
- Figure 159: Latin America Probiotics Market Attractiveness Analysis by By Ingredient, 2016-2032
- Figure 160: Latin America Probiotics Market Revenue (US$ Mn) Market Share by By Formin 2022
- Figure 161: Latin America Probiotics Market Attractiveness Analysis by By Form, 2016-2032
- Figure 162: Latin America Probiotics Market Revenue (US$ Mn) Market Share by By Applicationin 2022
- Figure 163: Latin America Probiotics Market Attractiveness Analysis by By Application, 2016-2032
- Figure 164: Latin America Probiotics Market Revenue (US$ Mn) Market Share by By Distribution Channelin 2022
- Figure 165: Latin America Probiotics Market Attractiveness Analysis by By Distribution Channel, 2016-2032
- Figure 166: Latin America Probiotics Market Revenue (US$ Mn) Market Share by Country in 2022
- Figure 167: Latin America Probiotics Market Attractiveness Analysis by Country, 2016-2032
- Figure 168: Latin America Probiotics Market Revenue (US$ Mn) (2016-2032)
- Figure 169: Latin America Probiotics Market Revenue (US$ Mn) Comparison by Country (2016-2032)
- Figure 170: Latin America Probiotics Market Revenue (US$ Mn) Comparison by By Strain Type (2016-2032)
- Figure 171: Latin America Probiotics Market Revenue (US$ Mn) Comparison by By Ingredient (2016-2032)
- Figure 172: Latin America Probiotics Market Revenue (US$ Mn) Comparison by By Form (2016-2032)
- Figure 173: Latin America Probiotics Market Revenue (US$ Mn) Comparison by By Application (2016-2032)
- Figure 174: Latin America Probiotics Market Revenue (US$ Mn) Comparison by By Distribution Channel (2016-2032)
- Figure 175: Latin America Probiotics Market Y-o-Y Growth Rate Comparison by Country (2016-2032)
- Figure 176: Latin America Probiotics Market Y-o-Y Growth Rate Comparison by By Strain Type (2016-2032)
- Figure 177: Latin America Probiotics Market Y-o-Y Growth Rate Comparison by By Ingredient (2016-2032)
- Figure 178: Latin America Probiotics Market Y-o-Y Growth Rate Comparison by By Form (2016-2032)
- Figure 179: Latin America Probiotics Market Y-o-Y Growth Rate Comparison by By Application (2016-2032)
- Figure 180: Latin America Probiotics Market Y-o-Y Growth Rate Comparison by By Distribution Channel (2016-2032)
- Figure 181: Latin America Probiotics Market Share Comparison by Country (2016-2032)
- Figure 182: Latin America Probiotics Market Share Comparison by By Strain Type (2016-2032)
- Figure 183: Latin America Probiotics Market Share Comparison by By Ingredient (2016-2032)
- Figure 184: Latin America Probiotics Market Share Comparison by By Form (2016-2032)
- Figure 185: Latin America Probiotics Market Share Comparison by By Application (2016-2032)
- Figure 186: Latin America Probiotics Market Share Comparison by By Distribution Channel (2016-2032)
- Figure 187: Middle East & Africa Probiotics Market Revenue (US$ Mn) Market Share by By Strain Typein 2022
- Figure 188: Middle East & Africa Probiotics Market Attractiveness Analysis by By Strain Type, 2016-2032
- Figure 189: Middle East & Africa Probiotics Market Revenue (US$ Mn) Market Share by By Ingredientin 2022
- Figure 190: Middle East & Africa Probiotics Market Attractiveness Analysis by By Ingredient, 2016-2032
- Figure 191: Middle East & Africa Probiotics Market Revenue (US$ Mn) Market Share by By Formin 2022
- Figure 192: Middle East & Africa Probiotics Market Attractiveness Analysis by By Form, 2016-2032
- Figure 193: Middle East & Africa Probiotics Market Revenue (US$ Mn) Market Share by By Applicationin 2022
- Figure 194: Middle East & Africa Probiotics Market Attractiveness Analysis by By Application, 2016-2032
- Figure 195: Middle East & Africa Probiotics Market Revenue (US$ Mn) Market Share by By Distribution Channelin 2022
- Figure 196: Middle East & Africa Probiotics Market Attractiveness Analysis by By Distribution Channel, 2016-2032
- Figure 197: Middle East & Africa Probiotics Market Revenue (US$ Mn) Market Share by Country in 2022
- Figure 198: Middle East & Africa Probiotics Market Attractiveness Analysis by Country, 2016-2032
- Figure 199: Middle East & Africa Probiotics Market Revenue (US$ Mn) (2016-2032)
- Figure 200: Middle East & Africa Probiotics Market Revenue (US$ Mn) Comparison by Country (2016-2032)
- Figure 201: Middle East & Africa Probiotics Market Revenue (US$ Mn) Comparison by By Strain Type (2016-2032)
- Figure 202: Middle East & Africa Probiotics Market Revenue (US$ Mn) Comparison by By Ingredient (2016-2032)
- Figure 203: Middle East & Africa Probiotics Market Revenue (US$ Mn) Comparison by By Form (2016-2032)
- Figure 204: Middle East & Africa Probiotics Market Revenue (US$ Mn) Comparison by By Application (2016-2032)
- Figure 205: Middle East & Africa Probiotics Market Revenue (US$ Mn) Comparison by By Distribution Channel (2016-2032)
- Figure 206: Middle East & Africa Probiotics Market Y-o-Y Growth Rate Comparison by Country (2016-2032)
- Figure 207: Middle East & Africa Probiotics Market Y-o-Y Growth Rate Comparison by By Strain Type (2016-2032)
- Figure 208: Middle East & Africa Probiotics Market Y-o-Y Growth Rate Comparison by By Ingredient (2016-2032)
- Figure 209: Middle East & Africa Probiotics Market Y-o-Y Growth Rate Comparison by By Form (2016-2032)
- Figure 210: Middle East & Africa Probiotics Market Y-o-Y Growth Rate Comparison by By Application (2016-2032)
- Figure 211: Middle East & Africa Probiotics Market Y-o-Y Growth Rate Comparison by By Distribution Channel (2016-2032)
- Figure 212: Middle East & Africa Probiotics Market Share Comparison by Country (2016-2032)
- Figure 213: Middle East & Africa Probiotics Market Share Comparison by By Strain Type (2016-2032)
- Figure 214: Middle East & Africa Probiotics Market Share Comparison by By Ingredient (2016-2032)
- Figure 215: Middle East & Africa Probiotics Market Share Comparison by By Form (2016-2032)
- Figure 216: Middle East & Africa Probiotics Market Share Comparison by By Application (2016-2032)
- Figure 217: Middle East & Africa Probiotics Market Share Comparison by By Distribution Channel (2016-2032)
List of Tables
- Table 1: Global Probiotics Market Comparison by By Strain Type (2016-2032)
- Table 2: Global Probiotics Market Comparison by By Ingredient (2016-2032)
- Table 3: Global Probiotics Market Comparison by By Form (2016-2032)
- Table 4: Global Probiotics Market Comparison by By Application (2016-2032)
- Table 5: Global Probiotics Market Comparison by By Distribution Channel (2016-2032)
- Table 6: Global Probiotics Market Revenue (US$ Mn) Comparison by Region (2016-2032)
- Table 7: Global Probiotics Market Revenue (US$ Mn) (2016-2032)
- Table 8: Global Probiotics Market Revenue (US$ Mn) Comparison by Region (2016-2032)
- Table 9: Global Probiotics Market Revenue (US$ Mn) Comparison by By Strain Type (2016-2032)
- Table 10: Global Probiotics Market Revenue (US$ Mn) Comparison by By Ingredient (2016-2032)
- Table 11: Global Probiotics Market Revenue (US$ Mn) Comparison by By Form (2016-2032)
- Table 12: Global Probiotics Market Revenue (US$ Mn) Comparison by By Application (2016-2032)
- Table 13: Global Probiotics Market Revenue (US$ Mn) Comparison by By Distribution Channel (2016-2032)
- Table 14: Global Probiotics Market Y-o-Y Growth Rate Comparison by Region (2016-2032)
- Table 15: Global Probiotics Market Y-o-Y Growth Rate Comparison by By Strain Type (2016-2032)
- Table 16: Global Probiotics Market Y-o-Y Growth Rate Comparison by By Ingredient (2016-2032)
- Table 17: Global Probiotics Market Y-o-Y Growth Rate Comparison by By Form (2016-2032)
- Table 18: Global Probiotics Market Y-o-Y Growth Rate Comparison by By Application (2016-2032)
- Table 19: Global Probiotics Market Y-o-Y Growth Rate Comparison by By Distribution Channel (2016-2032)
- Table 20: Global Probiotics Market Share Comparison by Region (2016-2032)
- Table 21: Global Probiotics Market Share Comparison by By Strain Type (2016-2032)
- Table 22: Global Probiotics Market Share Comparison by By Ingredient (2016-2032)
- Table 23: Global Probiotics Market Share Comparison by By Form (2016-2032)
- Table 24: Global Probiotics Market Share Comparison by By Application (2016-2032)
- Table 25: Global Probiotics Market Share Comparison by By Distribution Channel (2016-2032)
- Table 26: North America Probiotics Market Comparison by By Ingredient (2016-2032)
- Table 27: North America Probiotics Market Comparison by By Form (2016-2032)
- Table 28: North America Probiotics Market Comparison by By Application (2016-2032)
- Table 29: North America Probiotics Market Comparison by By Distribution Channel (2016-2032)
- Table 30: North America Probiotics Market Revenue (US$ Mn) Comparison by Country (2016-2032)
- Table 31: North America Probiotics Market Revenue (US$ Mn) (2016-2032)
- Table 32: North America Probiotics Market Revenue (US$ Mn) Comparison by Country (2016-2032)
- Table 33: North America Probiotics Market Revenue (US$ Mn) Comparison by By Strain Type (2016-2032)
- Table 34: North America Probiotics Market Revenue (US$ Mn) Comparison by By Ingredient (2016-2032)
- Table 35: North America Probiotics Market Revenue (US$ Mn) Comparison by By Form (2016-2032)
- Table 36: North America Probiotics Market Revenue (US$ Mn) Comparison by By Application (2016-2032)
- Table 37: North America Probiotics Market Revenue (US$ Mn) Comparison by By Distribution Channel (2016-2032)
- Table 38: North America Probiotics Market Y-o-Y Growth Rate Comparison by Country (2016-2032)
- Table 39: North America Probiotics Market Y-o-Y Growth Rate Comparison by By Strain Type (2016-2032)
- Table 40: North America Probiotics Market Y-o-Y Growth Rate Comparison by By Ingredient (2016-2032)
- Table 41: North America Probiotics Market Y-o-Y Growth Rate Comparison by By Form (2016-2032)
- Table 42: North America Probiotics Market Y-o-Y Growth Rate Comparison by By Application (2016-2032)
- Table 43: North America Probiotics Market Y-o-Y Growth Rate Comparison by By Distribution Channel (2016-2032)
- Table 44: North America Probiotics Market Share Comparison by Country (2016-2032)
- Table 45: North America Probiotics Market Share Comparison by By Strain Type (2016-2032)
- Table 46: North America Probiotics Market Share Comparison by By Ingredient (2016-2032)
- Table 47: North America Probiotics Market Share Comparison by By Form (2016-2032)
- Table 48: North America Probiotics Market Share Comparison by By Application (2016-2032)
- Table 49: North America Probiotics Market Share Comparison by By Distribution Channel (2016-2032)
- Table 50: Western Europe Probiotics Market Comparison by By Strain Type (2016-2032)
- Table 51: Western Europe Probiotics Market Comparison by By Ingredient (2016-2032)
- Table 52: Western Europe Probiotics Market Comparison by By Form (2016-2032)
- Table 53: Western Europe Probiotics Market Comparison by By Application (2016-2032)
- Table 54: Western Europe Probiotics Market Comparison by By Distribution Channel (2016-2032)
- Table 55: Western Europe Probiotics Market Revenue (US$ Mn) Comparison by Country (2016-2032)
- Table 56: Western Europe Probiotics Market Revenue (US$ Mn) (2016-2032)
- Table 57: Western Europe Probiotics Market Revenue (US$ Mn) Comparison by Country (2016-2032)
- Table 58: Western Europe Probiotics Market Revenue (US$ Mn) Comparison by By Strain Type (2016-2032)
- Table 59: Western Europe Probiotics Market Revenue (US$ Mn) Comparison by By Ingredient (2016-2032)
- Table 60: Western Europe Probiotics Market Revenue (US$ Mn) Comparison by By Form (2016-2032)
- Table 61: Western Europe Probiotics Market Revenue (US$ Mn) Comparison by By Application (2016-2032)
- Table 62: Western Europe Probiotics Market Revenue (US$ Mn) Comparison by By Distribution Channel (2016-2032)
- Table 63: Western Europe Probiotics Market Y-o-Y Growth Rate Comparison by Country (2016-2032)
- Table 64: Western Europe Probiotics Market Y-o-Y Growth Rate Comparison by By Strain Type (2016-2032)
- Table 65: Western Europe Probiotics Market Y-o-Y Growth Rate Comparison by By Ingredient (2016-2032)
- Table 66: Western Europe Probiotics Market Y-o-Y Growth Rate Comparison by By Form (2016-2032)
- Table 67: Western Europe Probiotics Market Y-o-Y Growth Rate Comparison by By Application (2016-2032)
- Table 68: Western Europe Probiotics Market Y-o-Y Growth Rate Comparison by By Distribution Channel (2016-2032)
- Table 69: Western Europe Probiotics Market Share Comparison by Country (2016-2032)
- Table 70: Western Europe Probiotics Market Share Comparison by By Strain Type (2016-2032)
- Table 71: Western Europe Probiotics Market Share Comparison by By Ingredient (2016-2032)
- Table 72: Western Europe Probiotics Market Share Comparison by By Form (2016-2032)
- Table 73: Western Europe Probiotics Market Share Comparison by By Application (2016-2032)
- Table 74: Western Europe Probiotics Market Share Comparison by By Distribution Channel (2016-2032)
- Table 75: Eastern Europe Probiotics Market Comparison by By Strain Type (2016-2032)
- Table 76: Eastern Europe Probiotics Market Comparison by By Ingredient (2016-2032)
- Table 77: Eastern Europe Probiotics Market Comparison by By Form (2016-2032)
- Table 78: Eastern Europe Probiotics Market Comparison by By Application (2016-2032)
- Table 79: Eastern Europe Probiotics Market Comparison by By Distribution Channel (2016-2032)
- Table 80: Eastern Europe Probiotics Market Revenue (US$ Mn) Comparison by Country (2016-2032)
- Table 81: Eastern Europe Probiotics Market Revenue (US$ Mn) (2016-2032)
- Table 82: Eastern Europe Probiotics Market Revenue (US$ Mn) Comparison by Country (2016-2032)
- Table 83: Eastern Europe Probiotics Market Revenue (US$ Mn) Comparison by By Strain Type (2016-2032)
- Table 84: Eastern Europe Probiotics Market Revenue (US$ Mn) Comparison by By Ingredient (2016-2032)
- Table 85: Eastern Europe Probiotics Market Revenue (US$ Mn) Comparison by By Form (2016-2032)
- Table 86: Eastern Europe Probiotics Market Revenue (US$ Mn) Comparison by By Application (2016-2032)
- Table 87: Eastern Europe Probiotics Market Revenue (US$ Mn) Comparison by By Distribution Channel (2016-2032)
- Table 88: Eastern Europe Probiotics Market Y-o-Y Growth Rate Comparison by Country (2016-2032)
- Table 89: Eastern Europe Probiotics Market Y-o-Y Growth Rate Comparison by By Strain Type (2016-2032)
- Table 90: Eastern Europe Probiotics Market Y-o-Y Growth Rate Comparison by By Ingredient (2016-2032)
- Table 91: Eastern Europe Probiotics Market Y-o-Y Growth Rate Comparison by By Form (2016-2032)
- Table 92: Eastern Europe Probiotics Market Y-o-Y Growth Rate Comparison by By Application (2016-2032)
- Table 93: Eastern Europe Probiotics Market Y-o-Y Growth Rate Comparison by By Distribution Channel (2016-2032)
- Table 94: Eastern Europe Probiotics Market Share Comparison by Country (2016-2032)
- Table 95: Eastern Europe Probiotics Market Share Comparison by By Strain Type (2016-2032)
- Table 96: Eastern Europe Probiotics Market Share Comparison by By Ingredient (2016-2032)
- Table 97: Eastern Europe Probiotics Market Share Comparison by By Form (2016-2032)
- Table 98: Eastern Europe Probiotics Market Share Comparison by By Application (2016-2032)
- Table 99: Eastern Europe Probiotics Market Share Comparison by By Distribution Channel (2016-2032)
- Table 100: APAC Probiotics Market Comparison by By Strain Type (2016-2032)
- Table 101: APAC Probiotics Market Comparison by By Ingredient (2016-2032)
- Table 102: APAC Probiotics Market Comparison by By Form (2016-2032)
- Table 103: APAC Probiotics Market Comparison by By Application (2016-2032)
- Table 104: APAC Probiotics Market Comparison by By Distribution Channel (2016-2032)
- Table 105: APAC Probiotics Market Revenue (US$ Mn) Comparison by Country (2016-2032)
- Table 106: APAC Probiotics Market Revenue (US$ Mn) (2016-2032)
- Table 107: APAC Probiotics Market Revenue (US$ Mn) Comparison by Country (2016-2032)
- Table 108: APAC Probiotics Market Revenue (US$ Mn) Comparison by By Strain Type (2016-2032)
- Table 109: APAC Probiotics Market Revenue (US$ Mn) Comparison by By Ingredient (2016-2032)
- Table 110: APAC Probiotics Market Revenue (US$ Mn) Comparison by By Form (2016-2032)
- Table 111: APAC Probiotics Market Revenue (US$ Mn) Comparison by By Application (2016-2032)
- Table 112: APAC Probiotics Market Revenue (US$ Mn) Comparison by By Distribution Channel (2016-2032)
- Table 113: APAC Probiotics Market Y-o-Y Growth Rate Comparison by Country (2016-2032)
- Table 114: APAC Probiotics Market Y-o-Y Growth Rate Comparison by By Strain Type (2016-2032)
- Table 115: APAC Probiotics Market Y-o-Y Growth Rate Comparison by By Ingredient (2016-2032)
- Table 116: APAC Probiotics Market Y-o-Y Growth Rate Comparison by By Form (2016-2032)
- Table 117: APAC Probiotics Market Y-o-Y Growth Rate Comparison by By Application (2016-2032)
- Table 118: APAC Probiotics Market Y-o-Y Growth Rate Comparison by By Distribution Channel (2016-2032)
- Table 119: APAC Probiotics Market Share Comparison by Country (2016-2032)
- Table 120: APAC Probiotics Market Share Comparison by By Strain Type (2016-2032)
- Table 121: APAC Probiotics Market Share Comparison by By Ingredient (2016-2032)
- Table 122: APAC Probiotics Market Share Comparison by By Form (2016-2032)
- Table 123: APAC Probiotics Market Share Comparison by By Application (2016-2032)
- Table 124: APAC Probiotics Market Share Comparison by By Distribution Channel (2016-2032)
- Table 125: Latin America Probiotics Market Comparison by By Strain Type (2016-2032)
- Table 126: Latin America Probiotics Market Comparison by By Ingredient (2016-2032)
- Table 127: Latin America Probiotics Market Comparison by By Form (2016-2032)
- Table 128: Latin America Probiotics Market Comparison by By Application (2016-2032)
- Table 129: Latin America Probiotics Market Comparison by By Distribution Channel (2016-2032)
- Table 130: Latin America Probiotics Market Revenue (US$ Mn) Comparison by Country (2016-2032)
- Table 131: Latin America Probiotics Market Revenue (US$ Mn) (2016-2032)
- Table 132: Latin America Probiotics Market Revenue (US$ Mn) Comparison by Country (2016-2032)
- Table 133: Latin America Probiotics Market Revenue (US$ Mn) Comparison by By Strain Type (2016-2032)
- Table 134: Latin America Probiotics Market Revenue (US$ Mn) Comparison by By Ingredient (2016-2032)
- Table 135: Latin America Probiotics Market Revenue (US$ Mn) Comparison by By Form (2016-2032)
- Table 136: Latin America Probiotics Market Revenue (US$ Mn) Comparison by By Application (2016-2032)
- Table 137: Latin America Probiotics Market Revenue (US$ Mn) Comparison by By Distribution Channel (2016-2032)
- Table 138: Latin America Probiotics Market Y-o-Y Growth Rate Comparison by Country (2016-2032)
- Table 139: Latin America Probiotics Market Y-o-Y Growth Rate Comparison by By Strain Type (2016-2032)
- Table 140: Latin America Probiotics Market Y-o-Y Growth Rate Comparison by By Ingredient (2016-2032)
- Table 141: Latin America Probiotics Market Y-o-Y Growth Rate Comparison by By Form (2016-2032)
- Table 142: Latin America Probiotics Market Y-o-Y Growth Rate Comparison by By Application (2016-2032)
- Table 143: Latin America Probiotics Market Y-o-Y Growth Rate Comparison by By Distribution Channel (2016-2032)
- Table 144: Latin America Probiotics Market Share Comparison by Country (2016-2032)
- Table 145: Latin America Probiotics Market Share Comparison by By Strain Type (2016-2032)
- Table 146: Latin America Probiotics Market Share Comparison by By Ingredient (2016-2032)
- Table 147: Latin America Probiotics Market Share Comparison by By Form (2016-2032)
- Table 148: Latin America Probiotics Market Share Comparison by By Application (2016-2032)
- Table 149: Latin America Probiotics Market Share Comparison by By Distribution Channel (2016-2032)
- Table 150: Middle East & Africa Probiotics Market Comparison by By Strain Type (2016-2032)
- Table 151: Middle East & Africa Probiotics Market Comparison by By Ingredient (2016-2032)
- Table 152: Middle East & Africa Probiotics Market Comparison by By Form (2016-2032)
- Table 153: Middle East & Africa Probiotics Market Comparison by By Application (2016-2032)
- Table 154: Middle East & Africa Probiotics Market Comparison by By Distribution Channel (2016-2032)
- Table 155: Middle East & Africa Probiotics Market Revenue (US$ Mn) Comparison by Country (2016-2032)
- Table 156: Middle East & Africa Probiotics Market Revenue (US$ Mn) (2016-2032)
- Table 157: Middle East & Africa Probiotics Market Revenue (US$ Mn) Comparison by Country (2016-2032)
- Table 158: Middle East & Africa Probiotics Market Revenue (US$ Mn) Comparison by By Strain Type (2016-2032)
- Table 159: Middle East & Africa Probiotics Market Revenue (US$ Mn) Comparison by By Ingredient (2016-2032)
- Table 160: Middle East & Africa Probiotics Market Revenue (US$ Mn) Comparison by By Form (2016-2032)
- Table 161: Middle East & Africa Probiotics Market Revenue (US$ Mn) Comparison by By Application (2016-2032)
- Table 162: Middle East & Africa Probiotics Market Revenue (US$ Mn) Comparison by By Distribution Channel (2016-2032)
- Table 163: Middle East & Africa Probiotics Market Y-o-Y Growth Rate Comparison by Country (2016-2032)
- Table 164: Middle East & Africa Probiotics Market Y-o-Y Growth Rate Comparison by By Strain Type (2016-2032)
- Table 165: Middle East & Africa Probiotics Market Y-o-Y Growth Rate Comparison by By Ingredient (2016-2032)
- Table 166: Middle East & Africa Probiotics Market Y-o-Y Growth Rate Comparison by By Form (2016-2032)
- Table 167: Middle East & Africa Probiotics Market Y-o-Y Growth Rate Comparison by By Application (2016-2032)
- Table 168: Middle East & Africa Probiotics Market Y-o-Y Growth Rate Comparison by By Distribution Channel (2016-2032)
- Table 169: Middle East & Africa Probiotics Market Share Comparison by Country (2016-2032)
- Table 170: Middle East & Africa Probiotics Market Share Comparison by By Strain Type (2016-2032)
- Table 171: Middle East & Africa Probiotics Market Share Comparison by By Ingredient (2016-2032)
- Table 172: Middle East & Africa Probiotics Market Share Comparison by By Form (2016-2032)
- Table 173: Middle East & Africa Probiotics Market Share Comparison by By Application (2016-2032)
- Table 174: Middle East & Africa Probiotics Market Share Comparison by By Distribution Channel (2016-2032)
- 1. Executive Summary
-
- BioGaia AB
- Danone Chr.
- Hansen Holding A/S
- Yakult Honsha Co. Ltd.
- Probi AB
- Lifeway Foods Inc.
- Nestle S.A.
- Ganeden Inc.
- I. du Pont de Nemours and Company
- Protexin
Our Clients


View Our Licence Options
