
Privileged Access Management Solutions Market By Component (Software, Service), By Deployment Mode (On-Premises, Cloud), By End-Use Industry,(BFSI, IT & Telecommunication, Other), By Region And Companies - Industry Segment Outlook, Market Assessment, Competition Scenario, Trends, And Forecast 2023-2032
-
39430
-
July 2023
-
179
-


-
This report was compiled by Vishwa Gaul Vishwa is an experienced market research and consulting professional with over 8 years of expertise in the ICT industry, contributing to over 700 reports across telecommunications, software, hardware, and digital solutions. Correspondence Team Lead- ICT Linkedin | Detailed Market research Methodology Our methodology involves a mix of primary research, including interviews with leading mental health experts, and secondary research from reputable medical journals and databases. View Detailed Methodology Page
-
Quick Navigation
Report Overview
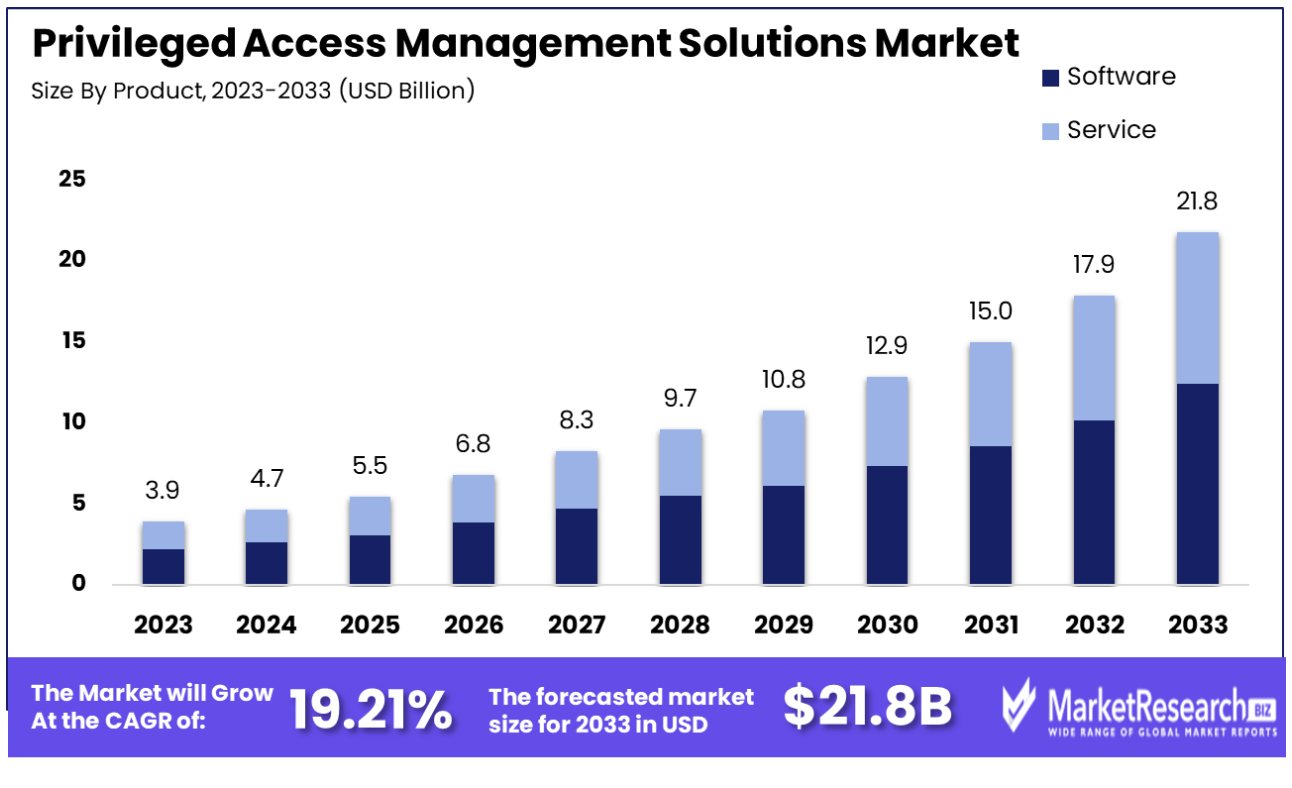
The privileged access management market was valued at USD 3.93 billion in 2023. It is expected to reach USD 25.73 billion by 2033, with a CAGR of 19.21% during the forecast period from 2024 to 2033.
The surge in demand for multi-cloud and hybrid technology, as well as the rise in cybersecurity threats, are some of the main driving factors for the privileged access management market. Privileged access management is the integration of equipment and advanced technologies that are used to safeguard, control, and supervise access to a company’s important data and resources.
The main goal of privileged access management solutions is to improve security by reducing the risk of privileged accounts being accessed, used, or taken advantage of by people who shouldn't be able to. These solutions reach this high goal by putting in place strong authentication, permission, and auditing systems. This makes it easier to follow industry rules and strengthens defenses against both outside and inside threats.
The ability to centralize and simplify the difficult task of handling privileged accounts is a key benefit of the privileged access management solutions market. Organizations can use the power of privileged access management solutions to automate these tasks rather than depending on time-consuming manual processes and cumbersome spreadsheets to track and monitor privileged access. By doing this, administrative costs are cut down, accuracy is improved, and there is consistency in how privileged access is managed across the company.
As we move deeper into the realm of important innovations, the privileged access management solutions market has seen great advancements in areas like biometric authentication, machine learning algorithms for anomaly detection, and seamless integration with other cutting-edge cyber security tools. By confirming the name of users before granting them privileged account access, the realm of biometric authentication, with fingerprint or facial recognition as prime examples, adds an extra layer of security.
Machine learning algorithms allow organizations to find and stop potential security threats before they happen by making it possible to spot unusual or suspicious trends of behavior. This, in turn, lets security problems be fixed quickly and decisively when they start. By correlating privileged access data with other security events and alerts and integrating it with other strong cybersecurity tools like security information and event management (SIEM) systems, privileged access management solutions improve the overall security of organizations.
Leading technology companies are investing a lot in privileged access management solutions, which shows how important they are becoming. Smart cybersecurity companies have built privileged access management features right into their current products, which shows how important these solutions are for protecting digital infrastructures.
Driving factors
More Cyber Threats and Data Breaches
Today's digital ecosystem has more cyber threats and data breaches. Hackers and malevolent actors can exploit vulnerabilities and steal sensitive data due to our interconnected lives, businesses, and devices. Organizations of all sizes and industries must protect against cyber threats and safeguard data.
The privileged access management solutions market reduces cyber threats and data breaches. Businesses are realizing the importance of strong privileged access security to secure key assets and prevent illegal access. Using privileged access management solutions, organizations may impose rigorous access rules, monitor privileged user activity, and detect suspicious or abnormal behavior that may suggest a breach.
Growing Adoption of Cloud Computing and Virtualization Technologies
Cloud computing and virtualization technologies have changed how businesses work and store data. Scalability, adaptability, and cost-efficiency have accelerated the adoption of these technologies across industries. However, multi-tenant cloud infrastructures increase the risk of illegal access and data breaches.
Data Protection Regulations are Strict
With data privacy at the forefront, regulatory compliance requirements have tightened. Governments and industry authorities around the world have acknowledged the need for enhanced data protection measures to safeguard the privacy and confidentiality of personal and commercial data. Failure to follow these rules can lead to financial, reputational, and legal consequences.
Rising Awareness of the Importance of Privileged Access Security
As cyber threats change and become more sophisticated, businesses and individuals are realizing the importance of privileged access security. A data breach or illegal access can cause financial loss, reputational damage, and legal liabilities. Thus, organizations are investing more in security, including privileged access management solutions.
Identity and Access Management Solutions are Required
The growing requirement for enhanced identity and access management solutions spurred the privileged access management solutions market. In today's complex and dynamic business environments, traditional approaches to identity and access management are often insufficient. The importance of securing and managing privileged access grows as organizations adopt new technologies, accept remote work, and communicate across scattered teams.
Restraining Factors
Complex Implementation and Integration
Today's digital world requires privileged access management solutions. These solutions control privileged account access to secure sensitive data and reduce data breaches. Despite their importance, organizations often confront various restraining obstacles when implementing and integrating the privileged access management solutions market.
Lack of Competent Professionals to Manage Privileged Access Solutions
Another restraining aspect is the lack of experienced professionals who possess the expertise to manage privileged access solutions. As demand for these solutions grows, organizations often struggle to locate experts to handle the implementation, setup, and continuing management of privileged access management systems.
By Component Analysis
The software segment dominates the privileged access management (PAM) solutions market. Businesses across industries are using PAM software to manage privileged access due to the growing demand for robust security measures. Organizations may secure their vital systems and data with the help of the software segment's extensive feature set and functionalities.
PAM software adoption in emerging economies depends on economic growth. Businesses are becoming more aware of the necessity for strong security measures to protect their sensitive information as these economies experience significant expansion. The software segment provides tools and technologies to secure system access and prevent illegal activity.
Consumer behavior regarding PAM software is also positive. With more high-profile data breaches and cyber-attacks, individuals and businesses are realizing the importance of privileged access management. They want software solutions with security and usability.
By Deployment Mode Analysis
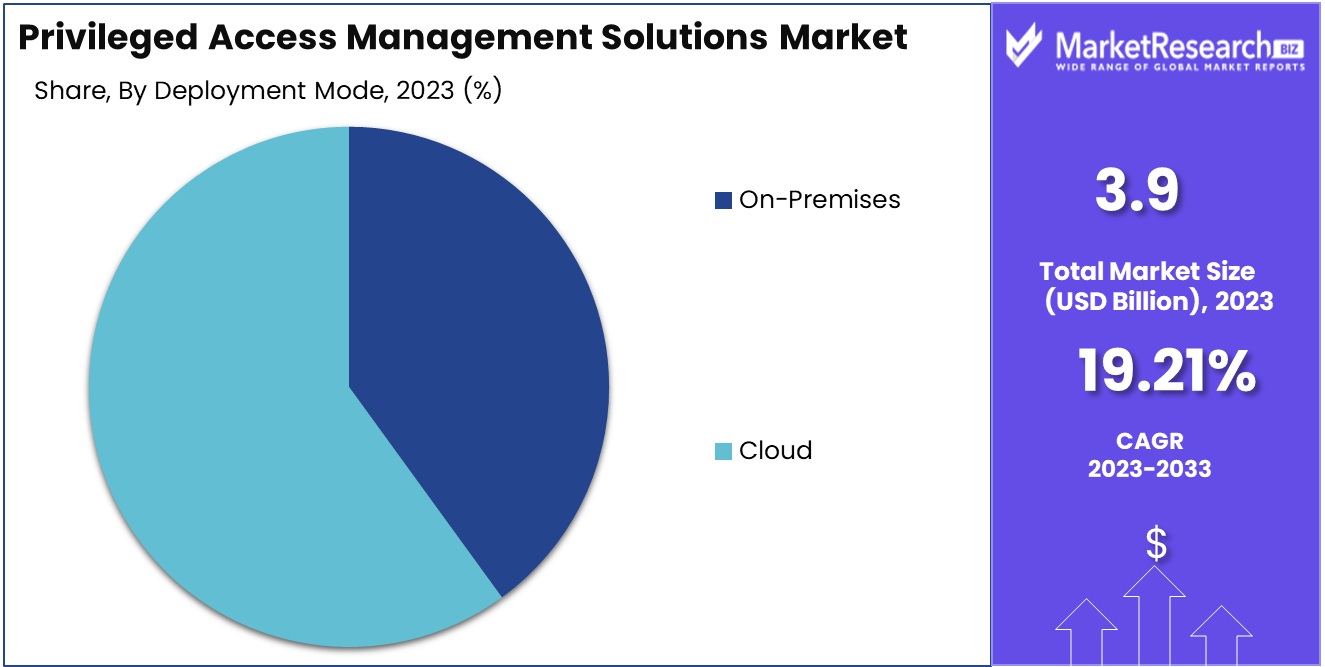
Privileged Access Management (PAM) solutions are dominated by cloud deployment. Cloud-based PAM solutions offer flexibility, scalability, and cost-effectiveness. To simplify their privileged access management procedures, businesses of all sizes and industries are adopting the cloud deployment paradigm.
Emerging economies are driving cloud-based PAM solutions adoption. As businesses in these economies flourish, demand for secure data access grows. Cloud deployment meets their increasing security needs with scalability and affordability.
Consumer attitudes and behavior regarding cloud-based PAM solutions are favorable. Businesses are discovering the benefits of cloud implementation, including lower infrastructure costs, simplified management, and increased access. They want cloud solutions with strong security and flexibility.
In the next years, the cloud segment of the privileged access management solutions market is expected to register the quickest growth rate. Several things can be attributed to this. First, the scalability of cloud-based solutions lets businesses seamlessly expand their privileged access management capabilities as their demands develop. In a continually evolving technology context, this scalability is essential.
By End-Use Industry Analysis
Privileged Access Management (PAM) solutions are dominated by the BFSI (Banking, Financial Services, and Insurance) sector. This industry needs strong security due to the digitization of financial services and the potential of cyberattacks. PAM solutions protect BFSI systems and data with complete security features.
Emerging economies are driving BFSI PAM solutions adoption. These economies' financial services sectors are growing rapidly, necessitating stronger security. PAM solutions help BFSI organizations control privileged access and prevent unwanted actions.
The BFSI consumer trend and behavior toward PAM solutions is encouraging. Businesses and individuals in the BFSI industry are becoming increasingly aware of the need for privileged access management as a result of the complexity of financial transactions and the developing threat landscape. They want security solutions that match regulations.
BFSI is expected to register the fastest growth in the privileged access management solutions market. Several things can be attributed to this. First, the BFSI industry handles massive volumes of sensitive data, making it a cyber-attack target. PAM solutions provide organizations with tools and technologies to secure their key systems and prevent unwanted access.
Key Market Segments
By Component
- Software
- Service
By Deployment Mode
- On-Premises
- Cloud
By End-Use Industry
- BFSI
- IT & Telecommunication
- Government Sector
- Healthcare
- Energy and Utilities
- Other End-Use Industries
Growth Opportunity
Privileged Access Management Demand Rising
Demand for comprehensive security solutions is rising in the privileged access management solutions market. Organizations are realizing the importance of successfully managing and controlling access to sensitive data and vital systems as cyber-attacks become more sophisticated. Thus, the demand for privileged access management solutions has increased.
Comprehensive Solutions Drive Privileged Access Management Market
A comprehensive privileged access management solutions market includes privileged password management, session monitoring, access request and approval workflows, and privileged session management. Organizations can improve security and restrict access to important resources by employing a comprehensive solution. Providers in the market have a great opportunity to develop thanks to the rising demand for comprehensive privileged access management solutions.
AI-Powered Threat Detection Grows Privileged Access Management Market
Organizations may improve their threat detection and response capabilities by implementing AI and machine learning capabilities into the privileged access management solutions market. This connection helps organizations detect illegal access, insider risks, and data breaches. The market demand for privileged access management solutions with advanced threat detection technology is promising.
Latest Trends
Changing PAM Solutions Improve Cybersecurity
In the rapidly evolving digital landscape of the present day, organizations confront numerous challenges in securing their sensitive data and essential resources. As the sophistication of cyber threats continues to increase, traditional security measures are no longer adequate to protect against unauthorized access and data intrusions. This has resulted in the emergence of the privileged access management (PAM) solutions market as a crucial element of comprehensive cybersecurity strategies.
Reinventing Privilege Access Management with Zero Trust
The shift toward Zero Trust security models is one of the main market trends reshaping the landscape of the privileged access management solutions market. Zero Trust takes a more proactive approach to safeguarding privileged accounts than conventional network security models, which rely on perimeter-based defenses.
Multifactor Authentication & Biometrics Strengthening Access Security
Multifactor authentication (MFA) and biometric verification are increasingly incorporated into privileged access management strategies across industries. MFA increases security by requiring users to provide multiple forms of authentication, such as passwords, tokens, smart cards, or biometric factors such as fingerprints or facial recognition.
Regional Analysis
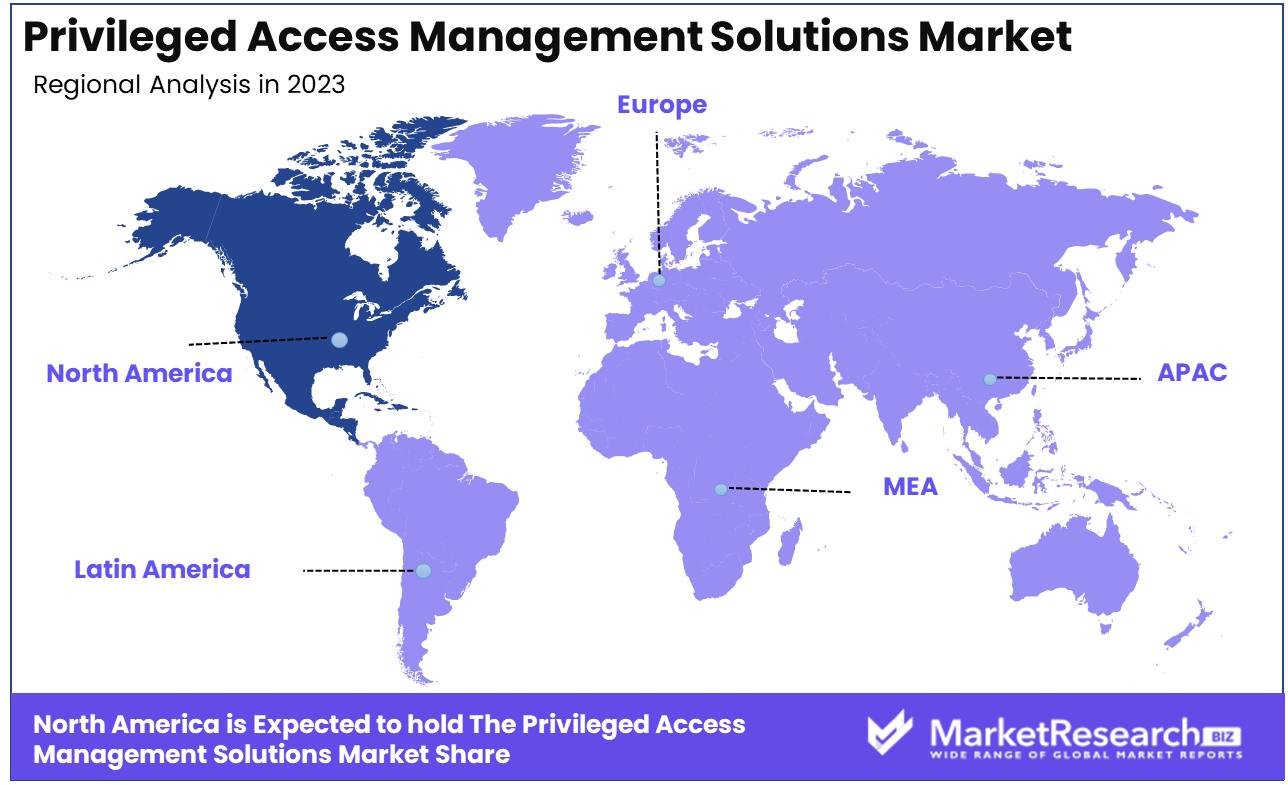
Privileged Access Management Solutions Market Dominates in North America Region. Businesses are focusing more on security in the digital age, where cyber attacks are getting more complex and ubiquitous. Privilege access management (PAM) solutions assist organizations protect their most sensitive data by managing and regulating user access to privileged accounts.
Recent years have seen rapid growth in the privileged access management solutions market. With a 10.3% compound annual growth rate (CAGR), it is projected to reach $7.6 billion by 2027. PAM solutions are being adopted by organizations in banking, healthcare, IT and telecommunications, government, and others, driving this growth.
North America dominates the PAM market. Several variables explain this region's competitive edge. First, North America is home to some of the world's biggest technology and financial companies, requiring stronger security.
Key Regions and Countries
North America
- US
- Canada
- Mexico
Western Europe
- Germany
- France
- The UK
- Spain
- Italy
- Portugal
- Ireland
- Austria
- Switzerland
- Benelux
- Nordic
- Rest of Western Europe
Eastern Europe
- Russia
- Poland
- The Czech Republic
- Greece
- Rest of Eastern Europe
APAC
- China
- Japan
- South Korea
- India
- Australia & New Zealand
- Indonesia
- Malaysia
- Philippines
- Singapore
- Thailand
- Vietnam
- Rest of APAC
Latin America
- Brazil
- Colombia
- Chile
- Argentina
- Costa Rica
- Rest of Latin America
Middle East & Africa
- Algeria
- Egypt
- Israel
- Kuwait
- Nigeria
- Saudi Arabia
- South Africa
- Turkey
- United Arab Emirates
- Rest of MEA
Key Players Analysis
The privileged access management solutions market is dominated by key players such as BeyondTrust Corporation, Centrify Corporation, CyberArk Software Ltd, SecureAuth Corporation, One Identity LLC, and Zoho Corporation Pvt Ltd. Each of these companies brings its own expertise and technologies to the table, providing organizations with robust and comprehensive solutions to combat the escalating cyber threats.
Centrify Corporation provides a unified infrastructure for privileged access management, combining identity and access management (IAM) and privileged access management (PAM) capabilities. Centrify provides organizations with a comprehensive and scalable security solution by integrating privileged access controls into IAM in a seamless manner. Their solutions integrate comprehensive multi-factor authentication capabilities with privileged identity management, privileged session management, and privileged password management.
Top Key Players in Privileged Access Management Solutions Market
- BeyondTrust Corporation.
- Centrify Corporation.
- CyberArk Software Ltd.
- SecureAuth Corporation.
- One Identity LLC
- Zoho Corporation Pvt Ltd.
- Ekran System
- Simeio Solutions
Recent Development
- In 2022, ThycoticCentrify, a renowned name in the cyber security industry, introduced its new Privileged Access Management (PAM) system, ThycoticCentrify Privilege Cloud.
- In 2021, IBM Security's acquisition of Resilient Systems, a prominent provider of security orchestration automation and response (SOAR) solutions, made headlines.
- In 2020, ForeScout Technologies, a prominent player in the PAM industry, finalized its acquisition of Perspecsys.
- In 2019, The renowned identity and access management (IAM) provider Okta acquired the prominent IAM market player Auth0.
Report Scope:
Report Features Description Market Value (2022) USD 2.75 Bn Forecast Revenue (2032) USD 28.5 Bn CAGR (2023-2032) 24.40% Base Year for Estimation 2022 Historic Period 2016-2022 Forecast Period 2023-2032 Report Coverage Revenue Forecast, Market Dynamics, COVID-19 Impact, Competitive Landscape, Recent Developments Segments Covered By Component (Software, Service), By Deployment Mode (On-Premises, Cloud), By End-Use Industry,(BFSI, IT and telecommunication, Government Sector, Healthcare, Energy and Utilities, Other End-Use Industries) Regional Analysis North America – The US, Canada, & Mexico; Western Europe – Germany, France, The UK, Spain, Italy, Portugal, Ireland, Austria, Switzerland, Benelux, Nordic, & Rest of Western Europe; Eastern Europe – Russia, Poland, The Czech Republic, Greece, & Rest of Eastern Europe; APAC – China, Japan, South Korea, India, Australia & New Zealand, Indonesia, Malaysia, Philippines, Singapore, Thailand, Vietnam, & Rest of APAC; Latin America – Brazil, Colombia, Chile, Argentina, Costa Rica, & Rest of Latin America; Middle East & Africa – Algeria, Egypt, Israel, Kuwait, Nigeria, Saudi Arabia, South Africa, Turkey, United Arab Emirates, & Rest of MEA Competitive Landscape BeyondTrust Corporation., Centrify Corporation., CyberArk Software Ltd., SecureAuth Corporation., One Identity LLC, Zoho Corporation Pvt Ltd., Ekran System, Simeio Solutions Customization Scope Customization for segments, region/country-level will be provided. Moreover, additional customization can be done based on the requirements. Purchase Options We have three licenses to opt for: Single User License, Multi-User License (Up to 5 Users), Corporate Use License (Unlimited User and Printable PDF) -
- 1. Executive Summary
- 1.1. Definition
- 1.2. Taxonomy
- 1.3. Research Scope
- 1.4. Key Analysis
- 1.5. Key Findings by Major Segments
- 1.6. Top strategies by Major Players
- 2. Global Privileged Access Management Solutions Market Overview
- 2.1. Privileged Access Management Solutions Market Dynamics
- 2.1.1. Drivers
- 2.1.2. Opportunities
- 2.1.3. Restraints
- 2.1.4. Challenges
- 2.2. Macro-economic Factors
- 2.3. Regulatory Framework
- 2.4. Market Investment Feasibility Index
- 2.5. PEST Analysis
- 2.6. PORTER’S Five Force Analysis
- 2.7. Drivers & Restraints Impact Analysis
- 2.8. Industry Chain Analysis
- 2.9. Cost Structure Analysis
- 2.10. Marketing Strategy
- 2.11. Russia-Ukraine War Impact Analysis
- 2.12. Opportunity Map Analysis
- 2.13. Market Competition Scenario Analysis
- 2.14. Product Life Cycle Analysis
- 2.15. Opportunity Orbits
- 2.16. Manufacturer Intensity Map
- 2.17. Major Companies sales by Value & Volume
- 2.1. Privileged Access Management Solutions Market Dynamics
- 3. Global Privileged Access Management Solutions Market Analysis, Opportunity and Forecast, 2016-2032
- 3.1. Global Privileged Access Management Solutions Market Analysis, 2016-2021
- 3.2. Global Privileged Access Management Solutions Market Opportunity and Forecast, 2023-2032
- 3.3. Global Privileged Access Management Solutions Market Analysis, Opportunity and Forecast, By Component, 2016-2032
- 3.3.1. Global Privileged Access Management Solutions Market Analysis by Component: Introduction
- 3.3.2. Market Size Absolute $ Opportunity Analysis and Forecast, By Component, 2016-2032
- 3.3.3. Software
- 3.3.4. Service
- 3.4. Global Privileged Access Management Solutions Market Analysis, Opportunity and Forecast, By By Deployment Mode, 2016-2032
- 3.4.1. Global Privileged Access Management Solutions Market Analysis by By Deployment Mode: Introduction
- 3.4.2. Market Size Absolute $ Opportunity Analysis and Forecast, By By Deployment Mode, 2016-2032
- 3.4.3. On-Premises
- 3.4.4. Cloud
- 3.5. Global Privileged Access Management Solutions Market Analysis, Opportunity and Forecast, By By End-Use Industry, 2016-2032
- 3.5.1. Global Privileged Access Management Solutions Market Analysis by By End-Use Industry: Introduction
- 3.5.2. Market Size Absolute $ Opportunity Analysis and Forecast, By By End-Use Industry, 2016-2032
- 3.5.3. BFSI
- 3.5.4. IT & Telecommunication
- 3.5.5. Government Sector
- 3.5.6. Healthcare
- 3.5.7. Energy and Utilities
- 3.5.8. Other End-Use Industries
- 3.6. Global Privileged Access Management Solutions Market Analysis, Opportunity and Forecast, By , 2016-2032
- 3.6.1. Global Privileged Access Management Solutions Market Analysis by : Introduction
- 3.6.2. Market Size Absolute $ Opportunity Analysis and Forecast, By , 2016-2032
- 4. North America Privileged Access Management Solutions Market Analysis, Opportunity and Forecast, 2016-2032
- 4.1. North America Privileged Access Management Solutions Market Analysis, 2016-2021
- 4.2. North America Privileged Access Management Solutions Market Opportunity and Forecast, 2023-2032
- 4.3. North America Privileged Access Management Solutions Market Analysis, Opportunity and Forecast, By Component, 2016-2032
- 4.3.1. North America Privileged Access Management Solutions Market Analysis by Component: Introduction
- 4.3.2. Market Size Absolute $ Opportunity Analysis and Forecast, By Component, 2016-2032
- 4.3.3. Software
- 4.3.4. Service
- 4.4. North America Privileged Access Management Solutions Market Analysis, Opportunity and Forecast, By By Deployment Mode, 2016-2032
- 4.4.1. North America Privileged Access Management Solutions Market Analysis by By Deployment Mode: Introduction
- 4.4.2. Market Size Absolute $ Opportunity Analysis and Forecast, By By Deployment Mode, 2016-2032
- 4.4.3. On-Premises
- 4.4.4. Cloud
- 4.5. North America Privileged Access Management Solutions Market Analysis, Opportunity and Forecast, By By End-Use Industry, 2016-2032
- 4.5.1. North America Privileged Access Management Solutions Market Analysis by By End-Use Industry: Introduction
- 4.5.2. Market Size Absolute $ Opportunity Analysis and Forecast, By By End-Use Industry, 2016-2032
- 4.5.3. BFSI
- 4.5.4. IT & Telecommunication
- 4.5.5. Government Sector
- 4.5.6. Healthcare
- 4.5.7. Energy and Utilities
- 4.5.8. Other End-Use Industries
- 4.6. North America Privileged Access Management Solutions Market Analysis, Opportunity and Forecast, By , 2016-2032
- 4.6.1. North America Privileged Access Management Solutions Market Analysis by : Introduction
- 4.6.2. Market Size Absolute $ Opportunity Analysis and Forecast, By , 2016-2032
- 4.7. North America Privileged Access Management Solutions Market Analysis, Opportunity and Forecast, By Country , 2016-2032
- 4.7.1. North America Privileged Access Management Solutions Market Analysis by Country : Introduction
- 4.7.2. Market Size Absolute $ Opportunity Analysis and Forecast, Country , 2016-2032
- 4.7.2.1. The US
- 4.7.2.2. Canada
- 4.7.2.3. Mexico
- 5. Western Europe Privileged Access Management Solutions Market Analysis, Opportunity and Forecast, 2016-2032
- 5.1. Western Europe Privileged Access Management Solutions Market Analysis, 2016-2021
- 5.2. Western Europe Privileged Access Management Solutions Market Opportunity and Forecast, 2023-2032
- 5.3. Western Europe Privileged Access Management Solutions Market Analysis, Opportunity and Forecast, By Component, 2016-2032
- 5.3.1. Western Europe Privileged Access Management Solutions Market Analysis by Component: Introduction
- 5.3.2. Market Size Absolute $ Opportunity Analysis and Forecast, By Component, 2016-2032
- 5.3.3. Software
- 5.3.4. Service
- 5.4. Western Europe Privileged Access Management Solutions Market Analysis, Opportunity and Forecast, By By Deployment Mode, 2016-2032
- 5.4.1. Western Europe Privileged Access Management Solutions Market Analysis by By Deployment Mode: Introduction
- 5.4.2. Market Size Absolute $ Opportunity Analysis and Forecast, By By Deployment Mode, 2016-2032
- 5.4.3. On-Premises
- 5.4.4. Cloud
- 5.5. Western Europe Privileged Access Management Solutions Market Analysis, Opportunity and Forecast, By By End-Use Industry, 2016-2032
- 5.5.1. Western Europe Privileged Access Management Solutions Market Analysis by By End-Use Industry: Introduction
- 5.5.2. Market Size Absolute $ Opportunity Analysis and Forecast, By By End-Use Industry, 2016-2032
- 5.5.3. BFSI
- 5.5.4. IT & Telecommunication
- 5.5.5. Government Sector
- 5.5.6. Healthcare
- 5.5.7. Energy and Utilities
- 5.5.8. Other End-Use Industries
- 5.6. Western Europe Privileged Access Management Solutions Market Analysis, Opportunity and Forecast, By , 2016-2032
- 5.6.1. Western Europe Privileged Access Management Solutions Market Analysis by : Introduction
- 5.6.2. Market Size Absolute $ Opportunity Analysis and Forecast, By , 2016-2032
- 5.7. Western Europe Privileged Access Management Solutions Market Analysis, Opportunity and Forecast, By Country , 2016-2032
- 5.7.1. Western Europe Privileged Access Management Solutions Market Analysis by Country : Introduction
- 5.7.2. Market Size Absolute $ Opportunity Analysis and Forecast, Country , 2016-2032
- 5.7.2.1. Germany
- 5.7.2.2. France
- 5.7.2.3. The UK
- 5.7.2.4. Spain
- 5.7.2.5. Italy
- 5.7.2.6. Portugal
- 5.7.2.7. Ireland
- 5.7.2.8. Austria
- 5.7.2.9. Switzerland
- 5.7.2.10. Benelux
- 5.7.2.11. Nordic
- 5.7.2.12. Rest of Western Europe
- 6. Eastern Europe Privileged Access Management Solutions Market Analysis, Opportunity and Forecast, 2016-2032
- 6.1. Eastern Europe Privileged Access Management Solutions Market Analysis, 2016-2021
- 6.2. Eastern Europe Privileged Access Management Solutions Market Opportunity and Forecast, 2023-2032
- 6.3. Eastern Europe Privileged Access Management Solutions Market Analysis, Opportunity and Forecast, By Component, 2016-2032
- 6.3.1. Eastern Europe Privileged Access Management Solutions Market Analysis by Component: Introduction
- 6.3.2. Market Size Absolute $ Opportunity Analysis and Forecast, By Component, 2016-2032
- 6.3.3. Software
- 6.3.4. Service
- 6.4. Eastern Europe Privileged Access Management Solutions Market Analysis, Opportunity and Forecast, By By Deployment Mode, 2016-2032
- 6.4.1. Eastern Europe Privileged Access Management Solutions Market Analysis by By Deployment Mode: Introduction
- 6.4.2. Market Size Absolute $ Opportunity Analysis and Forecast, By By Deployment Mode, 2016-2032
- 6.4.3. On-Premises
- 6.4.4. Cloud
- 6.5. Eastern Europe Privileged Access Management Solutions Market Analysis, Opportunity and Forecast, By By End-Use Industry, 2016-2032
- 6.5.1. Eastern Europe Privileged Access Management Solutions Market Analysis by By End-Use Industry: Introduction
- 6.5.2. Market Size Absolute $ Opportunity Analysis and Forecast, By By End-Use Industry, 2016-2032
- 6.5.3. BFSI
- 6.5.4. IT & Telecommunication
- 6.5.5. Government Sector
- 6.5.6. Healthcare
- 6.5.7. Energy and Utilities
- 6.5.8. Other End-Use Industries
- 6.6. Eastern Europe Privileged Access Management Solutions Market Analysis, Opportunity and Forecast, By , 2016-2032
- 6.6.1. Eastern Europe Privileged Access Management Solutions Market Analysis by : Introduction
- 6.6.2. Market Size Absolute $ Opportunity Analysis and Forecast, By , 2016-2032
- 6.7. Eastern Europe Privileged Access Management Solutions Market Analysis, Opportunity and Forecast, By Country , 2016-2032
- 6.7.1. Eastern Europe Privileged Access Management Solutions Market Analysis by Country : Introduction
- 6.7.2. Market Size Absolute $ Opportunity Analysis and Forecast, Country , 2016-2032
- 6.7.2.1. Russia
- 6.7.2.2. Poland
- 6.7.2.3. The Czech Republic
- 6.7.2.4. Greece
- 6.7.2.5. Rest of Eastern Europe
- 7. APAC Privileged Access Management Solutions Market Analysis, Opportunity and Forecast, 2016-2032
- 7.1. APAC Privileged Access Management Solutions Market Analysis, 2016-2021
- 7.2. APAC Privileged Access Management Solutions Market Opportunity and Forecast, 2023-2032
- 7.3. APAC Privileged Access Management Solutions Market Analysis, Opportunity and Forecast, By Component, 2016-2032
- 7.3.1. APAC Privileged Access Management Solutions Market Analysis by Component: Introduction
- 7.3.2. Market Size Absolute $ Opportunity Analysis and Forecast, By Component, 2016-2032
- 7.3.3. Software
- 7.3.4. Service
- 7.4. APAC Privileged Access Management Solutions Market Analysis, Opportunity and Forecast, By By Deployment Mode, 2016-2032
- 7.4.1. APAC Privileged Access Management Solutions Market Analysis by By Deployment Mode: Introduction
- 7.4.2. Market Size Absolute $ Opportunity Analysis and Forecast, By By Deployment Mode, 2016-2032
- 7.4.3. On-Premises
- 7.4.4. Cloud
- 7.5. APAC Privileged Access Management Solutions Market Analysis, Opportunity and Forecast, By By End-Use Industry, 2016-2032
- 7.5.1. APAC Privileged Access Management Solutions Market Analysis by By End-Use Industry: Introduction
- 7.5.2. Market Size Absolute $ Opportunity Analysis and Forecast, By By End-Use Industry, 2016-2032
- 7.5.3. BFSI
- 7.5.4. IT & Telecommunication
- 7.5.5. Government Sector
- 7.5.6. Healthcare
- 7.5.7. Energy and Utilities
- 7.5.8. Other End-Use Industries
- 7.6. APAC Privileged Access Management Solutions Market Analysis, Opportunity and Forecast, By , 2016-2032
- 7.6.1. APAC Privileged Access Management Solutions Market Analysis by : Introduction
- 7.6.2. Market Size Absolute $ Opportunity Analysis and Forecast, By , 2016-2032
- 7.7. APAC Privileged Access Management Solutions Market Analysis, Opportunity and Forecast, By Country , 2016-2032
- 7.7.1. APAC Privileged Access Management Solutions Market Analysis by Country : Introduction
- 7.7.2. Market Size Absolute $ Opportunity Analysis and Forecast, Country , 2016-2032
- 7.7.2.1. China
- 7.7.2.2. Japan
- 7.7.2.3. South Korea
- 7.7.2.4. India
- 7.7.2.5. Australia & New Zeland
- 7.7.2.6. Indonesia
- 7.7.2.7. Malaysia
- 7.7.2.8. Philippines
- 7.7.2.9. Singapore
- 7.7.2.10. Thailand
- 7.7.2.11. Vietnam
- 7.7.2.12. Rest of APAC
- 8. Latin America Privileged Access Management Solutions Market Analysis, Opportunity and Forecast, 2016-2032
- 8.1. Latin America Privileged Access Management Solutions Market Analysis, 2016-2021
- 8.2. Latin America Privileged Access Management Solutions Market Opportunity and Forecast, 2023-2032
- 8.3. Latin America Privileged Access Management Solutions Market Analysis, Opportunity and Forecast, By Component, 2016-2032
- 8.3.1. Latin America Privileged Access Management Solutions Market Analysis by Component: Introduction
- 8.3.2. Market Size Absolute $ Opportunity Analysis and Forecast, By Component, 2016-2032
- 8.3.3. Software
- 8.3.4. Service
- 8.4. Latin America Privileged Access Management Solutions Market Analysis, Opportunity and Forecast, By By Deployment Mode, 2016-2032
- 8.4.1. Latin America Privileged Access Management Solutions Market Analysis by By Deployment Mode: Introduction
- 8.4.2. Market Size Absolute $ Opportunity Analysis and Forecast, By By Deployment Mode, 2016-2032
- 8.4.3. On-Premises
- 8.4.4. Cloud
- 8.5. Latin America Privileged Access Management Solutions Market Analysis, Opportunity and Forecast, By By End-Use Industry, 2016-2032
- 8.5.1. Latin America Privileged Access Management Solutions Market Analysis by By End-Use Industry: Introduction
- 8.5.2. Market Size Absolute $ Opportunity Analysis and Forecast, By By End-Use Industry, 2016-2032
- 8.5.3. BFSI
- 8.5.4. IT & Telecommunication
- 8.5.5. Government Sector
- 8.5.6. Healthcare
- 8.5.7. Energy and Utilities
- 8.5.8. Other End-Use Industries
- 8.6. Latin America Privileged Access Management Solutions Market Analysis, Opportunity and Forecast, By , 2016-2032
- 8.6.1. Latin America Privileged Access Management Solutions Market Analysis by : Introduction
- 8.6.2. Market Size Absolute $ Opportunity Analysis and Forecast, By , 2016-2032
- 8.7. Latin America Privileged Access Management Solutions Market Analysis, Opportunity and Forecast, By Country , 2016-2032
- 8.7.1. Latin America Privileged Access Management Solutions Market Analysis by Country : Introduction
- 8.7.2. Market Size Absolute $ Opportunity Analysis and Forecast, Country , 2016-2032
- 8.7.2.1. Brazil
- 8.7.2.2. Colombia
- 8.7.2.3. Chile
- 8.7.2.4. Argentina
- 8.7.2.5. Costa Rica
- 8.7.2.6. Rest of Latin America
- 9. Middle East & Africa Privileged Access Management Solutions Market Analysis, Opportunity and Forecast, 2016-2032
- 9.1. Middle East & Africa Privileged Access Management Solutions Market Analysis, 2016-2021
- 9.2. Middle East & Africa Privileged Access Management Solutions Market Opportunity and Forecast, 2023-2032
- 9.3. Middle East & Africa Privileged Access Management Solutions Market Analysis, Opportunity and Forecast, By Component, 2016-2032
- 9.3.1. Middle East & Africa Privileged Access Management Solutions Market Analysis by Component: Introduction
- 9.3.2. Market Size Absolute $ Opportunity Analysis and Forecast, By Component, 2016-2032
- 9.3.3. Software
- 9.3.4. Service
- 9.4. Middle East & Africa Privileged Access Management Solutions Market Analysis, Opportunity and Forecast, By By Deployment Mode, 2016-2032
- 9.4.1. Middle East & Africa Privileged Access Management Solutions Market Analysis by By Deployment Mode: Introduction
- 9.4.2. Market Size Absolute $ Opportunity Analysis and Forecast, By By Deployment Mode, 2016-2032
- 9.4.3. On-Premises
- 9.4.4. Cloud
- 9.5. Middle East & Africa Privileged Access Management Solutions Market Analysis, Opportunity and Forecast, By By End-Use Industry, 2016-2032
- 9.5.1. Middle East & Africa Privileged Access Management Solutions Market Analysis by By End-Use Industry: Introduction
- 9.5.2. Market Size Absolute $ Opportunity Analysis and Forecast, By By End-Use Industry, 2016-2032
- 9.5.3. BFSI
- 9.5.4. IT & Telecommunication
- 9.5.5. Government Sector
- 9.5.6. Healthcare
- 9.5.7. Energy and Utilities
- 9.5.8. Other End-Use Industries
- 9.6. Middle East & Africa Privileged Access Management Solutions Market Analysis, Opportunity and Forecast, By , 2016-2032
- 9.6.1. Middle East & Africa Privileged Access Management Solutions Market Analysis by : Introduction
- 9.6.2. Market Size Absolute $ Opportunity Analysis and Forecast, By , 2016-2032
- 9.7. Middle East & Africa Privileged Access Management Solutions Market Analysis, Opportunity and Forecast, By Country , 2016-2032
- 9.7.1. Middle East & Africa Privileged Access Management Solutions Market Analysis by Country : Introduction
- 9.7.2. Market Size Absolute $ Opportunity Analysis and Forecast, Country , 2016-2032
- 9.7.2.1. Algeria
- 9.7.2.2. Egypt
- 9.7.2.3. Israel
- 9.7.2.4. Kuwait
- 9.7.2.5. Nigeria
- 9.7.2.6. Saudi Arabia
- 9.7.2.7. South Africa
- 9.7.2.8. Turkey
- 9.7.2.9. The UAE
- 9.7.2.10. Rest of MEA
- 10. Global Privileged Access Management Solutions Market Analysis, Opportunity and Forecast, By Region , 2016-2032
- 10.1. Global Privileged Access Management Solutions Market Analysis by Region : Introduction
- 10.2. Market Size Absolute $ Opportunity Analysis and Forecast, By Region , 2016-2032
- 10.2.1. North America
- 10.2.2. Western Europe
- 10.2.3. Eastern Europe
- 10.2.4. APAC
- 10.2.5. Latin America
- 10.2.6. Middle East & Africa
- 11. Global Privileged Access Management Solutions Market Competitive Landscape, Market Share Analysis, and Company Profiles
- 11.1. Market Share Analysis
- 11.2. Company Profiles
- 11.3. BeyondTrust Corporation.
- 11.3.1. Company Overview
- 11.3.2. Financial Highlights
- 11.3.3. Product Portfolio
- 11.3.4. SWOT Analysis
- 11.3.5. Key Strategies and Developments
- 11.4. Centrify Corporation.
- 11.4.1. Company Overview
- 11.4.2. Financial Highlights
- 11.4.3. Product Portfolio
- 11.4.4. SWOT Analysis
- 11.4.5. Key Strategies and Developments
- 11.5. CyberArk Software Ltd.
- 11.5.1. Company Overview
- 11.5.2. Financial Highlights
- 11.5.3. Product Portfolio
- 11.5.4. SWOT Analysis
- 11.5.5. Key Strategies and Developments
- 11.6. SecureAuth Corporation.
- 11.6.1. Company Overview
- 11.6.2. Financial Highlights
- 11.6.3. Product Portfolio
- 11.6.4. SWOT Analysis
- 11.6.5. Key Strategies and Developments
- 11.7. One Identity LLC
- 11.7.1. Company Overview
- 11.7.2. Financial Highlights
- 11.7.3. Product Portfolio
- 11.7.4. SWOT Analysis
- 11.7.5. Key Strategies and Developments
- 11.8. Zoho Corporation Pvt Ltd.
- 11.8.1. Company Overview
- 11.8.2. Financial Highlights
- 11.8.3. Product Portfolio
- 11.8.4. SWOT Analysis
- 11.8.5. Key Strategies and Developments
- 11.9. Ekran System
- 11.9.1. Company Overview
- 11.9.2. Financial Highlights
- 11.9.3. Product Portfolio
- 11.9.4. SWOT Analysis
- 11.9.5. Key Strategies and Developments
- 11.10. Simeio Solutions
- 11.10.1. Company Overview
- 11.10.2. Financial Highlights
- 11.10.3. Product Portfolio
- 11.10.4. SWOT Analysis
- 11.10.5. Key Strategies and Developments
- 12. Assumptions and Acronyms
- 13. Research Methodology
- 14. Contact
List of Figures
-
- Figure 1: Global Privileged Access Management Solutions Market Revenue (US$ Mn) Market Share by Component in 2022
- Figure 2: Global Privileged Access Management Solutions Market Attractiveness Analysis by Component, 2016-2032
- Figure 3: Global Privileged Access Management Solutions Market Revenue (US$ Mn) Market Share by Deployment Modein 2022
- Figure 4: Global Privileged Access Management Solutions Market Attractiveness Analysis by Deployment Mode, 2016-2032
- Figure 5: Global Privileged Access Management Solutions Market Revenue (US$ Mn) Market Share by End-Use Industryin 2022
- Figure 6: Global Privileged Access Management Solutions Market Attractiveness Analysis by End-Use Industry, 2016-2032
- Figure 7: Global Privileged Access Management Solutions Market Revenue (US$ Mn) Market Share by in 2022
- Figure 8: Global Privileged Access Management Solutions Market Attractiveness Analysis by , 2016-2032
- Figure 9: Global Privileged Access Management Solutions Market Revenue (US$ Mn) Market Share by Region in 2022
- Figure 10: Global Privileged Access Management Solutions Market Attractiveness Analysis by Region, 2016-2032
- Figure 11: Global Privileged Access Management Solutions Market Revenue (US$ Mn) (2016-2032)
- Figure 12: Global Privileged Access Management Solutions Market Revenue (US$ Mn) Comparison by Region (2016-2032)
- Figure 13: Global Privileged Access Management Solutions Market Revenue (US$ Mn) Comparison by Component (2016-2032)
- Figure 14: Global Privileged Access Management Solutions Market Revenue (US$ Mn) Comparison by Deployment Mode (2016-2032)
- Figure 15: Global Privileged Access Management Solutions Market Revenue (US$ Mn) Comparison by End-Use Industry (2016-2032)
- Figure 16: Global Privileged Access Management Solutions Market Revenue (US$ Mn) Comparison by (2016-2032)
- Figure 17: Global Privileged Access Management Solutions Market Y-o-Y Growth Rate Comparison by Region (2016-2032)
- Figure 18: Global Privileged Access Management Solutions Market Y-o-Y Growth Rate Comparison by Component (2016-2032)
- Figure 19: Global Privileged Access Management Solutions Market Y-o-Y Growth Rate Comparison by Deployment Mode (2016-2032)
- Figure 20: Global Privileged Access Management Solutions Market Y-o-Y Growth Rate Comparison by End-Use Industry (2016-2032)
- Figure 21: Global Privileged Access Management Solutions Market Y-o-Y Growth Rate Comparison by (2016-2032)
- Figure 22: Global Privileged Access Management Solutions Market Share Comparison by Region (2016-2032)
- Figure 23: Global Privileged Access Management Solutions Market Share Comparison by Component (2016-2032)
- Figure 24: Global Privileged Access Management Solutions Market Share Comparison by Deployment Mode (2016-2032)
- Figure 25: Global Privileged Access Management Solutions Market Share Comparison by End-Use Industry (2016-2032)
- Figure 26: Global Privileged Access Management Solutions Market Share Comparison by (2016-2032)
- Figure 27: North America Privileged Access Management Solutions Market Revenue (US$ Mn) Market Share by Componentin 2022
- Figure 28: North America Privileged Access Management Solutions Market Attractiveness Analysis by Component, 2016-2032
- Figure 29: North America Privileged Access Management Solutions Market Revenue (US$ Mn) Market Share by Deployment Modein 2022
- Figure 30: North America Privileged Access Management Solutions Market Attractiveness Analysis by Deployment Mode, 2016-2032
- Figure 31: North America Privileged Access Management Solutions Market Revenue (US$ Mn) Market Share by End-Use Industryin 2022
- Figure 32: North America Privileged Access Management Solutions Market Attractiveness Analysis by End-Use Industry, 2016-2032
- Figure 33: North America Privileged Access Management Solutions Market Revenue (US$ Mn) Market Share by in 2022
- Figure 34: North America Privileged Access Management Solutions Market Attractiveness Analysis by , 2016-2032
- Figure 35: North America Privileged Access Management Solutions Market Revenue (US$ Mn) Market Share by Country in 2022
- Figure 36: North America Privileged Access Management Solutions Market Attractiveness Analysis by Country, 2016-2032
- Figure 37: North America Privileged Access Management Solutions Market Revenue (US$ Mn) (2016-2032)
- Figure 38: North America Privileged Access Management Solutions Market Revenue (US$ Mn) Comparison by Country (2016-2032)
- Figure 39: North America Privileged Access Management Solutions Market Revenue (US$ Mn) Comparison by Component (2016-2032)
- Figure 40: North America Privileged Access Management Solutions Market Revenue (US$ Mn) Comparison by Deployment Mode (2016-2032)
- Figure 41: North America Privileged Access Management Solutions Market Revenue (US$ Mn) Comparison by End-Use Industry (2016-2032)
- Figure 42: North America Privileged Access Management Solutions Market Revenue (US$ Mn) Comparison by (2016-2032)
- Figure 43: North America Privileged Access Management Solutions Market Y-o-Y Growth Rate Comparison by Country (2016-2032)
- Figure 44: North America Privileged Access Management Solutions Market Y-o-Y Growth Rate Comparison by Component (2016-2032)
- Figure 45: North America Privileged Access Management Solutions Market Y-o-Y Growth Rate Comparison by Deployment Mode (2016-2032)
- Figure 46: North America Privileged Access Management Solutions Market Y-o-Y Growth Rate Comparison by End-Use Industry (2016-2032)
- Figure 47: North America Privileged Access Management Solutions Market Y-o-Y Growth Rate Comparison by (2016-2032)
- Figure 48: North America Privileged Access Management Solutions Market Share Comparison by Country (2016-2032)
- Figure 49: North America Privileged Access Management Solutions Market Share Comparison by Component (2016-2032)
- Figure 50: North America Privileged Access Management Solutions Market Share Comparison by Deployment Mode (2016-2032)
- Figure 51: North America Privileged Access Management Solutions Market Share Comparison by End-Use Industry (2016-2032)
- Figure 52: North America Privileged Access Management Solutions Market Share Comparison by (2016-2032)
- Figure 53: Western Europe Privileged Access Management Solutions Market Revenue (US$ Mn) Market Share by Componentin 2022
- Figure 54: Western Europe Privileged Access Management Solutions Market Attractiveness Analysis by Component, 2016-2032
- Figure 55: Western Europe Privileged Access Management Solutions Market Revenue (US$ Mn) Market Share by Deployment Modein 2022
- Figure 56: Western Europe Privileged Access Management Solutions Market Attractiveness Analysis by Deployment Mode, 2016-2032
- Figure 57: Western Europe Privileged Access Management Solutions Market Revenue (US$ Mn) Market Share by End-Use Industryin 2022
- Figure 58: Western Europe Privileged Access Management Solutions Market Attractiveness Analysis by End-Use Industry, 2016-2032
- Figure 59: Western Europe Privileged Access Management Solutions Market Revenue (US$ Mn) Market Share by in 2022
- Figure 60: Western Europe Privileged Access Management Solutions Market Attractiveness Analysis by , 2016-2032
- Figure 61: Western Europe Privileged Access Management Solutions Market Revenue (US$ Mn) Market Share by Country in 2022
- Figure 62: Western Europe Privileged Access Management Solutions Market Attractiveness Analysis by Country, 2016-2032
- Figure 63: Western Europe Privileged Access Management Solutions Market Revenue (US$ Mn) (2016-2032)
- Figure 64: Western Europe Privileged Access Management Solutions Market Revenue (US$ Mn) Comparison by Country (2016-2032)
- Figure 65: Western Europe Privileged Access Management Solutions Market Revenue (US$ Mn) Comparison by Component (2016-2032)
- Figure 66: Western Europe Privileged Access Management Solutions Market Revenue (US$ Mn) Comparison by Deployment Mode (2016-2032)
- Figure 67: Western Europe Privileged Access Management Solutions Market Revenue (US$ Mn) Comparison by End-Use Industry (2016-2032)
- Figure 68: Western Europe Privileged Access Management Solutions Market Revenue (US$ Mn) Comparison by (2016-2032)
- Figure 69: Western Europe Privileged Access Management Solutions Market Y-o-Y Growth Rate Comparison by Country (2016-2032)
- Figure 70: Western Europe Privileged Access Management Solutions Market Y-o-Y Growth Rate Comparison by Component (2016-2032)
- Figure 71: Western Europe Privileged Access Management Solutions Market Y-o-Y Growth Rate Comparison by Deployment Mode (2016-2032)
- Figure 72: Western Europe Privileged Access Management Solutions Market Y-o-Y Growth Rate Comparison by End-Use Industry (2016-2032)
- Figure 73: Western Europe Privileged Access Management Solutions Market Y-o-Y Growth Rate Comparison by (2016-2032)
- Figure 74: Western Europe Privileged Access Management Solutions Market Share Comparison by Country (2016-2032)
- Figure 75: Western Europe Privileged Access Management Solutions Market Share Comparison by Component (2016-2032)
- Figure 76: Western Europe Privileged Access Management Solutions Market Share Comparison by Deployment Mode (2016-2032)
- Figure 77: Western Europe Privileged Access Management Solutions Market Share Comparison by End-Use Industry (2016-2032)
- Figure 78: Western Europe Privileged Access Management Solutions Market Share Comparison by (2016-2032)
- Figure 79: Eastern Europe Privileged Access Management Solutions Market Revenue (US$ Mn) Market Share by Componentin 2022
- Figure 80: Eastern Europe Privileged Access Management Solutions Market Attractiveness Analysis by Component, 2016-2032
- Figure 81: Eastern Europe Privileged Access Management Solutions Market Revenue (US$ Mn) Market Share by Deployment Modein 2022
- Figure 82: Eastern Europe Privileged Access Management Solutions Market Attractiveness Analysis by Deployment Mode, 2016-2032
- Figure 83: Eastern Europe Privileged Access Management Solutions Market Revenue (US$ Mn) Market Share by End-Use Industryin 2022
- Figure 84: Eastern Europe Privileged Access Management Solutions Market Attractiveness Analysis by End-Use Industry, 2016-2032
- Figure 85: Eastern Europe Privileged Access Management Solutions Market Revenue (US$ Mn) Market Share by in 2022
- Figure 86: Eastern Europe Privileged Access Management Solutions Market Attractiveness Analysis by , 2016-2032
- Figure 87: Eastern Europe Privileged Access Management Solutions Market Revenue (US$ Mn) Market Share by Country in 2022
- Figure 88: Eastern Europe Privileged Access Management Solutions Market Attractiveness Analysis by Country, 2016-2032
- Figure 89: Eastern Europe Privileged Access Management Solutions Market Revenue (US$ Mn) (2016-2032)
- Figure 90: Eastern Europe Privileged Access Management Solutions Market Revenue (US$ Mn) Comparison by Country (2016-2032)
- Figure 91: Eastern Europe Privileged Access Management Solutions Market Revenue (US$ Mn) Comparison by Component (2016-2032)
- Figure 92: Eastern Europe Privileged Access Management Solutions Market Revenue (US$ Mn) Comparison by Deployment Mode (2016-2032)
- Figure 93: Eastern Europe Privileged Access Management Solutions Market Revenue (US$ Mn) Comparison by End-Use Industry (2016-2032)
- Figure 94: Eastern Europe Privileged Access Management Solutions Market Revenue (US$ Mn) Comparison by (2016-2032)
- Figure 95: Eastern Europe Privileged Access Management Solutions Market Y-o-Y Growth Rate Comparison by Country (2016-2032)
- Figure 96: Eastern Europe Privileged Access Management Solutions Market Y-o-Y Growth Rate Comparison by Component (2016-2032)
- Figure 97: Eastern Europe Privileged Access Management Solutions Market Y-o-Y Growth Rate Comparison by Deployment Mode (2016-2032)
- Figure 98: Eastern Europe Privileged Access Management Solutions Market Y-o-Y Growth Rate Comparison by End-Use Industry (2016-2032)
- Figure 99: Eastern Europe Privileged Access Management Solutions Market Y-o-Y Growth Rate Comparison by (2016-2032)
- Figure 100: Eastern Europe Privileged Access Management Solutions Market Share Comparison by Country (2016-2032)
- Figure 101: Eastern Europe Privileged Access Management Solutions Market Share Comparison by Component (2016-2032)
- Figure 102: Eastern Europe Privileged Access Management Solutions Market Share Comparison by Deployment Mode (2016-2032)
- Figure 103: Eastern Europe Privileged Access Management Solutions Market Share Comparison by End-Use Industry (2016-2032)
- Figure 104: Eastern Europe Privileged Access Management Solutions Market Share Comparison by (2016-2032)
- Figure 105: APAC Privileged Access Management Solutions Market Revenue (US$ Mn) Market Share by Componentin 2022
- Figure 106: APAC Privileged Access Management Solutions Market Attractiveness Analysis by Component, 2016-2032
- Figure 107: APAC Privileged Access Management Solutions Market Revenue (US$ Mn) Market Share by Deployment Modein 2022
- Figure 108: APAC Privileged Access Management Solutions Market Attractiveness Analysis by Deployment Mode, 2016-2032
- Figure 109: APAC Privileged Access Management Solutions Market Revenue (US$ Mn) Market Share by End-Use Industryin 2022
- Figure 110: APAC Privileged Access Management Solutions Market Attractiveness Analysis by End-Use Industry, 2016-2032
- Figure 111: APAC Privileged Access Management Solutions Market Revenue (US$ Mn) Market Share by in 2022
- Figure 112: APAC Privileged Access Management Solutions Market Attractiveness Analysis by , 2016-2032
- Figure 113: APAC Privileged Access Management Solutions Market Revenue (US$ Mn) Market Share by Country in 2022
- Figure 114: APAC Privileged Access Management Solutions Market Attractiveness Analysis by Country, 2016-2032
- Figure 115: APAC Privileged Access Management Solutions Market Revenue (US$ Mn) (2016-2032)
- Figure 116: APAC Privileged Access Management Solutions Market Revenue (US$ Mn) Comparison by Country (2016-2032)
- Figure 117: APAC Privileged Access Management Solutions Market Revenue (US$ Mn) Comparison by Component (2016-2032)
- Figure 118: APAC Privileged Access Management Solutions Market Revenue (US$ Mn) Comparison by Deployment Mode (2016-2032)
- Figure 119: APAC Privileged Access Management Solutions Market Revenue (US$ Mn) Comparison by End-Use Industry (2016-2032)
- Figure 120: APAC Privileged Access Management Solutions Market Revenue (US$ Mn) Comparison by (2016-2032)
- Figure 121: APAC Privileged Access Management Solutions Market Y-o-Y Growth Rate Comparison by Country (2016-2032)
- Figure 122: APAC Privileged Access Management Solutions Market Y-o-Y Growth Rate Comparison by Component (2016-2032)
- Figure 123: APAC Privileged Access Management Solutions Market Y-o-Y Growth Rate Comparison by Deployment Mode (2016-2032)
- Figure 124: APAC Privileged Access Management Solutions Market Y-o-Y Growth Rate Comparison by End-Use Industry (2016-2032)
- Figure 125: APAC Privileged Access Management Solutions Market Y-o-Y Growth Rate Comparison by (2016-2032)
- Figure 126: APAC Privileged Access Management Solutions Market Share Comparison by Country (2016-2032)
- Figure 127: APAC Privileged Access Management Solutions Market Share Comparison by Component (2016-2032)
- Figure 128: APAC Privileged Access Management Solutions Market Share Comparison by Deployment Mode (2016-2032)
- Figure 129: APAC Privileged Access Management Solutions Market Share Comparison by End-Use Industry (2016-2032)
- Figure 130: APAC Privileged Access Management Solutions Market Share Comparison by (2016-2032)
- Figure 131: Latin America Privileged Access Management Solutions Market Revenue (US$ Mn) Market Share by Componentin 2022
- Figure 132: Latin America Privileged Access Management Solutions Market Attractiveness Analysis by Component, 2016-2032
- Figure 133: Latin America Privileged Access Management Solutions Market Revenue (US$ Mn) Market Share by Deployment Modein 2022
- Figure 134: Latin America Privileged Access Management Solutions Market Attractiveness Analysis by Deployment Mode, 2016-2032
- Figure 135: Latin America Privileged Access Management Solutions Market Revenue (US$ Mn) Market Share by End-Use Industryin 2022
- Figure 136: Latin America Privileged Access Management Solutions Market Attractiveness Analysis by End-Use Industry, 2016-2032
- Figure 137: Latin America Privileged Access Management Solutions Market Revenue (US$ Mn) Market Share by in 2022
- Figure 138: Latin America Privileged Access Management Solutions Market Attractiveness Analysis by , 2016-2032
- Figure 139: Latin America Privileged Access Management Solutions Market Revenue (US$ Mn) Market Share by Country in 2022
- Figure 140: Latin America Privileged Access Management Solutions Market Attractiveness Analysis by Country, 2016-2032
- Figure 141: Latin America Privileged Access Management Solutions Market Revenue (US$ Mn) (2016-2032)
- Figure 142: Latin America Privileged Access Management Solutions Market Revenue (US$ Mn) Comparison by Country (2016-2032)
- Figure 143: Latin America Privileged Access Management Solutions Market Revenue (US$ Mn) Comparison by Component (2016-2032)
- Figure 144: Latin America Privileged Access Management Solutions Market Revenue (US$ Mn) Comparison by Deployment Mode (2016-2032)
- Figure 145: Latin America Privileged Access Management Solutions Market Revenue (US$ Mn) Comparison by End-Use Industry (2016-2032)
- Figure 146: Latin America Privileged Access Management Solutions Market Revenue (US$ Mn) Comparison by (2016-2032)
- Figure 147: Latin America Privileged Access Management Solutions Market Y-o-Y Growth Rate Comparison by Country (2016-2032)
- Figure 148: Latin America Privileged Access Management Solutions Market Y-o-Y Growth Rate Comparison by Component (2016-2032)
- Figure 149: Latin America Privileged Access Management Solutions Market Y-o-Y Growth Rate Comparison by Deployment Mode (2016-2032)
- Figure 150: Latin America Privileged Access Management Solutions Market Y-o-Y Growth Rate Comparison by End-Use Industry (2016-2032)
- Figure 151: Latin America Privileged Access Management Solutions Market Y-o-Y Growth Rate Comparison by (2016-2032)
- Figure 152: Latin America Privileged Access Management Solutions Market Share Comparison by Country (2016-2032)
- Figure 153: Latin America Privileged Access Management Solutions Market Share Comparison by Component (2016-2032)
- Figure 154: Latin America Privileged Access Management Solutions Market Share Comparison by Deployment Mode (2016-2032)
- Figure 155: Latin America Privileged Access Management Solutions Market Share Comparison by End-Use Industry (2016-2032)
- Figure 156: Latin America Privileged Access Management Solutions Market Share Comparison by (2016-2032)
- Figure 157: Middle East & Africa Privileged Access Management Solutions Market Revenue (US$ Mn) Market Share by Componentin 2022
- Figure 158: Middle East & Africa Privileged Access Management Solutions Market Attractiveness Analysis by Component, 2016-2032
- Figure 159: Middle East & Africa Privileged Access Management Solutions Market Revenue (US$ Mn) Market Share by Deployment Modein 2022
- Figure 160: Middle East & Africa Privileged Access Management Solutions Market Attractiveness Analysis by Deployment Mode, 2016-2032
- Figure 161: Middle East & Africa Privileged Access Management Solutions Market Revenue (US$ Mn) Market Share by End-Use Industryin 2022
- Figure 162: Middle East & Africa Privileged Access Management Solutions Market Attractiveness Analysis by End-Use Industry, 2016-2032
- Figure 163: Middle East & Africa Privileged Access Management Solutions Market Revenue (US$ Mn) Market Share by in 2022
- Figure 164: Middle East & Africa Privileged Access Management Solutions Market Attractiveness Analysis by , 2016-2032
- Figure 165: Middle East & Africa Privileged Access Management Solutions Market Revenue (US$ Mn) Market Share by Country in 2022
- Figure 166: Middle East & Africa Privileged Access Management Solutions Market Attractiveness Analysis by Country, 2016-2032
- Figure 167: Middle East & Africa Privileged Access Management Solutions Market Revenue (US$ Mn) (2016-2032)
- Figure 168: Middle East & Africa Privileged Access Management Solutions Market Revenue (US$ Mn) Comparison by Country (2016-2032)
- Figure 169: Middle East & Africa Privileged Access Management Solutions Market Revenue (US$ Mn) Comparison by Component (2016-2032)
- Figure 170: Middle East & Africa Privileged Access Management Solutions Market Revenue (US$ Mn) Comparison by Deployment Mode (2016-2032)
- Figure 171: Middle East & Africa Privileged Access Management Solutions Market Revenue (US$ Mn) Comparison by End-Use Industry (2016-2032)
- Figure 172: Middle East & Africa Privileged Access Management Solutions Market Revenue (US$ Mn) Comparison by (2016-2032)
- Figure 173: Middle East & Africa Privileged Access Management Solutions Market Y-o-Y Growth Rate Comparison by Country (2016-2032)
- Figure 174: Middle East & Africa Privileged Access Management Solutions Market Y-o-Y Growth Rate Comparison by Component (2016-2032)
- Figure 175: Middle East & Africa Privileged Access Management Solutions Market Y-o-Y Growth Rate Comparison by Deployment Mode (2016-2032)
- Figure 176: Middle East & Africa Privileged Access Management Solutions Market Y-o-Y Growth Rate Comparison by End-Use Industry (2016-2032)
- Figure 177: Middle East & Africa Privileged Access Management Solutions Market Y-o-Y Growth Rate Comparison by (2016-2032)
- Figure 178: Middle East & Africa Privileged Access Management Solutions Market Share Comparison by Country (2016-2032)
- Figure 179: Middle East & Africa Privileged Access Management Solutions Market Share Comparison by Component (2016-2032)
- Figure 180: Middle East & Africa Privileged Access Management Solutions Market Share Comparison by Deployment Mode (2016-2032)
- Figure 181: Middle East & Africa Privileged Access Management Solutions Market Share Comparison by End-Use Industry (2016-2032)
- Figure 182: Middle East & Africa Privileged Access Management Solutions Market Share Comparison by (2016-2032)
List of Tables
- Table 1: Global Privileged Access Management Solutions Market Comparison by Component (2016-2032)
- Table 2: Global Privileged Access Management Solutions Market Comparison by Deployment Mode (2016-2032)
- Table 3: Global Privileged Access Management Solutions Market Comparison by End-Use Industry (2016-2032)
- Table 4: Global Privileged Access Management Solutions Market Comparison by (2016-2032)
- Table 5: Global Privileged Access Management Solutions Market Revenue (US$ Mn) Comparison by Region (2016-2032)
- Table 6: Global Privileged Access Management Solutions Market Revenue (US$ Mn) (2016-2032)
- Table 7: Global Privileged Access Management Solutions Market Revenue (US$ Mn) Comparison by Region (2016-2032)
- Table 8: Global Privileged Access Management Solutions Market Revenue (US$ Mn) Comparison by Component (2016-2032)
- Table 9: Global Privileged Access Management Solutions Market Revenue (US$ Mn) Comparison by Deployment Mode (2016-2032)
- Table 10: Global Privileged Access Management Solutions Market Revenue (US$ Mn) Comparison by End-Use Industry (2016-2032)
- Table 11: Global Privileged Access Management Solutions Market Revenue (US$ Mn) Comparison by (2016-2032)
- Table 12: Global Privileged Access Management Solutions Market Y-o-Y Growth Rate Comparison by Region (2016-2032)
- Table 13: Global Privileged Access Management Solutions Market Y-o-Y Growth Rate Comparison by Component (2016-2032)
- Table 14: Global Privileged Access Management Solutions Market Y-o-Y Growth Rate Comparison by Deployment Mode (2016-2032)
- Table 15: Global Privileged Access Management Solutions Market Y-o-Y Growth Rate Comparison by End-Use Industry (2016-2032)
- Table 16: Global Privileged Access Management Solutions Market Y-o-Y Growth Rate Comparison by (2016-2032)
- Table 17: Global Privileged Access Management Solutions Market Share Comparison by Region (2016-2032)
- Table 18: Global Privileged Access Management Solutions Market Share Comparison by Component (2016-2032)
- Table 19: Global Privileged Access Management Solutions Market Share Comparison by Deployment Mode (2016-2032)
- Table 20: Global Privileged Access Management Solutions Market Share Comparison by End-Use Industry (2016-2032)
- Table 21: Global Privileged Access Management Solutions Market Share Comparison by (2016-2032)
- Table 22: North America Privileged Access Management Solutions Market Comparison by Deployment Mode (2016-2032)
- Table 23: North America Privileged Access Management Solutions Market Comparison by End-Use Industry (2016-2032)
- Table 24: North America Privileged Access Management Solutions Market Comparison by (2016-2032)
- Table 25: North America Privileged Access Management Solutions Market Revenue (US$ Mn) Comparison by Country (2016-2032)
- Table 26: North America Privileged Access Management Solutions Market Revenue (US$ Mn) (2016-2032)
- Table 27: North America Privileged Access Management Solutions Market Revenue (US$ Mn) Comparison by Country (2016-2032)
- Table 28: North America Privileged Access Management Solutions Market Revenue (US$ Mn) Comparison by Component (2016-2032)
- Table 29: North America Privileged Access Management Solutions Market Revenue (US$ Mn) Comparison by Deployment Mode (2016-2032)
- Table 30: North America Privileged Access Management Solutions Market Revenue (US$ Mn) Comparison by End-Use Industry (2016-2032)
- Table 31: North America Privileged Access Management Solutions Market Revenue (US$ Mn) Comparison by (2016-2032)
- Table 32: North America Privileged Access Management Solutions Market Y-o-Y Growth Rate Comparison by Country (2016-2032)
- Table 33: North America Privileged Access Management Solutions Market Y-o-Y Growth Rate Comparison by Component (2016-2032)
- Table 34: North America Privileged Access Management Solutions Market Y-o-Y Growth Rate Comparison by Deployment Mode (2016-2032)
- Table 35: North America Privileged Access Management Solutions Market Y-o-Y Growth Rate Comparison by End-Use Industry (2016-2032)
- Table 36: North America Privileged Access Management Solutions Market Y-o-Y Growth Rate Comparison by (2016-2032)
- Table 37: North America Privileged Access Management Solutions Market Share Comparison by Country (2016-2032)
- Table 38: North America Privileged Access Management Solutions Market Share Comparison by Component (2016-2032)
- Table 39: North America Privileged Access Management Solutions Market Share Comparison by Deployment Mode (2016-2032)
- Table 40: North America Privileged Access Management Solutions Market Share Comparison by End-Use Industry (2016-2032)
- Table 41: North America Privileged Access Management Solutions Market Share Comparison by (2016-2032)
- Table 42: Western Europe Privileged Access Management Solutions Market Comparison by Component (2016-2032)
- Table 43: Western Europe Privileged Access Management Solutions Market Comparison by Deployment Mode (2016-2032)
- Table 44: Western Europe Privileged Access Management Solutions Market Comparison by End-Use Industry (2016-2032)
- Table 45: Western Europe Privileged Access Management Solutions Market Comparison by (2016-2032)
- Table 46: Western Europe Privileged Access Management Solutions Market Revenue (US$ Mn) Comparison by Country (2016-2032)
- Table 47: Western Europe Privileged Access Management Solutions Market Revenue (US$ Mn) (2016-2032)
- Table 48: Western Europe Privileged Access Management Solutions Market Revenue (US$ Mn) Comparison by Country (2016-2032)
- Table 49: Western Europe Privileged Access Management Solutions Market Revenue (US$ Mn) Comparison by Component (2016-2032)
- Table 50: Western Europe Privileged Access Management Solutions Market Revenue (US$ Mn) Comparison by Deployment Mode (2016-2032)
- Table 51: Western Europe Privileged Access Management Solutions Market Revenue (US$ Mn) Comparison by End-Use Industry (2016-2032)
- Table 52: Western Europe Privileged Access Management Solutions Market Revenue (US$ Mn) Comparison by (2016-2032)
- Table 53: Western Europe Privileged Access Management Solutions Market Y-o-Y Growth Rate Comparison by Country (2016-2032)
- Table 54: Western Europe Privileged Access Management Solutions Market Y-o-Y Growth Rate Comparison by Component (2016-2032)
- Table 55: Western Europe Privileged Access Management Solutions Market Y-o-Y Growth Rate Comparison by Deployment Mode (2016-2032)
- Table 56: Western Europe Privileged Access Management Solutions Market Y-o-Y Growth Rate Comparison by End-Use Industry (2016-2032)
- Table 57: Western Europe Privileged Access Management Solutions Market Y-o-Y Growth Rate Comparison by (2016-2032)
- Table 58: Western Europe Privileged Access Management Solutions Market Share Comparison by Country (2016-2032)
- Table 59: Western Europe Privileged Access Management Solutions Market Share Comparison by Component (2016-2032)
- Table 60: Western Europe Privileged Access Management Solutions Market Share Comparison by Deployment Mode (2016-2032)
- Table 61: Western Europe Privileged Access Management Solutions Market Share Comparison by End-Use Industry (2016-2032)
- Table 62: Western Europe Privileged Access Management Solutions Market Share Comparison by (2016-2032)
- Table 63: Eastern Europe Privileged Access Management Solutions Market Comparison by Component (2016-2032)
- Table 64: Eastern Europe Privileged Access Management Solutions Market Comparison by Deployment Mode (2016-2032)
- Table 65: Eastern Europe Privileged Access Management Solutions Market Comparison by End-Use Industry (2016-2032)
- Table 66: Eastern Europe Privileged Access Management Solutions Market Comparison by (2016-2032)
- Table 67: Eastern Europe Privileged Access Management Solutions Market Revenue (US$ Mn) Comparison by Country (2016-2032)
- Table 68: Eastern Europe Privileged Access Management Solutions Market Revenue (US$ Mn) (2016-2032)
- Table 69: Eastern Europe Privileged Access Management Solutions Market Revenue (US$ Mn) Comparison by Country (2016-2032)
- Table 70: Eastern Europe Privileged Access Management Solutions Market Revenue (US$ Mn) Comparison by Component (2016-2032)
- Table 71: Eastern Europe Privileged Access Management Solutions Market Revenue (US$ Mn) Comparison by Deployment Mode (2016-2032)
- Table 72: Eastern Europe Privileged Access Management Solutions Market Revenue (US$ Mn) Comparison by End-Use Industry (2016-2032)
- Table 73: Eastern Europe Privileged Access Management Solutions Market Revenue (US$ Mn) Comparison by (2016-2032)
- Table 74: Eastern Europe Privileged Access Management Solutions Market Y-o-Y Growth Rate Comparison by Country (2016-2032)
- Table 75: Eastern Europe Privileged Access Management Solutions Market Y-o-Y Growth Rate Comparison by Component (2016-2032)
- Table 76: Eastern Europe Privileged Access Management Solutions Market Y-o-Y Growth Rate Comparison by Deployment Mode (2016-2032)
- Table 77: Eastern Europe Privileged Access Management Solutions Market Y-o-Y Growth Rate Comparison by End-Use Industry (2016-2032)
- Table 78: Eastern Europe Privileged Access Management Solutions Market Y-o-Y Growth Rate Comparison by (2016-2032)
- Table 79: Eastern Europe Privileged Access Management Solutions Market Share Comparison by Country (2016-2032)
- Table 80: Eastern Europe Privileged Access Management Solutions Market Share Comparison by Component (2016-2032)
- Table 81: Eastern Europe Privileged Access Management Solutions Market Share Comparison by Deployment Mode (2016-2032)
- Table 82: Eastern Europe Privileged Access Management Solutions Market Share Comparison by End-Use Industry (2016-2032)
- Table 83: Eastern Europe Privileged Access Management Solutions Market Share Comparison by (2016-2032)
- Table 84: APAC Privileged Access Management Solutions Market Comparison by Component (2016-2032)
- Table 85: APAC Privileged Access Management Solutions Market Comparison by Deployment Mode (2016-2032)
- Table 86: APAC Privileged Access Management Solutions Market Comparison by End-Use Industry (2016-2032)
- Table 87: APAC Privileged Access Management Solutions Market Comparison by (2016-2032)
- Table 88: APAC Privileged Access Management Solutions Market Revenue (US$ Mn) Comparison by Country (2016-2032)
- Table 89: APAC Privileged Access Management Solutions Market Revenue (US$ Mn) (2016-2032)
- Table 90: APAC Privileged Access Management Solutions Market Revenue (US$ Mn) Comparison by Country (2016-2032)
- Table 91: APAC Privileged Access Management Solutions Market Revenue (US$ Mn) Comparison by Component (2016-2032)
- Table 92: APAC Privileged Access Management Solutions Market Revenue (US$ Mn) Comparison by Deployment Mode (2016-2032)
- Table 93: APAC Privileged Access Management Solutions Market Revenue (US$ Mn) Comparison by End-Use Industry (2016-2032)
- Table 94: APAC Privileged Access Management Solutions Market Revenue (US$ Mn) Comparison by (2016-2032)
- Table 95: APAC Privileged Access Management Solutions Market Y-o-Y Growth Rate Comparison by Country (2016-2032)
- Table 96: APAC Privileged Access Management Solutions Market Y-o-Y Growth Rate Comparison by Component (2016-2032)
- Table 97: APAC Privileged Access Management Solutions Market Y-o-Y Growth Rate Comparison by Deployment Mode (2016-2032)
- Table 98: APAC Privileged Access Management Solutions Market Y-o-Y Growth Rate Comparison by End-Use Industry (2016-2032)
- Table 99: APAC Privileged Access Management Solutions Market Y-o-Y Growth Rate Comparison by (2016-2032)
- Table 100: APAC Privileged Access Management Solutions Market Share Comparison by Country (2016-2032)
- Table 101: APAC Privileged Access Management Solutions Market Share Comparison by Component (2016-2032)
- Table 102: APAC Privileged Access Management Solutions Market Share Comparison by Deployment Mode (2016-2032)
- Table 103: APAC Privileged Access Management Solutions Market Share Comparison by End-Use Industry (2016-2032)
- Table 104: APAC Privileged Access Management Solutions Market Share Comparison by (2016-2032)
- Table 105: Latin America Privileged Access Management Solutions Market Comparison by Component (2016-2032)
- Table 106: Latin America Privileged Access Management Solutions Market Comparison by Deployment Mode (2016-2032)
- Table 107: Latin America Privileged Access Management Solutions Market Comparison by End-Use Industry (2016-2032)
- Table 108: Latin America Privileged Access Management Solutions Market Comparison by (2016-2032)
- Table 109: Latin America Privileged Access Management Solutions Market Revenue (US$ Mn) Comparison by Country (2016-2032)
- Table 110: Latin America Privileged Access Management Solutions Market Revenue (US$ Mn) (2016-2032)
- Table 111: Latin America Privileged Access Management Solutions Market Revenue (US$ Mn) Comparison by Country (2016-2032)
- Table 112: Latin America Privileged Access Management Solutions Market Revenue (US$ Mn) Comparison by Component (2016-2032)
- Table 113: Latin America Privileged Access Management Solutions Market Revenue (US$ Mn) Comparison by Deployment Mode (2016-2032)
- Table 114: Latin America Privileged Access Management Solutions Market Revenue (US$ Mn) Comparison by End-Use Industry (2016-2032)
- Table 115: Latin America Privileged Access Management Solutions Market Revenue (US$ Mn) Comparison by (2016-2032)
- Table 116: Latin America Privileged Access Management Solutions Market Y-o-Y Growth Rate Comparison by Country (2016-2032)
- Table 117: Latin America Privileged Access Management Solutions Market Y-o-Y Growth Rate Comparison by Component (2016-2032)
- Table 118: Latin America Privileged Access Management Solutions Market Y-o-Y Growth Rate Comparison by Deployment Mode (2016-2032)
- Table 119: Latin America Privileged Access Management Solutions Market Y-o-Y Growth Rate Comparison by End-Use Industry (2016-2032)
- Table 120: Latin America Privileged Access Management Solutions Market Y-o-Y Growth Rate Comparison by (2016-2032)
- Table 121: Latin America Privileged Access Management Solutions Market Share Comparison by Country (2016-2032)
- Table 122: Latin America Privileged Access Management Solutions Market Share Comparison by Component (2016-2032)
- Table 123: Latin America Privileged Access Management Solutions Market Share Comparison by Deployment Mode (2016-2032)
- Table 124: Latin America Privileged Access Management Solutions Market Share Comparison by End-Use Industry (2016-2032)
- Table 125: Latin America Privileged Access Management Solutions Market Share Comparison by (2016-2032)
- Table 126: Middle East & Africa Privileged Access Management Solutions Market Comparison by Component (2016-2032)
- Table 127: Middle East & Africa Privileged Access Management Solutions Market Comparison by Deployment Mode (2016-2032)
- Table 128: Middle East & Africa Privileged Access Management Solutions Market Comparison by End-Use Industry (2016-2032)
- Table 129: Middle East & Africa Privileged Access Management Solutions Market Comparison by (2016-2032)
- Table 130: Middle East & Africa Privileged Access Management Solutions Market Revenue (US$ Mn) Comparison by Country (2016-2032)
- Table 131: Middle East & Africa Privileged Access Management Solutions Market Revenue (US$ Mn) (2016-2032)
- Table 132: Middle East & Africa Privileged Access Management Solutions Market Revenue (US$ Mn) Comparison by Country (2016-2032)
- Table 133: Middle East & Africa Privileged Access Management Solutions Market Revenue (US$ Mn) Comparison by Component (2016-2032)
- Table 134: Middle East & Africa Privileged Access Management Solutions Market Revenue (US$ Mn) Comparison by Deployment Mode (2016-2032)
- Table 135: Middle East & Africa Privileged Access Management Solutions Market Revenue (US$ Mn) Comparison by End-Use Industry (2016-2032)
- Table 136: Middle East & Africa Privileged Access Management Solutions Market Revenue (US$ Mn) Comparison by (2016-2032)
- Table 137: Middle East & Africa Privileged Access Management Solutions Market Y-o-Y Growth Rate Comparison by Country (2016-2032)
- Table 138: Middle East & Africa Privileged Access Management Solutions Market Y-o-Y Growth Rate Comparison by Component (2016-2032)
- Table 139: Middle East & Africa Privileged Access Management Solutions Market Y-o-Y Growth Rate Comparison by Deployment Mode (2016-2032)
- Table 140: Middle East & Africa Privileged Access Management Solutions Market Y-o-Y Growth Rate Comparison by End-Use Industry (2016-2032)
- Table 141: Middle East & Africa Privileged Access Management Solutions Market Y-o-Y Growth Rate Comparison by (2016-2032)
- Table 142: Middle East & Africa Privileged Access Management Solutions Market Share Comparison by Country (2016-2032)
- Table 143: Middle East & Africa Privileged Access Management Solutions Market Share Comparison by Component (2016-2032)
- Table 144: Middle East & Africa Privileged Access Management Solutions Market Share Comparison by Deployment Mode (2016-2032)
- Table 145: Middle East & Africa Privileged Access Management Solutions Market Share Comparison by End-Use Industry (2016-2032)
- Table 146: Middle East & Africa Privileged Access Management Solutions Market Share Comparison by (2016-2032)
- 1. Executive Summary
-
- BeyondTrust Corporation.
- Centrify Corporation.
- CyberArk Software Ltd.
- SecureAuth Corporation.
- One Identity LLC
- Zoho Corporation Pvt Ltd.
- Ekran System
- Simeio Solutions
Our Clients


View Our Licence Options
