
Pre Insulated Pipes Market By Material Type(Polymers, Metal & Alloys), By Pipe Configuration(Twin Pipe, Single Pipe), By Installation(Below Ground, Above Ground), By End User(District Heating and Cooling, Oil & Gas, Chemical, Pharmaceutical, Others), By Region And Companies - Industry Segment Outlook, Market Assessment, Competition Scenario, Trends, And Forecast 2024-2033
-
12656
-
April 2024
-
155
-


-
This report was compiled by Research Team Research team of over 50 passionate professionals leverages advanced research methodologies and analytical expertise to deliver insightful, data-driven market intelligence that empowers businesses across diverse industries to make strategic, well-informed Correspondence Research Team Linkedin | Detailed Market research Methodology Our methodology involves a mix of primary research, including interviews with leading mental health experts, and secondary research from reputable medical journals and databases. View Detailed Methodology Page
-
Quick Navigation
Report Overview
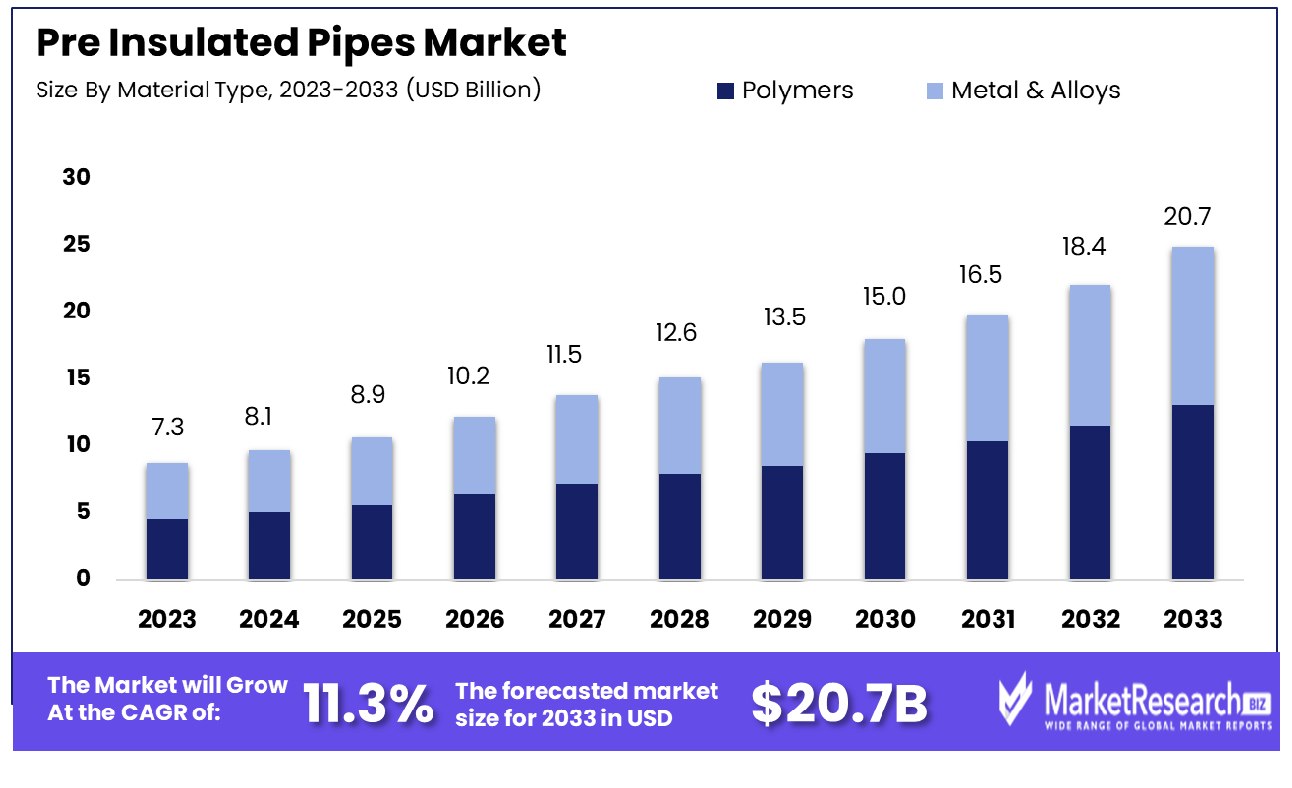
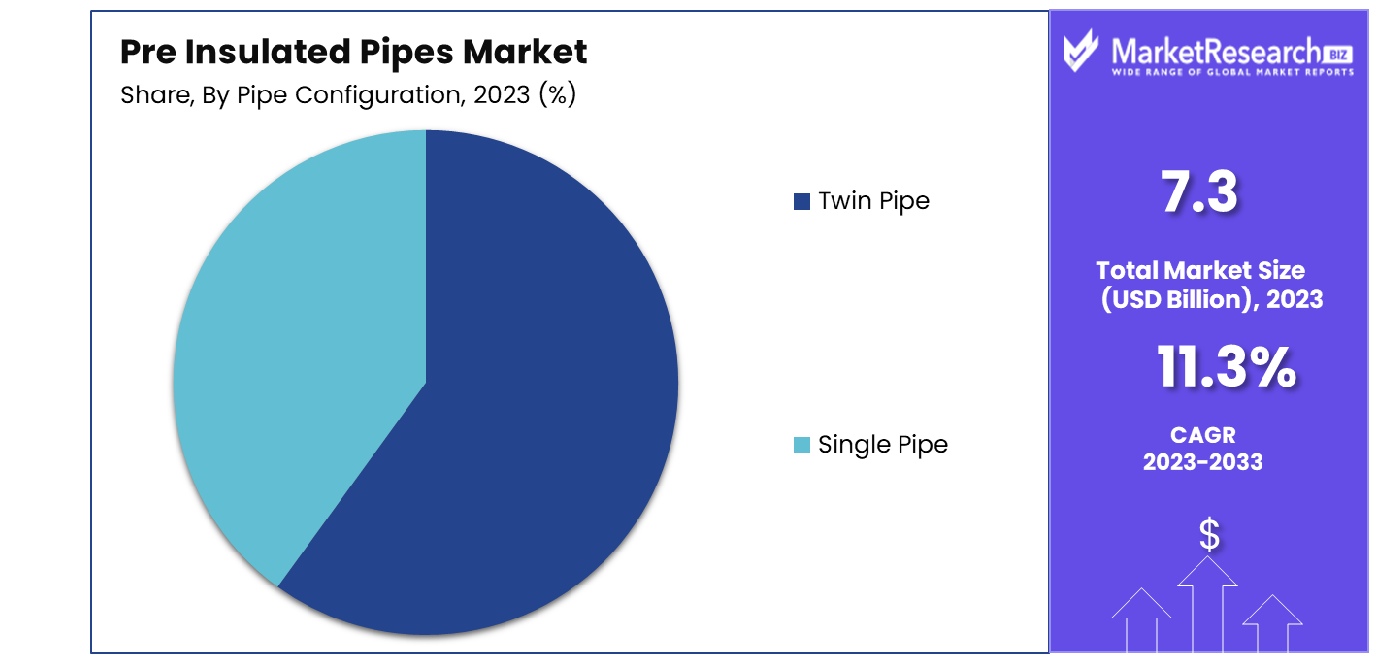
The Global Pre Insulated Pipes Market was valued at USD 7.3 billion in 2023. It is expected to reach USD 20.7 billion by 2033, with a CAGR of 11.3% during the forecast period from 2024 to 2033. The surge in demand for new advanced technologies and rise in end-use industries, and high investment in research & development are some of the main key driving factors for the pre-insulated pipes.
The pre-insulated pipes are defined as advanced piping systems that are designed for transporting liquids while decreasing heat loss or gain. Such pipes feature a layer of insulation enclosed in the inner pipes, generally made of material like polyurethane foam or mineral wool which helps in maintaining the temperature of the fluid being conveyed. These are commonly used in different industries that consist of district heating and cooling systems, hot water distribution, and industrial methods where maintaining constant temperature is important.
The insulation layer offers heat efficiency, decreasing energy consumption and operational expenses. These pipes are designed for longevity and reliability with outer casings made of materials such as high-density polyethylene and steel to safeguard the insulation and inner pipes from external factors like moisture, mechanical damage, and corrosion. The pre-insulated pipes provide an easy and effective solution for transporting fluids at controlled temperatures by maintaining constant performance and preserving energy in different applications.
According to Plasteurope in October 2022, highlights that insulating materials supplier Armacell purchased Austroflex, a manufacturer of pre-insulated pipes systems, heat solar pipes, and technical insulating materials. After the acquisition, Armacell is widening its geographical presence and business activities in Europe. The portfolio consists of flexible pipes with HDPE jacket pipes, polyurethane insulations, polyethylene foam (XPE), mineral wool, and rubber goods. At its headquarters site, the company has a production area of 55,000 m² and employs more than 80. Armacell’s business covers the divisions of advanced insulation and engineered foams, 27 production sites, 3,200 employees, and representation in 19 countries.
Last year, the company reported sales of EUR 677 MN and an EBITDA of EUR 117 MN. Pre-insulated pipes provide great advantages like decreasing thermal loss or gain, and maintaining fluid temperature integration. They lessen energy consumption by leading to saving expenses. Such pipes also need less space and labor for installations, they also offer improved sturdy against external factors and make effective fluid transportation in different industrial and commercial applications. The demand for the pre-instruction pipes will increase due to their requirement in the different construction sites that will help in market expansion in the coming years.
Key Takeaways
- Market Growth: The Global Pre Insulated Pipes Market was valued at USD 7.3 billion in 2023. It is expected to reach USD 20.7 billion by 2033, with a CAGR of 11.3% during the forecast period from 2024 to 2033.
- By Material Type: Polymers dominate due to durability, flexibility, and corrosion resistance.
By Pipe Configuration: Twin pipe configuration enhances system reliability and efficiency significantly.
By Installation: Below-ground installation ensures minimal visual impact and environmental disruption.
By End User: District heating and cooling end-users benefit from cost-effective, sustainable solutions. - Regional Dominance: In Europe, the pre-insulated pipes market holds a substantial 36.2% share.
- Growth Opportunity: The global pre-insulated pipes market in 2023 presents opportunities driven by infrastructure development in emerging economies, the adoption of energy-efficient solutions in construction, and expansion into industrial applications like oil and gas pipelines.
Driving factors
Government Regulations Driving Demand for Pre-Insulated Pipes
Stringent government regulations aimed at reducing carbon footprint and promoting energy-efficient buildings have become pivotal drivers of the Pre-Insulated Pipes Market. As governments worldwide intensify their efforts to combat climate change, regulations mandating the use of energy-efficient materials in construction projects have surged. Pre-insulated pipes, renowned for their thermal stability and ability to minimize heat loss, align seamlessly with these regulatory mandates.
For instance, in Europe, initiatives such as the Energy Performance of Buildings Directive (EPBD) emphasize the importance of energy-efficient heating systems, propelling the adoption of pre-insulated pipes. According to recent statistics, the European pre-insulated pipes market is projected to witness robust growth, with a compound annual growth rate (CAGR) exceeding 6% over the forecast period.
Attractive Properties Fueling Market Growth
The Pre-Insulated Pipes Market is experiencing a significant upsurge due to the attractive properties of pre-insulated pipes, including thermal stability and cost-saving nature. End-users across various industries, such as oil and gas, chemicals, and pharmaceuticals, are increasingly recognizing the value proposition offered by pre-insulated pipes.
These pipes not only ensure efficient energy transfer but also mitigate heat loss, thereby reducing operational costs. Moreover, the versatility of pre-insulated pipes makes them suitable for a wide range of applications, further driving their adoption. With cost-saving becoming a paramount consideration for industries worldwide, pre-insulated pipes have emerged as a preferred solution, fostering market growth.
Rising Demand Across End-User Industries
The burgeoning demand for energy-efficient solutions in end-user industries like the oil and gas sector, chemicals, and pharmaceuticals is fueling the growth of the Pre-Insulated Pipes Market. With industries facing pressure to enhance operational efficiency while minimizing environmental impact, the adoption of pre-insulated pipes has surged.
These pipes not only facilitate efficient energy transfer but also contribute to the reduction of greenhouse gas emissions, aligning with sustainability goals. As a result, the demand for pre-insulated pipes is expected to witness steady growth across diverse end-user industries, propelling market expansion.
Restraining Factors
Impact of High Installation Costs on Pre-Insulated Pipes Market Growth
High installation costs represent a significant restraining factor for the Pre-Insulated Pipes Market. While pre-insulated pipes offer long-term cost savings through improved energy efficiency and reduced maintenance requirements, the initial investment for installation can be substantial. The high upfront costs deter some potential customers, particularly in cost-sensitive sectors such as construction and infrastructure development.
Moreover, the complex installation process of pre-insulated pipes, which often involves specialized equipment and expertise, further contributes to the overall installation expenses. Despite the long-term benefits, the perceived financial burden of installation remains a key barrier to market expansion. As per industry analysis, the installation costs associated with pre-insulated pipes can be up to 30% higher compared to conventional piping systems, deterring widespread adoption.
Limited Availability of Skilled Labor Hindering Market Growth
The limited availability of skilled labor for the installation of pre-insulated pipes poses a significant challenge to market growth. The specialized nature of pre-insulated pipe installation requires technicians with specific expertise and training, including knowledge of insulation techniques, welding, and pipe fitting. However, the shortage of skilled labor in the construction and engineering sectors has led to bottlenecks in the adoption of pre-insulated piping systems.
Furthermore, the intricate nature of pre-insulated pipe installation demands precision and attention to detail, exacerbating the shortage of qualified professionals. Consequently, project delays and cost overruns often occur due to the scarcity of skilled labor, impeding the widespread implementation of pre-insulated pipes. Addressing this challenge necessitates investments in vocational training programs and initiatives to attract talent to the construction industry.
By Material Type Analysis
Pre-insulated pipes made from polymers offer durability, flexibility, and resistance to corrosion and chemical degradation.
In 2023, polymers held a dominant market position in the "By Material Type" segment of the pre-insulated pipes market. Polymers, owing to their versatility and cost-effectiveness, emerged as the material of choice for various applications within the pre-insulated pipes industry. This dominance can be attributed to several factors, including the growing demand for lightweight and durable piping solutions across diverse end-user industries such as construction, HVAC (heating, ventilation, and air conditioning), and district heating.
Polymers offer numerous advantages over traditional materials like metals and alloys. Firstly, their innate flexibility allows for easier installation, reducing both time and labor costs associated with piping systems. Additionally, polymers exhibit excellent corrosion resistance, ensuring longevity and minimal maintenance requirements compared to metal-based alternatives. Moreover, advancements in polymer technology have led to the development of high-performance materials capable of withstanding extreme temperatures and pressures, further enhancing their suitability for demanding applications.
Despite the dominance of polymers, the market for metal and alloys in pre-insulated pipes remains significant, particularly in applications requiring higher mechanical strength or elevated operating temperatures. Metals and alloys are favored in industrial sectors settings where durability and resistance to harsh conditions are paramount.
By Pipe Configuration Analysis
Twin pipe configuration allows for simultaneous transportation of hot and cold water in district heating systems.
In 2023, Twin Pipe emerged as the dominant player in the "By Pipe Configuration" segment of the pre-insulated pipes market. Twin Pipe configurations gained prominence due to their superior thermal efficiency and versatility across various applications. This dominance can be attributed to several key factors, including the ability of Twin Pipe systems to provide separate conduits for hot and cold fluids, minimizing heat loss and enhancing energy efficiency in heating, cooling, and district heating applications.
Twin Pipe systems offer distinct advantages over Single Pipe configurations. By maintaining separate channels for hot and cold fluids, Twin Pipe configurations effectively prevent thermal bridging, ensuring consistent temperature control and reducing energy consumption. This characteristic makes them particularly suitable for applications where precise temperature regulation and energy conservation are critical, such as in commercial buildings, residential complexes, and industrial facilities.
Despite the dominance of Twin Pipe systems, Single Pipe configurations continue to play a significant role in the pre-insulated pipes market. Single-pipe systems offer simplicity and cost-effectiveness, making them suitable for smaller-scale projects or applications with less stringent temperature control requirements.
By Installation Analysis
Below-ground installation minimizes visual impact and protects pre-insulated pipes from external damage or environmental factors.
In 2023, Below Ground installations asserted a dominant position in the "By Installation" segment of the pre-insulated pipes market. This supremacy underscores the preference for Below Ground installations in various applications, driven by major factors such as enhanced durability, space optimization, and environmental considerations. Ground installations are favored for their ability to safeguard piping systems from external elements, ensuring longevity and reliability, particularly in underground utilities, district heating networks, and geothermal systems.
The dominance of Below Ground installations can be attributed to their inherent advantages over Above Ground alternatives. Underground placement provides protection against weather-related damage, vandalism, and accidental impacts, reducing the risk of disruptions and maintenance costs associated with above-ground installations. Additionally, Below Ground configurations offer space-saving benefits, allowing for efficient land use and aesthetic integration within urban landscapes.
Despite the prevalence of below-ground installations, above-ground options remain relevant in certain scenarios. Above-ground installations offer greater accessibility for inspection, maintenance, and repairs, making them suitable for applications where frequent access to piping systems is necessary or where underground installation is impractical due to site constraints or environmental considerations.
By End User Analysis
District heating and cooling systems in urban areas are major users of pre-insulated pipes for energy distribution.
In 2023, District Heating and Cooling emerged as the dominant player in the "By End User" segment of the pre-insulated pipes market. This dominance underscores the widespread adoption of pre-insulated piping solutions in district heating and cooling systems, driven by the increasing focus on energy efficiency, urbanization, and sustainable infrastructure development. District Heating and Cooling applications encompass a wide range of residential, commercial, and industrial projects, including urban district heating networks, residential complexes, hospitals, educational institutions, and industrial parks.
The dominance of District Heating and Cooling in the pre-insulated pipes market can be attributed to several growth factors. Firstly, district heating and cooling systems offer energy-efficient solutions for large-scale heating and cooling requirements, leveraging centralized heat generation and distribution networks to optimize energy usage and reduce carbon emissions. Additionally, the growing emphasis on decarbonization and climate change mitigation has spurred investments in district energy infrastructure, driving demand for pre-insulated pipes in these applications.
Despite the dominance of District Heating and Cooling, other end-user segments such as Oil & Gas, Chemical, Pharmaceutical, and Others remain significant contributors to the pre-insulated pipes market. These industries utilize pre-insulated piping solutions for various applications, including process heating, chemical transport, pharmaceutical manufacturing, and specialized industrial processes. However, the prevalence of District Heating and Cooling reflects the increasing prioritization of sustainable heating and cooling solutions in both urban and rural areas, driving the demand for pre-insulated pipes in these applications.
Key Market Segments
By Material Type
- Polymers
- Metal & Alloys
By Pipe Configuration
- Twin Pipe
- Single Pipe
By Installation
- Below Ground
- Above Ground
By End User
- District Heating and Cooling
- Oil & Gas
- Chemical
- Pharmaceutical
- Others
Growth Opportunity
Infrastructure Development Projects in Emerging Economies
The year 2023 presents significant opportunities for the global pre-insulated pipes market, particularly driven by infrastructure development projects in emerging economies. With rapid urbanization and industrialization underway in regions such as Asia-Pacific, Africa, and Latin America, there is a growing demand for efficient and sustainable infrastructure solutions.
Pre-insulated pipes offer advantages in terms of energy efficiency, durability, and ease of installation, making them ideal for applications in water supply networks, district heating systems, and urban development projects. Market major players can capitalize on this trend by expanding their presence in emerging markets and forging strategic partnerships with local stakeholders to leverage growth opportunities.
Adoption of Energy-Efficient Solutions in Building Construction
Another key opportunity in 2023 for the global pre-insulated pipes market lies in the increasing adoption of energy-efficient solutions in building construction. With rising awareness of environmental sustainability and energy conservation, there is a growing demand for green building technologies that reduce energy consumption and carbon emissions.
Pre-insulated pipes play a crucial role in enhancing the energy efficiency of heating, ventilation, and air conditioning (HVAC) systems, as well as in providing reliable thermal insulation for plumbing and hydronic heating applications. Market players can leverage this trend by offering innovative pre-insulated pipe solutions tailored to the needs of the construction industry and positioning themselves as leaders in sustainable building infrastructure.
Expansion into Industrial Applications such as Oil and Gas Pipelines
Furthermore, the expansion into industrial applications such as oil and gas pipelines presents significant opportunities for the global pre-insulated pipes market in 2023. With the growing demand for energy resources and the increasing focus on pipeline safety and efficiency, there is a rising need for advanced piping solutions that can withstand harsh operating conditions and minimize heat loss during transport.
Pre-insulated pipes offer advantages such as corrosion resistance, thermal stability, and ease of installation, making them well-suited for use in oil and gas pipelines, chemical processing plants, and industrial facilities. Market players can capitalize on this opportunity by developing specialized pre-insulated pipe solutions tailored to the requirements of industrial applications and establishing partnerships with key players in the energy sector to penetrate new markets and drive revenue growth.
Latest Trends
Increasing Infrastructure Development Projects Driving Demand
In 2023, the global pre-insulated pipes market is witnessing a surge in demand fueled by increasing infrastructure development projects, particularly in the construction and HVAC sectors. The growing need for efficient and sustainable building solutions in both residential and commercial construction projects is propelling the adoption of pre-insulated pipes.
These pipes offer advantages such as enhanced thermal efficiency, reduced heat loss, and simplified installation processes, making them a preferred choice for heating, ventilation, and air conditioning systems. Market players are strategically positioning themselves to capitalize on this trend by expanding their product portfolios and targeting key projects in emerging and established markets.
Emphasis on Energy Efficiency and Environmental Sustainability
Another significant trend shaping the global pre-insulated pipes market in 2023 is the increasing emphasis on energy efficiency and environmental sustainability. With rising awareness of climate change and the need to reduce carbon emissions, there is a growing demand for green building technologies that minimize energy consumption and promote environmental stewardship.
Pre-insulated pipes play a crucial role in meeting these objectives by providing efficient thermal insulation for heating and cooling systems, thereby reducing energy wastage and lowering carbon footprints. Market players are responding to this trend by developing innovative pre-insulated pipe solutions with enhanced insulation properties and eco-friendly materials. Additionally, strategic partnerships and collaborations with sustainability-focused organizations are being leveraged to drive market growth and differentiation.
Regional Analysis
In Europe, pre-insulated pipes hold a market share of 36.2%, reflecting significant demand and adoption.
The pre-insulated pipes market exhibits varied dynamics across different regions, including North America, Europe, Asia Pacific, the Middle East &; Africa, and Latin America.
In Europe, the market holds a dominant position, capturing a significant share of 36.2%. This dominance can be attributed to stringent regulations promoting energy efficiency and sustainability, coupled with extensive infrastructure development initiatives across the region. Furthermore, the presence of established players and technological advancements in pre-insulated pipe solutions contribute to Europe's leading position in the market.
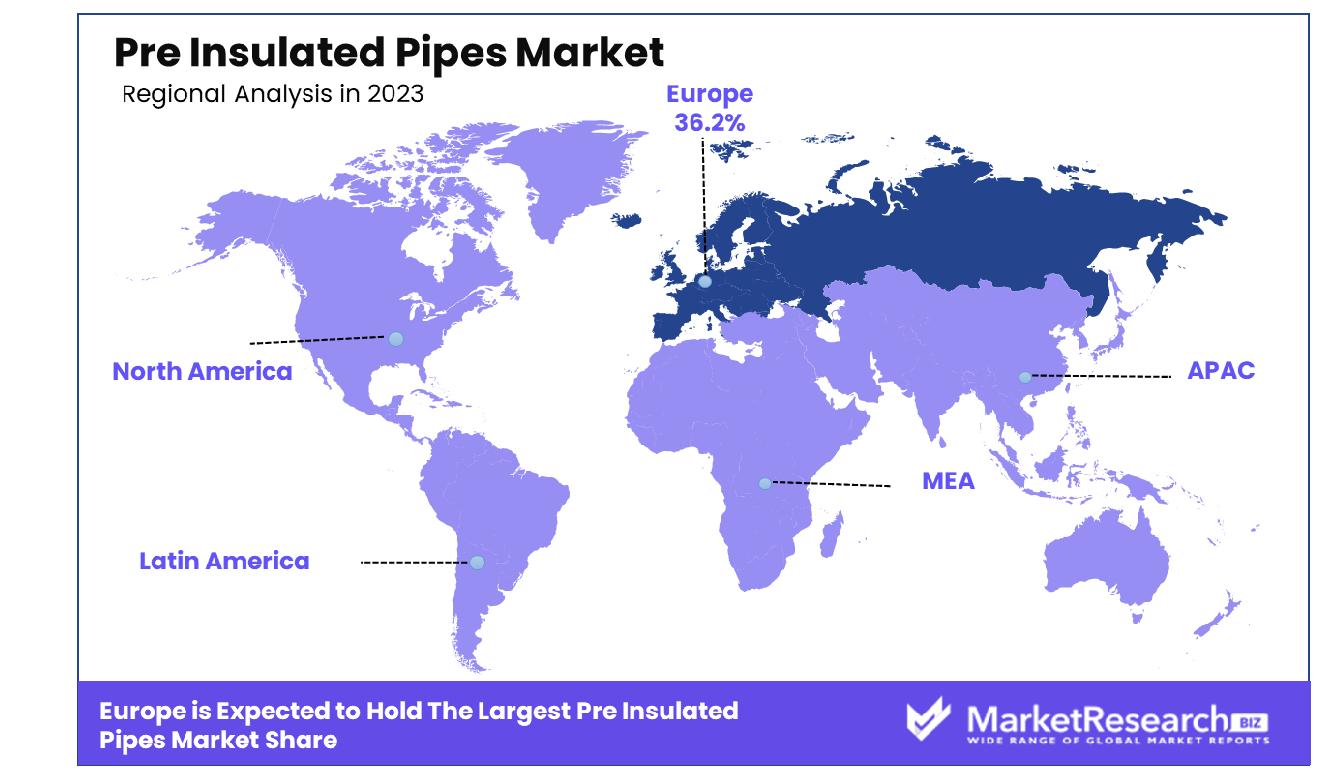
North America follows closely, driven by robust construction activities and increasing adoption of energy-efficient building solutions. The region benefits from a mature construction industry and growing investments in renewable energy projects, which bolster the demand for pre-insulated pipes. Additionally, government incentives aimed at promoting green building practices further propel market growth in North America.
Asia Pacific emerges as a rapidly growing market, fueled by urbanization, industrialization, and investments in infrastructure development. Countries such as China, India, and Southeast Asian nations witness significant demand for pre-insulated pipes, driven by the need for modernizing urban infrastructure and enhancing energy efficiency in buildings.
Middle East & Africa exhibit promising growth opportunities, supported by investments in oil and gas infrastructure, district cooling projects, and urban development initiatives. The region's harsh climatic conditions necessitate reliable and efficient piping solutions, driving the adoption of pre-insulated pipes.
Latin America presents a burgeoning market driven by urbanization, industrial growth, and increasing focus on sustainable construction practices. Government initiatives promoting infrastructure development and energy efficiency further stimulate market growth in the region.
Key Regions and Countries
North America
- The US
- Canada
- Rest of North America
Europe
- Germany
- France
- The UK
- Spain
- Netherlands
- Russia
- Italy
- Rest of Europe
Asia-Pacific
- China
- Japan
- Singapore
- Thailand
- South Korea
- Vietnam
- India
- New Zealand
- Rest of Asia Pacific
Latin America
- Mexico
- Brazil
- Rest of Latin America
Middle East & Africa
- Saudi Arabia
- South Africa
- UAE
- Rest of Middle East & Africa
Key Players Analysis
In 2023, the global pre-insulated pipes market sees notable contributions from key players such as Georg Fischer AG, Uponor Corporation, Watts Water Technologies, LOGSTOR A/S, Brugg Group Ag, Polypipe Group PLC, Vital Energi Utilities Limited, Perma-Pipe International Holdings Inc., Elips - Empower Logstor, KE KELIT, Thermaflex International Holding b.v., Ecoline S.R.L., Aquatherm GmbH, CPV LTD, Insul-Pipe Systems, Thermal Pipe Systems, Inc., IPL Pre-Insulated Pipes, Unifix Plast Pvt. Ltd., and ZECO Aircon Ltd.
These key players play a pivotal role in driving innovation, meeting customer demands, and shaping market trends in the pre-insulated pipes industry. With diverse product portfolios, extensive distribution networks, and a strong focus on research and development, these companies are well-positioned to capitalize on growth opportunities in various regions and sectors.
In particular, key companies like Georg Fischer AG and Uponor Corporation stand out for their longstanding reputation, technological expertise, and commitment to sustainability. Their innovative solutions and strategic partnerships enable them to address the evolving needs of customers while maintaining a competitive edge in the market.
Moreover, emerging players such as Elips-Empower Logstor and Aquatherm GmbH are making significant strides in the market with their innovative product offerings and strategic expansion initiatives. These companies bring fresh perspectives and unique capabilities to the market, further enriching the competitive landscape and driving market growth.
Market Key Players
- Georg Fischer AG
- Uponor Corporation
- Watts Water Technologies
- LOGSTOR A/S
- Brugg Group Ag
- Polypipe Group PLC
- Vital Energi Utilities Limited
- Perma-Pipe International Holdings Inc.
- Elips - Empower Logstor
- KE KELIT
- Thermaflex International Holding b.v.
- Ecoline S.R.L.
- Aquatherm GmbH
- CPV LTD
- Insul-Pipe Systems
- Thermal Pipe Systems, Inc.
- IPL Pre-Insulated Pipes
- Unifix Plast Pvt. Ltd.
- ZECO Aircon Ltd.
Recent Development
- In October 2023, GF Piping Systems emphasized the sustainability benefits of plastic piping in battery cell production, highlighting energy and CO2 savings. Their COOL-FIT pre-insulated pipes offer efficient cooling solutions, contributing to energy efficiency.
- In September 2023, The Thermal Insulation Contractors Association (TICA) called for a review of the pre-insulated pipe and duct market due to concerns over fire safety claims and testing regimes of manufacturers.
- In August 2023, Empower reported robust H1 2023 revenues of AED 1,225 million, driven by increasing demand for district cooling from new projects, showcasing impressive growth in revenue and EBITDA.
Report Scope
Report Features Description Market Value (2023) USD 7.3 Billion Forecast Revenue (2033) USD 20.7 Billion CAGR (2024-2032) 11.3% Base Year for Estimation 2023 Historic Period 2016-2023 Forecast Period 2024-2033 Report Coverage Revenue Forecast, Market Dynamics, COVID-19 Impact, Competitive Landscape, Recent Developments Segments Covered By Material Type(Polymers, Metal & Alloys), By Pipe Configuration(Twin Pipe, Single Pipe), By Installation(Below Ground, Above Ground), By End User(District Heating and Cooling, Oil & Gas, Chemical, Pharmaceutical, Others) Regional Analysis North America - The US, Canada, Rest of North America, Europe - Germany, France, The UK, Spain, Italy, Russia, Netherlands, Rest of Europe, Asia-Pacific - China, Japan, South Korea, India, New Zealand, Singapore, Thailand, Vietnam, Rest of Asia Pacific, Latin America - Brazil, Mexico, Rest of Latin America, Middle East & Africa - South Africa, Saudi Arabia, UAE, Rest of Middle East & Africa Competitive Landscape Georg Fischer AG, Uponor Corporation, Watts Water Technologies, LOGSTOR A/S, Brugg Group Ag, Polypipe Group PLC, Vital Energi Utilities Limited, Perma-Pipe International Holdings Inc., Elips - Empower Logstor, KE KELIT, Thermaflex International Holding b.v., Ecoline S.R.L., Aquatherm GmbH, CPV LTD, Insul-Pipe Systems, Thermal Pipe Systems, Inc., IPL Pre-Insulated Pipes, Unifix Plast Pvt. Ltd., ZECO Aircon Ltd. Customization Scope Customization for segments, region/country-level will be provided. Moreover, additional customization can be done based on the requirements. Purchase Options We have three licenses to opt for Single User License, Multi-User License (Up to 5 Users), Corporate Use License (Unlimited User and Printable PDF) -
- 1. Executive Summary
- 1.1. Definition
- 1.2. Taxonomy
- 1.3. Research Scope
- 1.4. Key Analysis
- 1.5. Key Findings by Major Segments
- 1.6. Top strategies by Major Players
- 2. Global Pre Insulated Pipes Market Overview
- 2.1. Pre Insulated Pipes Market Dynamics
- 2.1.1. Drivers
- 2.1.2. Opportunities
- 2.1.3. Restraints
- 2.1.4. Challenges
- 2.2. Macro-economic Factors
- 2.3. Regulatory Framework
- 2.4. Market Investment Feasibility Index
- 2.5. PEST Analysis
- 2.6. PORTER’S Five Force Analysis
- 2.7. Drivers & Restraints Impact Analysis
- 2.8. Industry Chain Analysis
- 2.9. Cost Structure Analysis
- 2.10. Marketing Strategy
- 2.11. Russia-Ukraine War Impact Analysis
- 2.12. Opportunity Map Analysis
- 2.13. Market Competition Scenario Analysis
- 2.14. Product Life Cycle Analysis
- 2.15. Opportunity Orbits
- 2.16. Manufacturer Intensity Map
- 2.17. Major Companies sales by Value & Volume
- 2.1. Pre Insulated Pipes Market Dynamics
- 3. Global Pre Insulated Pipes Market Analysis, Opportunity and Forecast, 2016-2032
- 3.1. Global Pre Insulated Pipes Market Analysis, 2016-2021
- 3.2. Global Pre Insulated Pipes Market Opportunity and Forecast, 2023-2032
- 3.3. Global Pre Insulated Pipes Market Analysis, Opportunity and Forecast, By By Material Type, 2016-2032
- 3.3.1. Global Pre Insulated Pipes Market Analysis by By Material Type: Introduction
- 3.3.2. Market Size Absolute $ Opportunity Analysis and Forecast, By By Material Type, 2016-2032
- 3.3.3. Polymers
- 3.3.4. Metal & Alloys
- 3.4. Global Pre Insulated Pipes Market Analysis, Opportunity and Forecast, By By Pipe Configuration, 2016-2032
- 3.4.1. Global Pre Insulated Pipes Market Analysis by By Pipe Configuration: Introduction
- 3.4.2. Market Size Absolute $ Opportunity Analysis and Forecast, By By Pipe Configuration, 2016-2032
- 3.4.3. Twin Pipe
- 3.4.4. Single Pipe
- 3.5. Global Pre Insulated Pipes Market Analysis, Opportunity and Forecast, By By Installation, 2016-2032
- 3.5.1. Global Pre Insulated Pipes Market Analysis by By Installation: Introduction
- 3.5.2. Market Size Absolute $ Opportunity Analysis and Forecast, By By Installation, 2016-2032
- 3.5.3. Below Ground
- 3.5.4. Above Ground
- 3.6. Global Pre Insulated Pipes Market Analysis, Opportunity and Forecast, By By End User, 2016-2032
- 3.6.1. Global Pre Insulated Pipes Market Analysis by By End User: Introduction
- 3.6.2. Market Size Absolute $ Opportunity Analysis and Forecast, By By End User, 2016-2032
- 3.6.3. District Heating and Cooling
- 3.6.4. Oil & Gas
- 3.6.5. Chemical
- 3.6.6. Pharmaceutical
- 3.6.7. Others
- 4. North America Pre Insulated Pipes Market Analysis, Opportunity and Forecast, 2016-2032
- 4.1. North America Pre Insulated Pipes Market Analysis, 2016-2021
- 4.2. North America Pre Insulated Pipes Market Opportunity and Forecast, 2023-2032
- 4.3. North America Pre Insulated Pipes Market Analysis, Opportunity and Forecast, By By Material Type, 2016-2032
- 4.3.1. North America Pre Insulated Pipes Market Analysis by By Material Type: Introduction
- 4.3.2. Market Size Absolute $ Opportunity Analysis and Forecast, By By Material Type, 2016-2032
- 4.3.3. Polymers
- 4.3.4. Metal & Alloys
- 4.4. North America Pre Insulated Pipes Market Analysis, Opportunity and Forecast, By By Pipe Configuration, 2016-2032
- 4.4.1. North America Pre Insulated Pipes Market Analysis by By Pipe Configuration: Introduction
- 4.4.2. Market Size Absolute $ Opportunity Analysis and Forecast, By By Pipe Configuration, 2016-2032
- 4.4.3. Twin Pipe
- 4.4.4. Single Pipe
- 4.5. North America Pre Insulated Pipes Market Analysis, Opportunity and Forecast, By By Installation, 2016-2032
- 4.5.1. North America Pre Insulated Pipes Market Analysis by By Installation: Introduction
- 4.5.2. Market Size Absolute $ Opportunity Analysis and Forecast, By By Installation, 2016-2032
- 4.5.3. Below Ground
- 4.5.4. Above Ground
- 4.6. North America Pre Insulated Pipes Market Analysis, Opportunity and Forecast, By By End User, 2016-2032
- 4.6.1. North America Pre Insulated Pipes Market Analysis by By End User: Introduction
- 4.6.2. Market Size Absolute $ Opportunity Analysis and Forecast, By By End User, 2016-2032
- 4.6.3. District Heating and Cooling
- 4.6.4. Oil & Gas
- 4.6.5. Chemical
- 4.6.6. Pharmaceutical
- 4.6.7. Others
- 4.7. North America Pre Insulated Pipes Market Analysis, Opportunity and Forecast, By Country , 2016-2032
- 4.7.1. North America Pre Insulated Pipes Market Analysis by Country : Introduction
- 4.7.2. Market Size Absolute $ Opportunity Analysis and Forecast, Country , 2016-2032
- 4.7.2.1. The US
- 4.7.2.2. Canada
- 4.7.2.3. Mexico
- 5. Western Europe Pre Insulated Pipes Market Analysis, Opportunity and Forecast, 2016-2032
- 5.1. Western Europe Pre Insulated Pipes Market Analysis, 2016-2021
- 5.2. Western Europe Pre Insulated Pipes Market Opportunity and Forecast, 2023-2032
- 5.3. Western Europe Pre Insulated Pipes Market Analysis, Opportunity and Forecast, By By Material Type, 2016-2032
- 5.3.1. Western Europe Pre Insulated Pipes Market Analysis by By Material Type: Introduction
- 5.3.2. Market Size Absolute $ Opportunity Analysis and Forecast, By By Material Type, 2016-2032
- 5.3.3. Polymers
- 5.3.4. Metal & Alloys
- 5.4. Western Europe Pre Insulated Pipes Market Analysis, Opportunity and Forecast, By By Pipe Configuration, 2016-2032
- 5.4.1. Western Europe Pre Insulated Pipes Market Analysis by By Pipe Configuration: Introduction
- 5.4.2. Market Size Absolute $ Opportunity Analysis and Forecast, By By Pipe Configuration, 2016-2032
- 5.4.3. Twin Pipe
- 5.4.4. Single Pipe
- 5.5. Western Europe Pre Insulated Pipes Market Analysis, Opportunity and Forecast, By By Installation, 2016-2032
- 5.5.1. Western Europe Pre Insulated Pipes Market Analysis by By Installation: Introduction
- 5.5.2. Market Size Absolute $ Opportunity Analysis and Forecast, By By Installation, 2016-2032
- 5.5.3. Below Ground
- 5.5.4. Above Ground
- 5.6. Western Europe Pre Insulated Pipes Market Analysis, Opportunity and Forecast, By By End User, 2016-2032
- 5.6.1. Western Europe Pre Insulated Pipes Market Analysis by By End User: Introduction
- 5.6.2. Market Size Absolute $ Opportunity Analysis and Forecast, By By End User, 2016-2032
- 5.6.3. District Heating and Cooling
- 5.6.4. Oil & Gas
- 5.6.5. Chemical
- 5.6.6. Pharmaceutical
- 5.6.7. Others
- 5.7. Western Europe Pre Insulated Pipes Market Analysis, Opportunity and Forecast, By Country , 2016-2032
- 5.7.1. Western Europe Pre Insulated Pipes Market Analysis by Country : Introduction
- 5.7.2. Market Size Absolute $ Opportunity Analysis and Forecast, Country , 2016-2032
- 5.7.2.1. Germany
- 5.7.2.2. France
- 5.7.2.3. The UK
- 5.7.2.4. Spain
- 5.7.2.5. Italy
- 5.7.2.6. Portugal
- 5.7.2.7. Ireland
- 5.7.2.8. Austria
- 5.7.2.9. Switzerland
- 5.7.2.10. Benelux
- 5.7.2.11. Nordic
- 5.7.2.12. Rest of Western Europe
- 6. Eastern Europe Pre Insulated Pipes Market Analysis, Opportunity and Forecast, 2016-2032
- 6.1. Eastern Europe Pre Insulated Pipes Market Analysis, 2016-2021
- 6.2. Eastern Europe Pre Insulated Pipes Market Opportunity and Forecast, 2023-2032
- 6.3. Eastern Europe Pre Insulated Pipes Market Analysis, Opportunity and Forecast, By By Material Type, 2016-2032
- 6.3.1. Eastern Europe Pre Insulated Pipes Market Analysis by By Material Type: Introduction
- 6.3.2. Market Size Absolute $ Opportunity Analysis and Forecast, By By Material Type, 2016-2032
- 6.3.3. Polymers
- 6.3.4. Metal & Alloys
- 6.4. Eastern Europe Pre Insulated Pipes Market Analysis, Opportunity and Forecast, By By Pipe Configuration, 2016-2032
- 6.4.1. Eastern Europe Pre Insulated Pipes Market Analysis by By Pipe Configuration: Introduction
- 6.4.2. Market Size Absolute $ Opportunity Analysis and Forecast, By By Pipe Configuration, 2016-2032
- 6.4.3. Twin Pipe
- 6.4.4. Single Pipe
- 6.5. Eastern Europe Pre Insulated Pipes Market Analysis, Opportunity and Forecast, By By Installation, 2016-2032
- 6.5.1. Eastern Europe Pre Insulated Pipes Market Analysis by By Installation: Introduction
- 6.5.2. Market Size Absolute $ Opportunity Analysis and Forecast, By By Installation, 2016-2032
- 6.5.3. Below Ground
- 6.5.4. Above Ground
- 6.6. Eastern Europe Pre Insulated Pipes Market Analysis, Opportunity and Forecast, By By End User, 2016-2032
- 6.6.1. Eastern Europe Pre Insulated Pipes Market Analysis by By End User: Introduction
- 6.6.2. Market Size Absolute $ Opportunity Analysis and Forecast, By By End User, 2016-2032
- 6.6.3. District Heating and Cooling
- 6.6.4. Oil & Gas
- 6.6.5. Chemical
- 6.6.6. Pharmaceutical
- 6.6.7. Others
- 6.7. Eastern Europe Pre Insulated Pipes Market Analysis, Opportunity and Forecast, By Country , 2016-2032
- 6.7.1. Eastern Europe Pre Insulated Pipes Market Analysis by Country : Introduction
- 6.7.2. Market Size Absolute $ Opportunity Analysis and Forecast, Country , 2016-2032
- 6.7.2.1. Russia
- 6.7.2.2. Poland
- 6.7.2.3. The Czech Republic
- 6.7.2.4. Greece
- 6.7.2.5. Rest of Eastern Europe
- 7. APAC Pre Insulated Pipes Market Analysis, Opportunity and Forecast, 2016-2032
- 7.1. APAC Pre Insulated Pipes Market Analysis, 2016-2021
- 7.2. APAC Pre Insulated Pipes Market Opportunity and Forecast, 2023-2032
- 7.3. APAC Pre Insulated Pipes Market Analysis, Opportunity and Forecast, By By Material Type, 2016-2032
- 7.3.1. APAC Pre Insulated Pipes Market Analysis by By Material Type: Introduction
- 7.3.2. Market Size Absolute $ Opportunity Analysis and Forecast, By By Material Type, 2016-2032
- 7.3.3. Polymers
- 7.3.4. Metal & Alloys
- 7.4. APAC Pre Insulated Pipes Market Analysis, Opportunity and Forecast, By By Pipe Configuration, 2016-2032
- 7.4.1. APAC Pre Insulated Pipes Market Analysis by By Pipe Configuration: Introduction
- 7.4.2. Market Size Absolute $ Opportunity Analysis and Forecast, By By Pipe Configuration, 2016-2032
- 7.4.3. Twin Pipe
- 7.4.4. Single Pipe
- 7.5. APAC Pre Insulated Pipes Market Analysis, Opportunity and Forecast, By By Installation, 2016-2032
- 7.5.1. APAC Pre Insulated Pipes Market Analysis by By Installation: Introduction
- 7.5.2. Market Size Absolute $ Opportunity Analysis and Forecast, By By Installation, 2016-2032
- 7.5.3. Below Ground
- 7.5.4. Above Ground
- 7.6. APAC Pre Insulated Pipes Market Analysis, Opportunity and Forecast, By By End User, 2016-2032
- 7.6.1. APAC Pre Insulated Pipes Market Analysis by By End User: Introduction
- 7.6.2. Market Size Absolute $ Opportunity Analysis and Forecast, By By End User, 2016-2032
- 7.6.3. District Heating and Cooling
- 7.6.4. Oil & Gas
- 7.6.5. Chemical
- 7.6.6. Pharmaceutical
- 7.6.7. Others
- 7.7. APAC Pre Insulated Pipes Market Analysis, Opportunity and Forecast, By Country , 2016-2032
- 7.7.1. APAC Pre Insulated Pipes Market Analysis by Country : Introduction
- 7.7.2. Market Size Absolute $ Opportunity Analysis and Forecast, Country , 2016-2032
- 7.7.2.1. China
- 7.7.2.2. Japan
- 7.7.2.3. South Korea
- 7.7.2.4. India
- 7.7.2.5. Australia & New Zeland
- 7.7.2.6. Indonesia
- 7.7.2.7. Malaysia
- 7.7.2.8. Philippines
- 7.7.2.9. Singapore
- 7.7.2.10. Thailand
- 7.7.2.11. Vietnam
- 7.7.2.12. Rest of APAC
- 8. Latin America Pre Insulated Pipes Market Analysis, Opportunity and Forecast, 2016-2032
- 8.1. Latin America Pre Insulated Pipes Market Analysis, 2016-2021
- 8.2. Latin America Pre Insulated Pipes Market Opportunity and Forecast, 2023-2032
- 8.3. Latin America Pre Insulated Pipes Market Analysis, Opportunity and Forecast, By By Material Type, 2016-2032
- 8.3.1. Latin America Pre Insulated Pipes Market Analysis by By Material Type: Introduction
- 8.3.2. Market Size Absolute $ Opportunity Analysis and Forecast, By By Material Type, 2016-2032
- 8.3.3. Polymers
- 8.3.4. Metal & Alloys
- 8.4. Latin America Pre Insulated Pipes Market Analysis, Opportunity and Forecast, By By Pipe Configuration, 2016-2032
- 8.4.1. Latin America Pre Insulated Pipes Market Analysis by By Pipe Configuration: Introduction
- 8.4.2. Market Size Absolute $ Opportunity Analysis and Forecast, By By Pipe Configuration, 2016-2032
- 8.4.3. Twin Pipe
- 8.4.4. Single Pipe
- 8.5. Latin America Pre Insulated Pipes Market Analysis, Opportunity and Forecast, By By Installation, 2016-2032
- 8.5.1. Latin America Pre Insulated Pipes Market Analysis by By Installation: Introduction
- 8.5.2. Market Size Absolute $ Opportunity Analysis and Forecast, By By Installation, 2016-2032
- 8.5.3. Below Ground
- 8.5.4. Above Ground
- 8.6. Latin America Pre Insulated Pipes Market Analysis, Opportunity and Forecast, By By End User, 2016-2032
- 8.6.1. Latin America Pre Insulated Pipes Market Analysis by By End User: Introduction
- 8.6.2. Market Size Absolute $ Opportunity Analysis and Forecast, By By End User, 2016-2032
- 8.6.3. District Heating and Cooling
- 8.6.4. Oil & Gas
- 8.6.5. Chemical
- 8.6.6. Pharmaceutical
- 8.6.7. Others
- 8.7. Latin America Pre Insulated Pipes Market Analysis, Opportunity and Forecast, By Country , 2016-2032
- 8.7.1. Latin America Pre Insulated Pipes Market Analysis by Country : Introduction
- 8.7.2. Market Size Absolute $ Opportunity Analysis and Forecast, Country , 2016-2032
- 8.7.2.1. Brazil
- 8.7.2.2. Colombia
- 8.7.2.3. Chile
- 8.7.2.4. Argentina
- 8.7.2.5. Costa Rica
- 8.7.2.6. Rest of Latin America
- 9. Middle East & Africa Pre Insulated Pipes Market Analysis, Opportunity and Forecast, 2016-2032
- 9.1. Middle East & Africa Pre Insulated Pipes Market Analysis, 2016-2021
- 9.2. Middle East & Africa Pre Insulated Pipes Market Opportunity and Forecast, 2023-2032
- 9.3. Middle East & Africa Pre Insulated Pipes Market Analysis, Opportunity and Forecast, By By Material Type, 2016-2032
- 9.3.1. Middle East & Africa Pre Insulated Pipes Market Analysis by By Material Type: Introduction
- 9.3.2. Market Size Absolute $ Opportunity Analysis and Forecast, By By Material Type, 2016-2032
- 9.3.3. Polymers
- 9.3.4. Metal & Alloys
- 9.4. Middle East & Africa Pre Insulated Pipes Market Analysis, Opportunity and Forecast, By By Pipe Configuration, 2016-2032
- 9.4.1. Middle East & Africa Pre Insulated Pipes Market Analysis by By Pipe Configuration: Introduction
- 9.4.2. Market Size Absolute $ Opportunity Analysis and Forecast, By By Pipe Configuration, 2016-2032
- 9.4.3. Twin Pipe
- 9.4.4. Single Pipe
- 9.5. Middle East & Africa Pre Insulated Pipes Market Analysis, Opportunity and Forecast, By By Installation, 2016-2032
- 9.5.1. Middle East & Africa Pre Insulated Pipes Market Analysis by By Installation: Introduction
- 9.5.2. Market Size Absolute $ Opportunity Analysis and Forecast, By By Installation, 2016-2032
- 9.5.3. Below Ground
- 9.5.4. Above Ground
- 9.6. Middle East & Africa Pre Insulated Pipes Market Analysis, Opportunity and Forecast, By By End User, 2016-2032
- 9.6.1. Middle East & Africa Pre Insulated Pipes Market Analysis by By End User: Introduction
- 9.6.2. Market Size Absolute $ Opportunity Analysis and Forecast, By By End User, 2016-2032
- 9.6.3. District Heating and Cooling
- 9.6.4. Oil & Gas
- 9.6.5. Chemical
- 9.6.6. Pharmaceutical
- 9.6.7. Others
- 9.7. Middle East & Africa Pre Insulated Pipes Market Analysis, Opportunity and Forecast, By Country , 2016-2032
- 9.7.1. Middle East & Africa Pre Insulated Pipes Market Analysis by Country : Introduction
- 9.7.2. Market Size Absolute $ Opportunity Analysis and Forecast, Country , 2016-2032
- 9.7.2.1. Algeria
- 9.7.2.2. Egypt
- 9.7.2.3. Israel
- 9.7.2.4. Kuwait
- 9.7.2.5. Nigeria
- 9.7.2.6. Saudi Arabia
- 9.7.2.7. South Africa
- 9.7.2.8. Turkey
- 9.7.2.9. The UAE
- 9.7.2.10. Rest of MEA
- 10. Global Pre Insulated Pipes Market Analysis, Opportunity and Forecast, By Region , 2016-2032
- 10.1. Global Pre Insulated Pipes Market Analysis by Region : Introduction
- 10.2. Market Size Absolute $ Opportunity Analysis and Forecast, By Region , 2016-2032
- 10.2.1. North America
- 10.2.2. Western Europe
- 10.2.3. Eastern Europe
- 10.2.4. APAC
- 10.2.5. Latin America
- 10.2.6. Middle East & Africa
- 11. Global Pre Insulated Pipes Market Competitive Landscape, Market Share Analysis, and Company Profiles
- 11.1. Market Share Analysis
- 11.2. Company Profiles
- 11.3. Georg Fischer AG
- 11.3.1. Company Overview
- 11.3.2. Financial Highlights
- 11.3.3. Product Portfolio
- 11.3.4. SWOT Analysis
- 11.3.5. Key Strategies and Developments
- 11.4. Uponor Corporation
- 11.4.1. Company Overview
- 11.4.2. Financial Highlights
- 11.4.3. Product Portfolio
- 11.4.4. SWOT Analysis
- 11.4.5. Key Strategies and Developments
- 11.5. Watts Water Technologies
- 11.5.1. Company Overview
- 11.5.2. Financial Highlights
- 11.5.3. Product Portfolio
- 11.5.4. SWOT Analysis
- 11.5.5. Key Strategies and Developments
- 11.6. LOGSTOR A/S
- 11.6.1. Company Overview
- 11.6.2. Financial Highlights
- 11.6.3. Product Portfolio
- 11.6.4. SWOT Analysis
- 11.6.5. Key Strategies and Developments
- 11.7. Brugg Group Ag
- 11.7.1. Company Overview
- 11.7.2. Financial Highlights
- 11.7.3. Product Portfolio
- 11.7.4. SWOT Analysis
- 11.7.5. Key Strategies and Developments
- 11.8. Polypipe Group PLC
- 11.8.1. Company Overview
- 11.8.2. Financial Highlights
- 11.8.3. Product Portfolio
- 11.8.4. SWOT Analysis
- 11.8.5. Key Strategies and Developments
- 11.9. Vital Energi Utilities Limited
- 11.9.1. Company Overview
- 11.9.2. Financial Highlights
- 11.9.3. Product Portfolio
- 11.9.4. SWOT Analysis
- 11.9.5. Key Strategies and Developments
- 11.10. Perma-Pipe International Holdings Inc.
- 11.10.1. Company Overview
- 11.10.2. Financial Highlights
- 11.10.3. Product Portfolio
- 11.10.4. SWOT Analysis
- 11.10.5. Key Strategies and Developments
- 11.11. Elips - Empower Logstor
- 11.11.1. Company Overview
- 11.11.2. Financial Highlights
- 11.11.3. Product Portfolio
- 11.11.4. SWOT Analysis
- 11.11.5. Key Strategies and Developments
- 11.12. KE KELIT
- 11.12.1. Company Overview
- 11.12.2. Financial Highlights
- 11.12.3. Product Portfolio
- 11.12.4. SWOT Analysis
- 11.12.5. Key Strategies and Developments
- 11.13.1. Company Overview
- 11.13.2. Financial Highlights
- 11.13.3. Product Portfolio
- 11.13.4. SWOT Analysis
- 11.13.5. Key Strategies and Developments
- 11.14. Thermaflex International Holding b.v.
- 11.14.1. Company Overview
- 11.14.2. Financial Highlights
- 11.14.3. Product Portfolio
- 11.14.4. SWOT Analysis
- 11.14.5. Key Strategies and Developments
- 11.15. Aquatherm GmbH
- 11.15.1. Company Overview
- 11.15.2. Financial Highlights
- 11.15.3. Product Portfolio
- 11.15.4. SWOT Analysis
- 11.15.5. Key Strategies and Developments
- 11.16. CPV LTD
- 11.16.1. Company Overview
- 11.16.2. Financial Highlights
- 11.16.3. Product Portfolio
- 11.16.4. SWOT Analysis
- 11.16.5. Key Strategies and Developments
- 11.17. Insul-Pipe Systems
- 11.17.1. Company Overview
- 11.17.2. Financial Highlights
- 11.17.3. Product Portfolio
- 11.17.4. SWOT Analysis
- 11.17.5. Key Strategies and Developments
- 11.18. Thermal Pipe Systems, Inc.
- 11.18.1. Company Overview
- 11.18.2. Financial Highlights
- 11.18.3. Product Portfolio
- 11.18.4. SWOT Analysis
- 11.18.5. Key Strategies and Developments
- 11.19. IPL Pre-Insulated Pipes
- 11.19.1. Company Overview
- 11.19.2. Financial Highlights
- 11.19.3. Product Portfolio
- 11.19.4. SWOT Analysis
- 11.19.5. Key Strategies and Developments
- 11.20. Unifix Plast Pvt. Ltd.
- 11.20.1. Company Overview
- 11.20.2. Financial Highlights
- 11.20.3. Product Portfolio
- 11.20.4. SWOT Analysis
- 11.20.5. Key Strategies and Developments
- 11.21. ZECO Aircon Ltd.
- 11.21.1. Company Overview
- 11.21.2. Financial Highlights
- 11.21.3. Product Portfolio
- 11.21.4. SWOT Analysis
- 11.21.5. Key Strategies and Developments
- 12. Assumptions and Acronyms
- 13. Research Methodology
- 14. Contact
"
- List of Figures
- "
- Figure 1: Global Pre Insulated Pipes Market Revenue (US$ Mn) Market Share by By Material Type in 2022
- Figure 2: Global Pre Insulated Pipes Market Market Attractiveness Analysis by By Material Type, 2016-2032
- Figure 3: Global Pre Insulated Pipes Market Revenue (US$ Mn) Market Share by By Pipe Configurationin 2022
- Figure 4: Global Pre Insulated Pipes Market Market Attractiveness Analysis by By Pipe Configuration, 2016-2032
- Figure 5: Global Pre Insulated Pipes Market Revenue (US$ Mn) Market Share by By Installationin 2022
- Figure 6: Global Pre Insulated Pipes Market Market Attractiveness Analysis by By Installation, 2016-2032
- Figure 7: Global Pre Insulated Pipes Market Revenue (US$ Mn) Market Share by By End Userin 2022
- Figure 8: Global Pre Insulated Pipes Market Market Attractiveness Analysis by By End User, 2016-2032
- Figure 9: Global Pre Insulated Pipes Market Revenue (US$ Mn) Market Share by Region in 2022
- Figure 10: Global Pre Insulated Pipes Market Market Attractiveness Analysis by Region, 2016-2032
- Figure 11: Global Pre Insulated Pipes Market Market Revenue (US$ Mn) (2016-2032)
- Figure 12: Global Pre Insulated Pipes Market Market Revenue (US$ Mn) Comparison by Region (2016-2032)
- Figure 13: Global Pre Insulated Pipes Market Market Revenue (US$ Mn) Comparison by By Material Type (2016-2032)
- Figure 14: Global Pre Insulated Pipes Market Market Revenue (US$ Mn) Comparison by By Pipe Configuration (2016-2032)
- Figure 15: Global Pre Insulated Pipes Market Market Revenue (US$ Mn) Comparison by By Installation (2016-2032)
- Figure 16: Global Pre Insulated Pipes Market Market Revenue (US$ Mn) Comparison by By End User (2016-2032)
- Figure 17: Global Pre Insulated Pipes Market Market Y-o-Y Growth Rate Comparison by Region (2016-2032)
- Figure 18: Global Pre Insulated Pipes Market Market Y-o-Y Growth Rate Comparison by By Material Type (2016-2032)
- Figure 19: Global Pre Insulated Pipes Market Market Y-o-Y Growth Rate Comparison by By Pipe Configuration (2016-2032)
- Figure 20: Global Pre Insulated Pipes Market Market Y-o-Y Growth Rate Comparison by By Installation (2016-2032)
- Figure 21: Global Pre Insulated Pipes Market Market Y-o-Y Growth Rate Comparison by By End User (2016-2032)
- Figure 22: Global Pre Insulated Pipes Market Market Share Comparison by Region (2016-2032)
- Figure 23: Global Pre Insulated Pipes Market Market Share Comparison by By Material Type (2016-2032)
- Figure 24: Global Pre Insulated Pipes Market Market Share Comparison by By Pipe Configuration (2016-2032)
- Figure 25: Global Pre Insulated Pipes Market Market Share Comparison by By Installation (2016-2032)
- Figure 26: Global Pre Insulated Pipes Market Market Share Comparison by By End User (2016-2032)
- Figure 27: North America Pre Insulated Pipes Market Revenue (US$ Mn) Market Share by By Material Typein 2022
- Figure 28: North America Pre Insulated Pipes Market Market Attractiveness Analysis by By Material Type, 2016-2032
- Figure 29: North America Pre Insulated Pipes Market Revenue (US$ Mn) Market Share by By Pipe Configurationin 2022
- Figure 30: North America Pre Insulated Pipes Market Market Attractiveness Analysis by By Pipe Configuration, 2016-2032
- Figure 31: North America Pre Insulated Pipes Market Revenue (US$ Mn) Market Share by By Installationin 2022
- Figure 32: North America Pre Insulated Pipes Market Market Attractiveness Analysis by By Installation, 2016-2032
- Figure 33: North America Pre Insulated Pipes Market Revenue (US$ Mn) Market Share by By End Userin 2022
- Figure 34: North America Pre Insulated Pipes Market Market Attractiveness Analysis by By End User, 2016-2032
- Figure 35: North America Pre Insulated Pipes Market Revenue (US$ Mn) Market Share by Country in 2022
- Figure 36: North America Pre Insulated Pipes Market Market Attractiveness Analysis by Country, 2016-2032
- Figure 37: North America Pre Insulated Pipes Market Market Revenue (US$ Mn) (2016-2032)
- Figure 38: North America Pre Insulated Pipes Market Market Revenue (US$ Mn) Comparison by Country (2016-2032)
- Figure 39: North America Pre Insulated Pipes Market Market Revenue (US$ Mn) Comparison by By Material Type (2016-2032)
- Figure 40: North America Pre Insulated Pipes Market Market Revenue (US$ Mn) Comparison by By Pipe Configuration (2016-2032)
- Figure 41: North America Pre Insulated Pipes Market Market Revenue (US$ Mn) Comparison by By Installation (2016-2032)
- Figure 42: North America Pre Insulated Pipes Market Market Revenue (US$ Mn) Comparison by By End User (2016-2032)
- Figure 43: North America Pre Insulated Pipes Market Market Y-o-Y Growth Rate Comparison by Country (2016-2032)
- Figure 44: North America Pre Insulated Pipes Market Market Y-o-Y Growth Rate Comparison by By Material Type (2016-2032)
- Figure 45: North America Pre Insulated Pipes Market Market Y-o-Y Growth Rate Comparison by By Pipe Configuration (2016-2032)
- Figure 46: North America Pre Insulated Pipes Market Market Y-o-Y Growth Rate Comparison by By Installation (2016-2032)
- Figure 47: North America Pre Insulated Pipes Market Market Y-o-Y Growth Rate Comparison by By End User (2016-2032)
- Figure 48: North America Pre Insulated Pipes Market Market Share Comparison by Country (2016-2032)
- Figure 49: North America Pre Insulated Pipes Market Market Share Comparison by By Material Type (2016-2032)
- Figure 50: North America Pre Insulated Pipes Market Market Share Comparison by By Pipe Configuration (2016-2032)
- Figure 51: North America Pre Insulated Pipes Market Market Share Comparison by By Installation (2016-2032)
- Figure 52: North America Pre Insulated Pipes Market Market Share Comparison by By End User (2016-2032)
- Figure 53: Western Europe Pre Insulated Pipes Market Revenue (US$ Mn) Market Share by By Material Typein 2022
- Figure 54: Western Europe Pre Insulated Pipes Market Market Attractiveness Analysis by By Material Type, 2016-2032
- Figure 55: Western Europe Pre Insulated Pipes Market Revenue (US$ Mn) Market Share by By Pipe Configurationin 2022
- Figure 56: Western Europe Pre Insulated Pipes Market Market Attractiveness Analysis by By Pipe Configuration, 2016-2032
- Figure 57: Western Europe Pre Insulated Pipes Market Revenue (US$ Mn) Market Share by By Installationin 2022
- Figure 58: Western Europe Pre Insulated Pipes Market Market Attractiveness Analysis by By Installation, 2016-2032
- Figure 59: Western Europe Pre Insulated Pipes Market Revenue (US$ Mn) Market Share by By End Userin 2022
- Figure 60: Western Europe Pre Insulated Pipes Market Market Attractiveness Analysis by By End User, 2016-2032
- Figure 61: Western Europe Pre Insulated Pipes Market Revenue (US$ Mn) Market Share by Country in 2022
- Figure 62: Western Europe Pre Insulated Pipes Market Market Attractiveness Analysis by Country, 2016-2032
- Figure 63: Western Europe Pre Insulated Pipes Market Market Revenue (US$ Mn) (2016-2032)
- Figure 64: Western Europe Pre Insulated Pipes Market Market Revenue (US$ Mn) Comparison by Country (2016-2032)
- Figure 65: Western Europe Pre Insulated Pipes Market Market Revenue (US$ Mn) Comparison by By Material Type (2016-2032)
- Figure 66: Western Europe Pre Insulated Pipes Market Market Revenue (US$ Mn) Comparison by By Pipe Configuration (2016-2032)
- Figure 67: Western Europe Pre Insulated Pipes Market Market Revenue (US$ Mn) Comparison by By Installation (2016-2032)
- Figure 68: Western Europe Pre Insulated Pipes Market Market Revenue (US$ Mn) Comparison by By End User (2016-2032)
- Figure 69: Western Europe Pre Insulated Pipes Market Market Y-o-Y Growth Rate Comparison by Country (2016-2032)
- Figure 70: Western Europe Pre Insulated Pipes Market Market Y-o-Y Growth Rate Comparison by By Material Type (2016-2032)
- Figure 71: Western Europe Pre Insulated Pipes Market Market Y-o-Y Growth Rate Comparison by By Pipe Configuration (2016-2032)
- Figure 72: Western Europe Pre Insulated Pipes Market Market Y-o-Y Growth Rate Comparison by By Installation (2016-2032)
- Figure 73: Western Europe Pre Insulated Pipes Market Market Y-o-Y Growth Rate Comparison by By End User (2016-2032)
- Figure 74: Western Europe Pre Insulated Pipes Market Market Share Comparison by Country (2016-2032)
- Figure 75: Western Europe Pre Insulated Pipes Market Market Share Comparison by By Material Type (2016-2032)
- Figure 76: Western Europe Pre Insulated Pipes Market Market Share Comparison by By Pipe Configuration (2016-2032)
- Figure 77: Western Europe Pre Insulated Pipes Market Market Share Comparison by By Installation (2016-2032)
- Figure 78: Western Europe Pre Insulated Pipes Market Market Share Comparison by By End User (2016-2032)
- Figure 79: Eastern Europe Pre Insulated Pipes Market Revenue (US$ Mn) Market Share by By Material Typein 2022
- Figure 80: Eastern Europe Pre Insulated Pipes Market Market Attractiveness Analysis by By Material Type, 2016-2032
- Figure 81: Eastern Europe Pre Insulated Pipes Market Revenue (US$ Mn) Market Share by By Pipe Configurationin 2022
- Figure 82: Eastern Europe Pre Insulated Pipes Market Market Attractiveness Analysis by By Pipe Configuration, 2016-2032
- Figure 83: Eastern Europe Pre Insulated Pipes Market Revenue (US$ Mn) Market Share by By Installationin 2022
- Figure 84: Eastern Europe Pre Insulated Pipes Market Market Attractiveness Analysis by By Installation, 2016-2032
- Figure 85: Eastern Europe Pre Insulated Pipes Market Revenue (US$ Mn) Market Share by By End Userin 2022
- Figure 86: Eastern Europe Pre Insulated Pipes Market Market Attractiveness Analysis by By End User, 2016-2032
- Figure 87: Eastern Europe Pre Insulated Pipes Market Revenue (US$ Mn) Market Share by Country in 2022
- Figure 88: Eastern Europe Pre Insulated Pipes Market Market Attractiveness Analysis by Country, 2016-2032
- Figure 89: Eastern Europe Pre Insulated Pipes Market Market Revenue (US$ Mn) (2016-2032)
- Figure 90: Eastern Europe Pre Insulated Pipes Market Market Revenue (US$ Mn) Comparison by Country (2016-2032)
- Figure 91: Eastern Europe Pre Insulated Pipes Market Market Revenue (US$ Mn) Comparison by By Material Type (2016-2032)
- Figure 92: Eastern Europe Pre Insulated Pipes Market Market Revenue (US$ Mn) Comparison by By Pipe Configuration (2016-2032)
- Figure 93: Eastern Europe Pre Insulated Pipes Market Market Revenue (US$ Mn) Comparison by By Installation (2016-2032)
- Figure 94: Eastern Europe Pre Insulated Pipes Market Market Revenue (US$ Mn) Comparison by By End User (2016-2032)
- Figure 95: Eastern Europe Pre Insulated Pipes Market Market Y-o-Y Growth Rate Comparison by Country (2016-2032)
- Figure 96: Eastern Europe Pre Insulated Pipes Market Market Y-o-Y Growth Rate Comparison by By Material Type (2016-2032)
- Figure 97: Eastern Europe Pre Insulated Pipes Market Market Y-o-Y Growth Rate Comparison by By Pipe Configuration (2016-2032)
- Figure 98: Eastern Europe Pre Insulated Pipes Market Market Y-o-Y Growth Rate Comparison by By Installation (2016-2032)
- Figure 99: Eastern Europe Pre Insulated Pipes Market Market Y-o-Y Growth Rate Comparison by By End User (2016-2032)
- Figure 100: Eastern Europe Pre Insulated Pipes Market Market Share Comparison by Country (2016-2032)
- Figure 101: Eastern Europe Pre Insulated Pipes Market Market Share Comparison by By Material Type (2016-2032)
- Figure 102: Eastern Europe Pre Insulated Pipes Market Market Share Comparison by By Pipe Configuration (2016-2032)
- Figure 103: Eastern Europe Pre Insulated Pipes Market Market Share Comparison by By Installation (2016-2032)
- Figure 104: Eastern Europe Pre Insulated Pipes Market Market Share Comparison by By End User (2016-2032)
- Figure 105: APAC Pre Insulated Pipes Market Revenue (US$ Mn) Market Share by By Material Typein 2022
- Figure 106: APAC Pre Insulated Pipes Market Market Attractiveness Analysis by By Material Type, 2016-2032
- Figure 107: APAC Pre Insulated Pipes Market Revenue (US$ Mn) Market Share by By Pipe Configurationin 2022
- Figure 108: APAC Pre Insulated Pipes Market Market Attractiveness Analysis by By Pipe Configuration, 2016-2032
- Figure 109: APAC Pre Insulated Pipes Market Revenue (US$ Mn) Market Share by By Installationin 2022
- Figure 110: APAC Pre Insulated Pipes Market Market Attractiveness Analysis by By Installation, 2016-2032
- Figure 111: APAC Pre Insulated Pipes Market Revenue (US$ Mn) Market Share by By End Userin 2022
- Figure 112: APAC Pre Insulated Pipes Market Market Attractiveness Analysis by By End User, 2016-2032
- Figure 113: APAC Pre Insulated Pipes Market Revenue (US$ Mn) Market Share by Country in 2022
- Figure 114: APAC Pre Insulated Pipes Market Market Attractiveness Analysis by Country, 2016-2032
- Figure 115: APAC Pre Insulated Pipes Market Market Revenue (US$ Mn) (2016-2032)
- Figure 116: APAC Pre Insulated Pipes Market Market Revenue (US$ Mn) Comparison by Country (2016-2032)
- Figure 117: APAC Pre Insulated Pipes Market Market Revenue (US$ Mn) Comparison by By Material Type (2016-2032)
- Figure 118: APAC Pre Insulated Pipes Market Market Revenue (US$ Mn) Comparison by By Pipe Configuration (2016-2032)
- Figure 119: APAC Pre Insulated Pipes Market Market Revenue (US$ Mn) Comparison by By Installation (2016-2032)
- Figure 120: APAC Pre Insulated Pipes Market Market Revenue (US$ Mn) Comparison by By End User (2016-2032)
- Figure 121: APAC Pre Insulated Pipes Market Market Y-o-Y Growth Rate Comparison by Country (2016-2032)
- Figure 122: APAC Pre Insulated Pipes Market Market Y-o-Y Growth Rate Comparison by By Material Type (2016-2032)
- Figure 123: APAC Pre Insulated Pipes Market Market Y-o-Y Growth Rate Comparison by By Pipe Configuration (2016-2032)
- Figure 124: APAC Pre Insulated Pipes Market Market Y-o-Y Growth Rate Comparison by By Installation (2016-2032)
- Figure 125: APAC Pre Insulated Pipes Market Market Y-o-Y Growth Rate Comparison by By End User (2016-2032)
- Figure 126: APAC Pre Insulated Pipes Market Market Share Comparison by Country (2016-2032)
- Figure 127: APAC Pre Insulated Pipes Market Market Share Comparison by By Material Type (2016-2032)
- Figure 128: APAC Pre Insulated Pipes Market Market Share Comparison by By Pipe Configuration (2016-2032)
- Figure 129: APAC Pre Insulated Pipes Market Market Share Comparison by By Installation (2016-2032)
- Figure 130: APAC Pre Insulated Pipes Market Market Share Comparison by By End User (2016-2032)
- Figure 131: Latin America Pre Insulated Pipes Market Revenue (US$ Mn) Market Share by By Material Typein 2022
- Figure 132: Latin America Pre Insulated Pipes Market Market Attractiveness Analysis by By Material Type, 2016-2032
- Figure 133: Latin America Pre Insulated Pipes Market Revenue (US$ Mn) Market Share by By Pipe Configurationin 2022
- Figure 134: Latin America Pre Insulated Pipes Market Market Attractiveness Analysis by By Pipe Configuration, 2016-2032
- Figure 135: Latin America Pre Insulated Pipes Market Revenue (US$ Mn) Market Share by By Installationin 2022
- Figure 136: Latin America Pre Insulated Pipes Market Market Attractiveness Analysis by By Installation, 2016-2032
- Figure 137: Latin America Pre Insulated Pipes Market Revenue (US$ Mn) Market Share by By End Userin 2022
- Figure 138: Latin America Pre Insulated Pipes Market Market Attractiveness Analysis by By End User, 2016-2032
- Figure 139: Latin America Pre Insulated Pipes Market Revenue (US$ Mn) Market Share by Country in 2022
- Figure 140: Latin America Pre Insulated Pipes Market Market Attractiveness Analysis by Country, 2016-2032
- Figure 141: Latin America Pre Insulated Pipes Market Market Revenue (US$ Mn) (2016-2032)
- Figure 142: Latin America Pre Insulated Pipes Market Market Revenue (US$ Mn) Comparison by Country (2016-2032)
- Figure 143: Latin America Pre Insulated Pipes Market Market Revenue (US$ Mn) Comparison by By Material Type (2016-2032)
- Figure 144: Latin America Pre Insulated Pipes Market Market Revenue (US$ Mn) Comparison by By Pipe Configuration (2016-2032)
- Figure 145: Latin America Pre Insulated Pipes Market Market Revenue (US$ Mn) Comparison by By Installation (2016-2032)
- Figure 146: Latin America Pre Insulated Pipes Market Market Revenue (US$ Mn) Comparison by By End User (2016-2032)
- Figure 147: Latin America Pre Insulated Pipes Market Market Y-o-Y Growth Rate Comparison by Country (2016-2032)
- Figure 148: Latin America Pre Insulated Pipes Market Market Y-o-Y Growth Rate Comparison by By Material Type (2016-2032)
- Figure 149: Latin America Pre Insulated Pipes Market Market Y-o-Y Growth Rate Comparison by By Pipe Configuration (2016-2032)
- Figure 150: Latin America Pre Insulated Pipes Market Market Y-o-Y Growth Rate Comparison by By Installation (2016-2032)
- Figure 151: Latin America Pre Insulated Pipes Market Market Y-o-Y Growth Rate Comparison by By End User (2016-2032)
- Figure 152: Latin America Pre Insulated Pipes Market Market Share Comparison by Country (2016-2032)
- Figure 153: Latin America Pre Insulated Pipes Market Market Share Comparison by By Material Type (2016-2032)
- Figure 154: Latin America Pre Insulated Pipes Market Market Share Comparison by By Pipe Configuration (2016-2032)
- Figure 155: Latin America Pre Insulated Pipes Market Market Share Comparison by By Installation (2016-2032)
- Figure 156: Latin America Pre Insulated Pipes Market Market Share Comparison by By End User (2016-2032)
- Figure 157: Middle East & Africa Pre Insulated Pipes Market Revenue (US$ Mn) Market Share by By Material Typein 2022
- Figure 158: Middle East & Africa Pre Insulated Pipes Market Market Attractiveness Analysis by By Material Type, 2016-2032
- Figure 159: Middle East & Africa Pre Insulated Pipes Market Revenue (US$ Mn) Market Share by By Pipe Configurationin 2022
- Figure 160: Middle East & Africa Pre Insulated Pipes Market Market Attractiveness Analysis by By Pipe Configuration, 2016-2032
- Figure 161: Middle East & Africa Pre Insulated Pipes Market Revenue (US$ Mn) Market Share by By Installationin 2022
- Figure 162: Middle East & Africa Pre Insulated Pipes Market Market Attractiveness Analysis by By Installation, 2016-2032
- Figure 163: Middle East & Africa Pre Insulated Pipes Market Revenue (US$ Mn) Market Share by By End Userin 2022
- Figure 164: Middle East & Africa Pre Insulated Pipes Market Market Attractiveness Analysis by By End User, 2016-2032
- Figure 165: Middle East & Africa Pre Insulated Pipes Market Revenue (US$ Mn) Market Share by Country in 2022
- Figure 166: Middle East & Africa Pre Insulated Pipes Market Market Attractiveness Analysis by Country, 2016-2032
- Figure 167: Middle East & Africa Pre Insulated Pipes Market Market Revenue (US$ Mn) (2016-2032)
- Figure 168: Middle East & Africa Pre Insulated Pipes Market Market Revenue (US$ Mn) Comparison by Country (2016-2032)
- Figure 169: Middle East & Africa Pre Insulated Pipes Market Market Revenue (US$ Mn) Comparison by By Material Type (2016-2032)
- Figure 170: Middle East & Africa Pre Insulated Pipes Market Market Revenue (US$ Mn) Comparison by By Pipe Configuration (2016-2032)
- Figure 171: Middle East & Africa Pre Insulated Pipes Market Market Revenue (US$ Mn) Comparison by By Installation (2016-2032)
- Figure 172: Middle East & Africa Pre Insulated Pipes Market Market Revenue (US$ Mn) Comparison by By End User (2016-2032)
- Figure 173: Middle East & Africa Pre Insulated Pipes Market Market Y-o-Y Growth Rate Comparison by Country (2016-2032)
- Figure 174: Middle East & Africa Pre Insulated Pipes Market Market Y-o-Y Growth Rate Comparison by By Material Type (2016-2032)
- Figure 175: Middle East & Africa Pre Insulated Pipes Market Market Y-o-Y Growth Rate Comparison by By Pipe Configuration (2016-2032)
- Figure 176: Middle East & Africa Pre Insulated Pipes Market Market Y-o-Y Growth Rate Comparison by By Installation (2016-2032)
- Figure 177: Middle East & Africa Pre Insulated Pipes Market Market Y-o-Y Growth Rate Comparison by By End User (2016-2032)
- Figure 178: Middle East & Africa Pre Insulated Pipes Market Market Share Comparison by Country (2016-2032)
- Figure 179: Middle East & Africa Pre Insulated Pipes Market Market Share Comparison by By Material Type (2016-2032)
- Figure 180: Middle East & Africa Pre Insulated Pipes Market Market Share Comparison by By Pipe Configuration (2016-2032)
- Figure 181: Middle East & Africa Pre Insulated Pipes Market Market Share Comparison by By Installation (2016-2032)
- Figure 182: Middle East & Africa Pre Insulated Pipes Market Market Share Comparison by By End User (2016-2032)
"
- List of Tables
- "
- Table 1: Global Pre Insulated Pipes Market Market Comparison by By Material Type (2016-2032)
- Table 2: Global Pre Insulated Pipes Market Market Comparison by By Pipe Configuration (2016-2032)
- Table 3: Global Pre Insulated Pipes Market Market Comparison by By Installation (2016-2032)
- Table 4: Global Pre Insulated Pipes Market Market Comparison by By End User (2016-2032)
- Table 5: Global Pre Insulated Pipes Market Revenue (US$ Mn) Comparison by Region (2016-2032)
- Table 6: Global Pre Insulated Pipes Market Market Revenue (US$ Mn) (2016-2032)
- Table 7: Global Pre Insulated Pipes Market Market Revenue (US$ Mn) Comparison by Region (2016-2032)
- Table 8: Global Pre Insulated Pipes Market Market Revenue (US$ Mn) Comparison by By Material Type (2016-2032)
- Table 9: Global Pre Insulated Pipes Market Market Revenue (US$ Mn) Comparison by By Pipe Configuration (2016-2032)
- Table 10: Global Pre Insulated Pipes Market Market Revenue (US$ Mn) Comparison by By Installation (2016-2032)
- Table 11: Global Pre Insulated Pipes Market Market Revenue (US$ Mn) Comparison by By End User (2016-2032)
- Table 12: Global Pre Insulated Pipes Market Market Y-o-Y Growth Rate Comparison by Region (2016-2032)
- Table 13: Global Pre Insulated Pipes Market Market Y-o-Y Growth Rate Comparison by By Material Type (2016-2032)
- Table 14: Global Pre Insulated Pipes Market Market Y-o-Y Growth Rate Comparison by By Pipe Configuration (2016-2032)
- Table 15: Global Pre Insulated Pipes Market Market Y-o-Y Growth Rate Comparison by By Installation (2016-2032)
- Table 16: Global Pre Insulated Pipes Market Market Y-o-Y Growth Rate Comparison by By End User (2016-2032)
- Table 17: Global Pre Insulated Pipes Market Market Share Comparison by Region (2016-2032)
- Table 18: Global Pre Insulated Pipes Market Market Share Comparison by By Material Type (2016-2032)
- Table 19: Global Pre Insulated Pipes Market Market Share Comparison by By Pipe Configuration (2016-2032)
- Table 20: Global Pre Insulated Pipes Market Market Share Comparison by By Installation (2016-2032)
- Table 21: Global Pre Insulated Pipes Market Market Share Comparison by By End User (2016-2032)
- Table 22: North America Pre Insulated Pipes Market Market Comparison by By Pipe Configuration (2016-2032)
- Table 23: North America Pre Insulated Pipes Market Market Comparison by By Installation (2016-2032)
- Table 24: North America Pre Insulated Pipes Market Market Comparison by By End User (2016-2032)
- Table 25: North America Pre Insulated Pipes Market Revenue (US$ Mn) Comparison by Country (2016-2032)
- Table 26: North America Pre Insulated Pipes Market Market Revenue (US$ Mn) (2016-2032)
- Table 27: North America Pre Insulated Pipes Market Market Revenue (US$ Mn) Comparison by Country (2016-2032)
- Table 28: North America Pre Insulated Pipes Market Market Revenue (US$ Mn) Comparison by By Material Type (2016-2032)
- Table 29: North America Pre Insulated Pipes Market Market Revenue (US$ Mn) Comparison by By Pipe Configuration (2016-2032)
- Table 30: North America Pre Insulated Pipes Market Market Revenue (US$ Mn) Comparison by By Installation (2016-2032)
- Table 31: North America Pre Insulated Pipes Market Market Revenue (US$ Mn) Comparison by By End User (2016-2032)
- Table 32: North America Pre Insulated Pipes Market Market Y-o-Y Growth Rate Comparison by Country (2016-2032)
- Table 33: North America Pre Insulated Pipes Market Market Y-o-Y Growth Rate Comparison by By Material Type (2016-2032)
- Table 34: North America Pre Insulated Pipes Market Market Y-o-Y Growth Rate Comparison by By Pipe Configuration (2016-2032)
- Table 35: North America Pre Insulated Pipes Market Market Y-o-Y Growth Rate Comparison by By Installation (2016-2032)
- Table 36: North America Pre Insulated Pipes Market Market Y-o-Y Growth Rate Comparison by By End User (2016-2032)
- Table 37: North America Pre Insulated Pipes Market Market Share Comparison by Country (2016-2032)
- Table 38: North America Pre Insulated Pipes Market Market Share Comparison by By Material Type (2016-2032)
- Table 39: North America Pre Insulated Pipes Market Market Share Comparison by By Pipe Configuration (2016-2032)
- Table 40: North America Pre Insulated Pipes Market Market Share Comparison by By Installation (2016-2032)
- Table 41: North America Pre Insulated Pipes Market Market Share Comparison by By End User (2016-2032)
- Table 42: Western Europe Pre Insulated Pipes Market Market Comparison by By Material Type (2016-2032)
- Table 43: Western Europe Pre Insulated Pipes Market Market Comparison by By Pipe Configuration (2016-2032)
- Table 44: Western Europe Pre Insulated Pipes Market Market Comparison by By Installation (2016-2032)
- Table 45: Western Europe Pre Insulated Pipes Market Market Comparison by By End User (2016-2032)
- Table 46: Western Europe Pre Insulated Pipes Market Revenue (US$ Mn) Comparison by Country (2016-2032)
- Table 47: Western Europe Pre Insulated Pipes Market Market Revenue (US$ Mn) (2016-2032)
- Table 48: Western Europe Pre Insulated Pipes Market Market Revenue (US$ Mn) Comparison by Country (2016-2032)
- Table 49: Western Europe Pre Insulated Pipes Market Market Revenue (US$ Mn) Comparison by By Material Type (2016-2032)
- Table 50: Western Europe Pre Insulated Pipes Market Market Revenue (US$ Mn) Comparison by By Pipe Configuration (2016-2032)
- Table 51: Western Europe Pre Insulated Pipes Market Market Revenue (US$ Mn) Comparison by By Installation (2016-2032)
- Table 52: Western Europe Pre Insulated Pipes Market Market Revenue (US$ Mn) Comparison by By End User (2016-2032)
- Table 53: Western Europe Pre Insulated Pipes Market Market Y-o-Y Growth Rate Comparison by Country (2016-2032)
- Table 54: Western Europe Pre Insulated Pipes Market Market Y-o-Y Growth Rate Comparison by By Material Type (2016-2032)
- Table 55: Western Europe Pre Insulated Pipes Market Market Y-o-Y Growth Rate Comparison by By Pipe Configuration (2016-2032)
- Table 56: Western Europe Pre Insulated Pipes Market Market Y-o-Y Growth Rate Comparison by By Installation (2016-2032)
- Table 57: Western Europe Pre Insulated Pipes Market Market Y-o-Y Growth Rate Comparison by By End User (2016-2032)
- Table 58: Western Europe Pre Insulated Pipes Market Market Share Comparison by Country (2016-2032)
- Table 59: Western Europe Pre Insulated Pipes Market Market Share Comparison by By Material Type (2016-2032)
- Table 60: Western Europe Pre Insulated Pipes Market Market Share Comparison by By Pipe Configuration (2016-2032)
- Table 61: Western Europe Pre Insulated Pipes Market Market Share Comparison by By Installation (2016-2032)
- Table 62: Western Europe Pre Insulated Pipes Market Market Share Comparison by By End User (2016-2032)
- Table 63: Eastern Europe Pre Insulated Pipes Market Market Comparison by By Material Type (2016-2032)
- Table 64: Eastern Europe Pre Insulated Pipes Market Market Comparison by By Pipe Configuration (2016-2032)
- Table 65: Eastern Europe Pre Insulated Pipes Market Market Comparison by By Installation (2016-2032)
- Table 66: Eastern Europe Pre Insulated Pipes Market Market Comparison by By End User (2016-2032)
- Table 67: Eastern Europe Pre Insulated Pipes Market Revenue (US$ Mn) Comparison by Country (2016-2032)
- Table 68: Eastern Europe Pre Insulated Pipes Market Market Revenue (US$ Mn) (2016-2032)
- Table 69: Eastern Europe Pre Insulated Pipes Market Market Revenue (US$ Mn) Comparison by Country (2016-2032)
- Table 70: Eastern Europe Pre Insulated Pipes Market Market Revenue (US$ Mn) Comparison by By Material Type (2016-2032)
- Table 71: Eastern Europe Pre Insulated Pipes Market Market Revenue (US$ Mn) Comparison by By Pipe Configuration (2016-2032)
- Table 72: Eastern Europe Pre Insulated Pipes Market Market Revenue (US$ Mn) Comparison by By Installation (2016-2032)
- Table 73: Eastern Europe Pre Insulated Pipes Market Market Revenue (US$ Mn) Comparison by By End User (2016-2032)
- Table 74: Eastern Europe Pre Insulated Pipes Market Market Y-o-Y Growth Rate Comparison by Country (2016-2032)
- Table 75: Eastern Europe Pre Insulated Pipes Market Market Y-o-Y Growth Rate Comparison by By Material Type (2016-2032)
- Table 76: Eastern Europe Pre Insulated Pipes Market Market Y-o-Y Growth Rate Comparison by By Pipe Configuration (2016-2032)
- Table 77: Eastern Europe Pre Insulated Pipes Market Market Y-o-Y Growth Rate Comparison by By Installation (2016-2032)
- Table 78: Eastern Europe Pre Insulated Pipes Market Market Y-o-Y Growth Rate Comparison by By End User (2016-2032)
- Table 79: Eastern Europe Pre Insulated Pipes Market Market Share Comparison by Country (2016-2032)
- Table 80: Eastern Europe Pre Insulated Pipes Market Market Share Comparison by By Material Type (2016-2032)
- Table 81: Eastern Europe Pre Insulated Pipes Market Market Share Comparison by By Pipe Configuration (2016-2032)
- Table 82: Eastern Europe Pre Insulated Pipes Market Market Share Comparison by By Installation (2016-2032)
- Table 83: Eastern Europe Pre Insulated Pipes Market Market Share Comparison by By End User (2016-2032)
- Table 84: APAC Pre Insulated Pipes Market Market Comparison by By Material Type (2016-2032)
- Table 85: APAC Pre Insulated Pipes Market Market Comparison by By Pipe Configuration (2016-2032)
- Table 86: APAC Pre Insulated Pipes Market Market Comparison by By Installation (2016-2032)
- Table 87: APAC Pre Insulated Pipes Market Market Comparison by By End User (2016-2032)
- Table 88: APAC Pre Insulated Pipes Market Revenue (US$ Mn) Comparison by Country (2016-2032)
- Table 89: APAC Pre Insulated Pipes Market Market Revenue (US$ Mn) (2016-2032)
- Table 90: APAC Pre Insulated Pipes Market Market Revenue (US$ Mn) Comparison by Country (2016-2032)
- Table 91: APAC Pre Insulated Pipes Market Market Revenue (US$ Mn) Comparison by By Material Type (2016-2032)
- Table 92: APAC Pre Insulated Pipes Market Market Revenue (US$ Mn) Comparison by By Pipe Configuration (2016-2032)
- Table 93: APAC Pre Insulated Pipes Market Market Revenue (US$ Mn) Comparison by By Installation (2016-2032)
- Table 94: APAC Pre Insulated Pipes Market Market Revenue (US$ Mn) Comparison by By End User (2016-2032)
- Table 95: APAC Pre Insulated Pipes Market Market Y-o-Y Growth Rate Comparison by Country (2016-2032)
- Table 96: APAC Pre Insulated Pipes Market Market Y-o-Y Growth Rate Comparison by By Material Type (2016-2032)
- Table 97: APAC Pre Insulated Pipes Market Market Y-o-Y Growth Rate Comparison by By Pipe Configuration (2016-2032)
- Table 98: APAC Pre Insulated Pipes Market Market Y-o-Y Growth Rate Comparison by By Installation (2016-2032)
- Table 99: APAC Pre Insulated Pipes Market Market Y-o-Y Growth Rate Comparison by By End User (2016-2032)
- Table 100: APAC Pre Insulated Pipes Market Market Share Comparison by Country (2016-2032)
- Table 101: APAC Pre Insulated Pipes Market Market Share Comparison by By Material Type (2016-2032)
- Table 102: APAC Pre Insulated Pipes Market Market Share Comparison by By Pipe Configuration (2016-2032)
- Table 103: APAC Pre Insulated Pipes Market Market Share Comparison by By Installation (2016-2032)
- Table 104: APAC Pre Insulated Pipes Market Market Share Comparison by By End User (2016-2032)
- Table 105: Latin America Pre Insulated Pipes Market Market Comparison by By Material Type (2016-2032)
- Table 106: Latin America Pre Insulated Pipes Market Market Comparison by By Pipe Configuration (2016-2032)
- Table 107: Latin America Pre Insulated Pipes Market Market Comparison by By Installation (2016-2032)
- Table 108: Latin America Pre Insulated Pipes Market Market Comparison by By End User (2016-2032)
- Table 109: Latin America Pre Insulated Pipes Market Revenue (US$ Mn) Comparison by Country (2016-2032)
- Table 110: Latin America Pre Insulated Pipes Market Market Revenue (US$ Mn) (2016-2032)
- Table 111: Latin America Pre Insulated Pipes Market Market Revenue (US$ Mn) Comparison by Country (2016-2032)
- Table 112: Latin America Pre Insulated Pipes Market Market Revenue (US$ Mn) Comparison by By Material Type (2016-2032)
- Table 113: Latin America Pre Insulated Pipes Market Market Revenue (US$ Mn) Comparison by By Pipe Configuration (2016-2032)
- Table 114: Latin America Pre Insulated Pipes Market Market Revenue (US$ Mn) Comparison by By Installation (2016-2032)
- Table 115: Latin America Pre Insulated Pipes Market Market Revenue (US$ Mn) Comparison by By End User (2016-2032)
- Table 116: Latin America Pre Insulated Pipes Market Market Y-o-Y Growth Rate Comparison by Country (2016-2032)
- Table 117: Latin America Pre Insulated Pipes Market Market Y-o-Y Growth Rate Comparison by By Material Type (2016-2032)
- Table 118: Latin America Pre Insulated Pipes Market Market Y-o-Y Growth Rate Comparison by By Pipe Configuration (2016-2032)
- Table 119: Latin America Pre Insulated Pipes Market Market Y-o-Y Growth Rate Comparison by By Installation (2016-2032)
- Table 120: Latin America Pre Insulated Pipes Market Market Y-o-Y Growth Rate Comparison by By End User (2016-2032)
- Table 121: Latin America Pre Insulated Pipes Market Market Share Comparison by Country (2016-2032)
- Table 122: Latin America Pre Insulated Pipes Market Market Share Comparison by By Material Type (2016-2032)
- Table 123: Latin America Pre Insulated Pipes Market Market Share Comparison by By Pipe Configuration (2016-2032)
- Table 124: Latin America Pre Insulated Pipes Market Market Share Comparison by By Installation (2016-2032)
- Table 125: Latin America Pre Insulated Pipes Market Market Share Comparison by By End User (2016-2032)
- Table 126: Middle East & Africa Pre Insulated Pipes Market Market Comparison by By Material Type (2016-2032)
- Table 127: Middle East & Africa Pre Insulated Pipes Market Market Comparison by By Pipe Configuration (2016-2032)
- Table 128: Middle East & Africa Pre Insulated Pipes Market Market Comparison by By Installation (2016-2032)
- Table 129: Middle East & Africa Pre Insulated Pipes Market Market Comparison by By End User (2016-2032)
- Table 130: Middle East & Africa Pre Insulated Pipes Market Revenue (US$ Mn) Comparison by Country (2016-2032)
- Table 131: Middle East & Africa Pre Insulated Pipes Market Market Revenue (US$ Mn) (2016-2032)
- Table 132: Middle East & Africa Pre Insulated Pipes Market Market Revenue (US$ Mn) Comparison by Country (2016-2032)
- Table 133: Middle East & Africa Pre Insulated Pipes Market Market Revenue (US$ Mn) Comparison by By Material Type (2016-2032)
- Table 134: Middle East & Africa Pre Insulated Pipes Market Market Revenue (US$ Mn) Comparison by By Pipe Configuration (2016-2032)
- Table 135: Middle East & Africa Pre Insulated Pipes Market Market Revenue (US$ Mn) Comparison by By Installation (2016-2032)
- Table 136: Middle East & Africa Pre Insulated Pipes Market Market Revenue (US$ Mn) Comparison by By End User (2016-2032)
- Table 137: Middle East & Africa Pre Insulated Pipes Market Market Y-o-Y Growth Rate Comparison by Country (2016-2032)
- Table 138: Middle East & Africa Pre Insulated Pipes Market Market Y-o-Y Growth Rate Comparison by By Material Type (2016-2032)
- Table 139: Middle East & Africa Pre Insulated Pipes Market Market Y-o-Y Growth Rate Comparison by By Pipe Configuration (2016-2032)
- Table 140: Middle East & Africa Pre Insulated Pipes Market Market Y-o-Y Growth Rate Comparison by By Installation (2016-2032)
- Table 141: Middle East & Africa Pre Insulated Pipes Market Market Y-o-Y Growth Rate Comparison by By End User (2016-2032)
- Table 142: Middle East & Africa Pre Insulated Pipes Market Market Share Comparison by Country (2016-2032)
- Table 143: Middle East & Africa Pre Insulated Pipes Market Market Share Comparison by By Material Type (2016-2032)
- Table 144: Middle East & Africa Pre Insulated Pipes Market Market Share Comparison by By Pipe Configuration (2016-2032)
- Table 145: Middle East & Africa Pre Insulated Pipes Market Market Share Comparison by By Installation (2016-2032)
- Table 146: Middle East & Africa Pre Insulated Pipes Market Market Share Comparison by By End User (2016-2032)
- 1. Executive Summary
-
- Georg Fischer AG
- Uponor Corporation
- Watts Water Technologies
- LOGSTOR A/S
- Brugg Group Ag
- Polypipe Group PLC
- Vital Energi Utilities Limited
- Perma-Pipe International Holdings Inc.
- Elips - Empower Logstor
- KE KELIT
- Thermaflex International Holding b.v.
- Ecoline S.R.L.
- Aquatherm GmbH
- CPV LTD
- Insul-Pipe Systems
- Thermal Pipe Systems, Inc.
- IPL Pre-Insulated Pipes
- Unifix Plast Pvt. Ltd.
- ZECO Aircon Ltd.
Our Clients


View Our Licence Options
