
Global Pour Point Depressant Market By Type (Ethylene-co-vinyl Acetate (EVA), Polyalphaolefin (PAO), Polyalkyl Methacrylate (PAMA), Styrene Butadiene Copolymer, Ethylene-styrene Copolymer, Others), By Application(Lubricants, Diesel Fuel, Aviation Fuel, Heating Oil, Crude Oil, Others), By End-use(Automotive, Oil & Gas, Aerospace, Marine, Others), By Distribution Channel(Direct Sales, Indirect Sales), By Region And Companies - Industry Segment Outlook, Market Assessment, Competition Scenario, Trends, And Forecast 2024-2033
-
47144
-
June 2024
-
300
-


-
This report was compiled by Shreyas Rokade Shreyas Rokade is a seasoned Research Analyst with CMFE, bringing extensive expertise in market research and consulting, with a strong background in Chemical Engineering. Correspondence Team Lead-CMFE Linkedin | Detailed Market research Methodology Our methodology involves a mix of primary research, including interviews with leading mental health experts, and secondary research from reputable medical journals and databases. View Detailed Methodology Page
-
Quick Navigation
Report Overview
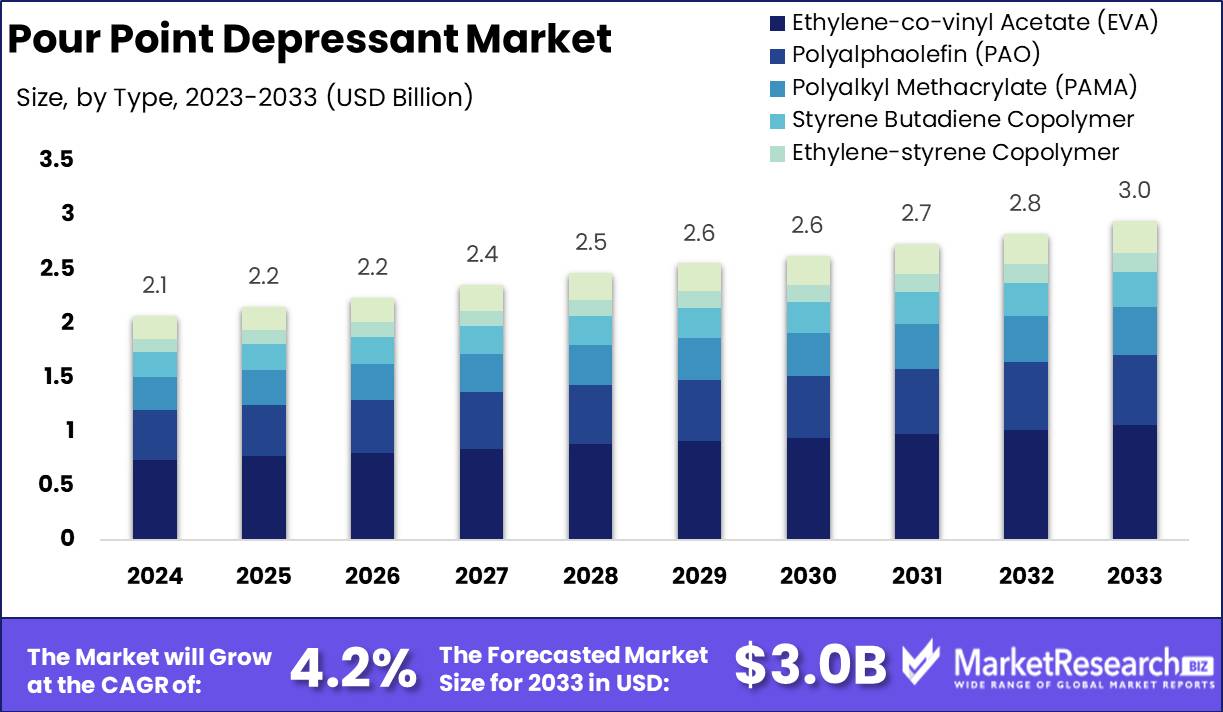
The Global Pour Point Depressant Market was valued at USD 2.1 billion in 2023. It is expected to reach USD 3.0 billion by 2033, with a CAGR of 4.2% during the forecast period from 2024 to 2033.
The Pour Point Depressant Market encompasses a range of specialty chemicals designed to improve the low-temperature flow properties of oils and fuels. These additives effectively lower the pour point, ensuring smooth transportation and operation even in cold climates.
As a product manager, understanding this market is crucial for optimizing product formulations, enhancing operational efficiency, and meeting customer demands. With a steadfast commitment to innovation and quality, this market segment continues to drive advancements in various industries, including automotive, lubricants, and oil & gas, fostering resilience and adaptability in dynamic market landscapes.
The Pour Point Depressant market continues to exhibit promising growth prospects, driven by escalating global crude oil production and the relentless pursuit of enhanced extraction efficiencies. In 2022, the sector witnessed a noteworthy surge, with global crude oil production escalating at a record-breaking rate of 5.4%, surpassing both the previous year's growth of 1.6% and the 2010-2019 average of 1.3% annually.
This remarkable uptick was propelled by robust economic expansion worldwide and the incremental adjustments in OPEC+ crude oil production, totaling 0.4 million barrels per day each month, leading to the eventual phasing out of the 5.8 million barrels per day production adjustment.
Furthermore, projections for 2023 indicate a continuation of this upward trajectory, with global oil demand poised to escalate by 1.9 million barrels per day, reaching an unprecedented 101.7 million barrels per day. A significant portion of this surge is attributed to China, buoyed by the relaxation of Covid restrictions, exemplifying the interplay between geopolitical factors and market dynamics.
Against this backdrop, the escalating demand for Pour Point Depressants is underscored by the indispensable role they play in mitigating the adverse effects of low-temperature conditions on crude oil viscosity. The concomitant rise in West Texas Intermediate (WTI) and Brent crude prices, averaging $94 and $101 per barrel in 2022, respectively, denotes a substantial increase of approximately 39% and 43% compared to previous levels, further accentuating the imperative for effective pour point depressant solutions.
Key Takeaways
- Market Growth: The Global Pour Point Depressant Market was valued at USD 2.1 billion in 2023. It is expected to reach USD 3.0 billion by 2033, with a CAGR of 4.2% during the forecast period from 2024 to 2033.
- By Type: Type Ethylene-co-vinyl Acetate (EVA) dominates with a share of 36.1%.
- By Application: Lubricants application leads the market, commanding 47.4% market share.
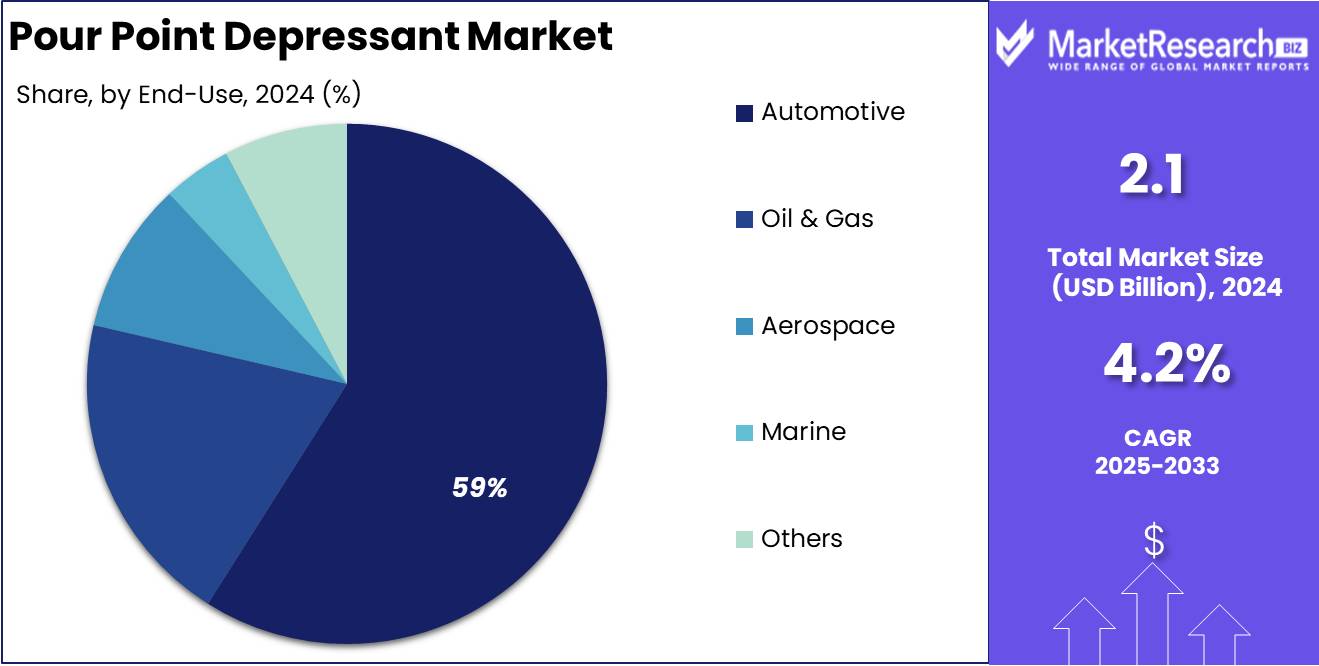
- By End-use: Automotive sector emerges as the primary end-user, claiming 59.9%.
- By Distribution Channel: The direct sales channel dominates distribution, capturing a significant 70.6% share.
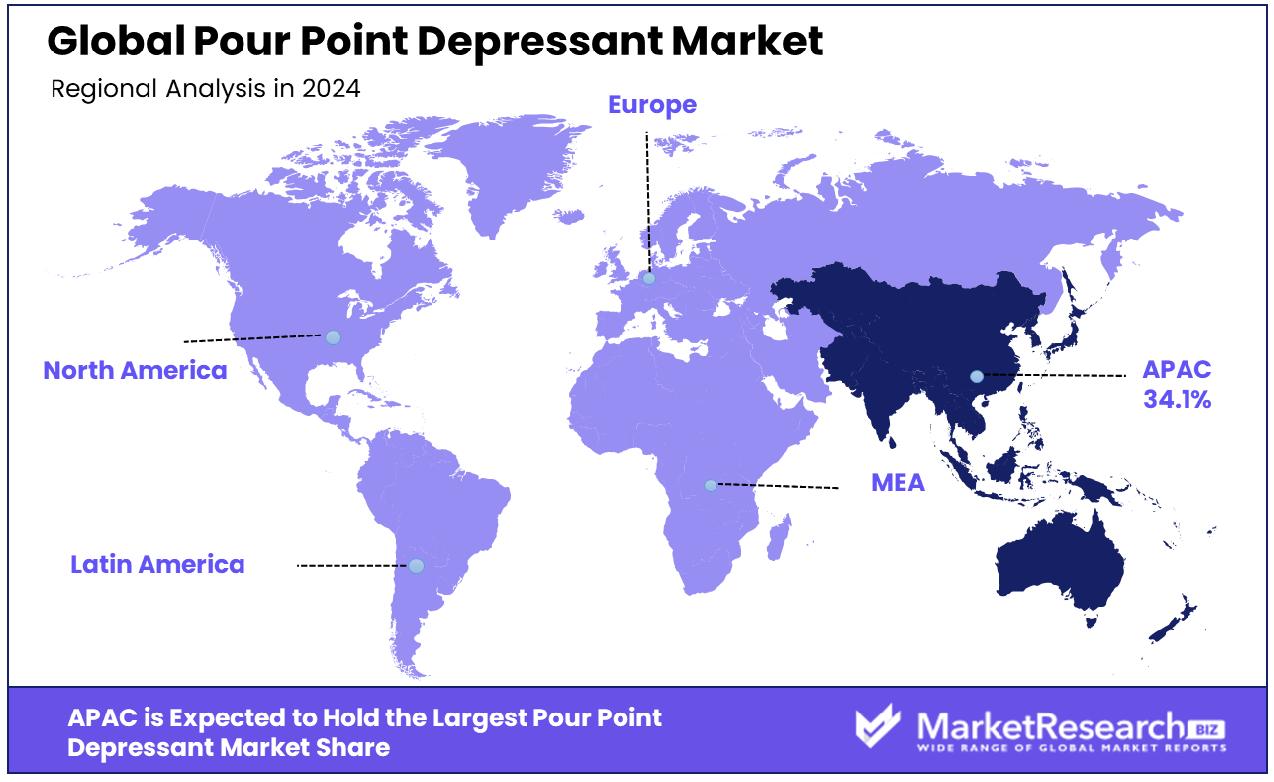
- Regional Dominance: In the Asia Pacific region, the Pour Point Depressant market has grown by 34%.
- Growth Opportunity: In 2023, the global Pour Point Depressant market sees growth opportunities fueled by eco-friendly technological advancements and the expanding cold chain logistics sector, driving demand for efficient solutions.
Driving factors
Increasing Demand in Oil and Gas Exploration and Production
The Pour Point Depressant Market is witnessing robust growth, propelled by the escalating demand within the oil and gas sector. With the surge in exploration and production activities globally, there's a corresponding need for pour point depressants to mitigate the challenges posed by low temperatures.
As oil and gas companies delve into harsher environments and deeper reserves, the demand for pour point depressants intensifies. This is particularly evident in regions with extreme weather conditions, where the efficient flow of crude oil is imperative for uninterrupted operations. Statistics indicate a significant uptick in the adoption of pour point depressants, with a notable increase in procurement volumes by oil and gas firms.
Efficient Transportation and Storage Needs
The necessity for streamlined transportation and storage solutions for crude oil and petroleum products is a key driver propelling the Pour Point Depressant Market. As logistical complexities mount due to the expansion of global trade networks, the demand for pour point depressants grows.
These compounds enable the efficient flow of crude oil and petroleum derivatives through pipelines, tankers, and storage facilities, mitigating the risk of blockages and operational disruptions. Market statistics underscore the steady rise in the deployment of pour point depressants across various transportation and storage infrastructures, reflecting the industry's reliance on these additives to optimize operational efficiency.
Expansion in Automotive and Aviation Industries
The expansion of the automotive and aviation sectors serves as a significant catalyst for the Pour Point Depressant Market, fostering heightened demand for lubricants and fuels. Pour point depressants play a pivotal role in ensuring the fluidity and performance of automotive lubricants and fuels, particularly in regions experiencing suboptimal temperatures.
With the automotive and aviation industries expanding globally, the consumption of pour point depressants is on an upward trajectory. Market data highlights a substantial increase in the consumption of lubricants and fuels treated with pour point depressants, underscoring their integral role in sustaining the operational integrity of vehicles and aircraft in diverse climatic conditions.
Restraining Factors
Impact of Crude Oil Price Volatility
The Pour Point Depressant Market encounters significant challenges due to the inherent volatility of crude oil prices, which directly influences investment decisions in oil and gas projects. Fluctuations in oil prices can deter exploration and production activities, subsequently impacting the demand for pour point depressants.
During periods of low oil prices, companies often scale back on exploration and production endeavors, resulting in reduced procurement of pour point depressants. Conversely, when oil prices soar, there may be increased investment in oil and gas projects, leading to a surge in demand for pour point depressants. Market statistics demonstrate a correlation between crude oil price trends and the fluctuations in the Pour Point Depressant Market, highlighting the market's susceptibility to external economic factors.
Environmental Concerns and Regulatory Challenges
Environmental apprehensions surrounding the use and disposal of pour point depressants pose significant constraints to market growth, precipitating regulatory challenges and potential restrictions. As awareness regarding environmental sustainability mounts, stakeholders across industries express growing concerns regarding the ecological impact of pour point depressants. Regulatory bodies increasingly scrutinize the chemical composition and disposal practices associated with these additives, imposing stringent guidelines to mitigate environmental risks.
Compliance with evolving regulatory frameworks necessitates investments in research and development to develop eco-friendly alternatives or enhance the biodegradability of existing formulations. Market data indicates a growing emphasis on sustainable practices within the Pour Point Depressant Market, with companies striving to align their product offerings with stringent environmental standards to mitigate regulatory risks and sustain long-term growth.
By Type Analysis
Type Ethylene-co-vinyl Acetate (EVA) dominates with a 36.1% market share, indicating significant industry preference.
In 2023, Ethylene-co-vinyl Acetate (EVA) held a dominant market position in the "By Type" segment of the Pour Point Depressant Market, capturing more than a 36.1% share. The remarkable performance of Ethylene-co-vinyl Acetate (EVA) can be attributed to its superior properties, including excellent low-temperature flexibility, compatibility with various base oils, and cost-effectiveness. Moreover, the growing demand for EVA-based pour point depressants across diverse end-user industries such as automotive, transportation, and industrial lubricants further propelled its market dominance.
Following closely behind EVA, Polyalphaolefin (PAO) emerged as another significant player in the Pour Point Depressant Market, securing a substantial market share. PAO-based pour point depressants are renowned for their exceptional thermal stability, high viscosity index, and compatibility with synthetic and mineral base oils. The widespread adoption of PAO in high-performance lubricants, hydraulic fluids, and gear oils contributed significantly to its market penetration and competitive standing.
Polyalkyl Methacrylate (PAMA), Styrene Butadiene Copolymer, and Ethylene-styrene Copolymer also commanded notable shares in the Pour Point Depressant Market, each offering distinct advantages and catering to specific application requirements. These polymers are valued for their ability to improve the low-temperature flow properties of lubricants, thereby enhancing equipment performance and longevity.
Additionally, the "Others" category encompassed various pour point depressant types, including alkylated naphthalenes, alkylated aromatic compounds, and polymethyl methacrylate (PMMA). While these alternatives held relatively smaller market shares, they played pivotal roles in niche applications and niche markets within the Pour Point Depressant Market landscape.
By Application Analysis
Lubricants claim the largest application share at 47.4%, reflecting their widespread use and demand.
In 2023, Lubricants held a dominant market position in the "By Application" segment of the Pour Point Depressant Market, capturing more than a 47.4% share. The commanding presence of lubricants in this segment underscores their indispensable role in various industries, including automotive, manufacturing, marine, and aerospace. Lubricants fortified with pour point depressants are vital for ensuring optimal equipment performance, mitigating frictional wear, and extending machinery service life, thus driving their widespread adoption across diverse end-user sectors.
Following lubricants, Diesel Fuel emerged as another significant application segment within the Pour Point Depressant Market, securing a substantial market share. Diesel fuel additives fortified with pour point depressants play a crucial role in improving low-temperature operability, preventing wax crystallization, and enhancing fuel flow properties, particularly in cold climates or during winter months. The reliance on diesel-powered vehicles, machinery, and equipment across transportation, construction, and agricultural sectors fueled the demand for pour point depressants in diesel fuel formulations.
Aviation Fuel, Heating Oil, and Crude Oil also represented notable segments in the Pour Point Depressant Market, each catering to specific industry requirements and operational conditions. Pour point depressants are integral additives in aviation fuel formulations to maintain fuel fluidity at high altitudes and low temperatures, ensuring safe and efficient aircraft operation. Similarly, heating oil treated with pour point depressants facilitates smooth fuel delivery and combustion in residential, commercial, and industrial heating systems, especially in cold weather regions.
The "Others" category encompassed miscellaneous applications such as hydraulic fluids, transformer oils, and specialty chemicals, showcasing the versatility of pour point depressants across a spectrum of industrial applications. Overall, the Pour Point Depressant Market witnessed sustained growth driven by the indispensable role of pour point depressants in enhancing fluid performance and reliability across diverse end-use sectors.
By End-use Analysis
The automotive sector leads in end-use, capturing a commanding 59.9% market share.
In 2023, Automotive held a dominant market position in the "By End-use" segment of the Pour Point Depressant Market, capturing more than a 59.9% share. The robust dominance of the automotive sector underscores its substantial reliance on pour point depressants to ensure the efficient operation of engines and drivetrains in a wide array of vehicles. Pour point depressants are integral additives in automotive lubricants, helping to maintain fluidity and prevent wax crystallization in engine oils, transmission fluids, and hydraulic fluids, thereby safeguarding engine performance and longevity.
Following automotive, Oil & Gas emerged as another significant end-use segment within the Pour Point Depressant Market, securing a notable market share. Pour point depressants play a critical role in enhancing the flow properties of crude oil during extraction, transportation, and refining processes, especially in cold climates or subsea environments. Additionally, pour point depressants are essential additives in lubricants and fuels used in oil and gas exploration, drilling, and production operations, ensuring operational reliability and efficiency.
Aerospace, Marine, and Other industries also represented important segments in the Pour Point Depressant Market, each with distinct application requirements and operational challenges. Pour point depressants are essential in aerospace lubricants to maintain fluidity and prevent gelling at high altitudes and low temperatures, ensuring the safety and reliability of aircraft systems. Similarly, in the marine sector, pour point depressants facilitate smooth fuel flow and engine operation in marine vessels, enhancing maritime transportation efficiency and reliability.
The "Others" category encompasses various niche applications such as power generation, mining, and construction, highlighting the diverse industrial applications of pour point depressants beyond the primary sectors. Overall, the Pour Point Depressant Market exhibited significant growth driven by the indispensable role of Pour Point Depressants in ensuring the reliable operation of machinery and equipment across diverse end-use industries.
By Distribution Channel Analysis
Direct sales stand out as the predominant distribution channel, commanding a substantial 70.6% share.
In 2023, Direct Sales held a dominant market position in the "By Distribution Channel" segment of the Pour Point Depressant Market, capturing more than a 70.6% share. The significant dominance of direct sales channels underscores the preferred mode of procurement for pour point depressants among end-users and industrial consumers. Direct sales channels enable manufacturers and suppliers to establish direct relationships with customers, offering personalized service, tailored solutions, and timely delivery, thereby enhancing customer satisfaction and loyalty.
Conversely, Indirect Sales represented another distribution channel within the Pour Point Depressant Market, albeit with a relatively smaller market share compared to direct sales. Indirect sales channels encompass distributors, wholesalers, retailers, and online marketplaces that facilitate the sale and distribution of pour point depressants to end-users. While indirect sales channels provide convenience and accessibility to a broader customer base, they often involve intermediaries, which may lead to higher costs and longer lead times compared to direct sales channels.
The dominance of direct sales channels in the Pour Point Depressant Market can be attributed to several factors, including the complex nature of industrial applications, the need for technical expertise and product customization, and the emphasis on quality assurance and regulatory compliance. Manufacturers and suppliers leverage direct sales channels to deliver value-added services such as technical support, product training, and after-sales service, thereby strengthening their market position and competitive advantage.
Overall, the Pour Point Depressant Market witnessed robust growth driven by the dominance of direct sales channels, which facilitate seamless interactions between manufacturers and end-users, ensuring the timely availability of high-quality pour point depressants tailored to meet specific application requirements and industry standards.
Key Market Segments
By Type
- Ethylene-co-vinyl Acetate (EVA)
- Polyalphaolefin (PAO)
- Polyalkyl Methacrylate (PAMA)
- Styrene Butadiene Copolymer
- Ethylene-styrene Copolymer
- Others
By Application
- Lubricants
- Diesel Fuel
- Aviation Fuel
- Heating Oil
- Crude Oil
- Others
By End-use
- Automotive
- Oil & Gas
- Aerospace
- Marine
- Others
By Distribution Channel
- Direct Sales
- Indirect Sales
Growth Opportunity
Technological Advancements Driving Eco-Friendly Solutions
The global Pour Point Depressant (PPD) market is poised for substantial growth in 2023, buoyed by significant technological advancements. These advancements are fostering the development of eco-friendly and highly efficient pour point depressants, aligning with the growing consumer demand for sustainable solutions.
Manufacturers are investing in research and development to innovate PPDs that not only effectively lower the pour point of oils and lubricants but also minimize environmental impact. This trend is likely to attract environmentally conscious industries such as automotive, aerospace, and manufacturing, thereby expanding the market's scope.
Expansion of Cold Chain Logistics
The cold chain logistics sector is experiencing robust expansion, driven by increasing demand for temperature-sensitive goods transportation. This expansion presents a ripe opportunity for the global PPD market, particularly in refrigeration systems. Pour point depressants play a crucial role in ensuring the smooth flow of refrigerants and lubricants, especially in low-temperature environments.
As cold chain logistics become more integral to various industries including food and pharmaceuticals, the demand for efficient PPDs is expected to surge. Market players can capitalize on this trend by offering tailored solutions that meet the stringent requirements of cold chain logistics, further propelling market growth.
Latest Trends
Rise of Bio-Based Solutions
In 2023, the global Pour Point Depressant (PPD) market witnessed a notable trend towards bio-based alternatives, reflecting a broader shift toward sustainability. With growing environmental concerns, industries are increasingly inclined towards eco-friendly solutions, prompting manufacturers to invest in bio-based PPD research and development.
These alternatives offer comparable performance to traditional PPDs while reducing carbon footprint, aligning with corporate sustainability goals and regulatory standards. As consumer awareness of environmental impact grows, the demand for bio-based pour point depressants is expected to escalate, driving market growth.
Integration of Nanotechnology
Another significant trend shaping the global PPD market in 2023 is the integration of nanotechnology to enhance performance and efficiency. Nanotechnology offers precise control over particle size and distribution, enabling the development of pour point depressants with superior properties such as improved dispersibility and stability.
By leveraging nanomaterials, manufacturers can optimize the effectiveness of PPDs even at lower concentrations, leading to cost savings and enhanced performance across various applications. The adoption of nanotechnology in PPD formulation represents a strategic approach to meet evolving industry demands for high-performance additives, driving innovation and competitiveness in the market.
Regional Analysis
The Pour Point Depressant market in Asia Pacific captures a significant share of 34%.
In North America, the Pour Point Depressant (PPD) market maintains a steady growth trajectory, driven primarily by the region's well-established automotive and manufacturing sectors. The demand for PPDs is fueled by the need to enhance lubricant performance in extreme temperature conditions, particularly in colder regions. According to recent market data, North America accounts for approximately 28% of the global PPD market share, making it a significant contributor to the industry's overall growth. Major players in this region focus on innovation and product development to cater to diverse industrial applications.
Europe represents a mature market for Pour Point Depressants, characterized by stringent environmental regulations and a strong emphasis on sustainability. The region's automotive and transportation sectors are key consumers of PPDs, driving the demand for eco-friendly and efficient solutions. Despite market maturity, Europe maintains a substantial market share, contributing around 25% to the global PPD market. Market players leverage advanced technologies and strategic partnerships to address evolving customer demands and regulatory requirements.
Asia Pacific emerges as the dominating region in the global Pour Point Depressant market, commanding a significant share of 34%. The region's rapid industrialization, particularly in emerging economies such as China and India, drives robust demand for lubricants and additives. Moreover, the expansion of cold chain logistics and automotive sectors further propels the need for PPDs. With an increasing focus on sustainability and technological advancements, Asia Pacific is poised for continued market growth and innovation.
Middle East & Africa and Latin America regions exhibit a growing demand for Pour Point Depressants, fueled by expanding industrial activities and infrastructure development. While these regions account for a smaller share compared to others, they present untapped opportunities for market players to capitalize on. Key strategies include market expansion, product diversification, and partnerships with local distributors to penetrate these emerging markets effectively.
Key Regions and Countries
North America
- The US
- Canada
- Rest of North America
Europe
- Germany
- France
- The UK
- Spain
- Netherlands
- Russia
- Italy
- Rest of Europe
Asia-Pacific
- China
- Japan
- Singapore
- Thailand
- South Korea
- Vietnam
- India
- New Zealand
- Rest of Asia Pacific
Latin America
- Mexico
- Brazil
- Rest of Latin America
Middle East & Africa
- Saudi Arabia
- South Africa
- UAE
- Rest of Middle East & Africa
Key Players Analysis
In 2023, the global Pour Point Depressant Market witnessed dynamic competition and strategic maneuvers among key players, each vying for a prominent position in this lucrative sector. Notably, a comprehensive analysis reveals key companies driving significant impact and influence within the market landscape.
Afton Chemical, BASF SE, Chevron Phillips Chemical Company, CLARIANT, Croda International Plc, and Ecolab emerge as frontrunners, leveraging their extensive research and development capabilities to innovate and introduce cutting-edge pour point depressant solutions. These companies have established formidable market presence, underpinned by robust distribution networks and strategic collaborations, thereby solidifying their foothold in key regional markets.
Furthermore, Evonik Oil Additives USA, Inc., Infineum International Limited, Innospec, Lariant, and Lead Oilfield Solutions Company exhibit commendable resilience and adaptability, navigating through market complexities with agility and foresight. Their proactive approach to market dynamics, coupled with a focus on product diversification and customization, positions them favorably to capitalize on evolving consumer preferences and regulatory landscapes.
Moreover, Puyang Jiahua Chemical Co., Ltd., Sanyo Chemical Industries, Ltd., Shenyang Great Wall Lubricating Oil Manufacturing Co., Ltd., and The Lubrizol Corporation demonstrate an unwavering commitment to quality and sustainability, aligning their business strategies with prevailing environmental imperatives and consumer demand for eco-friendly solutions.
In essence, the global Pour Point Depressant Market in 2023 is characterized by intense competition and innovation-driven growth, with these key players poised to shape the industry's trajectory through their collective pursuit of excellence and market leadership.
Market Key Players
- Afton Chemical
- BASF SE
- Chevron Phillips Chemical Company
- CLARIANT
- Croda International Plc
- Ecolab
- Evonik Oil Additives USA, Inc.
- Infineum International Limited.
- Innospec
- Lariant
- Lead Oilfield Solutions Company
- Puyang Jiahua Chemical Co., Ltd.
- Sanyo Chemical Industries, Ltd.
- Shenyang Great Wall Lubricating Oil Manufacturing Co., Ltd,
- The Lubrizol Corporation
Recent Development
- In January 2021, Rislone introduced Gear Repair, a treatment additive designed to extend gear system life by stopping leaks, reducing noise, and improving performance in automotive, heavy-duty, marine, and industrial gear oils.
- In May 2018, Noria Corporation provided a comprehensive guide on lubricant additives, emphasizing their roles in enhancing, suppressing, and imparting properties to base oils. The guide highlights the importance of monitoring additive health for optimal equipment performance.
Report Scope
Report Features Description Market Value (2023) USD 2.1 Billion Forecast Revenue (2033) USD 3.0 Billion CAGR (2024-2032) 4.2% Base Year for Estimation 2023 Historic Period 2016-2023 Forecast Period 2024-2033 Report Coverage Revenue Forecast, Market Dynamics, COVID-19 Impact, Competitive Landscape, Recent Developments Segments Covered By Type (Ethylene-co-vinyl Acetate (EVA), Polyalphaolefin (PAO), Polyalkyl Methacrylate (PAMA), Styrene Butadiene Copolymer, Ethylene-styrene Copolymer, Others), By Application(Lubricants, Diesel Fuel, Aviation Fuel, Heating Oil, Crude Oil, Others), By End-use(Automotive, Oil & Gas, Aerospace, Marine, Others), By Distribution Channel(Direct Sales, Indirect Sales) Regional Analysis North America - The US, Canada, Rest of North America, Europe - Germany, France, The UK, Spain, Italy, Russia, Netherlands, Rest of Europe, Asia-Pacific - China, Japan, South Korea, India, New Zealand, Singapore, Thailand, Vietnam, Rest of Asia Pacific, Latin America - Brazil, Mexico, Rest of Latin America, Middle East & Africa - South Africa, Saudi Arabia, UAE, Rest of Middle East & Africa Competitive Landscape Afton Chemical, BASF SE, Chevron Phillips Chemical Company, CLARIANT, Croda International Plc, Ecolab, Evonik Oil Additives USA, Inc., Infineum International Limited., Innospec, Lariant, Lead Oilfield Solutions Company, Puyang Jiahua Chemical Co., Ltd., Sanyo Chemical Industries, Ltd., Shenyang Great Wall Lubricating Oil Manufacturing Co.,Ltd,, The Lubrizol Corporation Customization Scope Customization for segments, region/country-level will be provided. Moreover, additional customization can be done based on the requirements. Purchase Options We have three licenses to opt for Single User License, Multi-User License (Up to 5 Users), Corporate Use License (Unlimited User and Printable PDF) -
- 1. Executive Summary
- 1.1. Definition
- 1.2. Taxonomy
- 1.3. Research Scope
- 1.4. Key Analysis
- 1.5. Key Findings by Major Segments
- 1.6. Top strategies by Major Players
- 2. Global Pour Point Depressant Market Overview
- 2.1. Pour Point Depressant Market Dynamics
- 2.1.1. Drivers
- 2.1.2. Opportunities
- 2.1.3. Restraints
- 2.1.4. Challenges
- 2.2. Macro-economic Factors
- 2.3. Regulatory Framework
- 2.4. Market Investment Feasibility Index
- 2.5. PEST Analysis
- 2.6. PORTER’S Five Force Analysis
- 2.7. Drivers & Restraints Impact Analysis
- 2.8. Industry Chain Analysis
- 2.9. Cost Structure Analysis
- 2.10. Marketing Strategy
- 2.11. Russia-Ukraine War Impact Analysis
- 2.12. Opportunity Map Analysis
- 2.13. Market Competition Scenario Analysis
- 2.14. Product Life Cycle Analysis
- 2.15. Opportunity Orbits
- 2.16. Manufacturer Intensity Map
- 2.17. Major Companies sales by Value & Volume
- 2.1. Pour Point Depressant Market Dynamics
- 3. Global Pour Point Depressant Market Analysis, Opportunity and Forecast, 2016-2032
- 3.1. Global Pour Point Depressant Market Analysis, 2016-2021
- 3.2. Global Pour Point Depressant Market Opportunity and Forecast, 2023-2032
- 3.3. Global Pour Point Depressant Market Analysis, Opportunity and Forecast, By By Type , 2016-2032
- 3.3.1. Global Pour Point Depressant Market Analysis by By Type : Introduction
- 3.3.2. Market Size Absolute $ Opportunity Analysis and Forecast, By By Type , 2016-2032
- 3.3.3. Ethylene-co-vinyl Acetate (EVA)
- 3.3.4. Polyalphaolefin (PAO)
- 3.3.5. Polyalkyl Methacrylate (PAMA)
- 3.3.6. Styrene Butadiene Copolymer
- 3.3.7. Ethylene-styrene Copolymer
- 3.3.8. Others
- 3.4. Global Pour Point Depressant Market Analysis, Opportunity and Forecast, By By Application, 2016-2032
- 3.4.1. Global Pour Point Depressant Market Analysis by By Application: Introduction
- 3.4.2. Market Size Absolute $ Opportunity Analysis and Forecast, By By Application, 2016-2032
- 3.4.3. Lubricants
- 3.4.4. Diesel Fuel
- 3.4.5. Aviation Fuel
- 3.4.6. Heating Oil
- 3.4.7. Crude Oil
- 3.4.8. Others
- 3.5. Global Pour Point Depressant Market Analysis, Opportunity and Forecast, By By End-use , 2016-2032
- 3.5.1. Global Pour Point Depressant Market Analysis by By End-use : Introduction
- 3.5.2. Market Size Absolute $ Opportunity Analysis and Forecast, By By End-use , 2016-2032
- 3.5.3. Automotive
- 3.5.4. Oil & Gas
- 3.5.5. Aerospace
- 3.5.6. Marine
- 3.5.7. Others
- 3.6. Global Pour Point Depressant Market Analysis, Opportunity and Forecast, By By Distribution Channel, 2016-2032
- 3.6.1. Global Pour Point Depressant Market Analysis by By Distribution Channel: Introduction
- 3.6.2. Market Size Absolute $ Opportunity Analysis and Forecast, By By Distribution Channel, 2016-2032
- 3.6.3. Direct Sales
- 3.6.4. Indirect Sales
- 4. North America Pour Point Depressant Market Analysis, Opportunity and Forecast, 2016-2032
- 4.1. North America Pour Point Depressant Market Analysis, 2016-2021
- 4.2. North America Pour Point Depressant Market Opportunity and Forecast, 2023-2032
- 4.3. North America Pour Point Depressant Market Analysis, Opportunity and Forecast, By By Type , 2016-2032
- 4.3.1. North America Pour Point Depressant Market Analysis by By Type : Introduction
- 4.3.2. Market Size Absolute $ Opportunity Analysis and Forecast, By By Type , 2016-2032
- 4.3.3. Ethylene-co-vinyl Acetate (EVA)
- 4.3.4. Polyalphaolefin (PAO)
- 4.3.5. Polyalkyl Methacrylate (PAMA)
- 4.3.6. Styrene Butadiene Copolymer
- 4.3.7. Ethylene-styrene Copolymer
- 4.3.8. Others
- 4.4. North America Pour Point Depressant Market Analysis, Opportunity and Forecast, By By Application, 2016-2032
- 4.4.1. North America Pour Point Depressant Market Analysis by By Application: Introduction
- 4.4.2. Market Size Absolute $ Opportunity Analysis and Forecast, By By Application, 2016-2032
- 4.4.3. Lubricants
- 4.4.4. Diesel Fuel
- 4.4.5. Aviation Fuel
- 4.4.6. Heating Oil
- 4.4.7. Crude Oil
- 4.4.8. Others
- 4.5. North America Pour Point Depressant Market Analysis, Opportunity and Forecast, By By End-use , 2016-2032
- 4.5.1. North America Pour Point Depressant Market Analysis by By End-use : Introduction
- 4.5.2. Market Size Absolute $ Opportunity Analysis and Forecast, By By End-use , 2016-2032
- 4.5.3. Automotive
- 4.5.4. Oil & Gas
- 4.5.5. Aerospace
- 4.5.6. Marine
- 4.5.7. Others
- 4.6. North America Pour Point Depressant Market Analysis, Opportunity and Forecast, By By Distribution Channel, 2016-2032
- 4.6.1. North America Pour Point Depressant Market Analysis by By Distribution Channel: Introduction
- 4.6.2. Market Size Absolute $ Opportunity Analysis and Forecast, By By Distribution Channel, 2016-2032
- 4.6.3. Direct Sales
- 4.6.4. Indirect Sales
- 4.7. North America Pour Point Depressant Market Analysis, Opportunity and Forecast, By Country , 2016-2032
- 4.7.1. North America Pour Point Depressant Market Analysis by Country : Introduction
- 4.7.2. Market Size Absolute $ Opportunity Analysis and Forecast, Country , 2016-2032
- 4.7.2.1. The US
- 4.7.2.2. Canada
- 4.7.2.3. Mexico
- 5. Western Europe Pour Point Depressant Market Analysis, Opportunity and Forecast, 2016-2032
- 5.1. Western Europe Pour Point Depressant Market Analysis, 2016-2021
- 5.2. Western Europe Pour Point Depressant Market Opportunity and Forecast, 2023-2032
- 5.3. Western Europe Pour Point Depressant Market Analysis, Opportunity and Forecast, By By Type , 2016-2032
- 5.3.1. Western Europe Pour Point Depressant Market Analysis by By Type : Introduction
- 5.3.2. Market Size Absolute $ Opportunity Analysis and Forecast, By By Type , 2016-2032
- 5.3.3. Ethylene-co-vinyl Acetate (EVA)
- 5.3.4. Polyalphaolefin (PAO)
- 5.3.5. Polyalkyl Methacrylate (PAMA)
- 5.3.6. Styrene Butadiene Copolymer
- 5.3.7. Ethylene-styrene Copolymer
- 5.3.8. Others
- 5.4. Western Europe Pour Point Depressant Market Analysis, Opportunity and Forecast, By By Application, 2016-2032
- 5.4.1. Western Europe Pour Point Depressant Market Analysis by By Application: Introduction
- 5.4.2. Market Size Absolute $ Opportunity Analysis and Forecast, By By Application, 2016-2032
- 5.4.3. Lubricants
- 5.4.4. Diesel Fuel
- 5.4.5. Aviation Fuel
- 5.4.6. Heating Oil
- 5.4.7. Crude Oil
- 5.4.8. Others
- 5.5. Western Europe Pour Point Depressant Market Analysis, Opportunity and Forecast, By By End-use , 2016-2032
- 5.5.1. Western Europe Pour Point Depressant Market Analysis by By End-use : Introduction
- 5.5.2. Market Size Absolute $ Opportunity Analysis and Forecast, By By End-use , 2016-2032
- 5.5.3. Automotive
- 5.5.4. Oil & Gas
- 5.5.5. Aerospace
- 5.5.6. Marine
- 5.5.7. Others
- 5.6. Western Europe Pour Point Depressant Market Analysis, Opportunity and Forecast, By By Distribution Channel, 2016-2032
- 5.6.1. Western Europe Pour Point Depressant Market Analysis by By Distribution Channel: Introduction
- 5.6.2. Market Size Absolute $ Opportunity Analysis and Forecast, By By Distribution Channel, 2016-2032
- 5.6.3. Direct Sales
- 5.6.4. Indirect Sales
- 5.7. Western Europe Pour Point Depressant Market Analysis, Opportunity and Forecast, By Country , 2016-2032
- 5.7.1. Western Europe Pour Point Depressant Market Analysis by Country : Introduction
- 5.7.2. Market Size Absolute $ Opportunity Analysis and Forecast, Country , 2016-2032
- 5.7.2.1. Germany
- 5.7.2.2. France
- 5.7.2.3. The UK
- 5.7.2.4. Spain
- 5.7.2.5. Italy
- 5.7.2.6. Portugal
- 5.7.2.7. Ireland
- 5.7.2.8. Austria
- 5.7.2.9. Switzerland
- 5.7.2.10. Benelux
- 5.7.2.11. Nordic
- 5.7.2.12. Rest of Western Europe
- 6. Eastern Europe Pour Point Depressant Market Analysis, Opportunity and Forecast, 2016-2032
- 6.1. Eastern Europe Pour Point Depressant Market Analysis, 2016-2021
- 6.2. Eastern Europe Pour Point Depressant Market Opportunity and Forecast, 2023-2032
- 6.3. Eastern Europe Pour Point Depressant Market Analysis, Opportunity and Forecast, By By Type , 2016-2032
- 6.3.1. Eastern Europe Pour Point Depressant Market Analysis by By Type : Introduction
- 6.3.2. Market Size Absolute $ Opportunity Analysis and Forecast, By By Type , 2016-2032
- 6.3.3. Ethylene-co-vinyl Acetate (EVA)
- 6.3.4. Polyalphaolefin (PAO)
- 6.3.5. Polyalkyl Methacrylate (PAMA)
- 6.3.6. Styrene Butadiene Copolymer
- 6.3.7. Ethylene-styrene Copolymer
- 6.3.8. Others
- 6.4. Eastern Europe Pour Point Depressant Market Analysis, Opportunity and Forecast, By By Application, 2016-2032
- 6.4.1. Eastern Europe Pour Point Depressant Market Analysis by By Application: Introduction
- 6.4.2. Market Size Absolute $ Opportunity Analysis and Forecast, By By Application, 2016-2032
- 6.4.3. Lubricants
- 6.4.4. Diesel Fuel
- 6.4.5. Aviation Fuel
- 6.4.6. Heating Oil
- 6.4.7. Crude Oil
- 6.4.8. Others
- 6.5. Eastern Europe Pour Point Depressant Market Analysis, Opportunity and Forecast, By By End-use , 2016-2032
- 6.5.1. Eastern Europe Pour Point Depressant Market Analysis by By End-use : Introduction
- 6.5.2. Market Size Absolute $ Opportunity Analysis and Forecast, By By End-use , 2016-2032
- 6.5.3. Automotive
- 6.5.4. Oil & Gas
- 6.5.5. Aerospace
- 6.5.6. Marine
- 6.5.7. Others
- 6.6. Eastern Europe Pour Point Depressant Market Analysis, Opportunity and Forecast, By By Distribution Channel, 2016-2032
- 6.6.1. Eastern Europe Pour Point Depressant Market Analysis by By Distribution Channel: Introduction
- 6.6.2. Market Size Absolute $ Opportunity Analysis and Forecast, By By Distribution Channel, 2016-2032
- 6.6.3. Direct Sales
- 6.6.4. Indirect Sales
- 6.7. Eastern Europe Pour Point Depressant Market Analysis, Opportunity and Forecast, By Country , 2016-2032
- 6.7.1. Eastern Europe Pour Point Depressant Market Analysis by Country : Introduction
- 6.7.2. Market Size Absolute $ Opportunity Analysis and Forecast, Country , 2016-2032
- 6.7.2.1. Russia
- 6.7.2.2. Poland
- 6.7.2.3. The Czech Republic
- 6.7.2.4. Greece
- 6.7.2.5. Rest of Eastern Europe
- 7. APAC Pour Point Depressant Market Analysis, Opportunity and Forecast, 2016-2032
- 7.1. APAC Pour Point Depressant Market Analysis, 2016-2021
- 7.2. APAC Pour Point Depressant Market Opportunity and Forecast, 2023-2032
- 7.3. APAC Pour Point Depressant Market Analysis, Opportunity and Forecast, By By Type , 2016-2032
- 7.3.1. APAC Pour Point Depressant Market Analysis by By Type : Introduction
- 7.3.2. Market Size Absolute $ Opportunity Analysis and Forecast, By By Type , 2016-2032
- 7.3.3. Ethylene-co-vinyl Acetate (EVA)
- 7.3.4. Polyalphaolefin (PAO)
- 7.3.5. Polyalkyl Methacrylate (PAMA)
- 7.3.6. Styrene Butadiene Copolymer
- 7.3.7. Ethylene-styrene Copolymer
- 7.3.8. Others
- 7.4. APAC Pour Point Depressant Market Analysis, Opportunity and Forecast, By By Application, 2016-2032
- 7.4.1. APAC Pour Point Depressant Market Analysis by By Application: Introduction
- 7.4.2. Market Size Absolute $ Opportunity Analysis and Forecast, By By Application, 2016-2032
- 7.4.3. Lubricants
- 7.4.4. Diesel Fuel
- 7.4.5. Aviation Fuel
- 7.4.6. Heating Oil
- 7.4.7. Crude Oil
- 7.4.8. Others
- 7.5. APAC Pour Point Depressant Market Analysis, Opportunity and Forecast, By By End-use , 2016-2032
- 7.5.1. APAC Pour Point Depressant Market Analysis by By End-use : Introduction
- 7.5.2. Market Size Absolute $ Opportunity Analysis and Forecast, By By End-use , 2016-2032
- 7.5.3. Automotive
- 7.5.4. Oil & Gas
- 7.5.5. Aerospace
- 7.5.6. Marine
- 7.5.7. Others
- 7.6. APAC Pour Point Depressant Market Analysis, Opportunity and Forecast, By By Distribution Channel, 2016-2032
- 7.6.1. APAC Pour Point Depressant Market Analysis by By Distribution Channel: Introduction
- 7.6.2. Market Size Absolute $ Opportunity Analysis and Forecast, By By Distribution Channel, 2016-2032
- 7.6.3. Direct Sales
- 7.6.4. Indirect Sales
- 7.7. APAC Pour Point Depressant Market Analysis, Opportunity and Forecast, By Country , 2016-2032
- 7.7.1. APAC Pour Point Depressant Market Analysis by Country : Introduction
- 7.7.2. Market Size Absolute $ Opportunity Analysis and Forecast, Country , 2016-2032
- 7.7.2.1. China
- 7.7.2.2. Japan
- 7.7.2.3. South Korea
- 7.7.2.4. India
- 7.7.2.5. Australia & New Zeland
- 7.7.2.6. Indonesia
- 7.7.2.7. Malaysia
- 7.7.2.8. Philippines
- 7.7.2.9. Singapore
- 7.7.2.10. Thailand
- 7.7.2.11. Vietnam
- 7.7.2.12. Rest of APAC
- 8. Latin America Pour Point Depressant Market Analysis, Opportunity and Forecast, 2016-2032
- 8.1. Latin America Pour Point Depressant Market Analysis, 2016-2021
- 8.2. Latin America Pour Point Depressant Market Opportunity and Forecast, 2023-2032
- 8.3. Latin America Pour Point Depressant Market Analysis, Opportunity and Forecast, By By Type , 2016-2032
- 8.3.1. Latin America Pour Point Depressant Market Analysis by By Type : Introduction
- 8.3.2. Market Size Absolute $ Opportunity Analysis and Forecast, By By Type , 2016-2032
- 8.3.3. Ethylene-co-vinyl Acetate (EVA)
- 8.3.4. Polyalphaolefin (PAO)
- 8.3.5. Polyalkyl Methacrylate (PAMA)
- 8.3.6. Styrene Butadiene Copolymer
- 8.3.7. Ethylene-styrene Copolymer
- 8.3.8. Others
- 8.4. Latin America Pour Point Depressant Market Analysis, Opportunity and Forecast, By By Application, 2016-2032
- 8.4.1. Latin America Pour Point Depressant Market Analysis by By Application: Introduction
- 8.4.2. Market Size Absolute $ Opportunity Analysis and Forecast, By By Application, 2016-2032
- 8.4.3. Lubricants
- 8.4.4. Diesel Fuel
- 8.4.5. Aviation Fuel
- 8.4.6. Heating Oil
- 8.4.7. Crude Oil
- 8.4.8. Others
- 8.5. Latin America Pour Point Depressant Market Analysis, Opportunity and Forecast, By By End-use , 2016-2032
- 8.5.1. Latin America Pour Point Depressant Market Analysis by By End-use : Introduction
- 8.5.2. Market Size Absolute $ Opportunity Analysis and Forecast, By By End-use , 2016-2032
- 8.5.3. Automotive
- 8.5.4. Oil & Gas
- 8.5.5. Aerospace
- 8.5.6. Marine
- 8.5.7. Others
- 8.6. Latin America Pour Point Depressant Market Analysis, Opportunity and Forecast, By By Distribution Channel, 2016-2032
- 8.6.1. Latin America Pour Point Depressant Market Analysis by By Distribution Channel: Introduction
- 8.6.2. Market Size Absolute $ Opportunity Analysis and Forecast, By By Distribution Channel, 2016-2032
- 8.6.3. Direct Sales
- 8.6.4. Indirect Sales
- 8.7. Latin America Pour Point Depressant Market Analysis, Opportunity and Forecast, By Country , 2016-2032
- 8.7.1. Latin America Pour Point Depressant Market Analysis by Country : Introduction
- 8.7.2. Market Size Absolute $ Opportunity Analysis and Forecast, Country , 2016-2032
- 8.7.2.1. Brazil
- 8.7.2.2. Colombia
- 8.7.2.3. Chile
- 8.7.2.4. Argentina
- 8.7.2.5. Costa Rica
- 8.7.2.6. Rest of Latin America
- 9. Middle East & Africa Pour Point Depressant Market Analysis, Opportunity and Forecast, 2016-2032
- 9.1. Middle East & Africa Pour Point Depressant Market Analysis, 2016-2021
- 9.2. Middle East & Africa Pour Point Depressant Market Opportunity and Forecast, 2023-2032
- 9.3. Middle East & Africa Pour Point Depressant Market Analysis, Opportunity and Forecast, By By Type , 2016-2032
- 9.3.1. Middle East & Africa Pour Point Depressant Market Analysis by By Type : Introduction
- 9.3.2. Market Size Absolute $ Opportunity Analysis and Forecast, By By Type , 2016-2032
- 9.3.3. Ethylene-co-vinyl Acetate (EVA)
- 9.3.4. Polyalphaolefin (PAO)
- 9.3.5. Polyalkyl Methacrylate (PAMA)
- 9.3.6. Styrene Butadiene Copolymer
- 9.3.7. Ethylene-styrene Copolymer
- 9.3.8. Others
- 9.4. Middle East & Africa Pour Point Depressant Market Analysis, Opportunity and Forecast, By By Application, 2016-2032
- 9.4.1. Middle East & Africa Pour Point Depressant Market Analysis by By Application: Introduction
- 9.4.2. Market Size Absolute $ Opportunity Analysis and Forecast, By By Application, 2016-2032
- 9.4.3. Lubricants
- 9.4.4. Diesel Fuel
- 9.4.5. Aviation Fuel
- 9.4.6. Heating Oil
- 9.4.7. Crude Oil
- 9.4.8. Others
- 9.5. Middle East & Africa Pour Point Depressant Market Analysis, Opportunity and Forecast, By By End-use , 2016-2032
- 9.5.1. Middle East & Africa Pour Point Depressant Market Analysis by By End-use : Introduction
- 9.5.2. Market Size Absolute $ Opportunity Analysis and Forecast, By By End-use , 2016-2032
- 9.5.3. Automotive
- 9.5.4. Oil & Gas
- 9.5.5. Aerospace
- 9.5.6. Marine
- 9.5.7. Others
- 9.6. Middle East & Africa Pour Point Depressant Market Analysis, Opportunity and Forecast, By By Distribution Channel, 2016-2032
- 9.6.1. Middle East & Africa Pour Point Depressant Market Analysis by By Distribution Channel: Introduction
- 9.6.2. Market Size Absolute $ Opportunity Analysis and Forecast, By By Distribution Channel, 2016-2032
- 9.6.3. Direct Sales
- 9.6.4. Indirect Sales
- 9.7. Middle East & Africa Pour Point Depressant Market Analysis, Opportunity and Forecast, By Country , 2016-2032
- 9.7.1. Middle East & Africa Pour Point Depressant Market Analysis by Country : Introduction
- 9.7.2. Market Size Absolute $ Opportunity Analysis and Forecast, Country , 2016-2032
- 9.7.2.1. Algeria
- 9.7.2.2. Egypt
- 9.7.2.3. Israel
- 9.7.2.4. Kuwait
- 9.7.2.5. Nigeria
- 9.7.2.6. Saudi Arabia
- 9.7.2.7. South Africa
- 9.7.2.8. Turkey
- 9.7.2.9. The UAE
- 9.7.2.10. Rest of MEA
- 10. Global Pour Point Depressant Market Analysis, Opportunity and Forecast, By Region , 2016-2032
- 10.1. Global Pour Point Depressant Market Analysis by Region : Introduction
- 10.2. Market Size Absolute $ Opportunity Analysis and Forecast, By Region , 2016-2032
- 10.2.1. North America
- 10.2.2. Western Europe
- 10.2.3. Eastern Europe
- 10.2.4. APAC
- 10.2.5. Latin America
- 10.2.6. Middle East & Africa
- 11. Global Pour Point Depressant Market Competitive Landscape, Market Share Analysis, and Company Profiles
- 11.1. Market Share Analysis
- 11.2. Company Profiles
- 11.3. Afton Chemical
- 11.3.1. Company Overview
- 11.3.2. Financial Highlights
- 11.3.3. Product Portfolio
- 11.3.4. SWOT Analysis
- 11.3.5. Key Strategies and Developments
- 11.4. BASF SE
- 11.4.1. Company Overview
- 11.4.2. Financial Highlights
- 11.4.3. Product Portfolio
- 11.4.4. SWOT Analysis
- 11.4.5. Key Strategies and Developments
- 11.5. Chevron Phillips Chemical Company
- 11.5.1. Company Overview
- 11.5.2. Financial Highlights
- 11.5.3. Product Portfolio
- 11.5.4. SWOT Analysis
- 11.5.5. Key Strategies and Developments
- 11.6. CLARIANT
- 11.6.1. Company Overview
- 11.6.2. Financial Highlights
- 11.6.3. Product Portfolio
- 11.6.4. SWOT Analysis
- 11.6.5. Key Strategies and Developments
- 11.7. Croda International Plc
- 11.7.1. Company Overview
- 11.7.2. Financial Highlights
- 11.7.3. Product Portfolio
- 11.7.4. SWOT Analysis
- 11.7.5. Key Strategies and Developments
- 11.8. Ecolab
- 11.8.1. Company Overview
- 11.8.2. Financial Highlights
- 11.8.3. Product Portfolio
- 11.8.4. SWOT Analysis
- 11.8.5. Key Strategies and Developments
- 11.9. Evonik Oil Additives USA, Inc.
- 11.9.1. Company Overview
- 11.9.2. Financial Highlights
- 11.9.3. Product Portfolio
- 11.9.4. SWOT Analysis
- 11.9.5. Key Strategies and Developments
- 11.10. Infineum International Limited.
- 11.10.1. Company Overview
- 11.10.2. Financial Highlights
- 11.10.3. Product Portfolio
- 11.10.4. SWOT Analysis
- 11.10.5. Key Strategies and Developments
- 11.11. Innospec
- 11.11.1. Company Overview
- 11.11.2. Financial Highlights
- 11.11.3. Product Portfolio
- 11.11.4. SWOT Analysis
- 11.11.5. Key Strategies and Developments
- 11.12. Lariant
- 11.12.1. Company Overview
- 11.12.2. Financial Highlights
- 11.12.3. Product Portfolio
- 11.12.4. SWOT Analysis
- 11.12.5. Key Strategies and Developments
- 11.13.1. Company Overview
- 11.13.2. Financial Highlights
- 11.13.3. Product Portfolio
- 11.13.4. SWOT Analysis
- 11.13.5. Key Strategies and Developments
- 11.14. Lead Oilfield Solutions Company
- 11.14.1. Company Overview
- 11.14.2. Financial Highlights
- 11.14.3. Product Portfolio
- 11.14.4. SWOT Analysis
- 11.14.5. Key Strategies and Developments
- 11.15. Sanyo Chemical Industries, Ltd.
- 11.15.1. Company Overview
- 11.15.2. Financial Highlights
- 11.15.3. Product Portfolio
- 11.15.4. SWOT Analysis
- 11.15.5. Key Strategies and Developments
- 11.16. Shenyang Great Wall Lubricating Oil Manufacturing Co.,Ltd,
- 11.16.1. Company Overview
- 11.16.2. Financial Highlights
- 11.16.3. Product Portfolio
- 11.16.4. SWOT Analysis
- 11.16.5. Key Strategies and Developments
- 11.17. The Lubrizol Corporation
- 11.17.1. Company Overview
- 11.17.2. Financial Highlights
- 11.17.3. Product Portfolio
- 11.17.4. SWOT Analysis
- 11.17.5. Key Strategies and Developments
- 12. Assumptions and Acronyms
- 13. Research Methodology
- 14. Contact
"
- List of Figures
- "
- Figure 1: Global Pour Point Depressant Market Revenue (US$ Mn) Market Share by By Type in 2022
- Figure 2: Global Pour Point Depressant Market Market Attractiveness Analysis by By Type , 2016-2032
- Figure 3: Global Pour Point Depressant Market Revenue (US$ Mn) Market Share by By Applicationin 2022
- Figure 4: Global Pour Point Depressant Market Market Attractiveness Analysis by By Application, 2016-2032
- Figure 5: Global Pour Point Depressant Market Revenue (US$ Mn) Market Share by By End-use in 2022
- Figure 6: Global Pour Point Depressant Market Market Attractiveness Analysis by By End-use , 2016-2032
- Figure 7: Global Pour Point Depressant Market Revenue (US$ Mn) Market Share by By Distribution Channelin 2022
- Figure 8: Global Pour Point Depressant Market Market Attractiveness Analysis by By Distribution Channel, 2016-2032
- Figure 9: Global Pour Point Depressant Market Revenue (US$ Mn) Market Share by Region in 2022
- Figure 10: Global Pour Point Depressant Market Market Attractiveness Analysis by Region, 2016-2032
- Figure 11: Global Pour Point Depressant Market Market Revenue (US$ Mn) (2016-2032)
- Figure 12: Global Pour Point Depressant Market Market Revenue (US$ Mn) Comparison by Region (2016-2032)
- Figure 13: Global Pour Point Depressant Market Market Revenue (US$ Mn) Comparison by By Type (2016-2032)
- Figure 14: Global Pour Point Depressant Market Market Revenue (US$ Mn) Comparison by By Application (2016-2032)
- Figure 15: Global Pour Point Depressant Market Market Revenue (US$ Mn) Comparison by By End-use (2016-2032)
- Figure 16: Global Pour Point Depressant Market Market Revenue (US$ Mn) Comparison by By Distribution Channel (2016-2032)
- Figure 17: Global Pour Point Depressant Market Market Y-o-Y Growth Rate Comparison by Region (2016-2032)
- Figure 18: Global Pour Point Depressant Market Market Y-o-Y Growth Rate Comparison by By Type (2016-2032)
- Figure 19: Global Pour Point Depressant Market Market Y-o-Y Growth Rate Comparison by By Application (2016-2032)
- Figure 20: Global Pour Point Depressant Market Market Y-o-Y Growth Rate Comparison by By End-use (2016-2032)
- Figure 21: Global Pour Point Depressant Market Market Y-o-Y Growth Rate Comparison by By Distribution Channel (2016-2032)
- Figure 22: Global Pour Point Depressant Market Market Share Comparison by Region (2016-2032)
- Figure 23: Global Pour Point Depressant Market Market Share Comparison by By Type (2016-2032)
- Figure 24: Global Pour Point Depressant Market Market Share Comparison by By Application (2016-2032)
- Figure 25: Global Pour Point Depressant Market Market Share Comparison by By End-use (2016-2032)
- Figure 26: Global Pour Point Depressant Market Market Share Comparison by By Distribution Channel (2016-2032)
- Figure 27: North America Pour Point Depressant Market Revenue (US$ Mn) Market Share by By Type in 2022
- Figure 28: North America Pour Point Depressant Market Market Attractiveness Analysis by By Type , 2016-2032
- Figure 29: North America Pour Point Depressant Market Revenue (US$ Mn) Market Share by By Applicationin 2022
- Figure 30: North America Pour Point Depressant Market Market Attractiveness Analysis by By Application, 2016-2032
- Figure 31: North America Pour Point Depressant Market Revenue (US$ Mn) Market Share by By End-use in 2022
- Figure 32: North America Pour Point Depressant Market Market Attractiveness Analysis by By End-use , 2016-2032
- Figure 33: North America Pour Point Depressant Market Revenue (US$ Mn) Market Share by By Distribution Channelin 2022
- Figure 34: North America Pour Point Depressant Market Market Attractiveness Analysis by By Distribution Channel, 2016-2032
- Figure 35: North America Pour Point Depressant Market Revenue (US$ Mn) Market Share by Country in 2022
- Figure 36: North America Pour Point Depressant Market Market Attractiveness Analysis by Country, 2016-2032
- Figure 37: North America Pour Point Depressant Market Market Revenue (US$ Mn) (2016-2032)
- Figure 38: North America Pour Point Depressant Market Market Revenue (US$ Mn) Comparison by Country (2016-2032)
- Figure 39: North America Pour Point Depressant Market Market Revenue (US$ Mn) Comparison by By Type (2016-2032)
- Figure 40: North America Pour Point Depressant Market Market Revenue (US$ Mn) Comparison by By Application (2016-2032)
- Figure 41: North America Pour Point Depressant Market Market Revenue (US$ Mn) Comparison by By End-use (2016-2032)
- Figure 42: North America Pour Point Depressant Market Market Revenue (US$ Mn) Comparison by By Distribution Channel (2016-2032)
- Figure 43: North America Pour Point Depressant Market Market Y-o-Y Growth Rate Comparison by Country (2016-2032)
- Figure 44: North America Pour Point Depressant Market Market Y-o-Y Growth Rate Comparison by By Type (2016-2032)
- Figure 45: North America Pour Point Depressant Market Market Y-o-Y Growth Rate Comparison by By Application (2016-2032)
- Figure 46: North America Pour Point Depressant Market Market Y-o-Y Growth Rate Comparison by By End-use (2016-2032)
- Figure 47: North America Pour Point Depressant Market Market Y-o-Y Growth Rate Comparison by By Distribution Channel (2016-2032)
- Figure 48: North America Pour Point Depressant Market Market Share Comparison by Country (2016-2032)
- Figure 49: North America Pour Point Depressant Market Market Share Comparison by By Type (2016-2032)
- Figure 50: North America Pour Point Depressant Market Market Share Comparison by By Application (2016-2032)
- Figure 51: North America Pour Point Depressant Market Market Share Comparison by By End-use (2016-2032)
- Figure 52: North America Pour Point Depressant Market Market Share Comparison by By Distribution Channel (2016-2032)
- Figure 53: Western Europe Pour Point Depressant Market Revenue (US$ Mn) Market Share by By Type in 2022
- Figure 54: Western Europe Pour Point Depressant Market Market Attractiveness Analysis by By Type , 2016-2032
- Figure 55: Western Europe Pour Point Depressant Market Revenue (US$ Mn) Market Share by By Applicationin 2022
- Figure 56: Western Europe Pour Point Depressant Market Market Attractiveness Analysis by By Application, 2016-2032
- Figure 57: Western Europe Pour Point Depressant Market Revenue (US$ Mn) Market Share by By End-use in 2022
- Figure 58: Western Europe Pour Point Depressant Market Market Attractiveness Analysis by By End-use , 2016-2032
- Figure 59: Western Europe Pour Point Depressant Market Revenue (US$ Mn) Market Share by By Distribution Channelin 2022
- Figure 60: Western Europe Pour Point Depressant Market Market Attractiveness Analysis by By Distribution Channel, 2016-2032
- Figure 61: Western Europe Pour Point Depressant Market Revenue (US$ Mn) Market Share by Country in 2022
- Figure 62: Western Europe Pour Point Depressant Market Market Attractiveness Analysis by Country, 2016-2032
- Figure 63: Western Europe Pour Point Depressant Market Market Revenue (US$ Mn) (2016-2032)
- Figure 64: Western Europe Pour Point Depressant Market Market Revenue (US$ Mn) Comparison by Country (2016-2032)
- Figure 65: Western Europe Pour Point Depressant Market Market Revenue (US$ Mn) Comparison by By Type (2016-2032)
- Figure 66: Western Europe Pour Point Depressant Market Market Revenue (US$ Mn) Comparison by By Application (2016-2032)
- Figure 67: Western Europe Pour Point Depressant Market Market Revenue (US$ Mn) Comparison by By End-use (2016-2032)
- Figure 68: Western Europe Pour Point Depressant Market Market Revenue (US$ Mn) Comparison by By Distribution Channel (2016-2032)
- Figure 69: Western Europe Pour Point Depressant Market Market Y-o-Y Growth Rate Comparison by Country (2016-2032)
- Figure 70: Western Europe Pour Point Depressant Market Market Y-o-Y Growth Rate Comparison by By Type (2016-2032)
- Figure 71: Western Europe Pour Point Depressant Market Market Y-o-Y Growth Rate Comparison by By Application (2016-2032)
- Figure 72: Western Europe Pour Point Depressant Market Market Y-o-Y Growth Rate Comparison by By End-use (2016-2032)
- Figure 73: Western Europe Pour Point Depressant Market Market Y-o-Y Growth Rate Comparison by By Distribution Channel (2016-2032)
- Figure 74: Western Europe Pour Point Depressant Market Market Share Comparison by Country (2016-2032)
- Figure 75: Western Europe Pour Point Depressant Market Market Share Comparison by By Type (2016-2032)
- Figure 76: Western Europe Pour Point Depressant Market Market Share Comparison by By Application (2016-2032)
- Figure 77: Western Europe Pour Point Depressant Market Market Share Comparison by By End-use (2016-2032)
- Figure 78: Western Europe Pour Point Depressant Market Market Share Comparison by By Distribution Channel (2016-2032)
- Figure 79: Eastern Europe Pour Point Depressant Market Revenue (US$ Mn) Market Share by By Type in 2022
- Figure 80: Eastern Europe Pour Point Depressant Market Market Attractiveness Analysis by By Type , 2016-2032
- Figure 81: Eastern Europe Pour Point Depressant Market Revenue (US$ Mn) Market Share by By Applicationin 2022
- Figure 82: Eastern Europe Pour Point Depressant Market Market Attractiveness Analysis by By Application, 2016-2032
- Figure 83: Eastern Europe Pour Point Depressant Market Revenue (US$ Mn) Market Share by By End-use in 2022
- Figure 84: Eastern Europe Pour Point Depressant Market Market Attractiveness Analysis by By End-use , 2016-2032
- Figure 85: Eastern Europe Pour Point Depressant Market Revenue (US$ Mn) Market Share by By Distribution Channelin 2022
- Figure 86: Eastern Europe Pour Point Depressant Market Market Attractiveness Analysis by By Distribution Channel, 2016-2032
- Figure 87: Eastern Europe Pour Point Depressant Market Revenue (US$ Mn) Market Share by Country in 2022
- Figure 88: Eastern Europe Pour Point Depressant Market Market Attractiveness Analysis by Country, 2016-2032
- Figure 89: Eastern Europe Pour Point Depressant Market Market Revenue (US$ Mn) (2016-2032)
- Figure 90: Eastern Europe Pour Point Depressant Market Market Revenue (US$ Mn) Comparison by Country (2016-2032)
- Figure 91: Eastern Europe Pour Point Depressant Market Market Revenue (US$ Mn) Comparison by By Type (2016-2032)
- Figure 92: Eastern Europe Pour Point Depressant Market Market Revenue (US$ Mn) Comparison by By Application (2016-2032)
- Figure 93: Eastern Europe Pour Point Depressant Market Market Revenue (US$ Mn) Comparison by By End-use (2016-2032)
- Figure 94: Eastern Europe Pour Point Depressant Market Market Revenue (US$ Mn) Comparison by By Distribution Channel (2016-2032)
- Figure 95: Eastern Europe Pour Point Depressant Market Market Y-o-Y Growth Rate Comparison by Country (2016-2032)
- Figure 96: Eastern Europe Pour Point Depressant Market Market Y-o-Y Growth Rate Comparison by By Type (2016-2032)
- Figure 97: Eastern Europe Pour Point Depressant Market Market Y-o-Y Growth Rate Comparison by By Application (2016-2032)
- Figure 98: Eastern Europe Pour Point Depressant Market Market Y-o-Y Growth Rate Comparison by By End-use (2016-2032)
- Figure 99: Eastern Europe Pour Point Depressant Market Market Y-o-Y Growth Rate Comparison by By Distribution Channel (2016-2032)
- Figure 100: Eastern Europe Pour Point Depressant Market Market Share Comparison by Country (2016-2032)
- Figure 101: Eastern Europe Pour Point Depressant Market Market Share Comparison by By Type (2016-2032)
- Figure 102: Eastern Europe Pour Point Depressant Market Market Share Comparison by By Application (2016-2032)
- Figure 103: Eastern Europe Pour Point Depressant Market Market Share Comparison by By End-use (2016-2032)
- Figure 104: Eastern Europe Pour Point Depressant Market Market Share Comparison by By Distribution Channel (2016-2032)
- Figure 105: APAC Pour Point Depressant Market Revenue (US$ Mn) Market Share by By Type in 2022
- Figure 106: APAC Pour Point Depressant Market Market Attractiveness Analysis by By Type , 2016-2032
- Figure 107: APAC Pour Point Depressant Market Revenue (US$ Mn) Market Share by By Applicationin 2022
- Figure 108: APAC Pour Point Depressant Market Market Attractiveness Analysis by By Application, 2016-2032
- Figure 109: APAC Pour Point Depressant Market Revenue (US$ Mn) Market Share by By End-use in 2022
- Figure 110: APAC Pour Point Depressant Market Market Attractiveness Analysis by By End-use , 2016-2032
- Figure 111: APAC Pour Point Depressant Market Revenue (US$ Mn) Market Share by By Distribution Channelin 2022
- Figure 112: APAC Pour Point Depressant Market Market Attractiveness Analysis by By Distribution Channel, 2016-2032
- Figure 113: APAC Pour Point Depressant Market Revenue (US$ Mn) Market Share by Country in 2022
- Figure 114: APAC Pour Point Depressant Market Market Attractiveness Analysis by Country, 2016-2032
- Figure 115: APAC Pour Point Depressant Market Market Revenue (US$ Mn) (2016-2032)
- Figure 116: APAC Pour Point Depressant Market Market Revenue (US$ Mn) Comparison by Country (2016-2032)
- Figure 117: APAC Pour Point Depressant Market Market Revenue (US$ Mn) Comparison by By Type (2016-2032)
- Figure 118: APAC Pour Point Depressant Market Market Revenue (US$ Mn) Comparison by By Application (2016-2032)
- Figure 119: APAC Pour Point Depressant Market Market Revenue (US$ Mn) Comparison by By End-use (2016-2032)
- Figure 120: APAC Pour Point Depressant Market Market Revenue (US$ Mn) Comparison by By Distribution Channel (2016-2032)
- Figure 121: APAC Pour Point Depressant Market Market Y-o-Y Growth Rate Comparison by Country (2016-2032)
- Figure 122: APAC Pour Point Depressant Market Market Y-o-Y Growth Rate Comparison by By Type (2016-2032)
- Figure 123: APAC Pour Point Depressant Market Market Y-o-Y Growth Rate Comparison by By Application (2016-2032)
- Figure 124: APAC Pour Point Depressant Market Market Y-o-Y Growth Rate Comparison by By End-use (2016-2032)
- Figure 125: APAC Pour Point Depressant Market Market Y-o-Y Growth Rate Comparison by By Distribution Channel (2016-2032)
- Figure 126: APAC Pour Point Depressant Market Market Share Comparison by Country (2016-2032)
- Figure 127: APAC Pour Point Depressant Market Market Share Comparison by By Type (2016-2032)
- Figure 128: APAC Pour Point Depressant Market Market Share Comparison by By Application (2016-2032)
- Figure 129: APAC Pour Point Depressant Market Market Share Comparison by By End-use (2016-2032)
- Figure 130: APAC Pour Point Depressant Market Market Share Comparison by By Distribution Channel (2016-2032)
- Figure 131: Latin America Pour Point Depressant Market Revenue (US$ Mn) Market Share by By Type in 2022
- Figure 132: Latin America Pour Point Depressant Market Market Attractiveness Analysis by By Type , 2016-2032
- Figure 133: Latin America Pour Point Depressant Market Revenue (US$ Mn) Market Share by By Applicationin 2022
- Figure 134: Latin America Pour Point Depressant Market Market Attractiveness Analysis by By Application, 2016-2032
- Figure 135: Latin America Pour Point Depressant Market Revenue (US$ Mn) Market Share by By End-use in 2022
- Figure 136: Latin America Pour Point Depressant Market Market Attractiveness Analysis by By End-use , 2016-2032
- Figure 137: Latin America Pour Point Depressant Market Revenue (US$ Mn) Market Share by By Distribution Channelin 2022
- Figure 138: Latin America Pour Point Depressant Market Market Attractiveness Analysis by By Distribution Channel, 2016-2032
- Figure 139: Latin America Pour Point Depressant Market Revenue (US$ Mn) Market Share by Country in 2022
- Figure 140: Latin America Pour Point Depressant Market Market Attractiveness Analysis by Country, 2016-2032
- Figure 141: Latin America Pour Point Depressant Market Market Revenue (US$ Mn) (2016-2032)
- Figure 142: Latin America Pour Point Depressant Market Market Revenue (US$ Mn) Comparison by Country (2016-2032)
- Figure 143: Latin America Pour Point Depressant Market Market Revenue (US$ Mn) Comparison by By Type (2016-2032)
- Figure 144: Latin America Pour Point Depressant Market Market Revenue (US$ Mn) Comparison by By Application (2016-2032)
- Figure 145: Latin America Pour Point Depressant Market Market Revenue (US$ Mn) Comparison by By End-use (2016-2032)
- Figure 146: Latin America Pour Point Depressant Market Market Revenue (US$ Mn) Comparison by By Distribution Channel (2016-2032)
- Figure 147: Latin America Pour Point Depressant Market Market Y-o-Y Growth Rate Comparison by Country (2016-2032)
- Figure 148: Latin America Pour Point Depressant Market Market Y-o-Y Growth Rate Comparison by By Type (2016-2032)
- Figure 149: Latin America Pour Point Depressant Market Market Y-o-Y Growth Rate Comparison by By Application (2016-2032)
- Figure 150: Latin America Pour Point Depressant Market Market Y-o-Y Growth Rate Comparison by By End-use (2016-2032)
- Figure 151: Latin America Pour Point Depressant Market Market Y-o-Y Growth Rate Comparison by By Distribution Channel (2016-2032)
- Figure 152: Latin America Pour Point Depressant Market Market Share Comparison by Country (2016-2032)
- Figure 153: Latin America Pour Point Depressant Market Market Share Comparison by By Type (2016-2032)
- Figure 154: Latin America Pour Point Depressant Market Market Share Comparison by By Application (2016-2032)
- Figure 155: Latin America Pour Point Depressant Market Market Share Comparison by By End-use (2016-2032)
- Figure 156: Latin America Pour Point Depressant Market Market Share Comparison by By Distribution Channel (2016-2032)
- Figure 157: Middle East & Africa Pour Point Depressant Market Revenue (US$ Mn) Market Share by By Type in 2022
- Figure 158: Middle East & Africa Pour Point Depressant Market Market Attractiveness Analysis by By Type , 2016-2032
- Figure 159: Middle East & Africa Pour Point Depressant Market Revenue (US$ Mn) Market Share by By Applicationin 2022
- Figure 160: Middle East & Africa Pour Point Depressant Market Market Attractiveness Analysis by By Application, 2016-2032
- Figure 161: Middle East & Africa Pour Point Depressant Market Revenue (US$ Mn) Market Share by By End-use in 2022
- Figure 162: Middle East & Africa Pour Point Depressant Market Market Attractiveness Analysis by By End-use , 2016-2032
- Figure 163: Middle East & Africa Pour Point Depressant Market Revenue (US$ Mn) Market Share by By Distribution Channelin 2022
- Figure 164: Middle East & Africa Pour Point Depressant Market Market Attractiveness Analysis by By Distribution Channel, 2016-2032
- Figure 165: Middle East & Africa Pour Point Depressant Market Revenue (US$ Mn) Market Share by Country in 2022
- Figure 166: Middle East & Africa Pour Point Depressant Market Market Attractiveness Analysis by Country, 2016-2032
- Figure 167: Middle East & Africa Pour Point Depressant Market Market Revenue (US$ Mn) (2016-2032)
- Figure 168: Middle East & Africa Pour Point Depressant Market Market Revenue (US$ Mn) Comparison by Country (2016-2032)
- Figure 169: Middle East & Africa Pour Point Depressant Market Market Revenue (US$ Mn) Comparison by By Type (2016-2032)
- Figure 170: Middle East & Africa Pour Point Depressant Market Market Revenue (US$ Mn) Comparison by By Application (2016-2032)
- Figure 171: Middle East & Africa Pour Point Depressant Market Market Revenue (US$ Mn) Comparison by By End-use (2016-2032)
- Figure 172: Middle East & Africa Pour Point Depressant Market Market Revenue (US$ Mn) Comparison by By Distribution Channel (2016-2032)
- Figure 173: Middle East & Africa Pour Point Depressant Market Market Y-o-Y Growth Rate Comparison by Country (2016-2032)
- Figure 174: Middle East & Africa Pour Point Depressant Market Market Y-o-Y Growth Rate Comparison by By Type (2016-2032)
- Figure 175: Middle East & Africa Pour Point Depressant Market Market Y-o-Y Growth Rate Comparison by By Application (2016-2032)
- Figure 176: Middle East & Africa Pour Point Depressant Market Market Y-o-Y Growth Rate Comparison by By End-use (2016-2032)
- Figure 177: Middle East & Africa Pour Point Depressant Market Market Y-o-Y Growth Rate Comparison by By Distribution Channel (2016-2032)
- Figure 178: Middle East & Africa Pour Point Depressant Market Market Share Comparison by Country (2016-2032)
- Figure 179: Middle East & Africa Pour Point Depressant Market Market Share Comparison by By Type (2016-2032)
- Figure 180: Middle East & Africa Pour Point Depressant Market Market Share Comparison by By Application (2016-2032)
- Figure 181: Middle East & Africa Pour Point Depressant Market Market Share Comparison by By End-use (2016-2032)
- Figure 182: Middle East & Africa Pour Point Depressant Market Market Share Comparison by By Distribution Channel (2016-2032)
"
- List of Tables
- "
- Table 1: Global Pour Point Depressant Market Market Comparison by By Type (2016-2032)
- Table 2: Global Pour Point Depressant Market Market Comparison by By Application (2016-2032)
- Table 3: Global Pour Point Depressant Market Market Comparison by By End-use (2016-2032)
- Table 4: Global Pour Point Depressant Market Market Comparison by By Distribution Channel (2016-2032)
- Table 5: Global Pour Point Depressant Market Revenue (US$ Mn) Comparison by Region (2016-2032)
- Table 6: Global Pour Point Depressant Market Market Revenue (US$ Mn) (2016-2032)
- Table 7: Global Pour Point Depressant Market Market Revenue (US$ Mn) Comparison by Region (2016-2032)
- Table 8: Global Pour Point Depressant Market Market Revenue (US$ Mn) Comparison by By Type (2016-2032)
- Table 9: Global Pour Point Depressant Market Market Revenue (US$ Mn) Comparison by By Application (2016-2032)
- Table 10: Global Pour Point Depressant Market Market Revenue (US$ Mn) Comparison by By End-use (2016-2032)
- Table 11: Global Pour Point Depressant Market Market Revenue (US$ Mn) Comparison by By Distribution Channel (2016-2032)
- Table 12: Global Pour Point Depressant Market Market Y-o-Y Growth Rate Comparison by Region (2016-2032)
- Table 13: Global Pour Point Depressant Market Market Y-o-Y Growth Rate Comparison by By Type (2016-2032)
- Table 14: Global Pour Point Depressant Market Market Y-o-Y Growth Rate Comparison by By Application (2016-2032)
- Table 15: Global Pour Point Depressant Market Market Y-o-Y Growth Rate Comparison by By End-use (2016-2032)
- Table 16: Global Pour Point Depressant Market Market Y-o-Y Growth Rate Comparison by By Distribution Channel (2016-2032)
- Table 17: Global Pour Point Depressant Market Market Share Comparison by Region (2016-2032)
- Table 18: Global Pour Point Depressant Market Market Share Comparison by By Type (2016-2032)
- Table 19: Global Pour Point Depressant Market Market Share Comparison by By Application (2016-2032)
- Table 20: Global Pour Point Depressant Market Market Share Comparison by By End-use (2016-2032)
- Table 21: Global Pour Point Depressant Market Market Share Comparison by By Distribution Channel (2016-2032)
- Table 22: North America Pour Point Depressant Market Market Comparison by By Application (2016-2032)
- Table 23: North America Pour Point Depressant Market Market Comparison by By End-use (2016-2032)
- Table 24: North America Pour Point Depressant Market Market Comparison by By Distribution Channel (2016-2032)
- Table 25: North America Pour Point Depressant Market Revenue (US$ Mn) Comparison by Country (2016-2032)
- Table 26: North America Pour Point Depressant Market Market Revenue (US$ Mn) (2016-2032)
- Table 27: North America Pour Point Depressant Market Market Revenue (US$ Mn) Comparison by Country (2016-2032)
- Table 28: North America Pour Point Depressant Market Market Revenue (US$ Mn) Comparison by By Type (2016-2032)
- Table 29: North America Pour Point Depressant Market Market Revenue (US$ Mn) Comparison by By Application (2016-2032)
- Table 30: North America Pour Point Depressant Market Market Revenue (US$ Mn) Comparison by By End-use (2016-2032)
- Table 31: North America Pour Point Depressant Market Market Revenue (US$ Mn) Comparison by By Distribution Channel (2016-2032)
- Table 32: North America Pour Point Depressant Market Market Y-o-Y Growth Rate Comparison by Country (2016-2032)
- Table 33: North America Pour Point Depressant Market Market Y-o-Y Growth Rate Comparison by By Type (2016-2032)
- Table 34: North America Pour Point Depressant Market Market Y-o-Y Growth Rate Comparison by By Application (2016-2032)
- Table 35: North America Pour Point Depressant Market Market Y-o-Y Growth Rate Comparison by By End-use (2016-2032)
- Table 36: North America Pour Point Depressant Market Market Y-o-Y Growth Rate Comparison by By Distribution Channel (2016-2032)
- Table 37: North America Pour Point Depressant Market Market Share Comparison by Country (2016-2032)
- Table 38: North America Pour Point Depressant Market Market Share Comparison by By Type (2016-2032)
- Table 39: North America Pour Point Depressant Market Market Share Comparison by By Application (2016-2032)
- Table 40: North America Pour Point Depressant Market Market Share Comparison by By End-use (2016-2032)
- Table 41: North America Pour Point Depressant Market Market Share Comparison by By Distribution Channel (2016-2032)
- Table 42: Western Europe Pour Point Depressant Market Market Comparison by By Type (2016-2032)
- Table 43: Western Europe Pour Point Depressant Market Market Comparison by By Application (2016-2032)
- Table 44: Western Europe Pour Point Depressant Market Market Comparison by By End-use (2016-2032)
- Table 45: Western Europe Pour Point Depressant Market Market Comparison by By Distribution Channel (2016-2032)
- Table 46: Western Europe Pour Point Depressant Market Revenue (US$ Mn) Comparison by Country (2016-2032)
- Table 47: Western Europe Pour Point Depressant Market Market Revenue (US$ Mn) (2016-2032)
- Table 48: Western Europe Pour Point Depressant Market Market Revenue (US$ Mn) Comparison by Country (2016-2032)
- Table 49: Western Europe Pour Point Depressant Market Market Revenue (US$ Mn) Comparison by By Type (2016-2032)
- Table 50: Western Europe Pour Point Depressant Market Market Revenue (US$ Mn) Comparison by By Application (2016-2032)
- Table 51: Western Europe Pour Point Depressant Market Market Revenue (US$ Mn) Comparison by By End-use (2016-2032)
- Table 52: Western Europe Pour Point Depressant Market Market Revenue (US$ Mn) Comparison by By Distribution Channel (2016-2032)
- Table 53: Western Europe Pour Point Depressant Market Market Y-o-Y Growth Rate Comparison by Country (2016-2032)
- Table 54: Western Europe Pour Point Depressant Market Market Y-o-Y Growth Rate Comparison by By Type (2016-2032)
- Table 55: Western Europe Pour Point Depressant Market Market Y-o-Y Growth Rate Comparison by By Application (2016-2032)
- Table 56: Western Europe Pour Point Depressant Market Market Y-o-Y Growth Rate Comparison by By End-use (2016-2032)
- Table 57: Western Europe Pour Point Depressant Market Market Y-o-Y Growth Rate Comparison by By Distribution Channel (2016-2032)
- Table 58: Western Europe Pour Point Depressant Market Market Share Comparison by Country (2016-2032)
- Table 59: Western Europe Pour Point Depressant Market Market Share Comparison by By Type (2016-2032)
- Table 60: Western Europe Pour Point Depressant Market Market Share Comparison by By Application (2016-2032)
- Table 61: Western Europe Pour Point Depressant Market Market Share Comparison by By End-use (2016-2032)
- Table 62: Western Europe Pour Point Depressant Market Market Share Comparison by By Distribution Channel (2016-2032)
- Table 63: Eastern Europe Pour Point Depressant Market Market Comparison by By Type (2016-2032)
- Table 64: Eastern Europe Pour Point Depressant Market Market Comparison by By Application (2016-2032)
- Table 65: Eastern Europe Pour Point Depressant Market Market Comparison by By End-use (2016-2032)
- Table 66: Eastern Europe Pour Point Depressant Market Market Comparison by By Distribution Channel (2016-2032)
- Table 67: Eastern Europe Pour Point Depressant Market Revenue (US$ Mn) Comparison by Country (2016-2032)
- Table 68: Eastern Europe Pour Point Depressant Market Market Revenue (US$ Mn) (2016-2032)
- Table 69: Eastern Europe Pour Point Depressant Market Market Revenue (US$ Mn) Comparison by Country (2016-2032)
- Table 70: Eastern Europe Pour Point Depressant Market Market Revenue (US$ Mn) Comparison by By Type (2016-2032)
- Table 71: Eastern Europe Pour Point Depressant Market Market Revenue (US$ Mn) Comparison by By Application (2016-2032)
- Table 72: Eastern Europe Pour Point Depressant Market Market Revenue (US$ Mn) Comparison by By End-use (2016-2032)
- Table 73: Eastern Europe Pour Point Depressant Market Market Revenue (US$ Mn) Comparison by By Distribution Channel (2016-2032)
- Table 74: Eastern Europe Pour Point Depressant Market Market Y-o-Y Growth Rate Comparison by Country (2016-2032)
- Table 75: Eastern Europe Pour Point Depressant Market Market Y-o-Y Growth Rate Comparison by By Type (2016-2032)
- Table 76: Eastern Europe Pour Point Depressant Market Market Y-o-Y Growth Rate Comparison by By Application (2016-2032)
- Table 77: Eastern Europe Pour Point Depressant Market Market Y-o-Y Growth Rate Comparison by By End-use (2016-2032)
- Table 78: Eastern Europe Pour Point Depressant Market Market Y-o-Y Growth Rate Comparison by By Distribution Channel (2016-2032)
- Table 79: Eastern Europe Pour Point Depressant Market Market Share Comparison by Country (2016-2032)
- Table 80: Eastern Europe Pour Point Depressant Market Market Share Comparison by By Type (2016-2032)
- Table 81: Eastern Europe Pour Point Depressant Market Market Share Comparison by By Application (2016-2032)
- Table 82: Eastern Europe Pour Point Depressant Market Market Share Comparison by By End-use (2016-2032)
- Table 83: Eastern Europe Pour Point Depressant Market Market Share Comparison by By Distribution Channel (2016-2032)
- Table 84: APAC Pour Point Depressant Market Market Comparison by By Type (2016-2032)
- Table 85: APAC Pour Point Depressant Market Market Comparison by By Application (2016-2032)
- Table 86: APAC Pour Point Depressant Market Market Comparison by By End-use (2016-2032)
- Table 87: APAC Pour Point Depressant Market Market Comparison by By Distribution Channel (2016-2032)
- Table 88: APAC Pour Point Depressant Market Revenue (US$ Mn) Comparison by Country (2016-2032)
- Table 89: APAC Pour Point Depressant Market Market Revenue (US$ Mn) (2016-2032)
- Table 90: APAC Pour Point Depressant Market Market Revenue (US$ Mn) Comparison by Country (2016-2032)
- Table 91: APAC Pour Point Depressant Market Market Revenue (US$ Mn) Comparison by By Type (2016-2032)
- Table 92: APAC Pour Point Depressant Market Market Revenue (US$ Mn) Comparison by By Application (2016-2032)
- Table 93: APAC Pour Point Depressant Market Market Revenue (US$ Mn) Comparison by By End-use (2016-2032)
- Table 94: APAC Pour Point Depressant Market Market Revenue (US$ Mn) Comparison by By Distribution Channel (2016-2032)
- Table 95: APAC Pour Point Depressant Market Market Y-o-Y Growth Rate Comparison by Country (2016-2032)
- Table 96: APAC Pour Point Depressant Market Market Y-o-Y Growth Rate Comparison by By Type (2016-2032)
- Table 97: APAC Pour Point Depressant Market Market Y-o-Y Growth Rate Comparison by By Application (2016-2032)
- Table 98: APAC Pour Point Depressant Market Market Y-o-Y Growth Rate Comparison by By End-use (2016-2032)
- Table 99: APAC Pour Point Depressant Market Market Y-o-Y Growth Rate Comparison by By Distribution Channel (2016-2032)
- Table 100: APAC Pour Point Depressant Market Market Share Comparison by Country (2016-2032)
- Table 101: APAC Pour Point Depressant Market Market Share Comparison by By Type (2016-2032)
- Table 102: APAC Pour Point Depressant Market Market Share Comparison by By Application (2016-2032)
- Table 103: APAC Pour Point Depressant Market Market Share Comparison by By End-use (2016-2032)
- Table 104: APAC Pour Point Depressant Market Market Share Comparison by By Distribution Channel (2016-2032)
- Table 105: Latin America Pour Point Depressant Market Market Comparison by By Type (2016-2032)
- Table 106: Latin America Pour Point Depressant Market Market Comparison by By Application (2016-2032)
- Table 107: Latin America Pour Point Depressant Market Market Comparison by By End-use (2016-2032)
- Table 108: Latin America Pour Point Depressant Market Market Comparison by By Distribution Channel (2016-2032)
- Table 109: Latin America Pour Point Depressant Market Revenue (US$ Mn) Comparison by Country (2016-2032)
- Table 110: Latin America Pour Point Depressant Market Market Revenue (US$ Mn) (2016-2032)
- Table 111: Latin America Pour Point Depressant Market Market Revenue (US$ Mn) Comparison by Country (2016-2032)
- Table 112: Latin America Pour Point Depressant Market Market Revenue (US$ Mn) Comparison by By Type (2016-2032)
- Table 113: Latin America Pour Point Depressant Market Market Revenue (US$ Mn) Comparison by By Application (2016-2032)
- Table 114: Latin America Pour Point Depressant Market Market Revenue (US$ Mn) Comparison by By End-use (2016-2032)
- Table 115: Latin America Pour Point Depressant Market Market Revenue (US$ Mn) Comparison by By Distribution Channel (2016-2032)
- Table 116: Latin America Pour Point Depressant Market Market Y-o-Y Growth Rate Comparison by Country (2016-2032)
- Table 117: Latin America Pour Point Depressant Market Market Y-o-Y Growth Rate Comparison by By Type (2016-2032)
- Table 118: Latin America Pour Point Depressant Market Market Y-o-Y Growth Rate Comparison by By Application (2016-2032)
- Table 119: Latin America Pour Point Depressant Market Market Y-o-Y Growth Rate Comparison by By End-use (2016-2032)
- Table 120: Latin America Pour Point Depressant Market Market Y-o-Y Growth Rate Comparison by By Distribution Channel (2016-2032)
- Table 121: Latin America Pour Point Depressant Market Market Share Comparison by Country (2016-2032)
- Table 122: Latin America Pour Point Depressant Market Market Share Comparison by By Type (2016-2032)
- Table 123: Latin America Pour Point Depressant Market Market Share Comparison by By Application (2016-2032)
- Table 124: Latin America Pour Point Depressant Market Market Share Comparison by By End-use (2016-2032)
- Table 125: Latin America Pour Point Depressant Market Market Share Comparison by By Distribution Channel (2016-2032)
- Table 126: Middle East & Africa Pour Point Depressant Market Market Comparison by By Type (2016-2032)
- Table 127: Middle East & Africa Pour Point Depressant Market Market Comparison by By Application (2016-2032)
- Table 128: Middle East & Africa Pour Point Depressant Market Market Comparison by By End-use (2016-2032)
- Table 129: Middle East & Africa Pour Point Depressant Market Market Comparison by By Distribution Channel (2016-2032)
- Table 130: Middle East & Africa Pour Point Depressant Market Revenue (US$ Mn) Comparison by Country (2016-2032)
- Table 131: Middle East & Africa Pour Point Depressant Market Market Revenue (US$ Mn) (2016-2032)
- Table 132: Middle East & Africa Pour Point Depressant Market Market Revenue (US$ Mn) Comparison by Country (2016-2032)
- Table 133: Middle East & Africa Pour Point Depressant Market Market Revenue (US$ Mn) Comparison by By Type (2016-2032)
- Table 134: Middle East & Africa Pour Point Depressant Market Market Revenue (US$ Mn) Comparison by By Application (2016-2032)
- Table 135: Middle East & Africa Pour Point Depressant Market Market Revenue (US$ Mn) Comparison by By End-use (2016-2032)
- Table 136: Middle East & Africa Pour Point Depressant Market Market Revenue (US$ Mn) Comparison by By Distribution Channel (2016-2032)
- Table 137: Middle East & Africa Pour Point Depressant Market Market Y-o-Y Growth Rate Comparison by Country (2016-2032)
- Table 138: Middle East & Africa Pour Point Depressant Market Market Y-o-Y Growth Rate Comparison by By Type (2016-2032)
- Table 139: Middle East & Africa Pour Point Depressant Market Market Y-o-Y Growth Rate Comparison by By Application (2016-2032)
- Table 140: Middle East & Africa Pour Point Depressant Market Market Y-o-Y Growth Rate Comparison by By End-use (2016-2032)
- Table 141: Middle East & Africa Pour Point Depressant Market Market Y-o-Y Growth Rate Comparison by By Distribution Channel (2016-2032)
- Table 142: Middle East & Africa Pour Point Depressant Market Market Share Comparison by Country (2016-2032)
- Table 143: Middle East & Africa Pour Point Depressant Market Market Share Comparison by By Type (2016-2032)
- Table 144: Middle East & Africa Pour Point Depressant Market Market Share Comparison by By Application (2016-2032)
- Table 145: Middle East & Africa Pour Point Depressant Market Market Share Comparison by By End-use (2016-2032)
- Table 146: Middle East & Africa Pour Point Depressant Market Market Share Comparison by By Distribution Channel (2016-2032)
- 1. Executive Summary
-
- Afton Chemical
- BASF SE
- Chevron Phillips Chemical Company
- CLARIANT
- Croda International Plc
- Ecolab
- Evonik Oil Additives USA, Inc.
- Infineum International Limited.
- Innospec
- Lariant
- Lead Oilfield Solutions Company
- Puyang Jiahua Chemical Co., Ltd.
- Sanyo Chemical Industries, Ltd.
- Shenyang Great Wall Lubricating Oil Manufacturing Co., Ltd,
- The Lubrizol Corporation
Our Clients


View Our Licence Options
