
Polylactic Acid Market By Grade (Thermoforming, Extrusion, Injection Molding, Blow Molding), By Application (Rigid Thermoform, Films & sheets, Bottles, Others), By End-Use Industry (Packaging, Consumer Goods, Agricultural, Textile, Biomedical), By Region And Companies - Industry Segment Outlook, Market Assessment, Competition Scenario, Trends, And Forecast 2023-2032
-
8582
-
March 2023
-
175
-


-
This report was compiled by Shreyas Rokade Shreyas Rokade is a seasoned Research Analyst with CMFE, bringing extensive expertise in market research and consulting, with a strong background in Chemical Engineering. Correspondence Team Lead-CMFE Linkedin | Detailed Market research Methodology Our methodology involves a mix of primary research, including interviews with leading mental health experts, and secondary research from reputable medical journals and databases. View Detailed Methodology Page
-
Quick Navigation
Report Overview
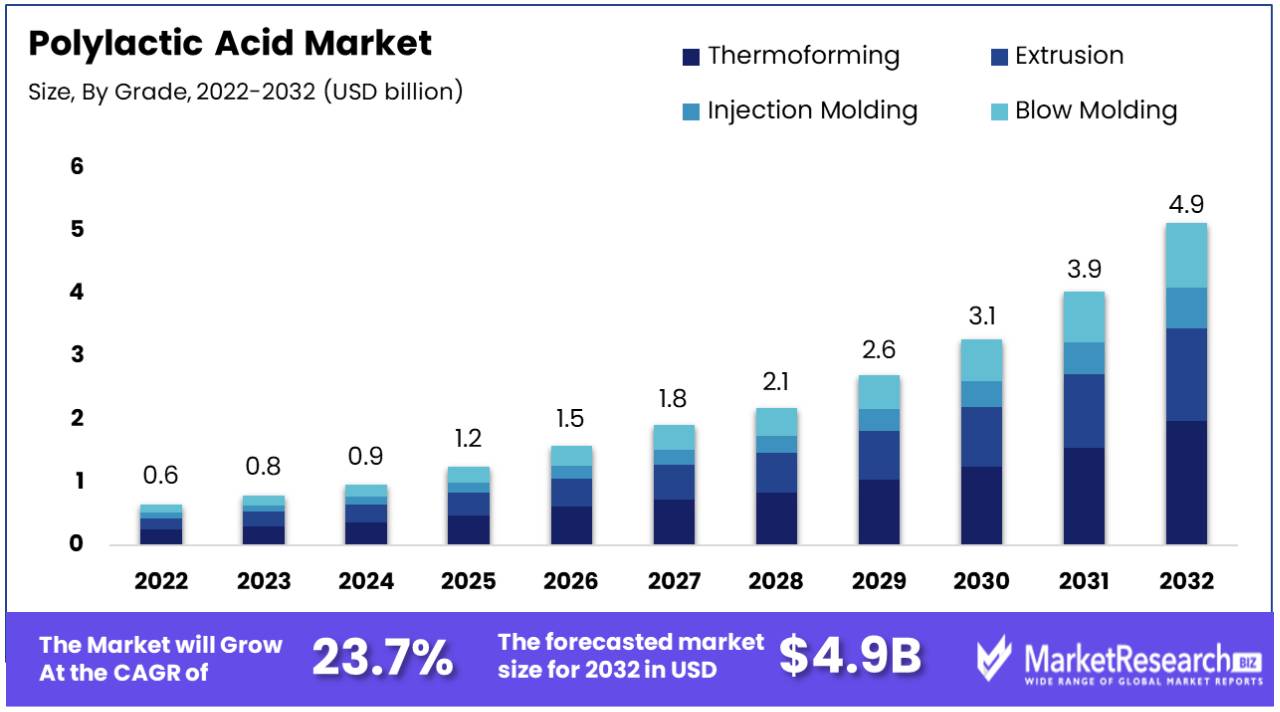
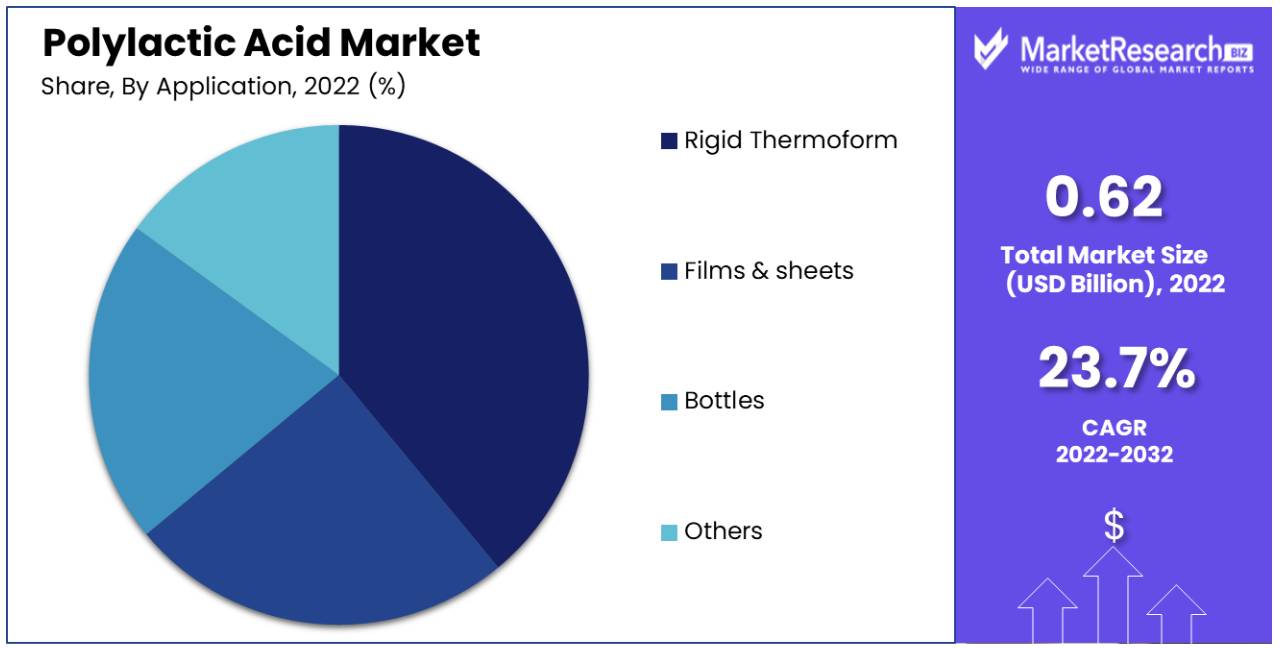
The global Polylactic Acid Market size was estimated at USD 0.62 billion in 2022 and is expected to grow at a CAGR of 23.7% from 2023 to 2032. It is expected to reach USD 4.9 billion by 2032.
Polylactic acid (PLA) is a type of biodegradable plastic that is primarily derived from materials, like corn starch and sugarcane. Its mechanical properties are superior to biodegradable polymers because it is classified as a polymer formed through the crystallization of lactic acid (C3H4O2). This polymer is both hydrophobic and crystalline making it versatile and environmentally friendly with applications across industries.
Currently PLA dominates the consumption charts for bioplastics in terms of volume, driven by government subsidies and growing environmental concerns about petroleum based plastics.
The packaging, textiles and electronics industries in developing countries are experiencing growth due to advancements knowledge transfers from developed nations and increasing consumer demands. Moreover, the rising global popularity of bioplastics has attracted investments while expanding the range of applications for PLA in industrial sectors. This flexible acid derived from sugarcane and corn starch has found use, in manufacturing plastic films, bottles, automotive components especially excelling in food packaging and medical devices.
The major players, in the Polylactic acid market are expected to benefit from the growth opportunities presented by the emerging applications of Polylactic acid. Polylactic acids have functions. Their production can be easily supported by readily available raw materials in both developed and emerging economies. For instance, The United States had a hold, on the PLA market in 2022. It is expected to continue. This dominance can be attributed to the availability of materials and the presence of key manufacturers involved in PLA production.
Despite the challenges caused by the pandemic, in the fashion apparel market there has been a rise in the demand for personal protective clothing due to the increasing number of COVID 19 cases. This surge is playing a role in driving growth within the textile industry. Leading to an increased demand, for PLA specifically in this sector.
Driving Factors
Initiatives to Increase Environmental Awareness and Sustainability
The growing global emphasis on environmental preservation has been a major driving force in the Polylactic Acid (PLA) industry. With increased concern about environmental sustainability, there is a growing need for biodegradable alternatives such as PLA. This material is particularly valuable because it is derived from renewable sources such as maize starch or sugarcane. This makes PLA a more environmentally responsible option than traditional polymers manufactured from fossil fuels. This is exactly in line with the global effort to reduce plastic waste and reduce the overall environmental impact connected with plastic manufacture and disposal.
Government Policies Supporting Bioplastics
Governments around the world are taking proactive measures to fight plastic waste by establishing legislation and policies that encourage the use of biodegradable materials. These policies include a variety of actions such as providing incentives, implementing mandates, and establishing rules to stimulate the use of PLA and other bioplastics in a variety of industries. This regulatory drive gives the PLA market a significant boost by creating a favourable climate for expansion.
Expanding Packaging Industry Applications
Because of its biodegradability and composability, the packaging industry is a major consumer of PLA. PLA is used in a variety of applications in this business, including films, bottles, and food containers. This spike in demand is being driven by two factors. On the one hand, as customers become more environmentally concerned, they are gravitating toward eco-friendly packaging solutions. In response to this shift in customer expectations, companies are actively seeking for sustainable alternatives.
Technological Advances in PLA Manufacturing
Continuous advances in science and technology in the field of PLA manufacture have played a critical role in creating the market. These advancements have resulted in major advances in the characteristics of PLA while also lowering its production costs. Innovations in polymerization processes and the emergence of hybrid PLA mixes are two key breakthroughs. These developments have significantly broadened the variety of potential uses for PLA, boosting its acceptance across a wide range of sectors.
Restraining Factors
Mechanical properties and limited heat resistance
When compared to conventional plastics such as PET or HDPE, one of the key drawbacks of Polylactic Acid (PLA) is its inferior heat resistance and mechanical strength. This makes PLA less appropriate for applications requiring materials to tolerate high temperatures or to be extremely durable. PLA's characteristics may be insufficient for industries and applications that demand materials to withstand harsh environments. PLA, for example, may not be the best solution in the automotive or aerospace industries, where materials are frequently subjected to severe temperatures and mechanical stress.
Concerns about land use and dependence on feedstock supply
PLA is typically generated from crops such as corn starch and sugarcane. Despite the fact that these are renewable resources, there are worries regarding potential rivalry with food resources and agricultural land use. Critics contend that reserving arable land for PLA feedstock development may shift resources away from food production. Furthermore, the PLA market's reliance on specific feed stocks can render it subject to swings in availability and costs. Weather, crop yields, and worldwide demand for these feed stocks can all have a direct impact on the pricing and availability of PLA, thus influencing its market dynamics.
Pricing Competition and the Availability of Alternatives
Despite its eco-friendliness, PLA can often encounter price competitiveness issues when compared to traditional plastics. This could be a crucial element impacting its use in a variety of applications. Furthermore, the availability of other biodegradable materials or recycled plastics may put PLA in competition. When these alternatives are freely available and have comparable eco-friendly properties, firms and industries may choose them over PLA, thereby reducing its market share.
Growth Opportunities
Additive Manufacturing and 3D Printing
Because of its ease of use, low level of toxicity, and biodegradability, PLA is a prominent material in the 3D printing business. The growing use of 3D printing in a variety of industries, including healthcare, automotive, and consumer goods, is expected to fuel demand for PLA filaments and powders.
Textiles and consumer goods
PLA fibres, which have characteristics similar to polyester, can be employed in textile applications. PLA-based fabrics have the potential to acquire traction in the fashion and garment industries, given the growing need for sustainable and eco-friendly materials. Furthermore, PLA-based consumer goods including as flatware and containers can be used in place of single-use plastics.
Interiors and components for automobiles
The vehicle industry is investigating biodegradable materials for interior components such as panels, trim, and upholstery. PLA, with its renewable sourcing and recyclability potential, is an appealing solution for producers looking to lessen their environmental imprint.
Solutions for Sustainable Packaging
PLA is an ideal material for eco-friendly packaging because to its biodegradability and composability. As people become more environmentally conscious, there is a greater demand for sustainable packaging solutions in a variety of businesses. PLA's renewable origin and biodegradability place it at the forefront of the environmentally friendly packaging market.
By Grade Type
The thermoforming grade of PLA has the biggest market share, due to its exceptional properties that make it perfect for thermoforming procedures. Thermoforming encompasses heating a plastic sheet until it becomes pliant and then shaping it using casts or dies.
PLAs thermoforming grade stands out because of its opposition to heat, dimensional firmness and crystal clear look which makes it an excellent choice for packaging, not reusable food containers and consumer goods. Its transparency enhances product displays while its ability to endure temperatures ensures lasting durability. Renewable characteristics align with consumer’s prospects for friendly packaging solutions. This ascendency in the market highlights the role that PLA plays in meeting both sustainable packaging requests.
By Application Type
In terms of application type, rigid thermoforms is the largest sector, accounting for the majority of PLA market share. PLAs pre-eminence lies in its lucidity making it an ideal choice, for interesting and transparent packaging solutions. Its intrinsic strength and stringency make it suitable for a variety of products that entail integrity.
Additionally, the renewable nature of PLA line up perfectly with the cumulative consumer demand for eco packaging options. The mixture of these features is driving the growth of thermoform applications, in the PLA industry.
By End-Use Type
Packaging holds the market share, among end use industries. The increase in market size can be attributed to the rising need for packaging in the food and beverage as cosmetic industries worldwide. These factors play a role in the dominance of packaging, within the acid markets application segment. Additionally, there is a growth rate expected for the transport sector throughout the forecast period.
Key Market Segments
By Grade
- Thermoforming
- Extrusion
- Injection Molding
- Blow Molding
By Application
- Rigid Thermoform
- Films & sheets
- Bottles
- Others
By End-Use
- Packaging
- Consumer Goods
- Agricultural
- Textile
- Biomedical
Latest Trends
Bio-Based Feedstock Sourcing
An important trend in the PLA market is the use of bio-based feed stocks such as maize starch or sugarcane. This tendency is consistent with the larger goal of decreasing reliance on fossil fuels and boosting material sourcing sustainability.
High-Heat PLA Development
There is a rising emphasis on producing high-heat resistant PLA variations. This overcomes one of PLA's constraints, allowing it to be employed in applications requiring higher temperatures, such as automobile components and durable packaging.
Focus on Circular Economy Practices
The biodegradable nature of PLA accords with the ideas of the circular economy. This promotes a system in which things are meant to be reused, recycled, or degrade naturally. The implementation of PLA in various industries is being driven by the push toward circular economy principles.
Customized PLA Formulations
To suit unique industry requirements, manufacturers are increasingly producing customized PLA formulations. Tailoring PLA features such as stiffness, flexibility, and biodegradability to specific applications is becoming popular.
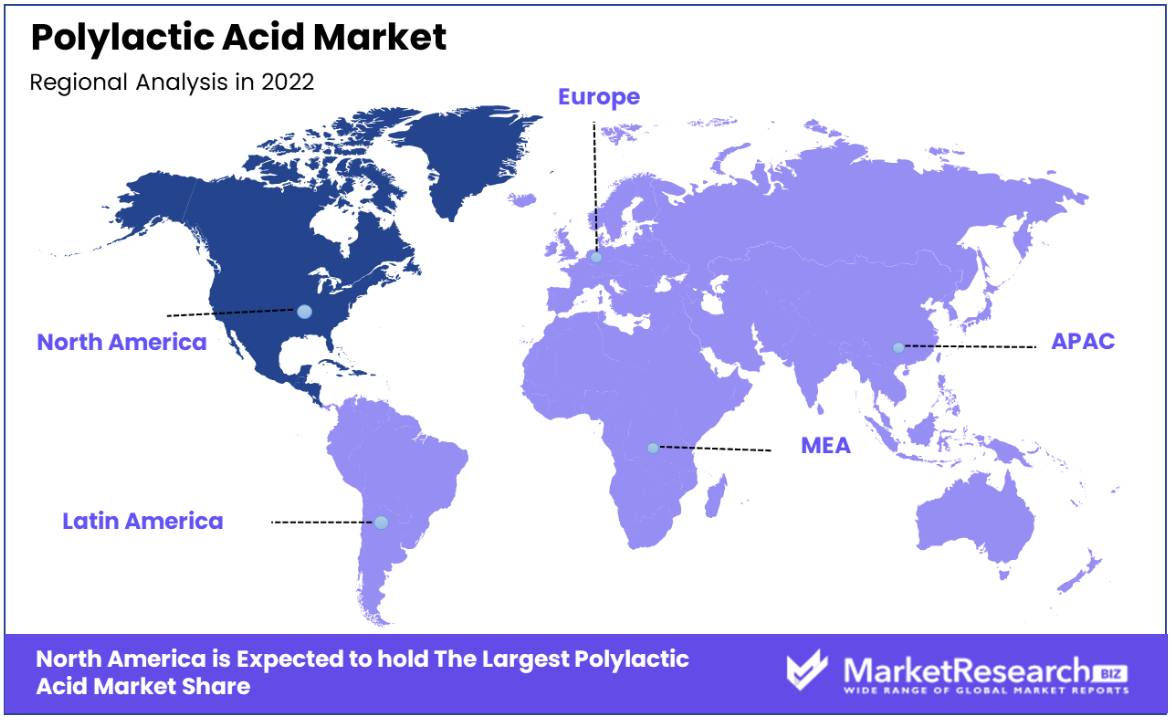
Regional Analysis
North America took the lead with a 43.0% share of revenue due, to the growing demand for bioplastics in Europe. This can be attributed to government regulations promoting its production and the abundant availability of materials in countries, within this region, particularly the United States.
In European nations industries are increasingly turning to bioplastics of traditional petroleum based plastics due to the strict regulations imposed by governments. The regions demand for Polylactic acid is anticipated to increase because of the availability of government subsidies for products and technical expertise. The global market for Polylactic acid is expected to experience growth during the forecast period.
Key Regions and Countries
North America
- US
- Canada
Europe
- Germany
- France
- UK
- Spain
- Italy
- Russia
- Netherland
- Rest of Europe
Asia Pacific
- China
- Japan
- South Korea
- India
- New Zealand
- Singapore
- Thailand
- Vietnam
- Rest of APAC
Latin America
- Brazil
- Mexico
- Rest of Latin America
Middle East & Africa
- South Africa
- Saudi Arabia
- UAE
- Rest of MEA
Key Players Analysis
Major companies, in the market for Polylactic acid production are working together to offer solutions that meet the specific demand, for Polylactic acid. Many European and American firms are taking steps to increase acid production in the growing Asia Pacific market through technology and expertise transfer.
Key Players in Polylactic Acid Market
- TotalEnergies Corbion bv
- NatureWorks LLC
- Jiangsu Supla Bioplastics Co., Ltd.
- Futerro
- COFCO
- Jiangxi Keyuan Biopharm Co.,Ltd
- Shanghai Tong-jie-liang Biomaterials Co., Ltd.
- Zhejiang Hisun Biomaterials Co., Ltd.
- Corbion Purac BV
- Mitsui Chemicals, Inc.
- Hitachi, Ltd.
- BASF SE
- Braskem
- Uhde Inventa-Fischer
- Toray
- Synbra Technology
- Sulzer
- Teijin
- Toyobo
- Hisun Biomaterials
Recent Developments
- In October 2023, NatureWorks is currently building a brand manufacturing facility, in the Nakhon Sawan Province of Thailand which will be fully integrated for the production of Ingeo PLA biopolymer.
- In September 2023, BASF SE announced their line of additives called biomass balance additives. These ground-breaking additives are formulated to encourage the utilization of resources of fossil fuels in line, with the company’s dedication to sustainability objectives.
- TotalEnergies Corbion teamed together with Bluepha Co. Ltd. in May 2023, with the goal of pioneering sustainable biomaterial solutions in China. Bluepha polyhydroxyalkanoates (PHA) are combined with TotalEnergies Corbion's Luminy polylactic acid technology in this venture.
Report Scope
Report Features Description Market Value (2022) USD 0.62 Bn Forecast Revenue (2032) USD 4.9 Bn CAGR (2023-2032) 23.7% Base Year for Estimation 2022 Historic Period 2016-2022 Forecast Period 2023-2032 Report Coverage Revenue Forecast, Market Dynamics, COVID-19 Impact, Competitive Landscape, Recent Developments Segments Covered By Grade (Thermoforming, Extrusion, Injection Molding, Blow Molding), By Application (Rigid Thermoform, Films & sheets, Bottles, Others), By End-Use Industry (Packaging, Consumer Goods, Agricultural, Textile, Biomedical) Regional Analysis North America – The US, Canada, & Mexico; Western Europe – Germany, France, The UK, Spain, Italy, Portugal, Ireland, Austria, Switzerland, Benelux, Nordic, & Rest of Western Europe; Eastern Europe – Russia, Poland, The Czech Republic, Greece, & Rest of Eastern Europe; APAC – China, Japan, South Korea, India, Australia & New Zealand, Indonesia, Malaysia, Philippines, Singapore, Thailand, Vietnam, & Rest of APAC; Latin America – Brazil, Colombia, Chile, Argentina, Costa Rica, & Rest of Latin America; Middle East & Africa – Algeria, Egypt, Israel, Kuwait, Nigeria, Saudi Arabia, South Africa, Turkey, United Arab Emirates, & Rest of MEA Competitive Landscape TotalEnergies Corbion bv, NatureWorks LLC, Jiangsu Supla Bioplastics Co., Ltd., Futerro, COFCO, Jiangxi Keyuan Biopharm Co.,Ltd, Shanghai Tong-jie-liang Biomaterials Co., Ltd., Zhejiang Hisun Biomaterials Co., Ltd., Corbion Purac BV, Mitsui Chemicals, Inc., Hitachi, Ltd., BASF SE, Braskem, Uhde Inventa-Fischer, Toray, Synbra Technology, Sulzer, Teijin, Toyobo, Hisun Biomaterials Customization Scope Customization for segments, region/country-level will be provided. Moreover, additional customization can be done based on the requirements. Purchase Options We have three licenses to opt for: Single User License, Multi-User License (Up to 5 Users), Corporate Use License (Unlimited User and Printable PDF) -
- 1. Executive Summary
- 1.1. Definition
- 1.2. Taxonomy
- 1.3. Research Scope
- 1.4. Key Analysis
- 1.5. Key Findings by Major Segments
- 1.6. Top strategies by Major Players
- 2. Global Polylactic Acid Market Overview
- 2.1. Polylactic Acid Market Dynamics
- 2.1.1. Drivers
- 2.1.2. Opportunities
- 2.1.3. Restraints
- 2.1.4. Challenges
- 2.2. Macro-economic Factors
- 2.3. Regulatory Framework
- 2.4. Market Investment Feasibility Index
- 2.5. PEST Analysis
- 2.6. PORTER’S Five Force Analysis
- 2.7. Drivers & Restraints Impact Analysis
- 2.8. Industry Chain Analysis
- 2.9. Cost Structure Analysis
- 2.10. Marketing Strategy
- 2.11. Russia-Ukraine War Impact Analysis
- 2.12. Opportunity Map Analysis
- 2.13. Market Competition Scenario Analysis
- 2.14. Product Life Cycle Analysis
- 2.15. Opportunity Orbits
- 2.16. Manufacturer Intensity Map
- 2.17. Major Companies sales by Value & Volume
- 2.1. Polylactic Acid Market Dynamics
- 3. Global Polylactic Acid Market Analysis, Opportunity and Forecast, 2016-2032
- 3.1. Global Polylactic Acid Market Analysis, 2016-2021
- 3.2. Global Polylactic Acid Market Opportunity and Forecast, 2023-2032
- 3.3. Global Polylactic Acid Market Analysis, Opportunity and Forecast, By Grade , 2016-2032
- 3.3.1. Global Polylactic Acid Market Analysis by Grade : Introduction
- 3.3.2. Market Size Absolute $ Opportunity Analysis and Forecast, By Grade , 2016-2032
- 3.3.3. Thermoforming
- 3.3.4. Extrusion
- 3.3.5. Injection Molding
- 3.3.6. Blow Molding
- 3.4. Global Polylactic Acid Market Analysis, Opportunity and Forecast, By Application, 2016-2032
- 3.4.1. Global Polylactic Acid Market Analysis by Application: Introduction
- 3.4.2. Market Size Absolute $ Opportunity Analysis and Forecast, By Application, 2016-2032
- 3.4.3. Rigid Thermoform
- 3.4.4. Films & sheets
- 3.4.5. Bottles
- 3.4.6. Others
- 3.5. Global Polylactic Acid Market Analysis, Opportunity and Forecast, By End-Use, 2016-2032
- 3.5.1. Global Polylactic Acid Market Analysis by End-Use: Introduction
- 3.5.2. Market Size Absolute $ Opportunity Analysis and Forecast, By End-Use, 2016-2032
- 3.5.3. Packaging
- 3.5.4. Consumer Goods
- 3.5.5. Agricultural
- 3.5.6. Textile
- 3.5.7. Biomedical
- 4. North America Polylactic Acid Market Analysis, Opportunity and Forecast, 2016-2032
- 4.1. North America Polylactic Acid Market Analysis, 2016-2021
- 4.2. North America Polylactic Acid Market Opportunity and Forecast, 2023-2032
- 4.3. North America Polylactic Acid Market Analysis, Opportunity and Forecast, By Grade , 2016-2032
- 4.3.1. North America Polylactic Acid Market Analysis by Grade : Introduction
- 4.3.2. Market Size Absolute $ Opportunity Analysis and Forecast, By Grade , 2016-2032
- 4.3.3. Thermoforming
- 4.3.4. Extrusion
- 4.3.5. Injection Molding
- 4.3.6. Blow Molding
- 4.4. North America Polylactic Acid Market Analysis, Opportunity and Forecast, By Application, 2016-2032
- 4.4.1. North America Polylactic Acid Market Analysis by Application: Introduction
- 4.4.2. Market Size Absolute $ Opportunity Analysis and Forecast, By Application, 2016-2032
- 4.4.3. Rigid Thermoform
- 4.4.4. Films & sheets
- 4.4.5. Bottles
- 4.4.6. Others
- 4.5. North America Polylactic Acid Market Analysis, Opportunity and Forecast, By End-Use, 2016-2032
- 4.5.1. North America Polylactic Acid Market Analysis by End-Use: Introduction
- 4.5.2. Market Size Absolute $ Opportunity Analysis and Forecast, By End-Use, 2016-2032
- 4.5.3. Packaging
- 4.5.4. Consumer Goods
- 4.5.5. Agricultural
- 4.5.6. Textile
- 4.5.7. Biomedical
- 4.6. North America Polylactic Acid Market Analysis, Opportunity and Forecast, By Country , 2016-2032
- 4.6.1. North America Polylactic Acid Market Analysis by Country : Introduction
- 4.6.2. Market Size Absolute $ Opportunity Analysis and Forecast, Country , 2016-2032
- 4.6.2.1. The US
- 4.6.2.2. Canada
- 4.6.2.3. Mexico
- 5. Western Europe Polylactic Acid Market Analysis, Opportunity and Forecast, 2016-2032
- 5.1. Western Europe Polylactic Acid Market Analysis, 2016-2021
- 5.2. Western Europe Polylactic Acid Market Opportunity and Forecast, 2023-2032
- 5.3. Western Europe Polylactic Acid Market Analysis, Opportunity and Forecast, By Grade , 2016-2032
- 5.3.1. Western Europe Polylactic Acid Market Analysis by Grade : Introduction
- 5.3.2. Market Size Absolute $ Opportunity Analysis and Forecast, By Grade , 2016-2032
- 5.3.3. Thermoforming
- 5.3.4. Extrusion
- 5.3.5. Injection Molding
- 5.3.6. Blow Molding
- 5.4. Western Europe Polylactic Acid Market Analysis, Opportunity and Forecast, By Application, 2016-2032
- 5.4.1. Western Europe Polylactic Acid Market Analysis by Application: Introduction
- 5.4.2. Market Size Absolute $ Opportunity Analysis and Forecast, By Application, 2016-2032
- 5.4.3. Rigid Thermoform
- 5.4.4. Films & sheets
- 5.4.5. Bottles
- 5.4.6. Others
- 5.5. Western Europe Polylactic Acid Market Analysis, Opportunity and Forecast, By End-Use, 2016-2032
- 5.5.1. Western Europe Polylactic Acid Market Analysis by End-Use: Introduction
- 5.5.2. Market Size Absolute $ Opportunity Analysis and Forecast, By End-Use, 2016-2032
- 5.5.3. Packaging
- 5.5.4. Consumer Goods
- 5.5.5. Agricultural
- 5.5.6. Textile
- 5.5.7. Biomedical
- 5.6. Western Europe Polylactic Acid Market Analysis, Opportunity and Forecast, By Country , 2016-2032
- 5.6.1. Western Europe Polylactic Acid Market Analysis by Country : Introduction
- 5.6.2. Market Size Absolute $ Opportunity Analysis and Forecast, Country , 2016-2032
- 5.6.2.1. Germany
- 5.6.2.2. France
- 5.6.2.3. The UK
- 5.6.2.4. Spain
- 5.6.2.5. Italy
- 5.6.2.6. Portugal
- 5.6.2.7. Ireland
- 5.6.2.8. Austria
- 5.6.2.9. Switzerland
- 5.6.2.10. Benelux
- 5.6.2.11. Nordic
- 5.6.2.12. Rest of Western Europe
- 6. Eastern Europe Polylactic Acid Market Analysis, Opportunity and Forecast, 2016-2032
- 6.1. Eastern Europe Polylactic Acid Market Analysis, 2016-2021
- 6.2. Eastern Europe Polylactic Acid Market Opportunity and Forecast, 2023-2032
- 6.3. Eastern Europe Polylactic Acid Market Analysis, Opportunity and Forecast, By Grade , 2016-2032
- 6.3.1. Eastern Europe Polylactic Acid Market Analysis by Grade : Introduction
- 6.3.2. Market Size Absolute $ Opportunity Analysis and Forecast, By Grade , 2016-2032
- 6.3.3. Thermoforming
- 6.3.4. Extrusion
- 6.3.5. Injection Molding
- 6.3.6. Blow Molding
- 6.4. Eastern Europe Polylactic Acid Market Analysis, Opportunity and Forecast, By Application, 2016-2032
- 6.4.1. Eastern Europe Polylactic Acid Market Analysis by Application: Introduction
- 6.4.2. Market Size Absolute $ Opportunity Analysis and Forecast, By Application, 2016-2032
- 6.4.3. Rigid Thermoform
- 6.4.4. Films & sheets
- 6.4.5. Bottles
- 6.4.6. Others
- 6.5. Eastern Europe Polylactic Acid Market Analysis, Opportunity and Forecast, By End-Use, 2016-2032
- 6.5.1. Eastern Europe Polylactic Acid Market Analysis by End-Use: Introduction
- 6.5.2. Market Size Absolute $ Opportunity Analysis and Forecast, By End-Use, 2016-2032
- 6.5.3. Packaging
- 6.5.4. Consumer Goods
- 6.5.5. Agricultural
- 6.5.6. Textile
- 6.5.7. Biomedical
- 6.6. Eastern Europe Polylactic Acid Market Analysis, Opportunity and Forecast, By Country , 2016-2032
- 6.6.1. Eastern Europe Polylactic Acid Market Analysis by Country : Introduction
- 6.6.2. Market Size Absolute $ Opportunity Analysis and Forecast, Country , 2016-2032
- 6.6.2.1. Russia
- 6.6.2.2. Poland
- 6.6.2.3. The Czech Republic
- 6.6.2.4. Greece
- 6.6.2.5. Rest of Eastern Europe
- 7. APAC Polylactic Acid Market Analysis, Opportunity and Forecast, 2016-2032
- 7.1. APAC Polylactic Acid Market Analysis, 2016-2021
- 7.2. APAC Polylactic Acid Market Opportunity and Forecast, 2023-2032
- 7.3. APAC Polylactic Acid Market Analysis, Opportunity and Forecast, By Grade , 2016-2032
- 7.3.1. APAC Polylactic Acid Market Analysis by Grade : Introduction
- 7.3.2. Market Size Absolute $ Opportunity Analysis and Forecast, By Grade , 2016-2032
- 7.3.3. Thermoforming
- 7.3.4. Extrusion
- 7.3.5. Injection Molding
- 7.3.6. Blow Molding
- 7.4. APAC Polylactic Acid Market Analysis, Opportunity and Forecast, By Application, 2016-2032
- 7.4.1. APAC Polylactic Acid Market Analysis by Application: Introduction
- 7.4.2. Market Size Absolute $ Opportunity Analysis and Forecast, By Application, 2016-2032
- 7.4.3. Rigid Thermoform
- 7.4.4. Films & sheets
- 7.4.5. Bottles
- 7.4.6. Others
- 7.5. APAC Polylactic Acid Market Analysis, Opportunity and Forecast, By End-Use, 2016-2032
- 7.5.1. APAC Polylactic Acid Market Analysis by End-Use: Introduction
- 7.5.2. Market Size Absolute $ Opportunity Analysis and Forecast, By End-Use, 2016-2032
- 7.5.3. Packaging
- 7.5.4. Consumer Goods
- 7.5.5. Agricultural
- 7.5.6. Textile
- 7.5.7. Biomedical
- 7.6. APAC Polylactic Acid Market Analysis, Opportunity and Forecast, By Country , 2016-2032
- 7.6.1. APAC Polylactic Acid Market Analysis by Country : Introduction
- 7.6.2. Market Size Absolute $ Opportunity Analysis and Forecast, Country , 2016-2032
- 7.6.2.1. China
- 7.6.2.2. Japan
- 7.6.2.3. South Korea
- 7.6.2.4. India
- 7.6.2.5. Australia & New Zeland
- 7.6.2.6. Indonesia
- 7.6.2.7. Malaysia
- 7.6.2.8. Philippines
- 7.6.2.9. Singapore
- 7.6.2.10. Thailand
- 7.6.2.11. Vietnam
- 7.6.2.12. Rest of APAC
- 8. Latin America Polylactic Acid Market Analysis, Opportunity and Forecast, 2016-2032
- 8.1. Latin America Polylactic Acid Market Analysis, 2016-2021
- 8.2. Latin America Polylactic Acid Market Opportunity and Forecast, 2023-2032
- 8.3. Latin America Polylactic Acid Market Analysis, Opportunity and Forecast, By Grade , 2016-2032
- 8.3.1. Latin America Polylactic Acid Market Analysis by Grade : Introduction
- 8.3.2. Market Size Absolute $ Opportunity Analysis and Forecast, By Grade , 2016-2032
- 8.3.3. Thermoforming
- 8.3.4. Extrusion
- 8.3.5. Injection Molding
- 8.3.6. Blow Molding
- 8.4. Latin America Polylactic Acid Market Analysis, Opportunity and Forecast, By Application, 2016-2032
- 8.4.1. Latin America Polylactic Acid Market Analysis by Application: Introduction
- 8.4.2. Market Size Absolute $ Opportunity Analysis and Forecast, By Application, 2016-2032
- 8.4.3. Rigid Thermoform
- 8.4.4. Films & sheets
- 8.4.5. Bottles
- 8.4.6. Others
- 8.5. Latin America Polylactic Acid Market Analysis, Opportunity and Forecast, By End-Use, 2016-2032
- 8.5.1. Latin America Polylactic Acid Market Analysis by End-Use: Introduction
- 8.5.2. Market Size Absolute $ Opportunity Analysis and Forecast, By End-Use, 2016-2032
- 8.5.3. Packaging
- 8.5.4. Consumer Goods
- 8.5.5. Agricultural
- 8.5.6. Textile
- 8.5.7. Biomedical
- 8.6. Latin America Polylactic Acid Market Analysis, Opportunity and Forecast, By Country , 2016-2032
- 8.6.1. Latin America Polylactic Acid Market Analysis by Country : Introduction
- 8.6.2. Market Size Absolute $ Opportunity Analysis and Forecast, Country , 2016-2032
- 8.6.2.1. Brazil
- 8.6.2.2. Colombia
- 8.6.2.3. Chile
- 8.6.2.4. Argentina
- 8.6.2.5. Costa Rica
- 8.6.2.6. Rest of Latin America
- 9. Middle East & Africa Polylactic Acid Market Analysis, Opportunity and Forecast, 2016-2032
- 9.1. Middle East & Africa Polylactic Acid Market Analysis, 2016-2021
- 9.2. Middle East & Africa Polylactic Acid Market Opportunity and Forecast, 2023-2032
- 9.3. Middle East & Africa Polylactic Acid Market Analysis, Opportunity and Forecast, By Grade , 2016-2032
- 9.3.1. Middle East & Africa Polylactic Acid Market Analysis by Grade : Introduction
- 9.3.2. Market Size Absolute $ Opportunity Analysis and Forecast, By Grade , 2016-2032
- 9.3.3. Thermoforming
- 9.3.4. Extrusion
- 9.3.5. Injection Molding
- 9.3.6. Blow Molding
- 9.4. Middle East & Africa Polylactic Acid Market Analysis, Opportunity and Forecast, By Application, 2016-2032
- 9.4.1. Middle East & Africa Polylactic Acid Market Analysis by Application: Introduction
- 9.4.2. Market Size Absolute $ Opportunity Analysis and Forecast, By Application, 2016-2032
- 9.4.3. Rigid Thermoform
- 9.4.4. Films & sheets
- 9.4.5. Bottles
- 9.4.6. Others
- 9.5. Middle East & Africa Polylactic Acid Market Analysis, Opportunity and Forecast, By End-Use, 2016-2032
- 9.5.1. Middle East & Africa Polylactic Acid Market Analysis by End-Use: Introduction
- 9.5.2. Market Size Absolute $ Opportunity Analysis and Forecast, By End-Use, 2016-2032
- 9.5.3. Packaging
- 9.5.4. Consumer Goods
- 9.5.5. Agricultural
- 9.5.6. Textile
- 9.5.7. Biomedical
- 9.6. Middle East & Africa Polylactic Acid Market Analysis, Opportunity and Forecast, By Country , 2016-2032
- 9.6.1. Middle East & Africa Polylactic Acid Market Analysis by Country : Introduction
- 9.6.2. Market Size Absolute $ Opportunity Analysis and Forecast, Country , 2016-2032
- 9.6.2.1. Algeria
- 9.6.2.2. Egypt
- 9.6.2.3. Israel
- 9.6.2.4. Kuwait
- 9.6.2.5. Nigeria
- 9.6.2.6. Saudi Arabia
- 9.6.2.7. South Africa
- 9.6.2.8. Turkey
- 9.6.2.9. The UAE
- 9.6.2.10. Rest of MEA
- 10. Global Polylactic Acid Market Analysis, Opportunity and Forecast, By Region , 2016-2032
- 10.1. Global Polylactic Acid Market Analysis by Region : Introduction
- 10.2. Market Size Absolute $ Opportunity Analysis and Forecast, By Region , 2016-2032
- 10.2.1. North America
- 10.2.2. Western Europe
- 10.2.3. Eastern Europe
- 10.2.4. APAC
- 10.2.5. Latin America
- 10.2.6. Middle East & Africa
- 11. Global Polylactic Acid Market Competitive Landscape, Market Share Analysis, and Company Profiles
- 11.1. Market Share Analysis
- 11.2. Company Profiles
- 11.3. TotalEnergies Corbion bv
- 11.3.1. Company Overview
- 11.3.2. Financial Highlights
- 11.3.3. Product Portfolio
- 11.3.4. SWOT Analysis
- 11.3.5. Key Strategies and Developments
- 11.4. NatureWorks LLC
- 11.4.1. Company Overview
- 11.4.2. Financial Highlights
- 11.4.3. Product Portfolio
- 11.4.4. SWOT Analysis
- 11.4.5. Key Strategies and Developments
- 11.5. Jiangsu Supla Bioplastics Co., Ltd.
- 11.5.1. Company Overview
- 11.5.2. Financial Highlights
- 11.5.3. Product Portfolio
- 11.5.4. SWOT Analysis
- 11.5.5. Key Strategies and Developments
- 11.6. Futerro
- 11.6.1. Company Overview
- 11.6.2. Financial Highlights
- 11.6.3. Product Portfolio
- 11.6.4. SWOT Analysis
- 11.6.5. Key Strategies and Developments
- 11.7. COFCO
- 11.7.1. Company Overview
- 11.7.2. Financial Highlights
- 11.7.3. Product Portfolio
- 11.7.4. SWOT Analysis
- 11.7.5. Key Strategies and Developments
- 11.8. Jiangxi Keyuan Biopharm Co.,Ltd
- 11.8.1. Company Overview
- 11.8.2. Financial Highlights
- 11.8.3. Product Portfolio
- 11.8.4. SWOT Analysis
- 11.8.5. Key Strategies and Developments
- 11.9. Shanghai Tong-jie-liang Biomaterials Co., Ltd.
- 11.9.1. Company Overview
- 11.9.2. Financial Highlights
- 11.9.3. Product Portfolio
- 11.9.4. SWOT Analysis
- 11.9.5. Key Strategies and Developments
- 11.10. Zhejiang Hisun Biomaterials Co., Ltd.
- 11.10.1. Company Overview
- 11.10.2. Financial Highlights
- 11.10.3. Product Portfolio
- 11.10.4. SWOT Analysis
- 11.10.5. Key Strategies and Developments
- 11.11. Corbion Purac BV
- 11.11.1. Company Overview
- 11.11.2. Financial Highlights
- 11.11.3. Product Portfolio
- 11.11.4. SWOT Analysis
- 11.11.5. Key Strategies and Developments
- 11.12. Mitsui Chemicals, Inc.
- 11.12.1. Company Overview
- 11.12.2. Financial Highlights
- 11.12.3. Product Portfolio
- 11.12.4. SWOT Analysis
- 11.12.5. Key Strategies and Developments
- 11.13.1. Company Overview
- 11.13.2. Financial Highlights
- 11.13.3. Product Portfolio
- 11.13.4. SWOT Analysis
- 11.13.5. Key Strategies and Developments
- 11.14. Hitachi, Ltd.
- 11.14.1. Company Overview
- 11.14.2. Financial Highlights
- 11.14.3. Product Portfolio
- 11.14.4. SWOT Analysis
- 11.14.5. Key Strategies and Developments
- 11.15. Braskem
- 11.15.1. Company Overview
- 11.15.2. Financial Highlights
- 11.15.3. Product Portfolio
- 11.15.4. SWOT Analysis
- 11.15.5. Key Strategies and Developments
- 11.16. Uhde Inventa-Fischer
- 11.16.1. Company Overview
- 11.16.2. Financial Highlights
- 11.16.3. Product Portfolio
- 11.16.4. SWOT Analysis
- 11.16.5. Key Strategies and Developments
- 11.17. Toray
- 11.17.1. Company Overview
- 11.17.2. Financial Highlights
- 11.17.3. Product Portfolio
- 11.17.4. SWOT Analysis
- 11.17.5. Key Strategies and Developments
- 11.18. Synbra Technology
- 11.18.1. Company Overview
- 11.18.2. Financial Highlights
- 11.18.3. Product Portfolio
- 11.18.4. SWOT Analysis
- 11.18.5. Key Strategies and Developments
- 11.19. Sulzer
- 11.19.1. Company Overview
- 11.19.2. Financial Highlights
- 11.19.3. Product Portfolio
- 11.19.4. SWOT Analysis
- 11.19.5. Key Strategies and Developments
- 11.20. Teijin
- 11.20.1. Company Overview
- 11.20.2. Financial Highlights
- 11.20.3. Product Portfolio
- 11.20.4. SWOT Analysis
- 11.20.5. Key Strategies and Developments
- 11.21. Toyobo
- 11.21.1. Company Overview
- 11.21.2. Financial Highlights
- 11.21.3. Product Portfolio
- 11.21.4. SWOT Analysis
- 11.21.5. Key Strategies and Developments
- 11.22. Hisun Biomaterials
- 11.22.1. Company Overview
- 11.22.2. Financial Highlights
- 11.22.3. Product Portfolio
- 11.22.4. SWOT Analysis
- 11.22.5. Key Strategies and Developments
- 12. Assumptions and Acronyms
- 13. Research Methodology
- 14. Contact
- List of Figures
- Figure 1: Global Polylactic Acid Market Revenue (US$ Mn) Market Share by Grade in 2022
- Figure 2: Global Polylactic Acid Market Attractiveness Analysis by Grade , 2016-2032
- Figure 3: Global Polylactic Acid Market Revenue (US$ Mn) Market Share by Applicationin 2022
- Figure 4: Global Polylactic Acid Market Attractiveness Analysis by Application, 2016-2032
- Figure 5: Global Polylactic Acid Market Revenue (US$ Mn) Market Share by End-Usein 2022
- Figure 6: Global Polylactic Acid Market Attractiveness Analysis by End-Use, 2016-2032
- Figure 7: Global Polylactic Acid Market Revenue (US$ Mn) Market Share by Region in 2022
- Figure 8: Global Polylactic Acid Market Attractiveness Analysis by Region, 2016-2032
- Figure 9: Global Polylactic Acid Market Revenue (US$ Mn) (2016-2032)
- Figure 10: Global Polylactic Acid Market Revenue (US$ Mn) Comparison by Region (2016-2032)
- Figure 11: Global Polylactic Acid Market Revenue (US$ Mn) Comparison by Grade (2016-2032)
- Figure 12: Global Polylactic Acid Market Revenue (US$ Mn) Comparison by Application (2016-2032)
- Figure 13: Global Polylactic Acid Market Revenue (US$ Mn) Comparison by End-Use (2016-2032)
- Figure 14: Global Polylactic Acid Market Y-o-Y Growth Rate Comparison by Region (2016-2032)
- Figure 15: Global Polylactic Acid Market Y-o-Y Growth Rate Comparison by Grade (2016-2032)
- Figure 16: Global Polylactic Acid Market Y-o-Y Growth Rate Comparison by Application (2016-2032)
- Figure 17: Global Polylactic Acid Market Y-o-Y Growth Rate Comparison by End-Use (2016-2032)
- Figure 18: Global Polylactic Acid Market Share Comparison by Region (2016-2032)
- Figure 19: Global Polylactic Acid Market Share Comparison by Grade (2016-2032)
- Figure 20: Global Polylactic Acid Market Share Comparison by Application (2016-2032)
- Figure 21: Global Polylactic Acid Market Share Comparison by End-Use (2016-2032)
- Figure 22: North America Polylactic Acid Market Revenue (US$ Mn) Market Share by Grade in 2022
- Figure 23: North America Polylactic Acid Market Attractiveness Analysis by Grade , 2016-2032
- Figure 24: North America Polylactic Acid Market Revenue (US$ Mn) Market Share by Applicationin 2022
- Figure 25: North America Polylactic Acid Market Attractiveness Analysis by Application, 2016-2032
- Figure 26: North America Polylactic Acid Market Revenue (US$ Mn) Market Share by End-Usein 2022
- Figure 27: North America Polylactic Acid Market Attractiveness Analysis by End-Use, 2016-2032
- Figure 28: North America Polylactic Acid Market Revenue (US$ Mn) Market Share by Country in 2022
- Figure 29: North America Polylactic Acid Market Attractiveness Analysis by Country, 2016-2032
- Figure 30: North America Polylactic Acid Market Revenue (US$ Mn) (2016-2032)
- Figure 31: North America Polylactic Acid Market Revenue (US$ Mn) Comparison by Country (2016-2032)
- Figure 32: North America Polylactic Acid Market Revenue (US$ Mn) Comparison by Grade (2016-2032)
- Figure 33: North America Polylactic Acid Market Revenue (US$ Mn) Comparison by Application (2016-2032)
- Figure 34: North America Polylactic Acid Market Revenue (US$ Mn) Comparison by End-Use (2016-2032)
- Figure 35: North America Polylactic Acid Market Y-o-Y Growth Rate Comparison by Country (2016-2032)
- Figure 36: North America Polylactic Acid Market Y-o-Y Growth Rate Comparison by Grade (2016-2032)
- Figure 37: North America Polylactic Acid Market Y-o-Y Growth Rate Comparison by Application (2016-2032)
- Figure 38: North America Polylactic Acid Market Y-o-Y Growth Rate Comparison by End-Use (2016-2032)
- Figure 39: North America Polylactic Acid Market Share Comparison by Country (2016-2032)
- Figure 40: North America Polylactic Acid Market Share Comparison by Grade (2016-2032)
- Figure 41: North America Polylactic Acid Market Share Comparison by Application (2016-2032)
- Figure 42: North America Polylactic Acid Market Share Comparison by End-Use (2016-2032)
- Figure 43: Western Europe Polylactic Acid Market Revenue (US$ Mn) Market Share by Grade in 2022
- Figure 44: Western Europe Polylactic Acid Market Attractiveness Analysis by Grade , 2016-2032
- Figure 45: Western Europe Polylactic Acid Market Revenue (US$ Mn) Market Share by Applicationin 2022
- Figure 46: Western Europe Polylactic Acid Market Attractiveness Analysis by Application, 2016-2032
- Figure 47: Western Europe Polylactic Acid Market Revenue (US$ Mn) Market Share by End-Usein 2022
- Figure 48: Western Europe Polylactic Acid Market Attractiveness Analysis by End-Use, 2016-2032
- Figure 49: Western Europe Polylactic Acid Market Revenue (US$ Mn) Market Share by Country in 2022
- Figure 50: Western Europe Polylactic Acid Market Attractiveness Analysis by Country, 2016-2032
- Figure 51: Western Europe Polylactic Acid Market Revenue (US$ Mn) (2016-2032)
- Figure 52: Western Europe Polylactic Acid Market Revenue (US$ Mn) Comparison by Country (2016-2032)
- Figure 53: Western Europe Polylactic Acid Market Revenue (US$ Mn) Comparison by Grade (2016-2032)
- Figure 54: Western Europe Polylactic Acid Market Revenue (US$ Mn) Comparison by Application (2016-2032)
- Figure 55: Western Europe Polylactic Acid Market Revenue (US$ Mn) Comparison by End-Use (2016-2032)
- Figure 56: Western Europe Polylactic Acid Market Y-o-Y Growth Rate Comparison by Country (2016-2032)
- Figure 57: Western Europe Polylactic Acid Market Y-o-Y Growth Rate Comparison by Grade (2016-2032)
- Figure 58: Western Europe Polylactic Acid Market Y-o-Y Growth Rate Comparison by Application (2016-2032)
- Figure 59: Western Europe Polylactic Acid Market Y-o-Y Growth Rate Comparison by End-Use (2016-2032)
- Figure 60: Western Europe Polylactic Acid Market Share Comparison by Country (2016-2032)
- Figure 61: Western Europe Polylactic Acid Market Share Comparison by Grade (2016-2032)
- Figure 62: Western Europe Polylactic Acid Market Share Comparison by Application (2016-2032)
- Figure 63: Western Europe Polylactic Acid Market Share Comparison by End-Use (2016-2032)
- Figure 64: Eastern Europe Polylactic Acid Market Revenue (US$ Mn) Market Share by Grade in 2022
- Figure 65: Eastern Europe Polylactic Acid Market Attractiveness Analysis by Grade , 2016-2032
- Figure 66: Eastern Europe Polylactic Acid Market Revenue (US$ Mn) Market Share by Applicationin 2022
- Figure 67: Eastern Europe Polylactic Acid Market Attractiveness Analysis by Application, 2016-2032
- Figure 68: Eastern Europe Polylactic Acid Market Revenue (US$ Mn) Market Share by End-Usein 2022
- Figure 69: Eastern Europe Polylactic Acid Market Attractiveness Analysis by End-Use, 2016-2032
- Figure 70: Eastern Europe Polylactic Acid Market Revenue (US$ Mn) Market Share by Country in 2022
- Figure 71: Eastern Europe Polylactic Acid Market Attractiveness Analysis by Country, 2016-2032
- Figure 72: Eastern Europe Polylactic Acid Market Revenue (US$ Mn) (2016-2032)
- Figure 73: Eastern Europe Polylactic Acid Market Revenue (US$ Mn) Comparison by Country (2016-2032)
- Figure 74: Eastern Europe Polylactic Acid Market Revenue (US$ Mn) Comparison by Grade (2016-2032)
- Figure 75: Eastern Europe Polylactic Acid Market Revenue (US$ Mn) Comparison by Application (2016-2032)
- Figure 76: Eastern Europe Polylactic Acid Market Revenue (US$ Mn) Comparison by End-Use (2016-2032)
- Figure 77: Eastern Europe Polylactic Acid Market Y-o-Y Growth Rate Comparison by Country (2016-2032)
- Figure 78: Eastern Europe Polylactic Acid Market Y-o-Y Growth Rate Comparison by Grade (2016-2032)
- Figure 79: Eastern Europe Polylactic Acid Market Y-o-Y Growth Rate Comparison by Application (2016-2032)
- Figure 80: Eastern Europe Polylactic Acid Market Y-o-Y Growth Rate Comparison by End-Use (2016-2032)
- Figure 81: Eastern Europe Polylactic Acid Market Share Comparison by Country (2016-2032)
- Figure 82: Eastern Europe Polylactic Acid Market Share Comparison by Grade (2016-2032)
- Figure 83: Eastern Europe Polylactic Acid Market Share Comparison by Application (2016-2032)
- Figure 84: Eastern Europe Polylactic Acid Market Share Comparison by End-Use (2016-2032)
- Figure 85: APAC Polylactic Acid Market Revenue (US$ Mn) Market Share by Grade in 2022
- Figure 86: APAC Polylactic Acid Market Attractiveness Analysis by Grade , 2016-2032
- Figure 87: APAC Polylactic Acid Market Revenue (US$ Mn) Market Share by Applicationin 2022
- Figure 88: APAC Polylactic Acid Market Attractiveness Analysis by Application, 2016-2032
- Figure 89: APAC Polylactic Acid Market Revenue (US$ Mn) Market Share by End-Usein 2022
- Figure 90: APAC Polylactic Acid Market Attractiveness Analysis by End-Use, 2016-2032
- Figure 91: APAC Polylactic Acid Market Revenue (US$ Mn) Market Share by Country in 2022
- Figure 92: APAC Polylactic Acid Market Attractiveness Analysis by Country, 2016-2032
- Figure 93: APAC Polylactic Acid Market Revenue (US$ Mn) (2016-2032)
- Figure 94: APAC Polylactic Acid Market Revenue (US$ Mn) Comparison by Country (2016-2032)
- Figure 95: APAC Polylactic Acid Market Revenue (US$ Mn) Comparison by Grade (2016-2032)
- Figure 96: APAC Polylactic Acid Market Revenue (US$ Mn) Comparison by Application (2016-2032)
- Figure 97: APAC Polylactic Acid Market Revenue (US$ Mn) Comparison by End-Use (2016-2032)
- Figure 98: APAC Polylactic Acid Market Y-o-Y Growth Rate Comparison by Country (2016-2032)
- Figure 99: APAC Polylactic Acid Market Y-o-Y Growth Rate Comparison by Grade (2016-2032)
- Figure 100: APAC Polylactic Acid Market Y-o-Y Growth Rate Comparison by Application (2016-2032)
- Figure 101: APAC Polylactic Acid Market Y-o-Y Growth Rate Comparison by End-Use (2016-2032)
- Figure 102: APAC Polylactic Acid Market Share Comparison by Country (2016-2032)
- Figure 103: APAC Polylactic Acid Market Share Comparison by Grade (2016-2032)
- Figure 104: APAC Polylactic Acid Market Share Comparison by Application (2016-2032)
- Figure 105: APAC Polylactic Acid Market Share Comparison by End-Use (2016-2032)
- Figure 106: Latin America Polylactic Acid Market Revenue (US$ Mn) Market Share by Grade in 2022
- Figure 107: Latin America Polylactic Acid Market Attractiveness Analysis by Grade , 2016-2032
- Figure 108: Latin America Polylactic Acid Market Revenue (US$ Mn) Market Share by Applicationin 2022
- Figure 109: Latin America Polylactic Acid Market Attractiveness Analysis by Application, 2016-2032
- Figure 110: Latin America Polylactic Acid Market Revenue (US$ Mn) Market Share by End-Usein 2022
- Figure 111: Latin America Polylactic Acid Market Attractiveness Analysis by End-Use, 2016-2032
- Figure 112: Latin America Polylactic Acid Market Revenue (US$ Mn) Market Share by Country in 2022
- Figure 113: Latin America Polylactic Acid Market Attractiveness Analysis by Country, 2016-2032
- Figure 114: Latin America Polylactic Acid Market Revenue (US$ Mn) (2016-2032)
- Figure 115: Latin America Polylactic Acid Market Revenue (US$ Mn) Comparison by Country (2016-2032)
- Figure 116: Latin America Polylactic Acid Market Revenue (US$ Mn) Comparison by Grade (2016-2032)
- Figure 117: Latin America Polylactic Acid Market Revenue (US$ Mn) Comparison by Application (2016-2032)
- Figure 118: Latin America Polylactic Acid Market Revenue (US$ Mn) Comparison by End-Use (2016-2032)
- Figure 119: Latin America Polylactic Acid Market Y-o-Y Growth Rate Comparison by Country (2016-2032)
- Figure 120: Latin America Polylactic Acid Market Y-o-Y Growth Rate Comparison by Grade (2016-2032)
- Figure 121: Latin America Polylactic Acid Market Y-o-Y Growth Rate Comparison by Application (2016-2032)
- Figure 122: Latin America Polylactic Acid Market Y-o-Y Growth Rate Comparison by End-Use (2016-2032)
- Figure 123: Latin America Polylactic Acid Market Share Comparison by Country (2016-2032)
- Figure 124: Latin America Polylactic Acid Market Share Comparison by Grade (2016-2032)
- Figure 125: Latin America Polylactic Acid Market Share Comparison by Application (2016-2032)
- Figure 126: Latin America Polylactic Acid Market Share Comparison by End-Use (2016-2032)
- Figure 127: Middle East & Africa Polylactic Acid Market Revenue (US$ Mn) Market Share by Grade in 2022
- Figure 128: Middle East & Africa Polylactic Acid Market Attractiveness Analysis by Grade , 2016-2032
- Figure 129: Middle East & Africa Polylactic Acid Market Revenue (US$ Mn) Market Share by Applicationin 2022
- Figure 130: Middle East & Africa Polylactic Acid Market Attractiveness Analysis by Application, 2016-2032
- Figure 131: Middle East & Africa Polylactic Acid Market Revenue (US$ Mn) Market Share by End-Usein 2022
- Figure 132: Middle East & Africa Polylactic Acid Market Attractiveness Analysis by End-Use, 2016-2032
- Figure 133: Middle East & Africa Polylactic Acid Market Revenue (US$ Mn) Market Share by Country in 2022
- Figure 134: Middle East & Africa Polylactic Acid Market Attractiveness Analysis by Country, 2016-2032
- Figure 135: Middle East & Africa Polylactic Acid Market Revenue (US$ Mn) (2016-2032)
- Figure 136: Middle East & Africa Polylactic Acid Market Revenue (US$ Mn) Comparison by Country (2016-2032)
- Figure 137: Middle East & Africa Polylactic Acid Market Revenue (US$ Mn) Comparison by Grade (2016-2032)
- Figure 138: Middle East & Africa Polylactic Acid Market Revenue (US$ Mn) Comparison by Application (2016-2032)
- Figure 139: Middle East & Africa Polylactic Acid Market Revenue (US$ Mn) Comparison by End-Use (2016-2032)
- Figure 140: Middle East & Africa Polylactic Acid Market Y-o-Y Growth Rate Comparison by Country (2016-2032)
- Figure 141: Middle East & Africa Polylactic Acid Market Y-o-Y Growth Rate Comparison by Grade (2016-2032)
- Figure 142: Middle East & Africa Polylactic Acid Market Y-o-Y Growth Rate Comparison by Application (2016-2032)
- Figure 143: Middle East & Africa Polylactic Acid Market Y-o-Y Growth Rate Comparison by End-Use (2016-2032)
- Figure 144: Middle East & Africa Polylactic Acid Market Share Comparison by Country (2016-2032)
- Figure 145: Middle East & Africa Polylactic Acid Market Share Comparison by Grade (2016-2032)
- Figure 146: Middle East & Africa Polylactic Acid Market Share Comparison by Application (2016-2032)
- Figure 147: Middle East & Africa Polylactic Acid Market Share Comparison by End-Use (2016-2032)
- List of Tables
- Table 1: Global Polylactic Acid Market Comparison by Grade (2016-2032)
- Table 2: Global Polylactic Acid Market Comparison by Application (2016-2032)
- Table 3: Global Polylactic Acid Market Comparison by End-Use (2016-2032)
- Table 4: Global Polylactic Acid Market Revenue (US$ Mn) Comparison by Region (2016-2032)
- Table 5: Global Polylactic Acid Market Revenue (US$ Mn) (2016-2032)
- Table 6: Global Polylactic Acid Market Revenue (US$ Mn) Comparison by Region (2016-2032)
- Table 7: Global Polylactic Acid Market Revenue (US$ Mn) Comparison by Grade (2016-2032)
- Table 8: Global Polylactic Acid Market Revenue (US$ Mn) Comparison by Application (2016-2032)
- Table 9: Global Polylactic Acid Market Revenue (US$ Mn) Comparison by End-Use (2016-2032)
- Table 10: Global Polylactic Acid Market Y-o-Y Growth Rate Comparison by Region (2016-2032)
- Table 11: Global Polylactic Acid Market Y-o-Y Growth Rate Comparison by Grade (2016-2032)
- Table 12: Global Polylactic Acid Market Y-o-Y Growth Rate Comparison by Application (2016-2032)
- Table 13: Global Polylactic Acid Market Y-o-Y Growth Rate Comparison by End-Use (2016-2032)
- Table 14: Global Polylactic Acid Market Share Comparison by Region (2016-2032)
- Table 15: Global Polylactic Acid Market Share Comparison by Grade (2016-2032)
- Table 16: Global Polylactic Acid Market Share Comparison by Application (2016-2032)
- Table 17: Global Polylactic Acid Market Share Comparison by End-Use (2016-2032)
- Table 18: North America Polylactic Acid Market Comparison by Application (2016-2032)
- Table 19: North America Polylactic Acid Market Comparison by End-Use (2016-2032)
- Table 20: North America Polylactic Acid Market Revenue (US$ Mn) Comparison by Country (2016-2032)
- Table 21: North America Polylactic Acid Market Revenue (US$ Mn) (2016-2032)
- Table 22: North America Polylactic Acid Market Revenue (US$ Mn) Comparison by Country (2016-2032)
- Table 23: North America Polylactic Acid Market Revenue (US$ Mn) Comparison by Grade (2016-2032)
- Table 24: North America Polylactic Acid Market Revenue (US$ Mn) Comparison by Application (2016-2032)
- Table 25: North America Polylactic Acid Market Revenue (US$ Mn) Comparison by End-Use (2016-2032)
- Table 26: North America Polylactic Acid Market Y-o-Y Growth Rate Comparison by Country (2016-2032)
- Table 27: North America Polylactic Acid Market Y-o-Y Growth Rate Comparison by Grade (2016-2032)
- Table 28: North America Polylactic Acid Market Y-o-Y Growth Rate Comparison by Application (2016-2032)
- Table 29: North America Polylactic Acid Market Y-o-Y Growth Rate Comparison by End-Use (2016-2032)
- Table 30: North America Polylactic Acid Market Share Comparison by Country (2016-2032)
- Table 31: North America Polylactic Acid Market Share Comparison by Grade (2016-2032)
- Table 32: North America Polylactic Acid Market Share Comparison by Application (2016-2032)
- Table 33: North America Polylactic Acid Market Share Comparison by End-Use (2016-2032)
- Table 34: Western Europe Polylactic Acid Market Comparison by Grade (2016-2032)
- Table 35: Western Europe Polylactic Acid Market Comparison by Application (2016-2032)
- Table 36: Western Europe Polylactic Acid Market Comparison by End-Use (2016-2032)
- Table 37: Western Europe Polylactic Acid Market Revenue (US$ Mn) Comparison by Country (2016-2032)
- Table 38: Western Europe Polylactic Acid Market Revenue (US$ Mn) (2016-2032)
- Table 39: Western Europe Polylactic Acid Market Revenue (US$ Mn) Comparison by Country (2016-2032)
- Table 40: Western Europe Polylactic Acid Market Revenue (US$ Mn) Comparison by Grade (2016-2032)
- Table 41: Western Europe Polylactic Acid Market Revenue (US$ Mn) Comparison by Application (2016-2032)
- Table 42: Western Europe Polylactic Acid Market Revenue (US$ Mn) Comparison by End-Use (2016-2032)
- Table 43: Western Europe Polylactic Acid Market Y-o-Y Growth Rate Comparison by Country (2016-2032)
- Table 44: Western Europe Polylactic Acid Market Y-o-Y Growth Rate Comparison by Grade (2016-2032)
- Table 45: Western Europe Polylactic Acid Market Y-o-Y Growth Rate Comparison by Application (2016-2032)
- Table 46: Western Europe Polylactic Acid Market Y-o-Y Growth Rate Comparison by End-Use (2016-2032)
- Table 47: Western Europe Polylactic Acid Market Share Comparison by Country (2016-2032)
- Table 48: Western Europe Polylactic Acid Market Share Comparison by Grade (2016-2032)
- Table 49: Western Europe Polylactic Acid Market Share Comparison by Application (2016-2032)
- Table 50: Western Europe Polylactic Acid Market Share Comparison by End-Use (2016-2032)
- Table 51: Eastern Europe Polylactic Acid Market Comparison by Grade (2016-2032)
- Table 52: Eastern Europe Polylactic Acid Market Comparison by Application (2016-2032)
- Table 53: Eastern Europe Polylactic Acid Market Comparison by End-Use (2016-2032)
- Table 54: Eastern Europe Polylactic Acid Market Revenue (US$ Mn) Comparison by Country (2016-2032)
- Table 55: Eastern Europe Polylactic Acid Market Revenue (US$ Mn) (2016-2032)
- Table 56: Eastern Europe Polylactic Acid Market Revenue (US$ Mn) Comparison by Country (2016-2032)
- Table 57: Eastern Europe Polylactic Acid Market Revenue (US$ Mn) Comparison by Grade (2016-2032)
- Table 58: Eastern Europe Polylactic Acid Market Revenue (US$ Mn) Comparison by Application (2016-2032)
- Table 59: Eastern Europe Polylactic Acid Market Revenue (US$ Mn) Comparison by End-Use (2016-2032)
- Table 60: Eastern Europe Polylactic Acid Market Y-o-Y Growth Rate Comparison by Country (2016-2032)
- Table 61: Eastern Europe Polylactic Acid Market Y-o-Y Growth Rate Comparison by Grade (2016-2032)
- Table 62: Eastern Europe Polylactic Acid Market Y-o-Y Growth Rate Comparison by Application (2016-2032)
- Table 63: Eastern Europe Polylactic Acid Market Y-o-Y Growth Rate Comparison by End-Use (2016-2032)
- Table 64: Eastern Europe Polylactic Acid Market Share Comparison by Country (2016-2032)
- Table 65: Eastern Europe Polylactic Acid Market Share Comparison by Grade (2016-2032)
- Table 66: Eastern Europe Polylactic Acid Market Share Comparison by Application (2016-2032)
- Table 67: Eastern Europe Polylactic Acid Market Share Comparison by End-Use (2016-2032)
- Table 68: APAC Polylactic Acid Market Comparison by Grade (2016-2032)
- Table 69: APAC Polylactic Acid Market Comparison by Application (2016-2032)
- Table 70: APAC Polylactic Acid Market Comparison by End-Use (2016-2032)
- Table 71: APAC Polylactic Acid Market Revenue (US$ Mn) Comparison by Country (2016-2032)
- Table 72: APAC Polylactic Acid Market Revenue (US$ Mn) (2016-2032)
- Table 73: APAC Polylactic Acid Market Revenue (US$ Mn) Comparison by Country (2016-2032)
- Table 74: APAC Polylactic Acid Market Revenue (US$ Mn) Comparison by Grade (2016-2032)
- Table 75: APAC Polylactic Acid Market Revenue (US$ Mn) Comparison by Application (2016-2032)
- Table 76: APAC Polylactic Acid Market Revenue (US$ Mn) Comparison by End-Use (2016-2032)
- Table 77: APAC Polylactic Acid Market Y-o-Y Growth Rate Comparison by Country (2016-2032)
- Table 78: APAC Polylactic Acid Market Y-o-Y Growth Rate Comparison by Grade (2016-2032)
- Table 79: APAC Polylactic Acid Market Y-o-Y Growth Rate Comparison by Application (2016-2032)
- Table 80: APAC Polylactic Acid Market Y-o-Y Growth Rate Comparison by End-Use (2016-2032)
- Table 81: APAC Polylactic Acid Market Share Comparison by Country (2016-2032)
- Table 82: APAC Polylactic Acid Market Share Comparison by Grade (2016-2032)
- Table 83: APAC Polylactic Acid Market Share Comparison by Application (2016-2032)
- Table 84: APAC Polylactic Acid Market Share Comparison by End-Use (2016-2032)
- Table 85: Latin America Polylactic Acid Market Comparison by Grade (2016-2032)
- Table 86: Latin America Polylactic Acid Market Comparison by Application (2016-2032)
- Table 87: Latin America Polylactic Acid Market Comparison by End-Use (2016-2032)
- Table 88: Latin America Polylactic Acid Market Revenue (US$ Mn) Comparison by Country (2016-2032)
- Table 89: Latin America Polylactic Acid Market Revenue (US$ Mn) (2016-2032)
- Table 90: Latin America Polylactic Acid Market Revenue (US$ Mn) Comparison by Country (2016-2032)
- Table 91: Latin America Polylactic Acid Market Revenue (US$ Mn) Comparison by Grade (2016-2032)
- Table 92: Latin America Polylactic Acid Market Revenue (US$ Mn) Comparison by Application (2016-2032)
- Table 93: Latin America Polylactic Acid Market Revenue (US$ Mn) Comparison by End-Use (2016-2032)
- Table 94: Latin America Polylactic Acid Market Y-o-Y Growth Rate Comparison by Country (2016-2032)
- Table 95: Latin America Polylactic Acid Market Y-o-Y Growth Rate Comparison by Grade (2016-2032)
- Table 96: Latin America Polylactic Acid Market Y-o-Y Growth Rate Comparison by Application (2016-2032)
- Table 97: Latin America Polylactic Acid Market Y-o-Y Growth Rate Comparison by End-Use (2016-2032)
- Table 98: Latin America Polylactic Acid Market Share Comparison by Country (2016-2032)
- Table 99: Latin America Polylactic Acid Market Share Comparison by Grade (2016-2032)
- Table 100: Latin America Polylactic Acid Market Share Comparison by Application (2016-2032)
- Table 101: Latin America Polylactic Acid Market Share Comparison by End-Use (2016-2032)
- Table 102: Middle East & Africa Polylactic Acid Market Comparison by Grade (2016-2032)
- Table 103: Middle East & Africa Polylactic Acid Market Comparison by Application (2016-2032)
- Table 104: Middle East & Africa Polylactic Acid Market Comparison by End-Use (2016-2032)
- Table 105: Middle East & Africa Polylactic Acid Market Revenue (US$ Mn) Comparison by Country (2016-2032)
- Table 106: Middle East & Africa Polylactic Acid Market Revenue (US$ Mn) (2016-2032)
- Table 107: Middle East & Africa Polylactic Acid Market Revenue (US$ Mn) Comparison by Country (2016-2032)
- Table 108: Middle East & Africa Polylactic Acid Market Revenue (US$ Mn) Comparison by Grade (2016-2032)
- Table 109: Middle East & Africa Polylactic Acid Market Revenue (US$ Mn) Comparison by Application (2016-2032)
- Table 110: Middle East & Africa Polylactic Acid Market Revenue (US$ Mn) Comparison by End-Use (2016-2032)
- Table 111: Middle East & Africa Polylactic Acid Market Y-o-Y Growth Rate Comparison by Country (2016-2032)
- Table 112: Middle East & Africa Polylactic Acid Market Y-o-Y Growth Rate Comparison by Grade (2016-2032)
- Table 113: Middle East & Africa Polylactic Acid Market Y-o-Y Growth Rate Comparison by Application (2016-2032)
- Table 114: Middle East & Africa Polylactic Acid Market Y-o-Y Growth Rate Comparison by End-Use (2016-2032)
- Table 115: Middle East & Africa Polylactic Acid Market Share Comparison by Country (2016-2032)
- Table 116: Middle East & Africa Polylactic Acid Market Share Comparison by Grade (2016-2032)
- Table 117: Middle East & Africa Polylactic Acid Market Share Comparison by Application (2016-2032)
- Table 118: Middle East & Africa Polylactic Acid Market Share Comparison by End-Use (2016-2032)
- 1. Executive Summary
-
- TotalEnergies Corbion bv
- NatureWorks LLC
- Jiangsu Supla Bioplastics Co., Ltd.
- Futerro
- COFCO
- Jiangxi Keyuan Biopharm Co.,Ltd
- Shanghai Tong-jie-liang Biomaterials Co., Ltd.
- Zhejiang Hisun Biomaterials Co., Ltd.
- Corbion Purac BV
- Mitsui Chemicals, Inc.
- Hitachi, Ltd.
- BASF SE
- Braskem
- Uhde Inventa-Fischer
- Toray
- Synbra Technology
- Sulzer
- Teijin
- Toyobo
- Hisun Biomaterials
Our Clients


View Our Licence Options
