
Polyhydroxybutyrate Market Report By Product Type (Polyhydroxybutyrate (PHB), Polyhydroxybutyrate-co-valerate (PHBV), Polyhydroxybutyrate-co-hydroxyvalerate (PHBHV), Others), By Production Process (Fermentation-based, Chemical Synthesis), By Application (Packaging, Biomedical & Pharmaceutical, Agriculture, Textiles, Consumer Goods, Others), By Region and Companies - Industry Segment Outlook, Market Assessment, Competition Scenario, Trends and Forecast 2024-2033
-
21607
-
April 2024
-
280
-


-
This report was compiled by Kalyani Khudsange Kalyani Khudsange is a Research Analyst at Prudour Pvt. Ltd. with 2.5 years of experience in market research and a strong technical background in Chemical Engineering and manufacturing. Correspondence Sr. Research Analyst Linkedin | Detailed Market research Methodology Our methodology involves a mix of primary research, including interviews with leading mental health experts, and secondary research from reputable medical journals and databases. View Detailed Methodology Page
-
Quick Navigation
Report Overview
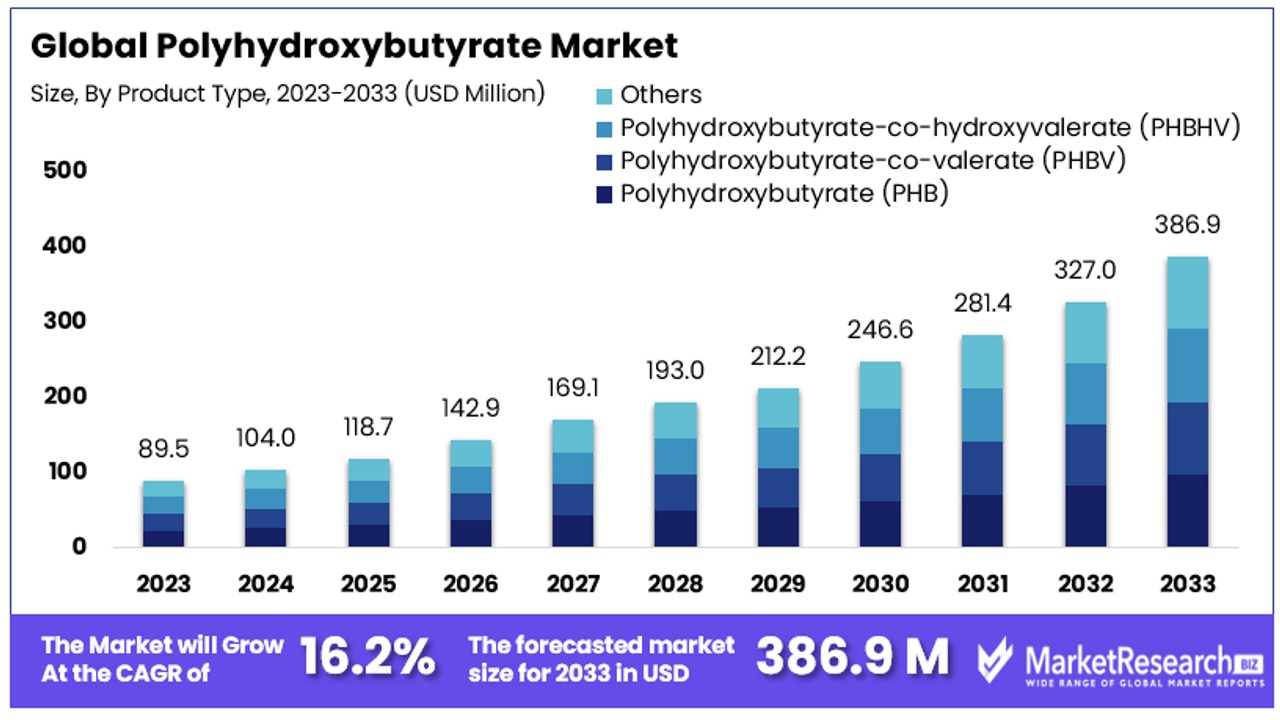
The Global Polyhydroxybutyrate Market size is expected to be worth around USD 386.9 Million by 2033, from USD 89.5 Million in 2023, growing at a CAGR of 16.20% during the forecast period from 2024 to 2033.
The polyhydroxybutyrate (PHB) market refers to the industry focused on the production and distribution of PHB, a type of biodegradable polymer derived from microbial fermentation processes. As a bioplastic, PHB is recognized for its environmental benefits, including reduced dependency on fossil fuels and lower carbon footprint compared to conventional plastics.
The market caters to industries seeking sustainable material solutions, such as packaging, agriculture, biomedical, and automotive sectors. Growth in this market is driven by increasing environmental regulations and consumer demand for eco-friendly products.
The polyhydroxybutyrate (PHB) market is positioned as a pivotal solution amidst the escalating global crisis of plastic pollution. Annually, the world generates approximately 400 million tonnes of plastic waste, with the United States leading as the largest contributor at 42 million metric tons, notably surpassing China and the entirety of the European Union.
The environmental impact is profound, with over 8 million tonnes of plastic entering the oceans each year. Without strategic intervention, ocean plastic pollution is projected to surge to 29 million metric tons per annum within the next two decades. By 2050, emissions from plastic production and incineration could reach 2.8 gigatons of CO2 annually.
In this context, PHB emerges as a sustainable alternative, particularly in the packaging sector, which accounts for 44% of global plastic use. In the UK alone, plastic packaging contributes to nearly 70% of the total plastic waste, underscoring the urgent need for sustainable substitutes. PHB, derived from microbial fermentation, offers a biodegradable solution that aligns with increasing regulatory pressures and shifting consumer preferences towards environmentally responsible products.
Market dynamics for PHB are influenced by these environmental concerns, regulatory frameworks promoting sustainable materials, and advancements in biotechnology that enhance PHB's commercial viability. As industries pivot towards sustainability, the demand for bioplastics like PHB is expected to grow, driven by sectors such as packaging, agriculture, and biomedical. The growth prospects for the PHB market are robust, promising significant contributions to reducing plastic pollution and its associated carbon footprint, positioning PHB at the forefront of sustainable material solutions.
Key Takeaways
- Market Value Projection: The Global Polyhydroxybutyrate (PHB) Market is anticipated to reach USD 386.9 Million by 2033, showcasing a robust CAGR of 16.20% during 2024-2033, up from USD 89.5 Million in 2023.
- Dominant Segments with Percentages:
- Product Types: PHBV leads among PHB variants due to its versatility and superior properties, holding a significant market share.
- Production Processes: Fermentation-based production dominates over chemical synthesis due to its sustainability and lower environmental impact.
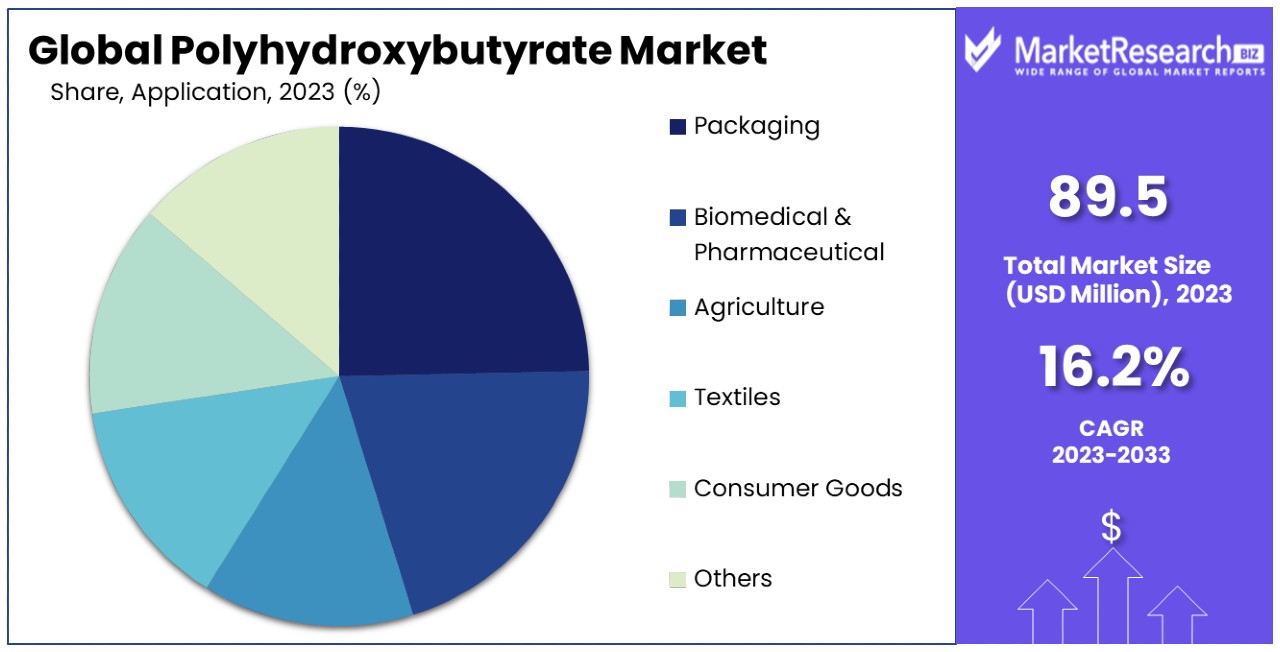
- Applications: Packaging emerges as the dominant segment, driven by consumer demand for sustainable packaging solutions, followed by biomedical, agriculture, textiles, and consumer goods.
- Regional Insights:
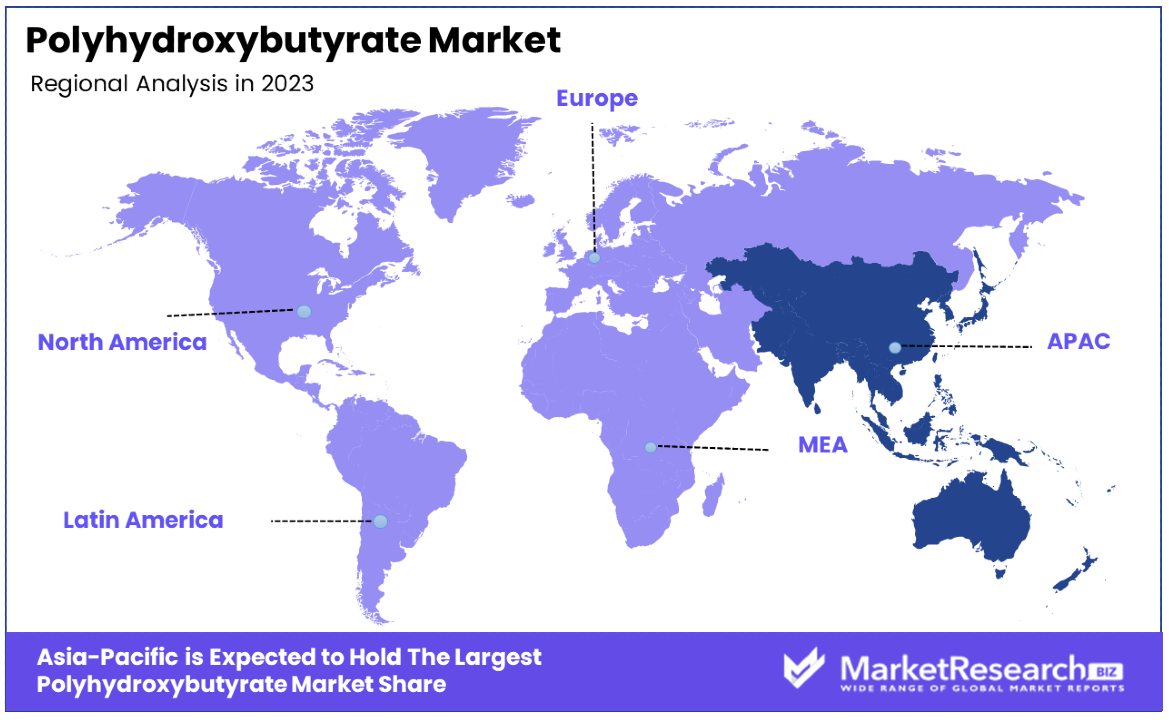
- APAC Dominance: Asia-Pacific (APAC) holds a commanding 40% market share, propelled by rapid industrialization, high economic growth, and supportive government regulations.
- Regional Growth Rates: North America (25%), Europe (20%), Latin America (10%), and Middle East & Africa (5%) demonstrate varying degrees of market penetration and growth rates.
- Key Players and Analyst Viewpoint:
- Market Leaders: Companies like Newlight Technologies, Kaneka Corporation, and PHB Industrial S.A. lead the market with innovative approaches, research capabilities, and large-scale production capacities.
- Strategic Focus: Investments in R&D, partnerships with local manufacturers, and regional expansion into developing markets like Asia-Pacific and Latin America are key strategies adopted by market players.
- Opportunities: Emerging trends in 3D printing, circular economy models, and advancements in biotechnology offer significant growth avenues for PHB market players.
- Overall Growth Outlook: With increasing environmental awareness, regulatory support, and technological innovations, the PHB market is poised for substantial growth, offering sustainable solutions to address the global plastic pollution crisis.
Driving Factors
Growing Environmental Concerns and Regulations Drive Market Growth
The escalating environmental concerns and stringent regulations form a critical driver for the polyhydroxybutyrate (PHB) market. As the global community becomes increasingly aware of the environmental impacts of plastic pollution, governments and regulatory bodies are intensifying efforts to curb the use of non-biodegradable plastics.
The European Union, for example, has implemented the Single-Use Plastics Directive, which restricts the use of specific plastic items and advocates for alternatives like PHB. This regulatory landscape not only fosters a conducive environment for the adoption of biodegradable materials but also directly propels the demand for PHB. Such legal frameworks are pivotal in steering both consumer preferences and manufacturing practices towards sustainable alternatives, significantly boosting the market for biodegradable polymers like PHB.
Technological Advancements in Production Processes Enhance Market Viability
Technological innovations in the production of PHB have markedly improved its commercial feasibility. Advances in microbial fermentation and genetic engineering have been instrumental in increasing the yield and reducing the production costs of PHB.
Companies such as Newlight Technologies have pioneered methods to produce PHB from greenhouse gases, enhancing the sustainability profile of PHB while also making it economically competitive with conventional plastics. These technological strides not only bolster the production efficiency but also enhance the market penetration of PHB by making it a more accessible option for a broader range of applications. As production techniques continue to evolve, they are likely to further drive down costs and elevate PHB’s position in the market against traditional plastic materials.
Increasing Demand in Packaging Industry Propels PHB Market
The packaging sector is a significant growth area for PHB, driven by the rising demand for sustainable packaging solutions. With consumers increasingly favoring eco-friendly products, the attributes of PHB such as biodegradability, barrier resistance, and compostability make it highly suitable for packaging applications.
Companies like Danimer Scientific are capitalizing on this trend by developing PHB-based packaging that meets the environmental and functional requirements of industries ranging from food to cosmetics. This consumer-driven shift towards sustainable packaging is intensifying the demand for PHB, positioning it as a preferred material in the packaging industry. The alignment of PHB’s properties with market demands not only captures a substantial market share but also underscores the broader industry shift towards sustainable material solutions.
Restraining Factors
Performance and Functional Limitations Restrain Market Growth
PHB, while environmentally friendly, faces significant hurdles due to its performance limitations when compared to traditional plastics. Its brittleness and lower heat resistance can reduce its applicability in high-demand sectors such as automotive and electronics, where durability and temperature stability are essential. Furthermore, the inherent biodegradability of PHB, though beneficial for reducing environmental impact, may raise concerns about its long-term stability and durability.
This factor is crucial in applications where products are expected to have extended lifespans, such as in durable goods. As a result, PHB's mechanical and functional shortcomings could limit its broader adoption in industries that require robust performance characteristics, thus restraining its market growth potential.
Limited Infrastructure and Supply Chain Restrains Market Growth
The growth of the PHB market is significantly constrained by the underdeveloped infrastructure and the nascent stage of its supply chain. Unlike well-established plastics industries, PHB does not yet have a strong network of production facilities, raw material suppliers, or distribution channels. This lack of infrastructure leads to increased costs and logistical challenges, limiting the ability to scale production effectively.
Additionally, the limited geographic spread of production facilities means higher transportation costs and restricted access to key markets. These supply chain challenges are critical barriers that prevent PHB from becoming more widely available and competitively priced, thus hindering its market expansion and acceptance.
Product Type Analysis
PHBV Emerges as Dominant Sub-segment in PHB Market, Driving Versatility and Adoption
In the polyhydroxybutyrate (PHB) market, the dominant sub-segment is Polyhydroxybutyrate-co-valerate (PHBV) due to its improved properties over standard PHB, such as enhanced flexibility and toughness, which make it more suitable for a broader range of applications. PHBV's versatility has led to its increased adoption in industries focused on packaging, agriculture, and biomedical applications. This sub-segment benefits from ongoing research and development aimed at improving its physical properties and reducing production costs, thereby enhancing its market attractiveness.
On the other hand, standard PHB, while being the foundational material, often exhibits brittleness and lower thermal stability, which can limit its use in more demanding applications. Polyhydroxybutyrate-co-hydroxyvalerate (PHBHV) and other variants, such as those modified with different copolymers, play critical roles in niche applications where specific material properties such as biocompatibility and biodegradability are required. These variations cater to specialized markets such as biomedical devices and controlled-release pharmaceuticals. The development of these segments is crucial for the overall growth of the PHB market, as they address the needs of high-value, low-volume markets with specific performance requirements.
Production Process Analysis
Fermentation-Based Production Process Leads PHB Market, Fostering Sustainability and Efficiency
The fermentation-based production process is the dominant sub-segment in the PHB market. This method leverages microbial synthesis to convert sugars into biopolyesters, offering a more sustainable and environmentally friendly alternative to conventional plastic production methods. The advantages of fermentation, such as lower energy requirements and the use of renewable resources, align well with the growing demand for sustainable manufacturing practices. This process has seen significant technological advancements that have improved efficiency and reduced costs, further driving its dominance in the market.
Chemical synthesis, while important, typically plays a secondary role due to higher costs and greater environmental impacts. However, it remains relevant in producing specific types of polyhydroxyalkanoates (PHAs) where fermentation might not yield the desired properties. Innovations in catalyst and process development could potentially increase the importance of this segment by making it more competitive with fermentation-based methods. Both production processes are vital for the expansion of the PHB market, with each serving different needs based on economic and environmental considerations.
Application Analysis
Packaging Takes Center Stage in PHB Applications, Fueling Demand for Sustainable Solutions
In the application segment, packaging is the most dominant sub-segment of the PHB market. The demand for sustainable packaging solutions is driven by increasing consumer awareness and regulatory pressures regarding environmental impacts, making PHB an attractive option. PHB-based materials are favored in food packaging due to their biodegradability and food safety compatibility. As the packaging industry seeks alternatives to conventional plastics, PHB stands out for its ability to degrade naturally without leaving harmful residues, thereby supporting circular economy initiatives.
Other significant applications of PHB include biomedical and pharmaceutical, agriculture, textiles, and consumer goods. In the biomedical sector, PHB's biocompatibility makes it suitable for implants and other medical devices. In agriculture, PHB's use in mulch films and controlled-release agrochemicals helps improve crop productivity while reducing environmental impact. Textiles and consumer goods are emerging segments where PHB's application in biodegradable fabrics and products adds value to the sustainability profiles of these industries. Each of these segments contributes to the overall growth and diversification of the PHB market, catering to specific industry needs that underscore the material's versatility and eco-friendly attributes.
Key Market Segments
By Product Type
- Polyhydroxybutyrate (PHB)
- Polyhydroxybutyrate-co-valerate (PHBV)
- Polyhydroxybutyrate-co-hydroxyvalerate (PHBHV)
- Others
By Production Process
- Fermentation-based
- Chemical Synthesis
By Application
- Packaging
- Biomedical & Pharmaceutical
- Agriculture
- Textiles
- Consumer Goods
- Others
Growth Opportunities
Emerging Opportunities in 3D Printing Offer Growth Potential
The increasing adoption of 3D printing technology across various industries provides significant growth opportunities for polyhydroxybutyrate (PHB). As 3D printing becomes more prevalent, the demand for materials that are both functional and sustainable is rising. PHB, known for its biodegradability and compatibility with 3D printing processes, is an excellent candidate for producing eco-friendly prototypes and products. This alignment with the sustainability goals of many companies and consumers enhances PHB's appeal in the additive manufacturing market.
Companies like Algix 3D have already begun capitalizing on this trend by offering PHB-based filaments, which cater to a growing segment of environmentally conscious users. The trend towards sustainable manufacturing practices in 3D printing is likely to continue, presenting a promising avenue for the expansion of PHB usage in this innovative field.
Market Penetration in Developing Regions Offers Growth Opportunity
Developing regions represent a fertile ground for the expansion of the PHB market due to increasing environmental consciousness and supportive regulatory frameworks for sustainable materials. As these economies grow and urbanize, the demand for eco-friendly alternatives to traditional plastics rises. PHB, with its biodegradable properties and renewable sourcing, is ideally positioned to meet these demands.
By establishing partnerships with local manufacturers and aligning with government initiatives that promote green technologies, PHB suppliers can tap into the expanding market for sustainable materials in these regions. Companies like Biome Bioplastics are leveraging this opportunity by extending their operations into the Asia-Pacific region, which is rapidly becoming a hub for the bioplastics industry. This strategic move into developing markets is a key factor driving the growth potential for PHB, making it a strategic focus for companies looking to expand their global footprint in the bioplastics sector.
Trending Factors
Shift Towards Circular Economy Models Are Trending Factors
The shift towards circular economy models is a significant trend influencing the polyhydroxybutyrate (PHB) market. As global emphasis on sustainability intensifies, there is an increased interest in materials that can be fully reintegrated into the environment after use. PHB, with its biodegradable properties, aligns perfectly with the circular economy's goal of minimizing waste and promoting resource efficiency.
This alignment is driving its adoption across various sectors, particularly in packaging, where companies like Coca-Cola and Nestlé are exploring PHB-based solutions to meet sustainability targets and reduce environmental impact. The movement towards circular economic practices is not just a trend but a fundamental shift in how businesses and consumers view product lifecycle management, positioning PHB as a key material in this transformative market shift.
Innovations in Biotechnology and Materials Science Are Trending Factors
Innovations in biotechnology and materials science are propelling the PHB market forward by enhancing its performance and broadening its applicability. Advances in microbial engineering and enzymatic synthesis are improving PHB production efficiencies and reducing costs, making it more competitive with traditional plastics.
Simultaneously, material scientists are developing methods to enhance PHB's physical properties through copolymerization and chemical modifications, expanding its potential uses into high-demand sectors like automotive and construction. For example, research at MIT involving PHB-based composites with improved mechanical properties highlights the potential for these advanced materials in structural applications. These innovations are trending factors in the PHB market because they address critical performance and cost barriers, thereby facilitating new growth opportunities and broader market acceptance.
Regional Analysis
APAC Dominates with 40% Market Share
The Asia-Pacific (APAC) region holds a dominant 40% share of the global polyhydroxybutyrate (PHB) market. This significant market share is driven by rapid industrialization, high economic growth, and increasing environmental regulations across major economies like China, India, and Japan. Additionally, the presence of a large manufacturing base, particularly in sectors such as packaging, agriculture, and consumer goods, contributes to the high demand for biodegradable plastics like PHB. Government initiatives to reduce plastic waste and encourage sustainable materials further amplify this demand, positioning APAC as a critical player in the PHB market.
APAC’s dominance in the PHB market is bolstered by its diverse industrial landscape and the integration of sustainable practices across various sectors. The region benefits from robust local manufacturing capabilities and a growing consumer preference for eco-friendly products, which drive the adoption of PHB. Moreover, the competitive cost of labor and supportive government policies regarding green manufacturing have made APAC an attractive region for both local and foreign investors in the bioplastics sector.
Regional Market Share and Growth Rates
- North America: North America holds approximately 25% of the PHB market. The region’s commitment to sustainability and advanced biotechnological research infrastructure are key growth drivers. The U.S. and Canada are pioneering in bioplastic regulations and have substantial investments in eco-friendly product innovations.
- Europe: Europe accounts for around 20% of the PHB market. The region's stringent environmental laws, such as limitations on single-use plastics, significantly contribute to the demand for sustainable alternatives like PHB. European Union policies strongly support the circular economy, bolstering the growth of bioplastics.
- Middle East & Africa: This region captures a smaller share of about 5% of the market, largely due to nascent market development and limited industrial applications. However, increasing awareness about plastic pollution and gradual shifts toward sustainability are expected to enhance market growth.
- Latin America: Holding 10% of the global PHB market, Latin America shows potential for growth with rising environmental awareness and government incentives to reduce plastic waste. Countries like Brazil and Argentina are slowly advancing in bioplastic production capabilities.
Key Regions and Countries
- North America
- The US
- Canada
- Mexico
- Western Europe
- Germany
- France
- The UK
- Spain
- Italy
- Portugal
- Ireland
- Austria
- Switzerland
- Benelux
- Nordic
- Rest of Western Europe
- Eastern Europe
- Russia
- Poland
- The Czech Republic
- Greece
- Rest of Eastern Europe
- APAC
- China
- Japan
- South Korea
- India
- Australia & New Zealand
- Indonesia
- Malaysia
- Philippines
- Singapore
- Thailand
- Vietnam
- Rest of APAC
- Latin America
- Brazil
- Colombia
- Chile
- Argentina
- Costa Rica
- Rest of Latin America
- Middle East & Africa
- Algeria
- Egypt
- Israel
- Kuwait
- Nigeria
- Saudi Arabia
- South Africa
- Turkey
- United Arab Emirates
- Rest of MEA
Key Players Analysis
The polyhydroxybutyrate (PHB) market features a dynamic range of key players, each contributing uniquely to the industry's growth and development. Newlight Technologies stands out with its innovative approach to producing PHB from greenhouse gases, offering a sustainable solution that aligns with global carbon reduction goals. Kaneka Corporation, with its extensive research capabilities, enhances the performance characteristics of PHB, strengthening its application in demanding sectors.
PHB Industrial S.A. focuses on large-scale production, bolstering the supply side of the market, while Triveni Interchem Pvt Ltd provides crucial raw materials, facilitating the overall manufacturing process of PHB. TEPHA INC is instrumental in exploring medical applications of PHB, driving growth in the biomedical sector.
Tianjin GreenBio Materials Co. and RWDC Industries expand PHB’s reach in Asian markets through strategic localization and innovative bioprocessing technologies. P&G Chemicals and Shenzhen Ecomann Technology enhance the PHB value chain with specialized chemical expertise and biodegradable product offerings. Lastly, Biome Technologies taps into the European market, leveraging regional growth opportunities with eco-friendly solutions. Collectively, these companies not only enhance market competition but also drive widespread adoption of PHB across various industries.
Market Key Players
- Newlight Technologies
- Kaneka Corporation
- PHB Industrial S.A.
- Triveni Interchem Pvt Ltd
- TEPHA INC
- Tianjin GreenBio Materials Co.,
- RWDC Industries
- P&G Chemicals
- Shenzhen Ecomann Technology
- Biome Technologies
Recent Developments
- On 2021, a research article published in Scientific Reports discusses the enhanced production of polyhydroxybutyrate (PHB) by newly isolated rare actinomycetes Rhodococcus sp. strain BSRT1-1 using response surface methodology.
- On 2022, a new facility in Ohio is utilizing methane as a feedstock for the production of polyhydroxybutyrate (PHB). This innovative approach involves converting methane, a potent greenhouse gas, into a valuable resource for bioplastic production.
Report Scope
Report Features Description Market Value (2023) USD 89.5 Million Forecast Revenue (2033) USD 386.9 Million CAGR (2024-2033) 16.20% Base Year for Estimation 2023 Historic Period 2018-2023 Forecast Period 2024-2033 Report Coverage Revenue Forecast, Market Dynamics, Competitive Landscape, Recent Developments Segments Covered By Product Type (Polyhydroxybutyrate (PHB), Polyhydroxybutyrate-co-valerate (PHBV), Polyhydroxybutyrate-co-hydroxyvalerate (PHBHV), Others), By Production Process (Fermentation-based, Chemical Synthesis), By Application (Packaging, Biomedical & Pharmaceutical, Agriculture, Textiles, Consumer Goods, Others) Regional Analysis North America - The US, Canada, & Mexico; Western Europe - Germany, France, The UK, Spain, Italy, Portugal, Ireland, Austria, Switzerland, Benelux, Nordic, & Rest of Western Europe; Eastern Europe - Russia, Poland, The Czech Republic, Greece, & Rest of Eastern Europe; APAC - China, Japan, South Korea, India, Australia & New Zealand, Indonesia, Malaysia, Philippines, Singapore, Thailand, Vietnam, & Rest of APAC; Latin America - Brazil, Colombia, Chile, Argentina, Costa Rica, & Rest of Latin America; Middle East & Africa - Algeria, Egypt, Israel, Kuwait, Nigeria, Saudi Arabia, South Africa, Turkey, United Arab Emirates, & Rest of MEA Competitive Landscape Newlight Technologies, Kaneka Corporation, PHB Industrial S.A., Triveni Interchem Pvt Ltd, TEPHA INC, Tianjin GreenBio Materials Co.,, RWDC Industries, P&G Chemicals, Shenzhen Ecomann Technology, Biome Technologies Customization Scope Customization for segments, region/country-level will be provided. Moreover, additional customization can be done based on the requirements. Purchase Options We have three licenses to opt for: Single User License, Multi-User License (Up to 5 Users), Corporate Use License (Unlimited User and Printable PDF) -
- 1. Executive Summary
- 1.1. Definition
- 1.2. Taxonomy
- 1.3. Research Scope
- 1.4. Key Analysis
- 1.5. Key Findings by Major Segments
- 1.6. Top strategies by Major Players
- 2. Global Polyhydroxybutyrate Market Overview
- 2.1. Polyhydroxybutyrate Market Dynamics
- 2.1.1. Drivers
- 2.1.2. Opportunities
- 2.1.3. Restraints
- 2.1.4. Challenges
- 2.2. Macro-economic Factors
- 2.3. Regulatory Framework
- 2.4. Market Investment Feasibility Index
- 2.5. PEST Analysis
- 2.6. PORTER’S Five Force Analysis
- 2.7. Drivers & Restraints Impact Analysis
- 2.8. Industry Chain Analysis
- 2.9. Cost Structure Analysis
- 2.10. Marketing Strategy
- 2.11. Russia-Ukraine War Impact Analysis
- 2.12. Opportunity Map Analysis
- 2.13. Market Competition Scenario Analysis
- 2.14. Product Life Cycle Analysis
- 2.15. Opportunity Orbits
- 2.16. Manufacturer Intensity Map
- 2.17. Major Companies sales by Value & Volume
- 2.1. Polyhydroxybutyrate Market Dynamics
- 3. Global Polyhydroxybutyrate Market Analysis, Opportunity and Forecast, 2016-2032
- 3.1. Global Polyhydroxybutyrate Market Analysis, 2016-2021
- 3.2. Global Polyhydroxybutyrate Market Opportunity and Forecast, 2023-2032
- 3.3. Global Polyhydroxybutyrate Market Analysis, Opportunity and Forecast, By Product Type, 2016-2032
- 3.3.1. Global Polyhydroxybutyrate Market Analysis by Product Type: Introduction
- 3.3.2. Market Size Absolute $ Opportunity Analysis and Forecast, By Product Type, 2016-2032
- 3.3.3. Polyhydroxybutyrate (PHB)
- 3.3.4. Polyhydroxybutyrate-co-valerate (PHBV)
- 3.3.5. Polyhydroxybutyrate-co-hydroxyvalerate (PHBHV)
- 3.3.6. Others
- 3.4. Global Polyhydroxybutyrate Market Analysis, Opportunity and Forecast, By Production Process, 2016-2032
- 3.4.1. Global Polyhydroxybutyrate Market Analysis by Production Process: Introduction
- 3.4.2. Market Size Absolute $ Opportunity Analysis and Forecast, By Production Process, 2016-2032
- 3.4.3. Fermentation-based
- 3.4.4. Chemical Synthesis
- 3.5. Global Polyhydroxybutyrate Market Analysis, Opportunity and Forecast, By Application, 2016-2032
- 3.5.1. Global Polyhydroxybutyrate Market Analysis by Application: Introduction
- 3.5.2. Market Size Absolute $ Opportunity Analysis and Forecast, By Application, 2016-2032
- 3.5.3. Packaging
- 3.5.4. Biomedical & Pharmaceutical
- 3.5.5. Agriculture
- 3.5.6. Textiles
- 3.5.7. Consumer Goods
- 3.5.8. Others
- 4. North America Polyhydroxybutyrate Market Analysis, Opportunity and Forecast, 2016-2032
- 4.1. North America Polyhydroxybutyrate Market Analysis, 2016-2021
- 4.2. North America Polyhydroxybutyrate Market Opportunity and Forecast, 2023-2032
- 4.3. North America Polyhydroxybutyrate Market Analysis, Opportunity and Forecast, By Product Type, 2016-2032
- 4.3.1. North America Polyhydroxybutyrate Market Analysis by Product Type: Introduction
- 4.3.2. Market Size Absolute $ Opportunity Analysis and Forecast, By Product Type, 2016-2032
- 4.3.3. Polyhydroxybutyrate (PHB)
- 4.3.4. Polyhydroxybutyrate-co-valerate (PHBV)
- 4.3.5. Polyhydroxybutyrate-co-hydroxyvalerate (PHBHV)
- 4.3.6. Others
- 4.4. North America Polyhydroxybutyrate Market Analysis, Opportunity and Forecast, By Production Process, 2016-2032
- 4.4.1. North America Polyhydroxybutyrate Market Analysis by Production Process: Introduction
- 4.4.2. Market Size Absolute $ Opportunity Analysis and Forecast, By Production Process, 2016-2032
- 4.4.3. Fermentation-based
- 4.4.4. Chemical Synthesis
- 4.5. North America Polyhydroxybutyrate Market Analysis, Opportunity and Forecast, By Application, 2016-2032
- 4.5.1. North America Polyhydroxybutyrate Market Analysis by Application: Introduction
- 4.5.2. Market Size Absolute $ Opportunity Analysis and Forecast, By Application, 2016-2032
- 4.5.3. Packaging
- 4.5.4. Biomedical & Pharmaceutical
- 4.5.5. Agriculture
- 4.5.6. Textiles
- 4.5.7. Consumer Goods
- 4.5.8. Others
- 4.6. North America Polyhydroxybutyrate Market Analysis, Opportunity and Forecast, By Country , 2016-2032
- 4.6.1. North America Polyhydroxybutyrate Market Analysis by Country : Introduction
- 4.6.2. Market Size Absolute $ Opportunity Analysis and Forecast, Country , 2016-2032
- 4.6.2.1. The US
- 4.6.2.2. Canada
- 4.6.2.3. Mexico
- 5. Western Europe Polyhydroxybutyrate Market Analysis, Opportunity and Forecast, 2016-2032
- 5.1. Western Europe Polyhydroxybutyrate Market Analysis, 2016-2021
- 5.2. Western Europe Polyhydroxybutyrate Market Opportunity and Forecast, 2023-2032
- 5.3. Western Europe Polyhydroxybutyrate Market Analysis, Opportunity and Forecast, By Product Type, 2016-2032
- 5.3.1. Western Europe Polyhydroxybutyrate Market Analysis by Product Type: Introduction
- 5.3.2. Market Size Absolute $ Opportunity Analysis and Forecast, By Product Type, 2016-2032
- 5.3.3. Polyhydroxybutyrate (PHB)
- 5.3.4. Polyhydroxybutyrate-co-valerate (PHBV)
- 5.3.5. Polyhydroxybutyrate-co-hydroxyvalerate (PHBHV)
- 5.3.6. Others
- 5.4. Western Europe Polyhydroxybutyrate Market Analysis, Opportunity and Forecast, By Production Process, 2016-2032
- 5.4.1. Western Europe Polyhydroxybutyrate Market Analysis by Production Process: Introduction
- 5.4.2. Market Size Absolute $ Opportunity Analysis and Forecast, By Production Process, 2016-2032
- 5.4.3. Fermentation-based
- 5.4.4. Chemical Synthesis
- 5.5. Western Europe Polyhydroxybutyrate Market Analysis, Opportunity and Forecast, By Application, 2016-2032
- 5.5.1. Western Europe Polyhydroxybutyrate Market Analysis by Application: Introduction
- 5.5.2. Market Size Absolute $ Opportunity Analysis and Forecast, By Application, 2016-2032
- 5.5.3. Packaging
- 5.5.4. Biomedical & Pharmaceutical
- 5.5.5. Agriculture
- 5.5.6. Textiles
- 5.5.7. Consumer Goods
- 5.5.8. Others
- 5.6. Western Europe Polyhydroxybutyrate Market Analysis, Opportunity and Forecast, By Country , 2016-2032
- 5.6.1. Western Europe Polyhydroxybutyrate Market Analysis by Country : Introduction
- 5.6.2. Market Size Absolute $ Opportunity Analysis and Forecast, Country , 2016-2032
- 5.6.2.1. Germany
- 5.6.2.2. France
- 5.6.2.3. The UK
- 5.6.2.4. Spain
- 5.6.2.5. Italy
- 5.6.2.6. Portugal
- 5.6.2.7. Ireland
- 5.6.2.8. Austria
- 5.6.2.9. Switzerland
- 5.6.2.10. Benelux
- 5.6.2.11. Nordic
- 5.6.2.12. Rest of Western Europe
- 6. Eastern Europe Polyhydroxybutyrate Market Analysis, Opportunity and Forecast, 2016-2032
- 6.1. Eastern Europe Polyhydroxybutyrate Market Analysis, 2016-2021
- 6.2. Eastern Europe Polyhydroxybutyrate Market Opportunity and Forecast, 2023-2032
- 6.3. Eastern Europe Polyhydroxybutyrate Market Analysis, Opportunity and Forecast, By Product Type, 2016-2032
- 6.3.1. Eastern Europe Polyhydroxybutyrate Market Analysis by Product Type: Introduction
- 6.3.2. Market Size Absolute $ Opportunity Analysis and Forecast, By Product Type, 2016-2032
- 6.3.3. Polyhydroxybutyrate (PHB)
- 6.3.4. Polyhydroxybutyrate-co-valerate (PHBV)
- 6.3.5. Polyhydroxybutyrate-co-hydroxyvalerate (PHBHV)
- 6.3.6. Others
- 6.4. Eastern Europe Polyhydroxybutyrate Market Analysis, Opportunity and Forecast, By Production Process, 2016-2032
- 6.4.1. Eastern Europe Polyhydroxybutyrate Market Analysis by Production Process: Introduction
- 6.4.2. Market Size Absolute $ Opportunity Analysis and Forecast, By Production Process, 2016-2032
- 6.4.3. Fermentation-based
- 6.4.4. Chemical Synthesis
- 6.5. Eastern Europe Polyhydroxybutyrate Market Analysis, Opportunity and Forecast, By Application, 2016-2032
- 6.5.1. Eastern Europe Polyhydroxybutyrate Market Analysis by Application: Introduction
- 6.5.2. Market Size Absolute $ Opportunity Analysis and Forecast, By Application, 2016-2032
- 6.5.3. Packaging
- 6.5.4. Biomedical & Pharmaceutical
- 6.5.5. Agriculture
- 6.5.6. Textiles
- 6.5.7. Consumer Goods
- 6.5.8. Others
- 6.6. Eastern Europe Polyhydroxybutyrate Market Analysis, Opportunity and Forecast, By Country , 2016-2032
- 6.6.1. Eastern Europe Polyhydroxybutyrate Market Analysis by Country : Introduction
- 6.6.2. Market Size Absolute $ Opportunity Analysis and Forecast, Country , 2016-2032
- 6.6.2.1. Russia
- 6.6.2.2. Poland
- 6.6.2.3. The Czech Republic
- 6.6.2.4. Greece
- 6.6.2.5. Rest of Eastern Europe
- 7. APAC Polyhydroxybutyrate Market Analysis, Opportunity and Forecast, 2016-2032
- 7.1. APAC Polyhydroxybutyrate Market Analysis, 2016-2021
- 7.2. APAC Polyhydroxybutyrate Market Opportunity and Forecast, 2023-2032
- 7.3. APAC Polyhydroxybutyrate Market Analysis, Opportunity and Forecast, By Product Type, 2016-2032
- 7.3.1. APAC Polyhydroxybutyrate Market Analysis by Product Type: Introduction
- 7.3.2. Market Size Absolute $ Opportunity Analysis and Forecast, By Product Type, 2016-2032
- 7.3.3. Polyhydroxybutyrate (PHB)
- 7.3.4. Polyhydroxybutyrate-co-valerate (PHBV)
- 7.3.5. Polyhydroxybutyrate-co-hydroxyvalerate (PHBHV)
- 7.3.6. Others
- 7.4. APAC Polyhydroxybutyrate Market Analysis, Opportunity and Forecast, By Production Process, 2016-2032
- 7.4.1. APAC Polyhydroxybutyrate Market Analysis by Production Process: Introduction
- 7.4.2. Market Size Absolute $ Opportunity Analysis and Forecast, By Production Process, 2016-2032
- 7.4.3. Fermentation-based
- 7.4.4. Chemical Synthesis
- 7.5. APAC Polyhydroxybutyrate Market Analysis, Opportunity and Forecast, By Application, 2016-2032
- 7.5.1. APAC Polyhydroxybutyrate Market Analysis by Application: Introduction
- 7.5.2. Market Size Absolute $ Opportunity Analysis and Forecast, By Application, 2016-2032
- 7.5.3. Packaging
- 7.5.4. Biomedical & Pharmaceutical
- 7.5.5. Agriculture
- 7.5.6. Textiles
- 7.5.7. Consumer Goods
- 7.5.8. Others
- 7.6. APAC Polyhydroxybutyrate Market Analysis, Opportunity and Forecast, By Country , 2016-2032
- 7.6.1. APAC Polyhydroxybutyrate Market Analysis by Country : Introduction
- 7.6.2. Market Size Absolute $ Opportunity Analysis and Forecast, Country , 2016-2032
- 7.6.2.1. China
- 7.6.2.2. Japan
- 7.6.2.3. South Korea
- 7.6.2.4. India
- 7.6.2.5. Australia & New Zeland
- 7.6.2.6. Indonesia
- 7.6.2.7. Malaysia
- 7.6.2.8. Philippines
- 7.6.2.9. Singapore
- 7.6.2.10. Thailand
- 7.6.2.11. Vietnam
- 7.6.2.12. Rest of APAC
- 8. Latin America Polyhydroxybutyrate Market Analysis, Opportunity and Forecast, 2016-2032
- 8.1. Latin America Polyhydroxybutyrate Market Analysis, 2016-2021
- 8.2. Latin America Polyhydroxybutyrate Market Opportunity and Forecast, 2023-2032
- 8.3. Latin America Polyhydroxybutyrate Market Analysis, Opportunity and Forecast, By Product Type, 2016-2032
- 8.3.1. Latin America Polyhydroxybutyrate Market Analysis by Product Type: Introduction
- 8.3.2. Market Size Absolute $ Opportunity Analysis and Forecast, By Product Type, 2016-2032
- 8.3.3. Polyhydroxybutyrate (PHB)
- 8.3.4. Polyhydroxybutyrate-co-valerate (PHBV)
- 8.3.5. Polyhydroxybutyrate-co-hydroxyvalerate (PHBHV)
- 8.3.6. Others
- 8.4. Latin America Polyhydroxybutyrate Market Analysis, Opportunity and Forecast, By Production Process, 2016-2032
- 8.4.1. Latin America Polyhydroxybutyrate Market Analysis by Production Process: Introduction
- 8.4.2. Market Size Absolute $ Opportunity Analysis and Forecast, By Production Process, 2016-2032
- 8.4.3. Fermentation-based
- 8.4.4. Chemical Synthesis
- 8.5. Latin America Polyhydroxybutyrate Market Analysis, Opportunity and Forecast, By Application, 2016-2032
- 8.5.1. Latin America Polyhydroxybutyrate Market Analysis by Application: Introduction
- 8.5.2. Market Size Absolute $ Opportunity Analysis and Forecast, By Application, 2016-2032
- 8.5.3. Packaging
- 8.5.4. Biomedical & Pharmaceutical
- 8.5.5. Agriculture
- 8.5.6. Textiles
- 8.5.7. Consumer Goods
- 8.5.8. Others
- 8.6. Latin America Polyhydroxybutyrate Market Analysis, Opportunity and Forecast, By Country , 2016-2032
- 8.6.1. Latin America Polyhydroxybutyrate Market Analysis by Country : Introduction
- 8.6.2. Market Size Absolute $ Opportunity Analysis and Forecast, Country , 2016-2032
- 8.6.2.1. Brazil
- 8.6.2.2. Colombia
- 8.6.2.3. Chile
- 8.6.2.4. Argentina
- 8.6.2.5. Costa Rica
- 8.6.2.6. Rest of Latin America
- 9. Middle East & Africa Polyhydroxybutyrate Market Analysis, Opportunity and Forecast, 2016-2032
- 9.1. Middle East & Africa Polyhydroxybutyrate Market Analysis, 2016-2021
- 9.2. Middle East & Africa Polyhydroxybutyrate Market Opportunity and Forecast, 2023-2032
- 9.3. Middle East & Africa Polyhydroxybutyrate Market Analysis, Opportunity and Forecast, By Product Type, 2016-2032
- 9.3.1. Middle East & Africa Polyhydroxybutyrate Market Analysis by Product Type: Introduction
- 9.3.2. Market Size Absolute $ Opportunity Analysis and Forecast, By Product Type, 2016-2032
- 9.3.3. Polyhydroxybutyrate (PHB)
- 9.3.4. Polyhydroxybutyrate-co-valerate (PHBV)
- 9.3.5. Polyhydroxybutyrate-co-hydroxyvalerate (PHBHV)
- 9.3.6. Others
- 9.4. Middle East & Africa Polyhydroxybutyrate Market Analysis, Opportunity and Forecast, By Production Process, 2016-2032
- 9.4.1. Middle East & Africa Polyhydroxybutyrate Market Analysis by Production Process: Introduction
- 9.4.2. Market Size Absolute $ Opportunity Analysis and Forecast, By Production Process, 2016-2032
- 9.4.3. Fermentation-based
- 9.4.4. Chemical Synthesis
- 9.5. Middle East & Africa Polyhydroxybutyrate Market Analysis, Opportunity and Forecast, By Application, 2016-2032
- 9.5.1. Middle East & Africa Polyhydroxybutyrate Market Analysis by Application: Introduction
- 9.5.2. Market Size Absolute $ Opportunity Analysis and Forecast, By Application, 2016-2032
- 9.5.3. Packaging
- 9.5.4. Biomedical & Pharmaceutical
- 9.5.5. Agriculture
- 9.5.6. Textiles
- 9.5.7. Consumer Goods
- 9.5.8. Others
- 9.6. Middle East & Africa Polyhydroxybutyrate Market Analysis, Opportunity and Forecast, By Country , 2016-2032
- 9.6.1. Middle East & Africa Polyhydroxybutyrate Market Analysis by Country : Introduction
- 9.6.2. Market Size Absolute $ Opportunity Analysis and Forecast, Country , 2016-2032
- 9.6.2.1. Algeria
- 9.6.2.2. Egypt
- 9.6.2.3. Israel
- 9.6.2.4. Kuwait
- 9.6.2.5. Nigeria
- 9.6.2.6. Saudi Arabia
- 9.6.2.7. South Africa
- 9.6.2.8. Turkey
- 9.6.2.9. The UAE
- 9.6.2.10. Rest of MEA
- 10. Global Polyhydroxybutyrate Market Analysis, Opportunity and Forecast, By Region , 2016-2032
- 10.1. Global Polyhydroxybutyrate Market Analysis by Region : Introduction
- 10.2. Market Size Absolute $ Opportunity Analysis and Forecast, By Region , 2016-2032
- 10.2.1. North America
- 10.2.2. Western Europe
- 10.2.3. Eastern Europe
- 10.2.4. APAC
- 10.2.5. Latin America
- 10.2.6. Middle East & Africa
- 11. Global Polyhydroxybutyrate Market Competitive Landscape, Market Share Analysis, and Company Profiles
- 11.1. Market Share Analysis
- 11.2. Company Profiles
- 11.3. Newlight Technologies
- 11.3.1. Company Overview
- 11.3.2. Financial Highlights
- 11.3.3. Product Portfolio
- 11.3.4. SWOT Analysis
- 11.3.5. Key Strategies and Developments
- 11.4. Kaneka Corporation
- 11.4.1. Company Overview
- 11.4.2. Financial Highlights
- 11.4.3. Product Portfolio
- 11.4.4. SWOT Analysis
- 11.4.5. Key Strategies and Developments
- 11.5. PHB Industrial S.A.
- 11.5.1. Company Overview
- 11.5.2. Financial Highlights
- 11.5.3. Product Portfolio
- 11.5.4. SWOT Analysis
- 11.5.5. Key Strategies and Developments
- 11.6. Triveni Interchem Pvt Ltd
- 11.6.1. Company Overview
- 11.6.2. Financial Highlights
- 11.6.3. Product Portfolio
- 11.6.4. SWOT Analysis
- 11.6.5. Key Strategies and Developments
- 11.7. TEPHA INC
- 11.7.1. Company Overview
- 11.7.2. Financial Highlights
- 11.7.3. Product Portfolio
- 11.7.4. SWOT Analysis
- 11.7.5. Key Strategies and Developments
- 11.8. Tianjin GreenBio Materials Co.,
- 11.8.1. Company Overview
- 11.8.2. Financial Highlights
- 11.8.3. Product Portfolio
- 11.8.4. SWOT Analysis
- 11.8.5. Key Strategies and Developments
- 11.9. RWDC Industries
- 11.9.1. Company Overview
- 11.9.2. Financial Highlights
- 11.9.3. Product Portfolio
- 11.9.4. SWOT Analysis
- 11.9.5. Key Strategies and Developments
- 11.10. P&G Chemicals
- 11.10.1. Company Overview
- 11.10.2. Financial Highlights
- 11.10.3. Product Portfolio
- 11.10.4. SWOT Analysis
- 11.10.5. Key Strategies and Developments
- 11.11. Shenzhen Ecomann Technology
- 11.11.1. Company Overview
- 11.11.2. Financial Highlights
- 11.11.3. Product Portfolio
- 11.11.4. SWOT Analysis
- 11.11.5. Key Strategies and Developments
- 11.12. Biome Technologies
- 11.12.1. Company Overview
- 11.12.2. Financial Highlights
- 11.12.3. Product Portfolio
- 11.12.4. SWOT Analysis
- 11.12.5. Key Strategies and Developments
- 11.13.1. Company Overview
- 11.13.2. Financial Highlights
- 11.13.3. Product Portfolio
- 11.13.4. SWOT Analysis
- 11.13.5. Key Strategies and Developments
- 12. Assumptions and Acronyms
- 13. Research Methodology
- 14. Contact
- List of Figures
- Figure 1: Global Polyhydroxybutyrate Market Revenue (US$ Mn) Market Share by Product Type in 2022
- Figure 2: Global Polyhydroxybutyrate Market Attractiveness Analysis by Product Type, 2016-2032
- Figure 3: Global Polyhydroxybutyrate Market Revenue (US$ Mn) Market Share by Production Processin 2022
- Figure 4: Global Polyhydroxybutyrate Market Attractiveness Analysis by Production Process, 2016-2032
- Figure 5: Global Polyhydroxybutyrate Market Revenue (US$ Mn) Market Share by Applicationin 2022
- Figure 6: Global Polyhydroxybutyrate Market Attractiveness Analysis by Application, 2016-2032
- Figure 7: Global Polyhydroxybutyrate Market Revenue (US$ Mn) Market Share by Region in 2022
- Figure 8: Global Polyhydroxybutyrate Market Attractiveness Analysis by Region, 2016-2032
- Figure 9: Global Polyhydroxybutyrate Market Revenue (US$ Mn) (2016-2032)
- Figure 10: Global Polyhydroxybutyrate Market Revenue (US$ Mn) Comparison by Region (2016-2032)
- Figure 11: Global Polyhydroxybutyrate Market Revenue (US$ Mn) Comparison by Product Type (2016-2032)
- Figure 12: Global Polyhydroxybutyrate Market Revenue (US$ Mn) Comparison by Production Process (2016-2032)
- Figure 13: Global Polyhydroxybutyrate Market Revenue (US$ Mn) Comparison by Application (2016-2032)
- Figure 14: Global Polyhydroxybutyrate Market Y-o-Y Growth Rate Comparison by Region (2016-2032)
- Figure 15: Global Polyhydroxybutyrate Market Y-o-Y Growth Rate Comparison by Product Type (2016-2032)
- Figure 16: Global Polyhydroxybutyrate Market Y-o-Y Growth Rate Comparison by Production Process (2016-2032)
- Figure 17: Global Polyhydroxybutyrate Market Y-o-Y Growth Rate Comparison by Application (2016-2032)
- Figure 18: Global Polyhydroxybutyrate Market Share Comparison by Region (2016-2032)
- Figure 19: Global Polyhydroxybutyrate Market Share Comparison by Product Type (2016-2032)
- Figure 20: Global Polyhydroxybutyrate Market Share Comparison by Production Process (2016-2032)
- Figure 21: Global Polyhydroxybutyrate Market Share Comparison by Application (2016-2032)
- Figure 22: North America Polyhydroxybutyrate Market Revenue (US$ Mn) Market Share by Product Typein 2022
- Figure 23: North America Polyhydroxybutyrate Market Attractiveness Analysis by Product Type, 2016-2032
- Figure 24: North America Polyhydroxybutyrate Market Revenue (US$ Mn) Market Share by Production Processin 2022
- Figure 25: North America Polyhydroxybutyrate Market Attractiveness Analysis by Production Process, 2016-2032
- Figure 26: North America Polyhydroxybutyrate Market Revenue (US$ Mn) Market Share by Applicationin 2022
- Figure 27: North America Polyhydroxybutyrate Market Attractiveness Analysis by Application, 2016-2032
- Figure 28: North America Polyhydroxybutyrate Market Revenue (US$ Mn) Market Share by Country in 2022
- Figure 29: North America Polyhydroxybutyrate Market Attractiveness Analysis by Country, 2016-2032
- Figure 30: North America Polyhydroxybutyrate Market Revenue (US$ Mn) (2016-2032)
- Figure 31: North America Polyhydroxybutyrate Market Revenue (US$ Mn) Comparison by Country (2016-2032)
- Figure 32: North America Polyhydroxybutyrate Market Revenue (US$ Mn) Comparison by Product Type (2016-2032)
- Figure 33: North America Polyhydroxybutyrate Market Revenue (US$ Mn) Comparison by Production Process (2016-2032)
- Figure 34: North America Polyhydroxybutyrate Market Revenue (US$ Mn) Comparison by Application (2016-2032)
- Figure 35: North America Polyhydroxybutyrate Market Y-o-Y Growth Rate Comparison by Country (2016-2032)
- Figure 36: North America Polyhydroxybutyrate Market Y-o-Y Growth Rate Comparison by Product Type (2016-2032)
- Figure 37: North America Polyhydroxybutyrate Market Y-o-Y Growth Rate Comparison by Production Process (2016-2032)
- Figure 38: North America Polyhydroxybutyrate Market Y-o-Y Growth Rate Comparison by Application (2016-2032)
- Figure 39: North America Polyhydroxybutyrate Market Share Comparison by Country (2016-2032)
- Figure 40: North America Polyhydroxybutyrate Market Share Comparison by Product Type (2016-2032)
- Figure 41: North America Polyhydroxybutyrate Market Share Comparison by Production Process (2016-2032)
- Figure 42: North America Polyhydroxybutyrate Market Share Comparison by Application (2016-2032)
- Figure 43: Western Europe Polyhydroxybutyrate Market Revenue (US$ Mn) Market Share by Product Typein 2022
- Figure 44: Western Europe Polyhydroxybutyrate Market Attractiveness Analysis by Product Type, 2016-2032
- Figure 45: Western Europe Polyhydroxybutyrate Market Revenue (US$ Mn) Market Share by Production Processin 2022
- Figure 46: Western Europe Polyhydroxybutyrate Market Attractiveness Analysis by Production Process, 2016-2032
- Figure 47: Western Europe Polyhydroxybutyrate Market Revenue (US$ Mn) Market Share by Applicationin 2022
- Figure 48: Western Europe Polyhydroxybutyrate Market Attractiveness Analysis by Application, 2016-2032
- Figure 49: Western Europe Polyhydroxybutyrate Market Revenue (US$ Mn) Market Share by Country in 2022
- Figure 50: Western Europe Polyhydroxybutyrate Market Attractiveness Analysis by Country, 2016-2032
- Figure 51: Western Europe Polyhydroxybutyrate Market Revenue (US$ Mn) (2016-2032)
- Figure 52: Western Europe Polyhydroxybutyrate Market Revenue (US$ Mn) Comparison by Country (2016-2032)
- Figure 53: Western Europe Polyhydroxybutyrate Market Revenue (US$ Mn) Comparison by Product Type (2016-2032)
- Figure 54: Western Europe Polyhydroxybutyrate Market Revenue (US$ Mn) Comparison by Production Process (2016-2032)
- Figure 55: Western Europe Polyhydroxybutyrate Market Revenue (US$ Mn) Comparison by Application (2016-2032)
- Figure 56: Western Europe Polyhydroxybutyrate Market Y-o-Y Growth Rate Comparison by Country (2016-2032)
- Figure 57: Western Europe Polyhydroxybutyrate Market Y-o-Y Growth Rate Comparison by Product Type (2016-2032)
- Figure 58: Western Europe Polyhydroxybutyrate Market Y-o-Y Growth Rate Comparison by Production Process (2016-2032)
- Figure 59: Western Europe Polyhydroxybutyrate Market Y-o-Y Growth Rate Comparison by Application (2016-2032)
- Figure 60: Western Europe Polyhydroxybutyrate Market Share Comparison by Country (2016-2032)
- Figure 61: Western Europe Polyhydroxybutyrate Market Share Comparison by Product Type (2016-2032)
- Figure 62: Western Europe Polyhydroxybutyrate Market Share Comparison by Production Process (2016-2032)
- Figure 63: Western Europe Polyhydroxybutyrate Market Share Comparison by Application (2016-2032)
- Figure 64: Eastern Europe Polyhydroxybutyrate Market Revenue (US$ Mn) Market Share by Product Typein 2022
- Figure 65: Eastern Europe Polyhydroxybutyrate Market Attractiveness Analysis by Product Type, 2016-2032
- Figure 66: Eastern Europe Polyhydroxybutyrate Market Revenue (US$ Mn) Market Share by Production Processin 2022
- Figure 67: Eastern Europe Polyhydroxybutyrate Market Attractiveness Analysis by Production Process, 2016-2032
- Figure 68: Eastern Europe Polyhydroxybutyrate Market Revenue (US$ Mn) Market Share by Applicationin 2022
- Figure 69: Eastern Europe Polyhydroxybutyrate Market Attractiveness Analysis by Application, 2016-2032
- Figure 70: Eastern Europe Polyhydroxybutyrate Market Revenue (US$ Mn) Market Share by Country in 2022
- Figure 71: Eastern Europe Polyhydroxybutyrate Market Attractiveness Analysis by Country, 2016-2032
- Figure 72: Eastern Europe Polyhydroxybutyrate Market Revenue (US$ Mn) (2016-2032)
- Figure 73: Eastern Europe Polyhydroxybutyrate Market Revenue (US$ Mn) Comparison by Country (2016-2032)
- Figure 74: Eastern Europe Polyhydroxybutyrate Market Revenue (US$ Mn) Comparison by Product Type (2016-2032)
- Figure 75: Eastern Europe Polyhydroxybutyrate Market Revenue (US$ Mn) Comparison by Production Process (2016-2032)
- Figure 76: Eastern Europe Polyhydroxybutyrate Market Revenue (US$ Mn) Comparison by Application (2016-2032)
- Figure 77: Eastern Europe Polyhydroxybutyrate Market Y-o-Y Growth Rate Comparison by Country (2016-2032)
- Figure 78: Eastern Europe Polyhydroxybutyrate Market Y-o-Y Growth Rate Comparison by Product Type (2016-2032)
- Figure 79: Eastern Europe Polyhydroxybutyrate Market Y-o-Y Growth Rate Comparison by Production Process (2016-2032)
- Figure 80: Eastern Europe Polyhydroxybutyrate Market Y-o-Y Growth Rate Comparison by Application (2016-2032)
- Figure 81: Eastern Europe Polyhydroxybutyrate Market Share Comparison by Country (2016-2032)
- Figure 82: Eastern Europe Polyhydroxybutyrate Market Share Comparison by Product Type (2016-2032)
- Figure 83: Eastern Europe Polyhydroxybutyrate Market Share Comparison by Production Process (2016-2032)
- Figure 84: Eastern Europe Polyhydroxybutyrate Market Share Comparison by Application (2016-2032)
- Figure 85: APAC Polyhydroxybutyrate Market Revenue (US$ Mn) Market Share by Product Typein 2022
- Figure 86: APAC Polyhydroxybutyrate Market Attractiveness Analysis by Product Type, 2016-2032
- Figure 87: APAC Polyhydroxybutyrate Market Revenue (US$ Mn) Market Share by Production Processin 2022
- Figure 88: APAC Polyhydroxybutyrate Market Attractiveness Analysis by Production Process, 2016-2032
- Figure 89: APAC Polyhydroxybutyrate Market Revenue (US$ Mn) Market Share by Applicationin 2022
- Figure 90: APAC Polyhydroxybutyrate Market Attractiveness Analysis by Application, 2016-2032
- Figure 91: APAC Polyhydroxybutyrate Market Revenue (US$ Mn) Market Share by Country in 2022
- Figure 92: APAC Polyhydroxybutyrate Market Attractiveness Analysis by Country, 2016-2032
- Figure 93: APAC Polyhydroxybutyrate Market Revenue (US$ Mn) (2016-2032)
- Figure 94: APAC Polyhydroxybutyrate Market Revenue (US$ Mn) Comparison by Country (2016-2032)
- Figure 95: APAC Polyhydroxybutyrate Market Revenue (US$ Mn) Comparison by Product Type (2016-2032)
- Figure 96: APAC Polyhydroxybutyrate Market Revenue (US$ Mn) Comparison by Production Process (2016-2032)
- Figure 97: APAC Polyhydroxybutyrate Market Revenue (US$ Mn) Comparison by Application (2016-2032)
- Figure 98: APAC Polyhydroxybutyrate Market Y-o-Y Growth Rate Comparison by Country (2016-2032)
- Figure 99: APAC Polyhydroxybutyrate Market Y-o-Y Growth Rate Comparison by Product Type (2016-2032)
- Figure 100: APAC Polyhydroxybutyrate Market Y-o-Y Growth Rate Comparison by Production Process (2016-2032)
- Figure 101: APAC Polyhydroxybutyrate Market Y-o-Y Growth Rate Comparison by Application (2016-2032)
- Figure 102: APAC Polyhydroxybutyrate Market Share Comparison by Country (2016-2032)
- Figure 103: APAC Polyhydroxybutyrate Market Share Comparison by Product Type (2016-2032)
- Figure 104: APAC Polyhydroxybutyrate Market Share Comparison by Production Process (2016-2032)
- Figure 105: APAC Polyhydroxybutyrate Market Share Comparison by Application (2016-2032)
- Figure 106: Latin America Polyhydroxybutyrate Market Revenue (US$ Mn) Market Share by Product Typein 2022
- Figure 107: Latin America Polyhydroxybutyrate Market Attractiveness Analysis by Product Type, 2016-2032
- Figure 108: Latin America Polyhydroxybutyrate Market Revenue (US$ Mn) Market Share by Production Processin 2022
- Figure 109: Latin America Polyhydroxybutyrate Market Attractiveness Analysis by Production Process, 2016-2032
- Figure 110: Latin America Polyhydroxybutyrate Market Revenue (US$ Mn) Market Share by Applicationin 2022
- Figure 111: Latin America Polyhydroxybutyrate Market Attractiveness Analysis by Application, 2016-2032
- Figure 112: Latin America Polyhydroxybutyrate Market Revenue (US$ Mn) Market Share by Country in 2022
- Figure 113: Latin America Polyhydroxybutyrate Market Attractiveness Analysis by Country, 2016-2032
- Figure 114: Latin America Polyhydroxybutyrate Market Revenue (US$ Mn) (2016-2032)
- Figure 115: Latin America Polyhydroxybutyrate Market Revenue (US$ Mn) Comparison by Country (2016-2032)
- Figure 116: Latin America Polyhydroxybutyrate Market Revenue (US$ Mn) Comparison by Product Type (2016-2032)
- Figure 117: Latin America Polyhydroxybutyrate Market Revenue (US$ Mn) Comparison by Production Process (2016-2032)
- Figure 118: Latin America Polyhydroxybutyrate Market Revenue (US$ Mn) Comparison by Application (2016-2032)
- Figure 119: Latin America Polyhydroxybutyrate Market Y-o-Y Growth Rate Comparison by Country (2016-2032)
- Figure 120: Latin America Polyhydroxybutyrate Market Y-o-Y Growth Rate Comparison by Product Type (2016-2032)
- Figure 121: Latin America Polyhydroxybutyrate Market Y-o-Y Growth Rate Comparison by Production Process (2016-2032)
- Figure 122: Latin America Polyhydroxybutyrate Market Y-o-Y Growth Rate Comparison by Application (2016-2032)
- Figure 123: Latin America Polyhydroxybutyrate Market Share Comparison by Country (2016-2032)
- Figure 124: Latin America Polyhydroxybutyrate Market Share Comparison by Product Type (2016-2032)
- Figure 125: Latin America Polyhydroxybutyrate Market Share Comparison by Production Process (2016-2032)
- Figure 126: Latin America Polyhydroxybutyrate Market Share Comparison by Application (2016-2032)
- Figure 127: Middle East & Africa Polyhydroxybutyrate Market Revenue (US$ Mn) Market Share by Product Typein 2022
- Figure 128: Middle East & Africa Polyhydroxybutyrate Market Attractiveness Analysis by Product Type, 2016-2032
- Figure 129: Middle East & Africa Polyhydroxybutyrate Market Revenue (US$ Mn) Market Share by Production Processin 2022
- Figure 130: Middle East & Africa Polyhydroxybutyrate Market Attractiveness Analysis by Production Process, 2016-2032
- Figure 131: Middle East & Africa Polyhydroxybutyrate Market Revenue (US$ Mn) Market Share by Applicationin 2022
- Figure 132: Middle East & Africa Polyhydroxybutyrate Market Attractiveness Analysis by Application, 2016-2032
- Figure 133: Middle East & Africa Polyhydroxybutyrate Market Revenue (US$ Mn) Market Share by Country in 2022
- Figure 134: Middle East & Africa Polyhydroxybutyrate Market Attractiveness Analysis by Country, 2016-2032
- Figure 135: Middle East & Africa Polyhydroxybutyrate Market Revenue (US$ Mn) (2016-2032)
- Figure 136: Middle East & Africa Polyhydroxybutyrate Market Revenue (US$ Mn) Comparison by Country (2016-2032)
- Figure 137: Middle East & Africa Polyhydroxybutyrate Market Revenue (US$ Mn) Comparison by Product Type (2016-2032)
- Figure 138: Middle East & Africa Polyhydroxybutyrate Market Revenue (US$ Mn) Comparison by Production Process (2016-2032)
- Figure 139: Middle East & Africa Polyhydroxybutyrate Market Revenue (US$ Mn) Comparison by Application (2016-2032)
- Figure 140: Middle East & Africa Polyhydroxybutyrate Market Y-o-Y Growth Rate Comparison by Country (2016-2032)
- Figure 141: Middle East & Africa Polyhydroxybutyrate Market Y-o-Y Growth Rate Comparison by Product Type (2016-2032)
- Figure 142: Middle East & Africa Polyhydroxybutyrate Market Y-o-Y Growth Rate Comparison by Production Process (2016-2032)
- Figure 143: Middle East & Africa Polyhydroxybutyrate Market Y-o-Y Growth Rate Comparison by Application (2016-2032)
- Figure 144: Middle East & Africa Polyhydroxybutyrate Market Share Comparison by Country (2016-2032)
- Figure 145: Middle East & Africa Polyhydroxybutyrate Market Share Comparison by Product Type (2016-2032)
- Figure 146: Middle East & Africa Polyhydroxybutyrate Market Share Comparison by Production Process (2016-2032)
- Figure 147: Middle East & Africa Polyhydroxybutyrate Market Share Comparison by Application (2016-2032)
- List of Tables
- Table 1: Global Polyhydroxybutyrate Market Comparison by Product Type (2016-2032)
- Table 2: Global Polyhydroxybutyrate Market Comparison by Production Process (2016-2032)
- Table 3: Global Polyhydroxybutyrate Market Comparison by Application (2016-2032)
- Table 4: Global Polyhydroxybutyrate Market Revenue (US$ Mn) Comparison by Region (2016-2032)
- Table 5: Global Polyhydroxybutyrate Market Revenue (US$ Mn) (2016-2032)
- Table 6: Global Polyhydroxybutyrate Market Revenue (US$ Mn) Comparison by Region (2016-2032)
- Table 7: Global Polyhydroxybutyrate Market Revenue (US$ Mn) Comparison by Product Type (2016-2032)
- Table 8: Global Polyhydroxybutyrate Market Revenue (US$ Mn) Comparison by Production Process (2016-2032)
- Table 9: Global Polyhydroxybutyrate Market Revenue (US$ Mn) Comparison by Application (2016-2032)
- Table 10: Global Polyhydroxybutyrate Market Y-o-Y Growth Rate Comparison by Region (2016-2032)
- Table 11: Global Polyhydroxybutyrate Market Y-o-Y Growth Rate Comparison by Product Type (2016-2032)
- Table 12: Global Polyhydroxybutyrate Market Y-o-Y Growth Rate Comparison by Production Process (2016-2032)
- Table 13: Global Polyhydroxybutyrate Market Y-o-Y Growth Rate Comparison by Application (2016-2032)
- Table 14: Global Polyhydroxybutyrate Market Share Comparison by Region (2016-2032)
- Table 15: Global Polyhydroxybutyrate Market Share Comparison by Product Type (2016-2032)
- Table 16: Global Polyhydroxybutyrate Market Share Comparison by Production Process (2016-2032)
- Table 17: Global Polyhydroxybutyrate Market Share Comparison by Application (2016-2032)
- Table 18: North America Polyhydroxybutyrate Market Comparison by Production Process (2016-2032)
- Table 19: North America Polyhydroxybutyrate Market Comparison by Application (2016-2032)
- Table 20: North America Polyhydroxybutyrate Market Revenue (US$ Mn) Comparison by Country (2016-2032)
- Table 21: North America Polyhydroxybutyrate Market Revenue (US$ Mn) (2016-2032)
- Table 22: North America Polyhydroxybutyrate Market Revenue (US$ Mn) Comparison by Country (2016-2032)
- Table 23: North America Polyhydroxybutyrate Market Revenue (US$ Mn) Comparison by Product Type (2016-2032)
- Table 24: North America Polyhydroxybutyrate Market Revenue (US$ Mn) Comparison by Production Process (2016-2032)
- Table 25: North America Polyhydroxybutyrate Market Revenue (US$ Mn) Comparison by Application (2016-2032)
- Table 26: North America Polyhydroxybutyrate Market Y-o-Y Growth Rate Comparison by Country (2016-2032)
- Table 27: North America Polyhydroxybutyrate Market Y-o-Y Growth Rate Comparison by Product Type (2016-2032)
- Table 28: North America Polyhydroxybutyrate Market Y-o-Y Growth Rate Comparison by Production Process (2016-2032)
- Table 29: North America Polyhydroxybutyrate Market Y-o-Y Growth Rate Comparison by Application (2016-2032)
- Table 30: North America Polyhydroxybutyrate Market Share Comparison by Country (2016-2032)
- Table 31: North America Polyhydroxybutyrate Market Share Comparison by Product Type (2016-2032)
- Table 32: North America Polyhydroxybutyrate Market Share Comparison by Production Process (2016-2032)
- Table 33: North America Polyhydroxybutyrate Market Share Comparison by Application (2016-2032)
- Table 34: Western Europe Polyhydroxybutyrate Market Comparison by Product Type (2016-2032)
- Table 35: Western Europe Polyhydroxybutyrate Market Comparison by Production Process (2016-2032)
- Table 36: Western Europe Polyhydroxybutyrate Market Comparison by Application (2016-2032)
- Table 37: Western Europe Polyhydroxybutyrate Market Revenue (US$ Mn) Comparison by Country (2016-2032)
- Table 38: Western Europe Polyhydroxybutyrate Market Revenue (US$ Mn) (2016-2032)
- Table 39: Western Europe Polyhydroxybutyrate Market Revenue (US$ Mn) Comparison by Country (2016-2032)
- Table 40: Western Europe Polyhydroxybutyrate Market Revenue (US$ Mn) Comparison by Product Type (2016-2032)
- Table 41: Western Europe Polyhydroxybutyrate Market Revenue (US$ Mn) Comparison by Production Process (2016-2032)
- Table 42: Western Europe Polyhydroxybutyrate Market Revenue (US$ Mn) Comparison by Application (2016-2032)
- Table 43: Western Europe Polyhydroxybutyrate Market Y-o-Y Growth Rate Comparison by Country (2016-2032)
- Table 44: Western Europe Polyhydroxybutyrate Market Y-o-Y Growth Rate Comparison by Product Type (2016-2032)
- Table 45: Western Europe Polyhydroxybutyrate Market Y-o-Y Growth Rate Comparison by Production Process (2016-2032)
- Table 46: Western Europe Polyhydroxybutyrate Market Y-o-Y Growth Rate Comparison by Application (2016-2032)
- Table 47: Western Europe Polyhydroxybutyrate Market Share Comparison by Country (2016-2032)
- Table 48: Western Europe Polyhydroxybutyrate Market Share Comparison by Product Type (2016-2032)
- Table 49: Western Europe Polyhydroxybutyrate Market Share Comparison by Production Process (2016-2032)
- Table 50: Western Europe Polyhydroxybutyrate Market Share Comparison by Application (2016-2032)
- Table 51: Eastern Europe Polyhydroxybutyrate Market Comparison by Product Type (2016-2032)
- Table 52: Eastern Europe Polyhydroxybutyrate Market Comparison by Production Process (2016-2032)
- Table 53: Eastern Europe Polyhydroxybutyrate Market Comparison by Application (2016-2032)
- Table 54: Eastern Europe Polyhydroxybutyrate Market Revenue (US$ Mn) Comparison by Country (2016-2032)
- Table 55: Eastern Europe Polyhydroxybutyrate Market Revenue (US$ Mn) (2016-2032)
- Table 56: Eastern Europe Polyhydroxybutyrate Market Revenue (US$ Mn) Comparison by Country (2016-2032)
- Table 57: Eastern Europe Polyhydroxybutyrate Market Revenue (US$ Mn) Comparison by Product Type (2016-2032)
- Table 58: Eastern Europe Polyhydroxybutyrate Market Revenue (US$ Mn) Comparison by Production Process (2016-2032)
- Table 59: Eastern Europe Polyhydroxybutyrate Market Revenue (US$ Mn) Comparison by Application (2016-2032)
- Table 60: Eastern Europe Polyhydroxybutyrate Market Y-o-Y Growth Rate Comparison by Country (2016-2032)
- Table 61: Eastern Europe Polyhydroxybutyrate Market Y-o-Y Growth Rate Comparison by Product Type (2016-2032)
- Table 62: Eastern Europe Polyhydroxybutyrate Market Y-o-Y Growth Rate Comparison by Production Process (2016-2032)
- Table 63: Eastern Europe Polyhydroxybutyrate Market Y-o-Y Growth Rate Comparison by Application (2016-2032)
- Table 64: Eastern Europe Polyhydroxybutyrate Market Share Comparison by Country (2016-2032)
- Table 65: Eastern Europe Polyhydroxybutyrate Market Share Comparison by Product Type (2016-2032)
- Table 66: Eastern Europe Polyhydroxybutyrate Market Share Comparison by Production Process (2016-2032)
- Table 67: Eastern Europe Polyhydroxybutyrate Market Share Comparison by Application (2016-2032)
- Table 68: APAC Polyhydroxybutyrate Market Comparison by Product Type (2016-2032)
- Table 69: APAC Polyhydroxybutyrate Market Comparison by Production Process (2016-2032)
- Table 70: APAC Polyhydroxybutyrate Market Comparison by Application (2016-2032)
- Table 71: APAC Polyhydroxybutyrate Market Revenue (US$ Mn) Comparison by Country (2016-2032)
- Table 72: APAC Polyhydroxybutyrate Market Revenue (US$ Mn) (2016-2032)
- Table 73: APAC Polyhydroxybutyrate Market Revenue (US$ Mn) Comparison by Country (2016-2032)
- Table 74: APAC Polyhydroxybutyrate Market Revenue (US$ Mn) Comparison by Product Type (2016-2032)
- Table 75: APAC Polyhydroxybutyrate Market Revenue (US$ Mn) Comparison by Production Process (2016-2032)
- Table 76: APAC Polyhydroxybutyrate Market Revenue (US$ Mn) Comparison by Application (2016-2032)
- Table 77: APAC Polyhydroxybutyrate Market Y-o-Y Growth Rate Comparison by Country (2016-2032)
- Table 78: APAC Polyhydroxybutyrate Market Y-o-Y Growth Rate Comparison by Product Type (2016-2032)
- Table 79: APAC Polyhydroxybutyrate Market Y-o-Y Growth Rate Comparison by Production Process (2016-2032)
- Table 80: APAC Polyhydroxybutyrate Market Y-o-Y Growth Rate Comparison by Application (2016-2032)
- Table 81: APAC Polyhydroxybutyrate Market Share Comparison by Country (2016-2032)
- Table 82: APAC Polyhydroxybutyrate Market Share Comparison by Product Type (2016-2032)
- Table 83: APAC Polyhydroxybutyrate Market Share Comparison by Production Process (2016-2032)
- Table 84: APAC Polyhydroxybutyrate Market Share Comparison by Application (2016-2032)
- Table 85: Latin America Polyhydroxybutyrate Market Comparison by Product Type (2016-2032)
- Table 86: Latin America Polyhydroxybutyrate Market Comparison by Production Process (2016-2032)
- Table 87: Latin America Polyhydroxybutyrate Market Comparison by Application (2016-2032)
- Table 88: Latin America Polyhydroxybutyrate Market Revenue (US$ Mn) Comparison by Country (2016-2032)
- Table 89: Latin America Polyhydroxybutyrate Market Revenue (US$ Mn) (2016-2032)
- Table 90: Latin America Polyhydroxybutyrate Market Revenue (US$ Mn) Comparison by Country (2016-2032)
- Table 91: Latin America Polyhydroxybutyrate Market Revenue (US$ Mn) Comparison by Product Type (2016-2032)
- Table 92: Latin America Polyhydroxybutyrate Market Revenue (US$ Mn) Comparison by Production Process (2016-2032)
- Table 93: Latin America Polyhydroxybutyrate Market Revenue (US$ Mn) Comparison by Application (2016-2032)
- Table 94: Latin America Polyhydroxybutyrate Market Y-o-Y Growth Rate Comparison by Country (2016-2032)
- Table 95: Latin America Polyhydroxybutyrate Market Y-o-Y Growth Rate Comparison by Product Type (2016-2032)
- Table 96: Latin America Polyhydroxybutyrate Market Y-o-Y Growth Rate Comparison by Production Process (2016-2032)
- Table 97: Latin America Polyhydroxybutyrate Market Y-o-Y Growth Rate Comparison by Application (2016-2032)
- Table 98: Latin America Polyhydroxybutyrate Market Share Comparison by Country (2016-2032)
- Table 99: Latin America Polyhydroxybutyrate Market Share Comparison by Product Type (2016-2032)
- Table 100: Latin America Polyhydroxybutyrate Market Share Comparison by Production Process (2016-2032)
- Table 101: Latin America Polyhydroxybutyrate Market Share Comparison by Application (2016-2032)
- Table 102: Middle East & Africa Polyhydroxybutyrate Market Comparison by Product Type (2016-2032)
- Table 103: Middle East & Africa Polyhydroxybutyrate Market Comparison by Production Process (2016-2032)
- Table 104: Middle East & Africa Polyhydroxybutyrate Market Comparison by Application (2016-2032)
- Table 105: Middle East & Africa Polyhydroxybutyrate Market Revenue (US$ Mn) Comparison by Country (2016-2032)
- Table 106: Middle East & Africa Polyhydroxybutyrate Market Revenue (US$ Mn) (2016-2032)
- Table 107: Middle East & Africa Polyhydroxybutyrate Market Revenue (US$ Mn) Comparison by Country (2016-2032)
- Table 108: Middle East & Africa Polyhydroxybutyrate Market Revenue (US$ Mn) Comparison by Product Type (2016-2032)
- Table 109: Middle East & Africa Polyhydroxybutyrate Market Revenue (US$ Mn) Comparison by Production Process (2016-2032)
- Table 110: Middle East & Africa Polyhydroxybutyrate Market Revenue (US$ Mn) Comparison by Application (2016-2032)
- Table 111: Middle East & Africa Polyhydroxybutyrate Market Y-o-Y Growth Rate Comparison by Country (2016-2032)
- Table 112: Middle East & Africa Polyhydroxybutyrate Market Y-o-Y Growth Rate Comparison by Product Type (2016-2032)
- Table 113: Middle East & Africa Polyhydroxybutyrate Market Y-o-Y Growth Rate Comparison by Production Process (2016-2032)
- Table 114: Middle East & Africa Polyhydroxybutyrate Market Y-o-Y Growth Rate Comparison by Application (2016-2032)
- Table 115: Middle East & Africa Polyhydroxybutyrate Market Share Comparison by Country (2016-2032)
- Table 116: Middle East & Africa Polyhydroxybutyrate Market Share Comparison by Product Type (2016-2032)
- Table 117: Middle East & Africa Polyhydroxybutyrate Market Share Comparison by Production Process (2016-2032)
- Table 118: Middle East & Africa Polyhydroxybutyrate Market Share Comparison by Application (2016-2032)
- 1. Executive Summary
-
- BASF SE
- Biomer
- TianAn Biologic Materials Co. Ltd.
- POLYHYDROXYBUTYRATE Industrial S.A
- BIO-ON
- Telles LLC
- TEPHA INC
- Wacker Chemie AG
- Triveni Interchem Pvt Ltd
Our Clients


View Our Licence Options
