Polyaluminium Chloride Market Polyaluminium Chloride Market, By Type (Solid PAC, Liquid PAC), By Application (Water Treatment, Pulp & Paper, Textile Industry, Oil & Gas, Cosmetics and Personal Care), By Grade (High Basicity PAC, Low Basicity PAC), By Region and Companies - Industry Segment Outlook, Market Assessment, Competition Scenario, Trends and Forecast 2024-2033
-
50685
-
Aug 2024
-
300
-


-
This report was compiled by Shreyas Rokade Shreyas Rokade is a seasoned Research Analyst with CMFE, bringing extensive expertise in market research and consulting, with a strong background in Chemical Engineering. Correspondence Team Lead-CMFE Linkedin | Detailed Market research Methodology Our methodology involves a mix of primary research, including interviews with leading mental health experts, and secondary research from reputable medical journals and databases. View Detailed Methodology Page
-
Quick Navigation
Report Overview
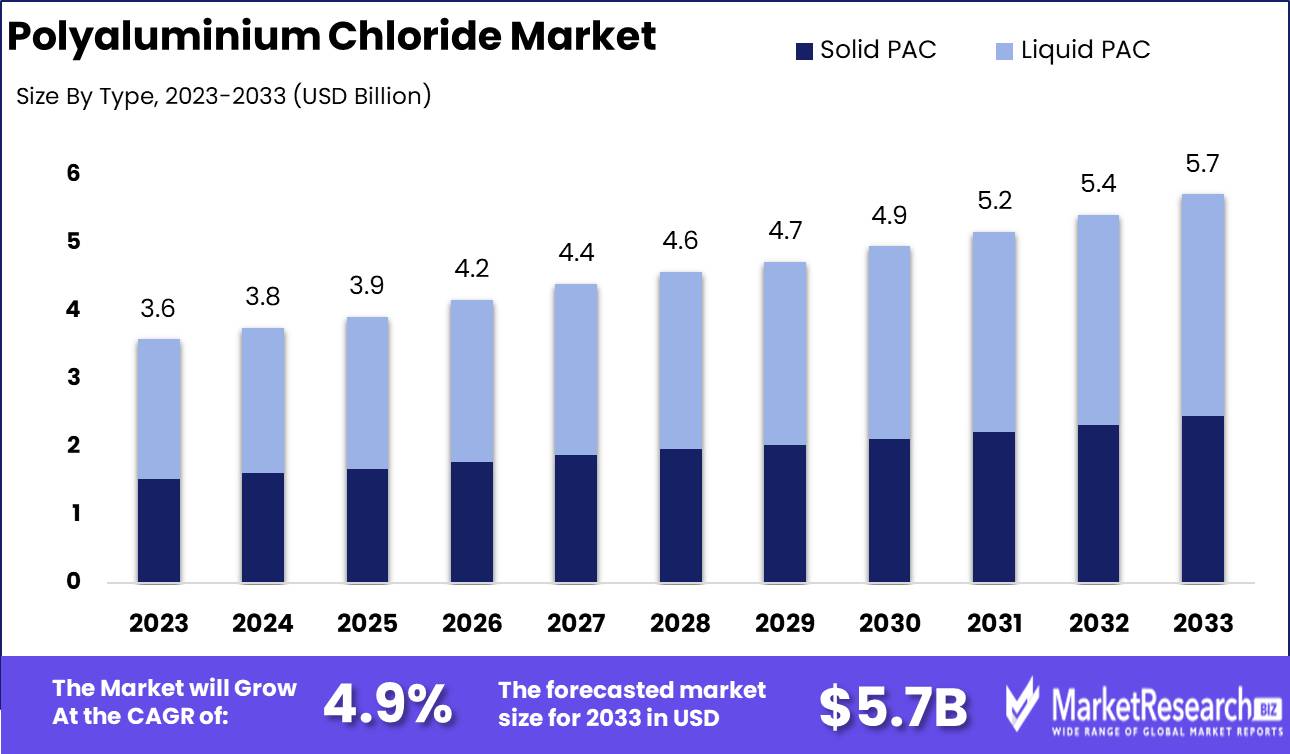
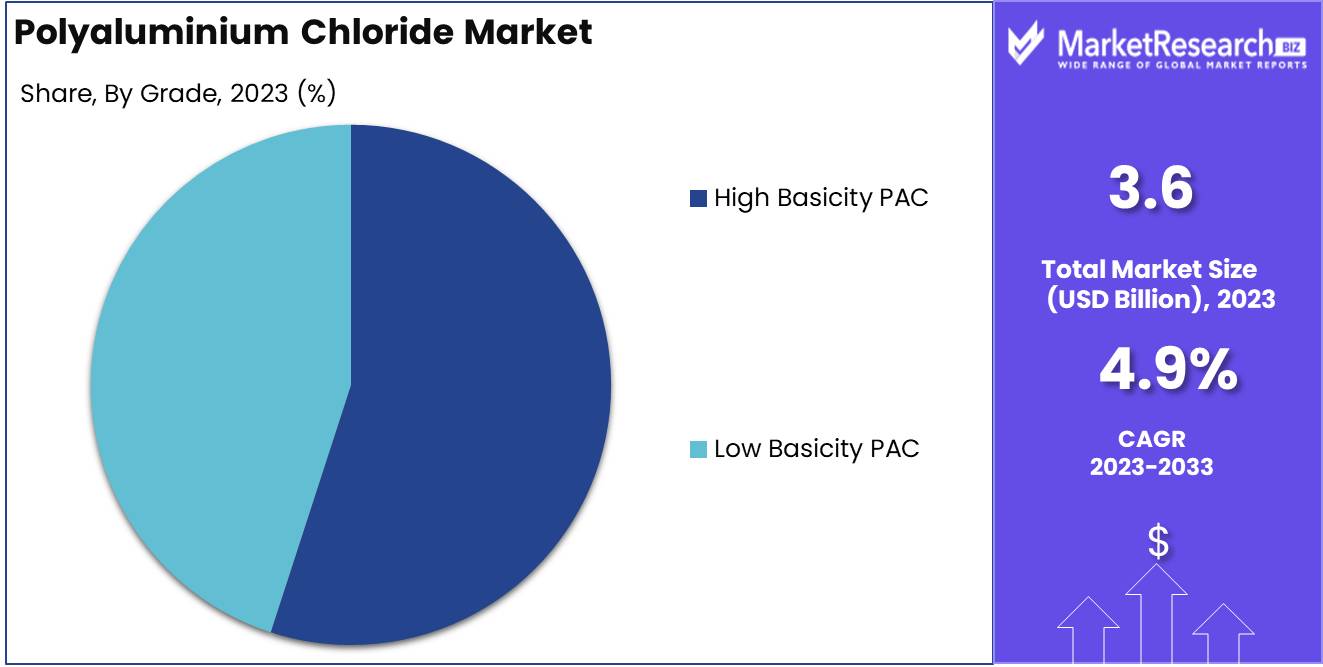
The Global Polyaluminium Chloride Market was valued at USD 3.58 Bn in 2023. It is expected to reach USD 5.7 Bn by 2033, with a CAGR of 4.9% during the forecast period from 2024 to 2033.
The Polyaluminium Chloride (PAC) Market involves the production, distribution, and application of PAC, a widely used coagulant in water treatment processes. PAC is valued for its effectiveness in removing impurities, its efficiency at varying pH levels, and its lower sludge production compared to other coagulants. The market serves various industries, including municipal water treatment, industrial wastewater management, and paper manufacturing. Growth in this market is driven by increasing demand for clean water, regulatory pressures for wastewater treatment, and innovations in sustainable production methods, making it a crucial segment in environmental management.
 The Polyaluminium Chloride Market is experiencing significant growth, driven by the rising global demand for effective water treatment solutions and stringent environmental regulations. Polyaluminium chloride, a key coagulant used in both municipal and industrial water treatment, is favored for its superior performance in removing impurities and its efficiency across a broad range of pH levels. The market is benefiting from advancements in sustainable synthesis techniques, such as the use of waste aluminum foil under controlled pH conditions (9 ± 0.5) and an OH/Al molar ratio of 2, which are contributing to more eco-friendly production processes.
Operational flexibility in the production of PAC is another critical factor driving market growth. The ability to synthesize PAC under diverse parameters—including solution pH ranges of 3–9, dosing of 5–100 mg/L, temperatures between 10–55°C, and rapid mixing speeds of 120–360 rpm—allows for tailored production processes that meet the specific needs of various applications. This versatility enhances the appeal of PAC as a reliable and adaptable solution in water treatment.
Moreover, the increasing focus on sustainable industrial practices is propelling the adoption of PAC, as industries seek to minimize environmental impact while maintaining high efficiency in water treatment processes. The market is also supported by ongoing research and development efforts aimed at optimizing PAC formulations to further improve performance and sustainability.
The polyaluminium chloride market is poised for continued expansion, driven by its critical role in water treatment, advancements in sustainable production methods, and the versatility of its synthesis parameters. Companies that invest in innovative and eco-friendly PAC production techniques are well-positioned to capture a growing share of this essential market.
Key Takeaways
- By Type: Liquid PAC represents 60% of the market, widely used for its effectiveness in coagulation and flocculation processes.
- By Application: Water Treatment accounts for 45%, highlighting the importance of PAC in ensuring safe and clean water supplies.
- By Grade: High Basicity PAC constitutes 55%, preferred for its enhanced performance in removing impurities.
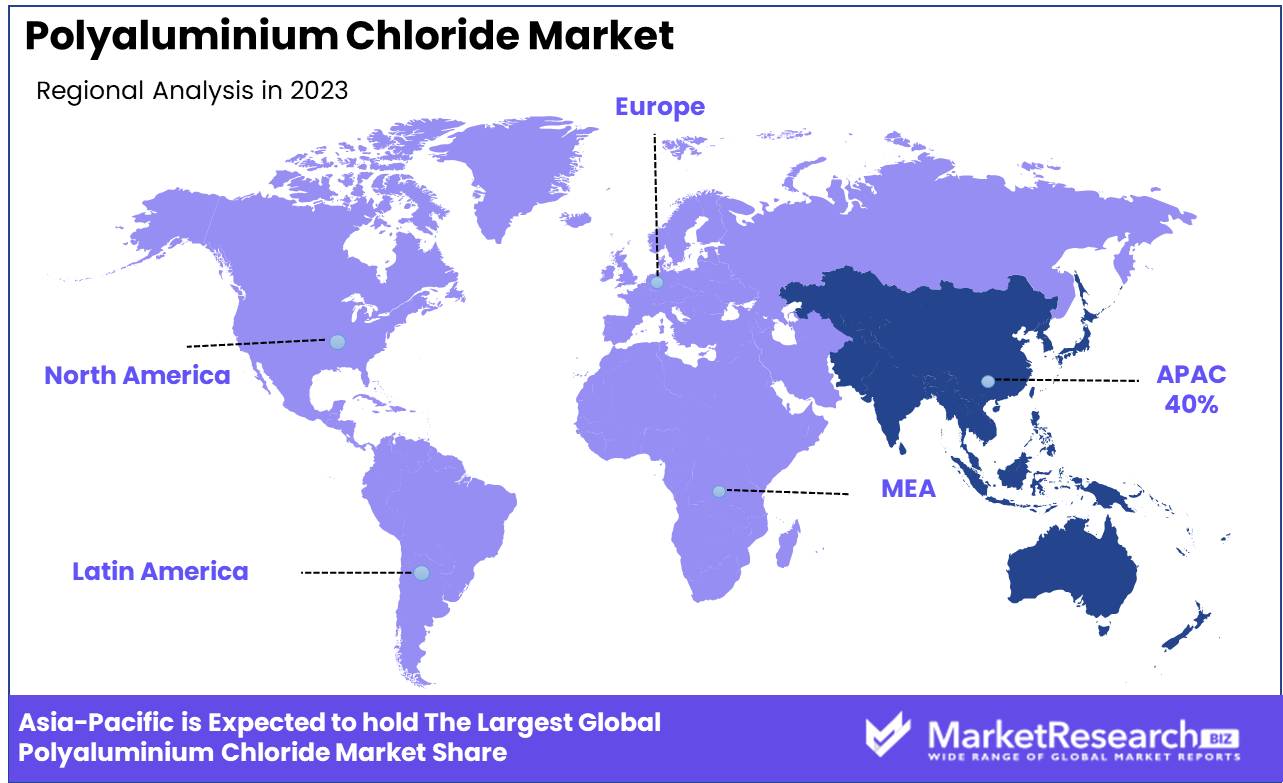
- Regional Dominance: Asia Pacific holds a 40% market share, driven by growing demand for water treatment in industrial and municipal sectors.
- Growth Opportunity: Expanding applications of PAC in industrial wastewater treatment can address environmental concerns and drive market growth.
Driving factors
Increasing Demand for Water Treatment and Purification Solutions
The escalating global need for clean water is a significant driving force behind the growth of the Polyaluminium Chloride (PAC) market. As populations expand and urbanization intensifies, the demand for efficient water treatment solutions has become critical. PAC, known for its effectiveness in removing suspended solids, organic matter, and pathogens, is increasingly being adopted by municipal and industrial water treatment facilities.
This surge in demand is further amplified by stringent regulatory standards imposed by governments worldwide, aiming to ensure the safety and quality of drinking water. As a result, the market for PAC is experiencing robust growth, driven by its essential role in addressing the challenges of water scarcity and pollution.
Growth in Industrial Wastewater Management
The rise in industrial activities has led to a substantial increase in wastewater generation, necessitating effective treatment methods to comply with environmental regulations. Polyaluminium Chloride is widely used in industrial wastewater management due to its superior coagulation properties, which enhance the removal of pollutants and contaminants.
Industries such as protective textiles, chemicals, and food processing are increasingly relying on PAC to treat their effluents before discharge or reuse, thereby reducing their environmental footprint. The growing emphasis on sustainable industrial practices and the need to meet environmental standards are key factors contributing to the expansion of the PAC market in this sector.
Rising Use in the Paper and Pulp Industry for Improved Processing
In the paper and pulp industry, Polyaluminium Chloride is gaining traction as an effective agent for improving the efficiency of the production process. PAC is used to enhance the retention of fibers and fillers, improve paper strength, and reduce the consumption of raw materials. Its application results in better product quality and lower operational costs, making it a preferred choice for manufacturers aiming to optimize their processes.
As the demand for paper products continues to grow, particularly in packaging and printing, the adoption of PAC in the pulp and paper chemicals industry is expected to increase, further driving the market's expansion.
Restraining Factors
Availability of Alternative Coagulants
The presence of alternative coagulants, such as ferric chloride, alum, and other advanced polymers, poses a significant restraining factor for the Polyaluminium Chloride (PAC) market. These alternatives offer comparable or, in some cases, superior performance in specific applications, particularly in industries where cost sensitivity or specific water chemistry considerations play a crucial role.
The availability of these alternatives allows end-users to switch to different coagulants based on factors like cost-effectiveness, ease of handling, or environmental impact, thereby limiting the growth potential of the PAC market. This competitive landscape pressures PAC manufacturers to continually innovate and improve their product offerings to maintain market share.
Environmental Concerns Related to Production and Disposal
Environmental concerns associated with the production and disposal of Polyaluminium Chloride are also key restraining factors for the market. The manufacturing process of PAC involves the use of raw materials and chemicals that can have adverse environmental impacts if not managed properly. Additionally, the disposal of sludge generated during water treatment using PAC poses environmental challenges, as it may contain residual aluminum and other contaminants.
With increasing regulatory scrutiny and growing awareness of environmental sustainability, industries and municipalities are seeking more eco-friendly alternatives or adopting stricter waste management practices. These concerns may hinder the widespread adoption of PAC, as organizations prioritize environmental responsibility and compliance with stringent regulations.
By Type
Liquid PAC dominates the market with a 60% share.
In 2023, Liquid PAC held a dominant market position in the By Type segment of the Polyaluminium Chloride Market, capturing more than a 60% share. Liquid polyaluminium chloride (PAC) is widely preferred due to its ease of application and cost-effectiveness in large-scale water treatment processes. Its liquid form allows for straightforward dosing and mixing, making it highly suitable for continuous processes in water treatment plants. The liquid variant's higher reactivity and solubility also enhance its performance in coagulation and flocculation, making it the go-to choice for municipal and industrial water treatment applications.The rising demand for efficient and reliable water treatment solutions, especially in developing regions, has significantly contributed to the dominance of liquid PAC in the market. Its adaptability across various applications further solidifies its leading position in the PAC market.
By Application
Water treatment is the leading application, accounting for 45% of the market. In 2023, Water Treatment held a dominant market position in the By Application segment of the Polyaluminium Chloride Market, capturing more than a 45% share. The water treatment segment continues to lead the market, driven by the growing need for clean and safe water in both municipal and industrial sectors. Polyaluminium chloride is a key coagulant used in the removal of suspended solids, organic matter, and other contaminants from water, making it essential in potable wastewater treatment service and industrial effluent treatment.
The increasing global focus on environmental sustainability and stringent regulations for water quality are propelling the demand for PAC in water treatment applications. This trend is expected to continue as water scarcity and pollution remain critical global issues, further reinforcing the segment's market dominance.
By Grade
High Basicity PAC represents 55% of the market by grade. In 2023, High Basicity PAC held a dominant market position in the By Grade segment of the Polyaluminium Chloride Market, capturing more than a 55% share. High basicity PAC is favored for its enhanced coagulation efficiency and ability to perform well across a wide pH range, making it ideal for challenging water treatment conditions. Its high charge density allows for better removal of turbidity and organic matter, reducing the need for additional chemicals and improving the overall cost-effectiveness of the water treatment process.
The superior performance of high basicity PAC in both municipal and industrial water treatment has led to its significant adoption, securing its leadership in the PAC market. As industries continue to seek efficient and environmentally friendly water treatment solutions, the demand for high basicity PAC is anticipated to grow, maintaining its dominant market share.
Key Market Segments
By Type
- Solid PAC (Powder, Flake)
- Liquid PAC
By Application
- Water Treatment
- Pulp & Paper
- Textile Industry
- Oil & Gas
- Cosmetics and Personal Care
By Grade
- High Basicity PAC
- Low Basicity PAC
Growth Opportunity
Development of Eco-Friendly and High-Purity Grades
One of the most promising opportunities for the Polyaluminium Chloride (PAC) market in 2024 lies in the development of eco-friendly and high-purity grades. As environmental regulations tighten globally, the demand for sustainable and less polluting coagulants is rising. Companies that can innovate and produce PAC with lower environmental impact, such as reducing waste during production or developing grades that result in less sludge, are poised to capture significant market share.
High-purity PAC grades are increasingly sought after in industries like electronics and pharmaceuticals, where the quality of water and chemical purity is paramount. This shift towards eco-friendly and high-purity products presents a substantial growth avenue for PAC manufacturers, enabling them to differentiate their offerings in a competitive market.
Expansion in Emerging Markets with Growing Industrial Activities
The expansion into emerging markets, particularly in Asia-Pacific, Latin America, and Africa, represents another key growth opportunity for the PAC market. These regions are witnessing rapid industrialization and urbanization, leading to increased demand for water treatment and industrial wastewater management solutions. As infrastructure projects and industrial activities proliferate, the need for effective and efficient water treatment chemicals like PAC will rise.
Companies that can establish a strong presence in these emerging markets, leveraging local partnerships and adapting to regional regulatory requirements, will benefit from the burgeoning demand. The combination of market expansion and product innovation positions the PAC market for robust growth in 2024, with significant opportunities for companies that strategically align with these trends.
Latest Trends
Use of Polyaluminium Chloride in the Oil and Gas Sector for Effluent Treatment
A notable trend in the Polyaluminium Chloride (PAC) market for 2024 is the increasing use of PAC in the oil and gas sector for effluent treatment. As the oil and gas industry faces stricter environmental regulations and public scrutiny, there is a growing need for efficient and cost-effective wastewater treatment solutions. PAC is gaining traction as a preferred coagulant in this sector due to its effectiveness in removing suspended solids, organic matter, and heavy metals from effluent streams.
The adoption of PAC in this industry is expected to rise as companies seek to comply with environmental standards and minimize their ecological footprint. This trend underscores the expanding application scope of PAC beyond traditional water treatment sectors, opening new avenues for market growth.
Adoption of Advanced Production Technologies to Reduce Environmental Impact
In response to the increasing focus on sustainability, 2024 will likely see a surge in the adoption of advanced production technologies in the PAC market. Manufacturers are investing in innovative processes that minimize the environmental impact of PAC production, such as reducing energy consumption, decreasing the use of hazardous raw materials, and improving waste management practices.
These advancements not only help companies meet stringent environmental regulations but also enhance their competitive edge by offering greener products. As industries and consumers alike prioritize sustainability, the PAC market is expected to evolve, with environmentally friendly production methods becoming a key differentiator in the market.
Regional Analysis
Asia Pacific holds a 40% share of the market.
In 2023, the Asia Pacific region held a dominant position in the Polyaluminium Chloride Market, capturing more than a 40% share. This dominance is primarily driven by the region's substantial demand for water treatment solutions, especially in countries like China and India, where rapid industrialization and urbanization have increased the need for effective wastewater management. The Asia Pacific's large industrial base, particularly in the manufacturing, textile, and chemical sectors, further fuels the demand for polyaluminium chloride (PAC) as a key coagulant in water treatment processes.
Government regulations and initiatives aimed at improving water quality standards in the region are significantly contributing to the growth of the PAC market. For instance, China's stringent policies on industrial wastewater treatment and India's growing focus on river and water body rejuvenation programs have led to increased adoption of PAC in water treatment plants across these countries. The Asia Pacific region's robust growth in various industries, coupled with its large population, ensures a continued demand for PAC, solidifying its leading market position.
Other regions like North America and Europe are also significant players in the PAC market, driven by their well-established water treatment infrastructure and stringent environmental regulations. However, their market shares remain lower compared to the Asia Pacific, reflecting the latter's rapid industrial expansion and increasing environmental focus. As a result, the Asia Pacific is expected to maintain its leading position in the global polyaluminium chloride market over the coming years.
Key Regions and Countries
North America
- US
- Canada
- Mexico
Western Europe
- Germany
- France
- The UK
- Spain
- Italy
- Portugal
- Ireland
- Austria
- Switzerland
- Benelux
- Nordic
- Rest of Western Europe
Eastern Europe
- Russia
- Poland
- The Czech Republic
- Greece
- Rest of Eastern Europe
APAC
- China
- Japan
- South Korea
- India
- Australia & New Zealand
- Indonesia
- Malaysia
- Philippines
- Singapore
- Thailand
- Vietnam
- Rest of APAC
Latin America
- Brazil
- Colombia
- Chile
- Argentina
- Costa Rica
- Rest of Latin America
Middle East & Africa
- Algeria
- Egypt
- Israel
- Kuwait
- Nigeria
- Saudi Arabia
- South Africa
- Turkey
- United Arab Emirates
- Rest of MEA
Key Players Analysis
In 2024, the global Polyaluminium Chloride (PAC) market is expected to see robust growth, driven by the increasing demand for water treatment solutions across industrial and municipal sectors. Key players such as GEO Specialty Chemicals, Inc. and Feralco AB are positioned to leverage their advanced product portfolios and extensive distribution networks to cater to the rising demand for efficient and cost-effective coagulants. Their focus on innovation and sustainable practices is likely to provide a competitive edge in the market.
Aditya Birla Chemicals (India) Limited and Grasim Industries Ltd., as part of the Aditya Birla Group, are expected to maintain a strong presence in the PAC market through their integrated production processes and significant market penetration in Asia Pacific, particularly in India. Their strategic expansions and investments in research and development will likely bolster their market share, addressing the growing needs of emerging economies.
Companies like Kemira Oyj and Chemtrade Logistics Inc. are anticipated to continue their dominance in North America and Europe, benefiting from stringent environmental regulations that drive the adoption of PAC in water treatment. These firms' commitment to high-quality standards and their ability to adapt to regulatory changes will play a crucial role in maintaining their leadership positions. Meanwhile, Asian manufacturers such as Shandong Hualu Chemical Co., Ltd. and Jiangxi New Nanyuan Chemical Co., Ltd. are expected to enhance their global footprint by expanding export capabilities and adopting competitive pricing strategies.
Market Key Players
- GEO Specialty Chemicals, Inc.
- Feralco AB
- Airedale Chemical
- USALCO LLC
- Aditya Birla Chemicals (India) Limited
- Grasim Industries Ltd.
- Kanoria Chemicals & Industries Limited
- Kemira Oyj
- Chemtrade Logistics Inc.
- Innophos Holdings, Inc.
- AkzoNobel N.V.
- Solvay S.A.
- Shandong Hualu Chemical Co., Ltd.
- Jiangxi New Nanyuan Chemical Co., Ltd.
- SUEZ Water Technologies & Solutions
Recent Development
- In March 2024, USALCO LLC announced the acquisition of a regional chemical manufacturer to enhance its production capabilities and expand its market presence by 20%.
- In January 2024, Kemira Oyj expanded its polyaluminium chloride production capacity by 25% at its European facility to meet growing demand in the water treatment sector.
Report Scope
Report Features Description Market Value (2023) USD 3.58 Bn Forecast Revenue (2033) USD 5.7 Bn CAGR (2024-2033) 4.9% Base Year for Estimation 2023 Historic Period 2018-2023 Forecast Period 2024-2033 Report Coverage Revenue Forecast, Market Dynamics, Competitive Landscape, Recent Developments Segments Covered Polyaluminium Chloride Market, By Type (Solid PAC, Liquid PAC), By Application (Water Treatment, Pulp & Paper, Textile Industry, Oil & Gas, Cosmetics and Personal Care), By Grade (High Basicity PAC, Low Basicity PAC) Regional Analysis North America - The US, Canada, & Mexico; Western Europe - Germany, France, The UK, Spain, Italy, Portugal, Ireland, Austria, Switzerland, Benelux, Nordic, & Rest of Western Europe; Eastern Europe - Russia, Poland, The Czech Republic, Greece, & Rest of Eastern Europe; APAC - China, Japan, South Korea, India, Australia & New Zealand, Indonesia, Malaysia, Philippines, Singapore, Thailand, Vietnam, & Rest of APAC; Latin America - Brazil, Colombia, Chile, Argentina, Costa Rica, & Rest of Latin America; Middle East & Africa - Algeria, Egypt, Israel, Kuwait, Nigeria, Saudi Arabia, South Africa, Turkey, United Arab Emirates, & Rest of MEA Competitive Landscape GEO Specialty Chemicals, Inc., Feralco AB, Airedale Chemical, USALCO LLC, Aditya Birla Chemicals (India) Limited, Grasim Industries Ltd., Kanoria Chemicals & Industries Limited, Kemira Oyj, Chemtrade Logistics Inc., Innophos Holdings, Inc., AkzoNobel N.V., Solvay S.A., Shandong Hualu Chemical Co., Ltd., Jiangxi New Nanyuan Chemical Co., Ltd., SUEZ Water Technologies & Solutions Customization Scope Customization for segments, region/country-level will be provided. Moreover, additional customization can be done based on the requirements. Purchase Options We have three licenses to opt for: Single User License, Multi-User License (Up to 5 Users), Corporate Use License (Unlimited User and Printable PDF) -
- 1. Executive Summary
- 1.1. Definition
- 1.2. Taxonomy
- 1.3. Research Scope
- 1.4. Key Analysis
- 1.5. Key Findings by Major Segments
- 1.6. Top strategies by Major Players
- 2. Global Polyaluminium Chloride Market Overview
- 2.1. Polyaluminium Chloride Market Dynamics
- 2.1.1. Drivers
- 2.1.2. Opportunities
- 2.1.3. Restraints
- 2.1.4. Challenges
- 2.2. Macro-economic Factors
- 2.3. Regulatory Framework
- 2.4. Market Investment Feasibility Index
- 2.5. PEST Analysis
- 2.6. PORTER’S Five Force Analysis
- 2.7. Drivers & Restraints Impact Analysis
- 2.8. Industry Chain Analysis
- 2.9. Cost Structure Analysis
- 2.10. Marketing Strategy
- 2.11. Russia-Ukraine War Impact Analysis
- 2.12. Opportunity Map Analysis
- 2.13. Market Competition Scenario Analysis
- 2.14. Product Life Cycle Analysis
- 2.15. Opportunity Orbits
- 2.16. Manufacturer Intensity Map
- 2.17. Major Companies sales by Value & Volume
- 2.1. Polyaluminium Chloride Market Dynamics
- 3. Global Polyaluminium Chloride Market Analysis, Opportunity and Forecast, 2016-2032
- 3.1. Global Polyaluminium Chloride Market Analysis, 2016-2021
- 3.2. Global Polyaluminium Chloride Market Opportunity and Forecast, 2023-2032
- 3.3. Global Polyaluminium Chloride Market Analysis, Opportunity and Forecast, By By Type, 2016-2032
- 3.3.1. Global Polyaluminium Chloride Market Analysis by By Type: Introduction
- 3.3.2. Market Size Absolute $ Opportunity Analysis and Forecast, By By Type, 2016-2032
- 3.3.3. Solid PAC
- 3.3.4. Liquid PAC
- 3.4. Global Polyaluminium Chloride Market Analysis, Opportunity and Forecast, By By Application, 2016-2032
- 3.4.1. Global Polyaluminium Chloride Market Analysis by By Application: Introduction
- 3.4.2. Market Size Absolute $ Opportunity Analysis and Forecast, By By Application, 2016-2032
- 3.4.3. Water Treatment
- 3.4.4. Pulp & Paper
- 3.4.5. Textile Industry
- 3.4.6. Oil & Gas
- 3.4.7. Cosmetics and Personal Care
- 3.5. Global Polyaluminium Chloride Market Analysis, Opportunity and Forecast, By By Grade, 2016-2032
- 3.5.1. Global Polyaluminium Chloride Market Analysis by By Grade: Introduction
- 3.5.2. Market Size Absolute $ Opportunity Analysis and Forecast, By By Grade, 2016-2032
- 3.5.3. High Basicity PAC
- 3.5.4. Low Basicity PAC
- 4. North America Polyaluminium Chloride Market Analysis, Opportunity and Forecast, 2016-2032
- 4.1. North America Polyaluminium Chloride Market Analysis, 2016-2021
- 4.2. North America Polyaluminium Chloride Market Opportunity and Forecast, 2023-2032
- 4.3. North America Polyaluminium Chloride Market Analysis, Opportunity and Forecast, By By Type, 2016-2032
- 4.3.1. North America Polyaluminium Chloride Market Analysis by By Type: Introduction
- 4.3.2. Market Size Absolute $ Opportunity Analysis and Forecast, By By Type, 2016-2032
- 4.3.3. Solid PAC
- 4.3.4. Liquid PAC
- 4.4. North America Polyaluminium Chloride Market Analysis, Opportunity and Forecast, By By Application, 2016-2032
- 4.4.1. North America Polyaluminium Chloride Market Analysis by By Application: Introduction
- 4.4.2. Market Size Absolute $ Opportunity Analysis and Forecast, By By Application, 2016-2032
- 4.4.3. Water Treatment
- 4.4.4. Pulp & Paper
- 4.4.5. Textile Industry
- 4.4.6. Oil & Gas
- 4.4.7. Cosmetics and Personal Care
- 4.5. North America Polyaluminium Chloride Market Analysis, Opportunity and Forecast, By By Grade, 2016-2032
- 4.5.1. North America Polyaluminium Chloride Market Analysis by By Grade: Introduction
- 4.5.2. Market Size Absolute $ Opportunity Analysis and Forecast, By By Grade, 2016-2032
- 4.5.3. High Basicity PAC
- 4.5.4. Low Basicity PAC
- 4.6. North America Polyaluminium Chloride Market Analysis, Opportunity and Forecast, By Country , 2016-2032
- 4.6.1. North America Polyaluminium Chloride Market Analysis by Country : Introduction
- 4.6.2. Market Size Absolute $ Opportunity Analysis and Forecast, Country , 2016-2032
- 4.6.2.1. The US
- 4.6.2.2. Canada
- 4.6.2.3. Mexico
- 5. Western Europe Polyaluminium Chloride Market Analysis, Opportunity and Forecast, 2016-2032
- 5.1. Western Europe Polyaluminium Chloride Market Analysis, 2016-2021
- 5.2. Western Europe Polyaluminium Chloride Market Opportunity and Forecast, 2023-2032
- 5.3. Western Europe Polyaluminium Chloride Market Analysis, Opportunity and Forecast, By By Type, 2016-2032
- 5.3.1. Western Europe Polyaluminium Chloride Market Analysis by By Type: Introduction
- 5.3.2. Market Size Absolute $ Opportunity Analysis and Forecast, By By Type, 2016-2032
- 5.3.3. Solid PAC
- 5.3.4. Liquid PAC
- 5.4. Western Europe Polyaluminium Chloride Market Analysis, Opportunity and Forecast, By By Application, 2016-2032
- 5.4.1. Western Europe Polyaluminium Chloride Market Analysis by By Application: Introduction
- 5.4.2. Market Size Absolute $ Opportunity Analysis and Forecast, By By Application, 2016-2032
- 5.4.3. Water Treatment
- 5.4.4. Pulp & Paper
- 5.4.5. Textile Industry
- 5.4.6. Oil & Gas
- 5.4.7. Cosmetics and Personal Care
- 5.5. Western Europe Polyaluminium Chloride Market Analysis, Opportunity and Forecast, By By Grade, 2016-2032
- 5.5.1. Western Europe Polyaluminium Chloride Market Analysis by By Grade: Introduction
- 5.5.2. Market Size Absolute $ Opportunity Analysis and Forecast, By By Grade, 2016-2032
- 5.5.3. High Basicity PAC
- 5.5.4. Low Basicity PAC
- 5.6. Western Europe Polyaluminium Chloride Market Analysis, Opportunity and Forecast, By Country , 2016-2032
- 5.6.1. Western Europe Polyaluminium Chloride Market Analysis by Country : Introduction
- 5.6.2. Market Size Absolute $ Opportunity Analysis and Forecast, Country , 2016-2032
- 5.6.2.1. Germany
- 5.6.2.2. France
- 5.6.2.3. The UK
- 5.6.2.4. Spain
- 5.6.2.5. Italy
- 5.6.2.6. Portugal
- 5.6.2.7. Ireland
- 5.6.2.8. Austria
- 5.6.2.9. Switzerland
- 5.6.2.10. Benelux
- 5.6.2.11. Nordic
- 5.6.2.12. Rest of Western Europe
- 6. Eastern Europe Polyaluminium Chloride Market Analysis, Opportunity and Forecast, 2016-2032
- 6.1. Eastern Europe Polyaluminium Chloride Market Analysis, 2016-2021
- 6.2. Eastern Europe Polyaluminium Chloride Market Opportunity and Forecast, 2023-2032
- 6.3. Eastern Europe Polyaluminium Chloride Market Analysis, Opportunity and Forecast, By By Type, 2016-2032
- 6.3.1. Eastern Europe Polyaluminium Chloride Market Analysis by By Type: Introduction
- 6.3.2. Market Size Absolute $ Opportunity Analysis and Forecast, By By Type, 2016-2032
- 6.3.3. Solid PAC
- 6.3.4. Liquid PAC
- 6.4. Eastern Europe Polyaluminium Chloride Market Analysis, Opportunity and Forecast, By By Application, 2016-2032
- 6.4.1. Eastern Europe Polyaluminium Chloride Market Analysis by By Application: Introduction
- 6.4.2. Market Size Absolute $ Opportunity Analysis and Forecast, By By Application, 2016-2032
- 6.4.3. Water Treatment
- 6.4.4. Pulp & Paper
- 6.4.5. Textile Industry
- 6.4.6. Oil & Gas
- 6.4.7. Cosmetics and Personal Care
- 6.5. Eastern Europe Polyaluminium Chloride Market Analysis, Opportunity and Forecast, By By Grade, 2016-2032
- 6.5.1. Eastern Europe Polyaluminium Chloride Market Analysis by By Grade: Introduction
- 6.5.2. Market Size Absolute $ Opportunity Analysis and Forecast, By By Grade, 2016-2032
- 6.5.3. High Basicity PAC
- 6.5.4. Low Basicity PAC
- 6.6. Eastern Europe Polyaluminium Chloride Market Analysis, Opportunity and Forecast, By Country , 2016-2032
- 6.6.1. Eastern Europe Polyaluminium Chloride Market Analysis by Country : Introduction
- 6.6.2. Market Size Absolute $ Opportunity Analysis and Forecast, Country , 2016-2032
- 6.6.2.1. Russia
- 6.6.2.2. Poland
- 6.6.2.3. The Czech Republic
- 6.6.2.4. Greece
- 6.6.2.5. Rest of Eastern Europe
- 7. APAC Polyaluminium Chloride Market Analysis, Opportunity and Forecast, 2016-2032
- 7.1. APAC Polyaluminium Chloride Market Analysis, 2016-2021
- 7.2. APAC Polyaluminium Chloride Market Opportunity and Forecast, 2023-2032
- 7.3. APAC Polyaluminium Chloride Market Analysis, Opportunity and Forecast, By By Type, 2016-2032
- 7.3.1. APAC Polyaluminium Chloride Market Analysis by By Type: Introduction
- 7.3.2. Market Size Absolute $ Opportunity Analysis and Forecast, By By Type, 2016-2032
- 7.3.3. Solid PAC
- 7.3.4. Liquid PAC
- 7.4. APAC Polyaluminium Chloride Market Analysis, Opportunity and Forecast, By By Application, 2016-2032
- 7.4.1. APAC Polyaluminium Chloride Market Analysis by By Application: Introduction
- 7.4.2. Market Size Absolute $ Opportunity Analysis and Forecast, By By Application, 2016-2032
- 7.4.3. Water Treatment
- 7.4.4. Pulp & Paper
- 7.4.5. Textile Industry
- 7.4.6. Oil & Gas
- 7.4.7. Cosmetics and Personal Care
- 7.5. APAC Polyaluminium Chloride Market Analysis, Opportunity and Forecast, By By Grade, 2016-2032
- 7.5.1. APAC Polyaluminium Chloride Market Analysis by By Grade: Introduction
- 7.5.2. Market Size Absolute $ Opportunity Analysis and Forecast, By By Grade, 2016-2032
- 7.5.3. High Basicity PAC
- 7.5.4. Low Basicity PAC
- 7.6. APAC Polyaluminium Chloride Market Analysis, Opportunity and Forecast, By Country , 2016-2032
- 7.6.1. APAC Polyaluminium Chloride Market Analysis by Country : Introduction
- 7.6.2. Market Size Absolute $ Opportunity Analysis and Forecast, Country , 2016-2032
- 7.6.2.1. China
- 7.6.2.2. Japan
- 7.6.2.3. South Korea
- 7.6.2.4. India
- 7.6.2.5. Australia & New Zeland
- 7.6.2.6. Indonesia
- 7.6.2.7. Malaysia
- 7.6.2.8. Philippines
- 7.6.2.9. Singapore
- 7.6.2.10. Thailand
- 7.6.2.11. Vietnam
- 7.6.2.12. Rest of APAC
- 8. Latin America Polyaluminium Chloride Market Analysis, Opportunity and Forecast, 2016-2032
- 8.1. Latin America Polyaluminium Chloride Market Analysis, 2016-2021
- 8.2. Latin America Polyaluminium Chloride Market Opportunity and Forecast, 2023-2032
- 8.3. Latin America Polyaluminium Chloride Market Analysis, Opportunity and Forecast, By By Type, 2016-2032
- 8.3.1. Latin America Polyaluminium Chloride Market Analysis by By Type: Introduction
- 8.3.2. Market Size Absolute $ Opportunity Analysis and Forecast, By By Type, 2016-2032
- 8.3.3. Solid PAC
- 8.3.4. Liquid PAC
- 8.4. Latin America Polyaluminium Chloride Market Analysis, Opportunity and Forecast, By By Application, 2016-2032
- 8.4.1. Latin America Polyaluminium Chloride Market Analysis by By Application: Introduction
- 8.4.2. Market Size Absolute $ Opportunity Analysis and Forecast, By By Application, 2016-2032
- 8.4.3. Water Treatment
- 8.4.4. Pulp & Paper
- 8.4.5. Textile Industry
- 8.4.6. Oil & Gas
- 8.4.7. Cosmetics and Personal Care
- 8.5. Latin America Polyaluminium Chloride Market Analysis, Opportunity and Forecast, By By Grade, 2016-2032
- 8.5.1. Latin America Polyaluminium Chloride Market Analysis by By Grade: Introduction
- 8.5.2. Market Size Absolute $ Opportunity Analysis and Forecast, By By Grade, 2016-2032
- 8.5.3. High Basicity PAC
- 8.5.4. Low Basicity PAC
- 8.6. Latin America Polyaluminium Chloride Market Analysis, Opportunity and Forecast, By Country , 2016-2032
- 8.6.1. Latin America Polyaluminium Chloride Market Analysis by Country : Introduction
- 8.6.2. Market Size Absolute $ Opportunity Analysis and Forecast, Country , 2016-2032
- 8.6.2.1. Brazil
- 8.6.2.2. Colombia
- 8.6.2.3. Chile
- 8.6.2.4. Argentina
- 8.6.2.5. Costa Rica
- 8.6.2.6. Rest of Latin America
- 9. Middle East & Africa Polyaluminium Chloride Market Analysis, Opportunity and Forecast, 2016-2032
- 9.1. Middle East & Africa Polyaluminium Chloride Market Analysis, 2016-2021
- 9.2. Middle East & Africa Polyaluminium Chloride Market Opportunity and Forecast, 2023-2032
- 9.3. Middle East & Africa Polyaluminium Chloride Market Analysis, Opportunity and Forecast, By By Type, 2016-2032
- 9.3.1. Middle East & Africa Polyaluminium Chloride Market Analysis by By Type: Introduction
- 9.3.2. Market Size Absolute $ Opportunity Analysis and Forecast, By By Type, 2016-2032
- 9.3.3. Solid PAC
- 9.3.4. Liquid PAC
- 9.4. Middle East & Africa Polyaluminium Chloride Market Analysis, Opportunity and Forecast, By By Application, 2016-2032
- 9.4.1. Middle East & Africa Polyaluminium Chloride Market Analysis by By Application: Introduction
- 9.4.2. Market Size Absolute $ Opportunity Analysis and Forecast, By By Application, 2016-2032
- 9.4.3. Water Treatment
- 9.4.4. Pulp & Paper
- 9.4.5. Textile Industry
- 9.4.6. Oil & Gas
- 9.4.7. Cosmetics and Personal Care
- 9.5. Middle East & Africa Polyaluminium Chloride Market Analysis, Opportunity and Forecast, By By Grade, 2016-2032
- 9.5.1. Middle East & Africa Polyaluminium Chloride Market Analysis by By Grade: Introduction
- 9.5.2. Market Size Absolute $ Opportunity Analysis and Forecast, By By Grade, 2016-2032
- 9.5.3. High Basicity PAC
- 9.5.4. Low Basicity PAC
- 9.6. Middle East & Africa Polyaluminium Chloride Market Analysis, Opportunity and Forecast, By Country , 2016-2032
- 9.6.1. Middle East & Africa Polyaluminium Chloride Market Analysis by Country : Introduction
- 9.6.2. Market Size Absolute $ Opportunity Analysis and Forecast, Country , 2016-2032
- 9.6.2.1. Algeria
- 9.6.2.2. Egypt
- 9.6.2.3. Israel
- 9.6.2.4. Kuwait
- 9.6.2.5. Nigeria
- 9.6.2.6. Saudi Arabia
- 9.6.2.7. South Africa
- 9.6.2.8. Turkey
- 9.6.2.9. The UAE
- 9.6.2.10. Rest of MEA
- 10. Global Polyaluminium Chloride Market Analysis, Opportunity and Forecast, By Region , 2016-2032
- 10.1. Global Polyaluminium Chloride Market Analysis by Region : Introduction
- 10.2. Market Size Absolute $ Opportunity Analysis and Forecast, By Region , 2016-2032
- 10.2.1. North America
- 10.2.2. Western Europe
- 10.2.3. Eastern Europe
- 10.2.4. APAC
- 10.2.5. Latin America
- 10.2.6. Middle East & Africa
- 11. Global Polyaluminium Chloride Market Competitive Landscape, Market Share Analysis, and Company Profiles
- 11.1. Market Share Analysis
- 11.2. Company Profiles
- 11.3. GEO Specialty Chemicals, Inc.
- 11.3.1. Company Overview
- 11.3.2. Financial Highlights
- 11.3.3. Product Portfolio
- 11.3.4. SWOT Analysis
- 11.3.5. Key Strategies and Developments
- 11.4. Feralco AB
- 11.4.1. Company Overview
- 11.4.2. Financial Highlights
- 11.4.3. Product Portfolio
- 11.4.4. SWOT Analysis
- 11.4.5. Key Strategies and Developments
- 11.5. Airedale Chemical
- 11.5.1. Company Overview
- 11.5.2. Financial Highlights
- 11.5.3. Product Portfolio
- 11.5.4. SWOT Analysis
- 11.5.5. Key Strategies and Developments
- 11.6. USALCO LLC
- 11.6.1. Company Overview
- 11.6.2. Financial Highlights
- 11.6.3. Product Portfolio
- 11.6.4. SWOT Analysis
- 11.6.5. Key Strategies and Developments
- 11.7. Aditya Birla Chemicals (India) Limited
- 11.7.1. Company Overview
- 11.7.2. Financial Highlights
- 11.7.3. Product Portfolio
- 11.7.4. SWOT Analysis
- 11.7.5. Key Strategies and Developments
- 11.8. Grasim Industries Ltd.
- 11.8.1. Company Overview
- 11.8.2. Financial Highlights
- 11.8.3. Product Portfolio
- 11.8.4. SWOT Analysis
- 11.8.5. Key Strategies and Developments
- 11.9. Kanoria Chemicals & Industries Limited
- 11.9.1. Company Overview
- 11.9.2. Financial Highlights
- 11.9.3. Product Portfolio
- 11.9.4. SWOT Analysis
- 11.9.5. Key Strategies and Developments
- 11.10. Kemira Oyj
- 11.10.1. Company Overview
- 11.10.2. Financial Highlights
- 11.10.3. Product Portfolio
- 11.10.4. SWOT Analysis
- 11.10.5. Key Strategies and Developments
- 11.11. Chemtrade Logistics Inc.
- 11.11.1. Company Overview
- 11.11.2. Financial Highlights
- 11.11.3. Product Portfolio
- 11.11.4. SWOT Analysis
- 11.11.5. Key Strategies and Developments
- 11.12. Innophos Holdings, Inc.
- 11.12.1. Company Overview
- 11.12.2. Financial Highlights
- 11.12.3. Product Portfolio
- 11.12.4. SWOT Analysis
- 11.12.5. Key Strategies and Developments
- 11.13.1. Company Overview
- 11.13.2. Financial Highlights
- 11.13.3. Product Portfolio
- 11.13.4. SWOT Analysis
- 11.13.5. Key Strategies and Developments
- 11.14. AkzoNobel N.V.
- 11.14.1. Company Overview
- 11.14.2. Financial Highlights
- 11.14.3. Product Portfolio
- 11.14.4. SWOT Analysis
- 11.14.5. Key Strategies and Developments
- 11.15. Shandong Hualu Chemical Co., Ltd.
- 11.15.1. Company Overview
- 11.15.2. Financial Highlights
- 11.15.3. Product Portfolio
- 11.15.4. SWOT Analysis
- 11.15.5. Key Strategies and Developments
- 11.16. Jiangxi New Nanyuan Chemical Co., Ltd.
- 11.16.1. Company Overview
- 11.16.2. Financial Highlights
- 11.16.3. Product Portfolio
- 11.16.4. SWOT Analysis
- 11.16.5. Key Strategies and Developments
- 11.17. SUEZ Water Technologies & Solutions
- 11.17.1. Company Overview
- 11.17.2. Financial Highlights
- 11.17.3. Product Portfolio
- 11.17.4. SWOT Analysis
- 11.17.5. Key Strategies and Developments
- 12. Assumptions and Acronyms
- 13. Research Methodology
- 14. Contact
- 1. Executive Summary
-
- GEO Specialty Chemicals, Inc.
- Feralco AB
- Airedale Chemical
- USALCO LLC
- Aditya Birla Chemicals (India) Limited
- Grasim Industries Ltd.
- Kanoria Chemicals & Industries Limited
- Kemira Oyj
- Chemtrade Logistics Inc.
- Innophos Holdings, Inc.
- AkzoNobel N.V.
- Solvay S.A.
- Shandong Hualu Chemical Co., Ltd.
- Jiangxi New Nanyuan Chemical Co., Ltd.
- SUEZ Water Technologies & Solutions
Our Clients


View Our Licence Options
