
On Board Diagnostics (Obd) After Market By Components(Empennage, Wings, Fuselage, Nacelle & Pylon, Nose, Others), By Application(Fleet Management, Consumer Telematics, Car Sharing, Used-based Insurance), By Platform(Fixed-Wing Aircraft(Military, Commercial, General Aviation Aircraft, Business Jet), Rotary-Wing Aircraft(Military Helicopters, Commercial Helicopters, UAVs)), By End-User(OEM, Aftermarket), By Region And Companies - Industry Segment Outlook, Market Assessment, Competition Scenario, Trends, And Forecast 2024-2033
-
44280
-
April 2024
-
300
-


-
This report was compiled by Kalyani Khudsange Kalyani Khudsange is a Research Analyst at Prudour Pvt. Ltd. with 2.5 years of experience in market research and a strong technical background in Chemical Engineering and manufacturing. Correspondence Sr. Research Analyst Linkedin | Detailed Market research Methodology Our methodology involves a mix of primary research, including interviews with leading mental health experts, and secondary research from reputable medical journals and databases. View Detailed Methodology Page
-
Quick Navigation
Report Overview
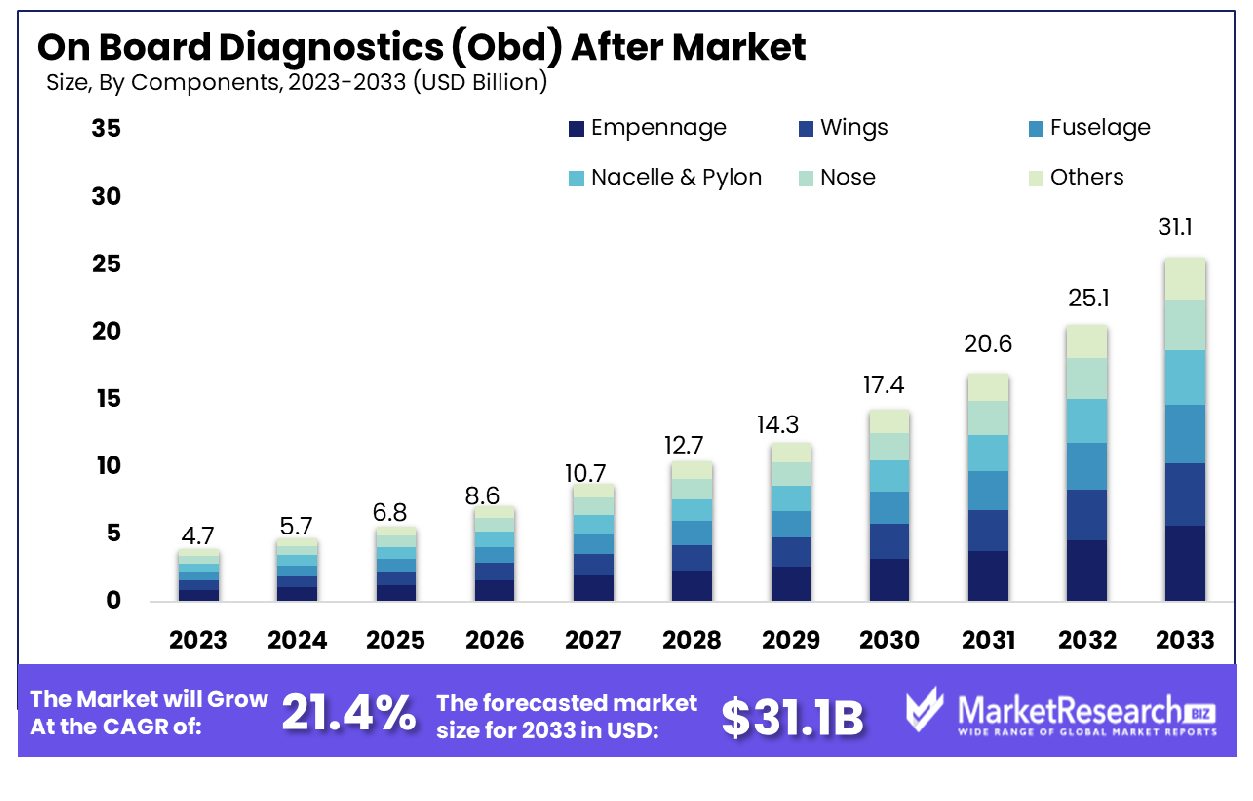
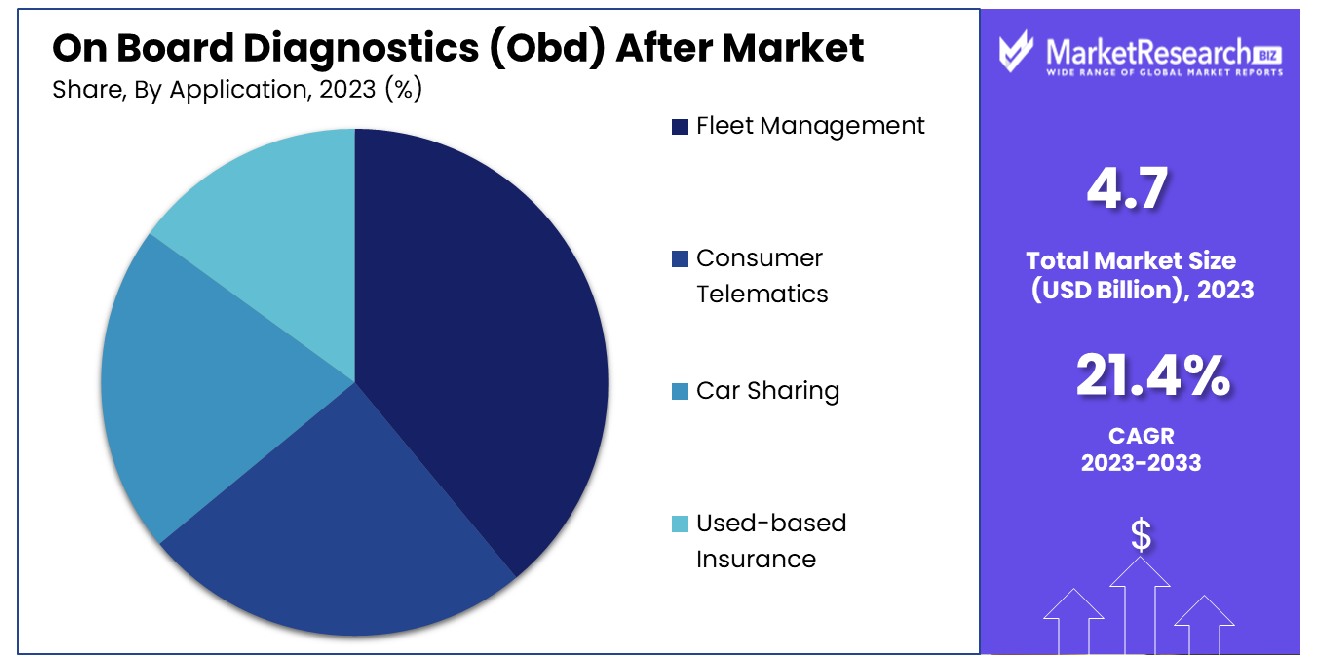
The On Board Diagnostics (Obd) After Market was valued at USD 4.7 billion in 2023. It is expected to reach USD 31.1 billion by 2033, with a CAGR of 21.4% during the forecast period from 2024 to 2033.
The surge in demand for modern vehicles and its diagnostics are key driving factors for the on-board diagnostic after market expansion. The on-board diagnostics are a special type of system that is executed in every vehicle engine component. It is an electronic system that helps keep the emission levels of engines in check by supervising the quality of the performance index of several engine elements. It also helps monitor the big fault in a component which can cause failure or damage the whole engine. It can also take data from different current sensors and regulate the fuel injectors to give better performances.
OBD which is also known as on-board diagnostics has several elements like sensors, actuators, and electronic control units. All these parts work in perfect synchronization to sense any type of failure in the system and supervise the emission levels on different components of the engine. The electronic control unit is the main part of the system. It gathers the information from different current sensors, for example, oxygen sensors, and examines the information. According to that examination, it regulates the actuators like the fuel injectors to provide better quality of performance.
The on-board diagnostics after-market has witnessed substantial growth in the last few decades. It comprises developing and distributing solutions that focus on enhancing and increasing the functionality of onboard diagnostic systems found in modern vehicles. Previously, such types of systems were executed by regulatory needs to control emissions and secure safety. But, they have now turned into refined on-board computer systems within contemporary vehicles. They have key responsibilities that comprise continuous supervision and recording of important information regarding automobile performance. It also comprises examining factors like engine health, fuel efficacy, emission standard levels, and other different parameters to secure better functioning.
Moreover, customers are now getting more attracted to personalized automobiles providing a major catalyst for the OBD aftermarket expansion. Many car owners are continuously searching for techniques to enhance their vehicle performance and whole driving encounters The OBD aftermarket solutions provide better revenue to get these aspirations by permitting customers to enhance their engine setting, supervise real-time information, and undertake advanced changes while ensuring compliance with regulatory measures. The demand for the OBD aftermarket will gradually increase due to its high requirement in the automobile industry which will help in market expansion during the forecasted period.
Key Takeaways
- Market Growth: The On Board Diagnostics (Obd) After Market was valued at USD 4.7 billion in 2023. It is expected to reach USD 31.1 billion by 2033, with a CAGR of 21.4% during the forecast period from 2024 to 2033.
- By Components: Empennage components are crucial for aircraft stability and control efficiency.
- By Application: Fleet management application enhances operational safety and reduces maintenance costs.
- By Platform: Fixed-wing aircraft platform dominates due to versatility and range capabilities.
- By End-User: OEM end-users significantly influence innovation in aircraft component manufacturing.
- Regional Dominance: North America holds a 46.4% share in the OBD aftermarket.
- Growth Opportunity: In 2023, the OBD aftermarket is set to grow, driven by stricter emission regulations and AI/ML advancements, enhancing emissions monitoring, predictive maintenance, and real-time diagnostics for regulatory compliance and customer value.
Driving factors
Expansion of the Automotive Sector
The burgeoning growth of the automotive industry is a pivotal driver for the expansion of the On-Board Diagnostics (OBD) aftermarket. As the global vehicle population escalates, with millions of new vehicles hitting the roads annually, the demand for aftermarket OBD products and services experiences a corresponding upsurge. This growth is propelled not just by the sheer volume of vehicles but also by the diversification of vehicle types, including electric and hybrid models, which require specialized diagnostic tools.
The OBD aftermarket thrives on this proliferation, offering a wide array of diagnostic, monitoring, and optimization tools tailored for an increasingly varied automotive landscape. Consequently, the aftermarket for OBD devices is witnessing significant growth, capitalizing on the expanding base of vehicles that necessitate regular diagnostics and maintenance.
Imperative for Emissions Control
Emissions control stands as a critical factor bolstering the OBD aftermarket. Initially conceived to monitor and report on a vehicle's emission output, OBD systems have become indispensable in the global drive toward environmental sustainability. By enabling early detection of malfunctions that could lead to increased emissions, OBD technologies play a crucial role in ensuring vehicles adhere to stringent emission standards.
This environmental imperative has not only mandated the integration of OBD systems in vehicles but has also fueled innovation and demand in the aftermarket. Manufacturers and service providers are continuously enhancing their offerings with advanced diagnostics and emissions monitoring tools, thereby ensuring compliance and contributing to environmental conservation efforts.
Advancements in Technology and Vehicle Performance
Technological advancements and the pursuit of enhanced vehicle performance are key contributors to the growth of the OBD aftermarket. Innovations in diagnostics technologies have transformed OBD systems into comprehensive vehicle management tools that extend beyond traditional diagnostics. Today’s OBD devices offer advanced features such as real-time data logging, predictive maintenance insights, and performance tuning, catering to the evolving needs of consumers who demand greater control over their vehicle’s performance and health.
This shift towards intelligent diagnostics and performance optimization tools reflects a broader trend in automotive technology, where connectivity, data analytics, and user-centric solutions drive market evolution. As vehicles become more sophisticated, the OBD aftermarket is poised for further growth, propelled by the continuous demand for innovative solutions that enhance vehicle efficiency, safety, and performance.
Restraining Factors
Economic Barriers Imposed by High Costs
The high cost of On-Board Diagnostics (OBD) devices constitutes a significant economic barrier, constraining the expansion of the OBD aftermarket. Advanced OBD devices, which offer comprehensive diagnostic features and connectivity options, often come with a premium price tag. This pricing strategy can deter a considerable segment of potential consumers, particularly those from middle to low-income brackets or small-scale automotive service providers, from adopting OBD technology.
As a result, the market's growth potential is curtailed, with cost-sensitive consumers either postponing purchases or opting for basic diagnostic tools with limited functionalities. This price sensitivity underscores the need for cost-effective solutions that can democratize access to advanced vehicle diagnostics, thereby fostering broader market penetration and growth.
The Challenge of Consumer Awareness and Knowledge
The proliferation of the OBD aftermarket is further challenged by a pervasive lack of awareness and understanding among consumers. Despite the critical role OBD systems play in vehicle maintenance, emissions control, and performance optimization, a significant proportion of vehicle owners remain unaware of these benefits. This gap in knowledge limits consumer engagement with OBD technologies and inhibits the market's expansion.
The situation is compounded by the technical complexity of OBD systems, which can intimidate non-technical consumers, discouraging them from exploring and investing in OBD solutions. Elevating consumer awareness through education and straightforward marketing strategies could mitigate this restraint, unlocking new growth avenues for the OBD aftermarket by empowering consumers with the knowledge to leverage OBD technologies for enhanced vehicle management and performance.
By Components Analysis
Empennage components are essential for aircraft stability, influencing design, performance, and aerodynamic efficiency significantly.
In 2023, Empennage held a dominant market position in the "By Components" segment of the On-Board Diagnostics (OBD) Aftermarket, indicating a pivotal shift in market dynamics. This segment, encompassing crucial components such as Empennage, Wings, Fuselage, Nacelle & Pylon, Nose, and Others, has been instrumental in defining the contours of the market's competitive landscape. The prominence of Empennage within this array signifies a targeted consumer preference and technological advancement tailored to enhance aerodynamic efficiency and maintenance diagnostics.
The strategic positioning of Empennage, characterized by its integral role in stability and control, underscores its criticality in OBD applications. This preference is not only indicative of the segment's evolution but also highlights the advancements in material science and current sensor technology, facilitating superior diagnostics and performance analytics. The aftermarket's inclination towards Empennage, alongside other components, mirrors the overarching industry trends focused on sustainability, operational efficiency, and enhanced safety protocols.
Moreover, the integration of sophisticated OBD systems within these components has propelled market growth, driven by regulatory mandates for emission controls and consumer demand for optimized fuel efficiency and vehicle longevity. The data analytics and predictive maintenance capabilities embedded in these systems underscore the shift towards data-driven decision-making and proactive maintenance strategies.
By Application Analysis
Fleet management applications optimize operational efficiency, reduce costs, and enhance safety in aviation operations.
In 2023, Fleet Management segment held a dominant market position in the "By Application" segment of the On-Board Diagnostics (OBD) Aftermarket, showcasing a robust trajectory in the integration of advanced diagnostics solutions across commercial operations. This segment, comprising Fleet Management, Consumer Telematics, Car Sharing, and Usage-based Insurance, underscores the diverse application of OBD systems beyond traditional vehicle diagnostics, extending into strategic business operations and consumer services.
The ascendancy of the Fleet Management segment within this context is attributed to the increasing demand for operational efficiencies, cost reduction, and enhanced regulatory compliance among commercial fleet operators. The adoption of OBD systems in fleet management not only facilitates real-time remote vehicle diagnostics and preventive maintenance but also enables optimized route planning, fuel management, and driver behavior monitoring, thereby contributing to significant operational savings and sustainability goals.
The strategic leverage of OBD data in Fleet Management exemplifies the segment's capacity to transform vehicle diagnostics into actionable insights, fostering a data-driven approach to fleet operations. This evolution reflects a broader market trend towards the integration of IoT and analytics technologies in automotive applications, driving improvements in vehicle safety, efficiency, and connectivity.
By Platform Analysis
Fixed-wing aircraft platforms, known for their efficiency and range, dominate commercial and military aviation.
In 2023, Fixed-Wing Aircraft held a dominant market position in the "By Platform" segment of the On-Board Diagnostics (OBD) Aftermarket, highlighting the sector's pivotal role in advancing diagnostics and maintenance technologies. This segment, which includes Fixed-Wing Aircraft across Military, Commercial, General Aviation, and Business Jet categories, alongside Rotary-Wing Aircraft such as Military Helicopters, Commercial Helicopters, and UAVs, showcases the diverse applicability and critical importance of OBD systems in aviation.
The preeminence of Fixed-Wing Aircraft in this landscape is primarily driven by the extensive use of these platforms across various sectors. The military sector, for example, leverages advanced OBD systems for enhanced mission readiness and operational safety, whereas the commercial aviation industry utilizes these systems to improve fleet reliability and reduce downtime, directly impacting profitability and passenger satisfaction. Similarly, General Aviation and Business Jets benefit from OBD technologies through personalized maintenance schedules and operational efficiency, optimizing performance and extending aircraft lifespans.
The integration of sophisticated OBD systems in Fixed-Wing Aircraft facilitates real-time data analytics, predictive maintenance, and streamlined regulatory compliance, reflecting the sector's adaptation to evolving technological landscapes. This has not only enhanced safety and efficiency but also contributed to environmental sustainability by optimizing fuel consumption and reducing emissions.
By End-User Analysis
Original Equipment Manufacturers (OEMs) rely on advanced technologies to meet evolving aerospace industry standards.
In 2023, Original Equipment Manufacturers (OEM) held a dominant market position in the "By End-User" segment of the On-Board Diagnostics (OBD) Aftermarket, underscoring the strategic significance of OEMs in the proliferation and integration of advanced diagnostic systems. This segment, bifurcated into OEM and Aftermarket, highlights the evolving dynamics between manufacturer-installed systems and aftermarket solutions, with OEMs leading the charge in innovation and market penetration.
The leadership of OEMs in this arena can be attributed to their intrinsic capacity to integrate OBD systems during the manufacturing process, ensuring seamless compatibility and operational efficiency from the outset. This advantage not only enhances vehicle performance and safety but also aligns with regulatory standards, offering consumers a level of reliability and sophistication that aftermarket solutions strive to match.
Furthermore, the dominance of OEMs is bolstered by consumer preference for brand consistency and the warranty benefits associated with OEM-installed diagnostic systems. The trust in OEM-provided technologies extends beyond mere functionality, encompassing the assurance of quality, longevity, and compliance with stringent emissions and safety regulations.
Key Market Segments
By Components
- Empennage
- Wings
- Fuselage
- Nacelle & Pylon
- Nose
- Others
By Application
- Fleet Management
- Consumer Telematics
- Car Sharing
- Used-based Insurance
By Platform
Fixed-Wing Aircraft
- Military
- Commercial
- General Aviation Aircraft
- Business Jet
Rotary-Wing Aircraft
- Military Helicopters
- Commercial Helicopters
- UAVs
By End-User
- OEM
- Aftermarket
Growth Opportunity
Growing Emphasis on Emission Regulations
In 2023, the global On-Board Diagnostics (OBD) aftermarket is poised for expansion, largely driven by the tightening of emission regulations across the globe. The emphasis on reducing vehicular emissions and adhering to stringent regulatory mandates has catalyzed the demand for advanced OBD systems. These systems, designed to monitor the performance of the engine and other vital components, play a crucial role in ensuring vehicles comply with emission standards.
The aftermarket sector, thus, finds substantial growth opportunities in developing solutions for real-time emissions monitoring and reporting. By equipping vehicles with the capability to not only detect but also report emissions data, aftermarket players are instrumental in enabling compliance with environmental regulations. This focus on sustainability and regulatory compliance is expected to continue driving the market forward, as manufacturers and consumers alike seek efficient and reliable means to monitor and reduce the environmental impact of vehicular emissions.
Advancements in Artificial Intelligence (AI) and Machine Learning (ML)
The integration of Artificial Intelligence (AI) and Machine Learning (ML) technologies into OBD systems represents another significant growth frontier for the aftermarket sector in 2023. By harnessing AI and ML, aftermarket solutions are evolving from mere diagnostic tools to sophisticated systems capable of predictive maintenance and real-time fault detection. This technological advancement not only enhances the functionality of OBD systems but also adds remarkable value for customers.
Predictive maintenance, powered by AI, allows for the early detection of potential issues, reducing downtime and maintenance costs. Furthermore, real-time fault detection and automated diagnostics streamline the troubleshooting process, enabling quicker and more accurate repairs. The infusion of AI and ML into OBD systems marks a transformation in vehicle maintenance and repair, offering a more proactive and predictive approach. As these technologies continue to advance, their integration into OBD aftermarket solutions is expected to drive significant market growth, presenting lucrative opportunities for innovation and development in the sector.
Latest Trends
Wireless Connectivity Advancements
The global On-Board Diagnostics (OBD) aftermarket is experiencing a significant transformation in 2023, largely attributed to advancements in wireless connectivity. The integration of technologies such as Bluetooth and Wi-Fi into aftermarket OBD devices has marked a pivotal shift in how vehicle data is accessed and managed. This enhancement in connectivity facilitates seamless interaction between OBD devices and smartphones, tablets, or other smart devices, thus significantly elevating user convenience.
Users can now effortlessly monitor their vehicle's health and performance in real-time, without the need for physical cables or specialized equipment. This trend not only simplifies the diagnostic process but also opens up new avenues for application developers to create innovative, user-friendly applications that interact with OBD systems, further driving the market's growth.
Cloud-Based Diagnostics Solutions
Another trend shaping the OBD aftermarket landscape in 2023 is the adoption of cloud-based diagnostic solutions. These platforms revolutionize vehicle diagnostics by enabling remote access to a wealth of vehicle data, facilitating real-time monitoring, and sophisticated analysis capabilities. For businesses involved in fleet management, this trend offers the ability to oversee and optimize the performance of multiple vehicles from a central location, enhancing operational efficiency.
Furthermore, cloud-based solutions support predictive maintenance strategies, allowing for the identification and resolution of potential vehicle issues before they escalate into more serious problems. This proactive approach not only reduces downtime but also extends the lifespan of vehicles, presenting a significant value proposition for vehicle owners and fleet managers alike. The move towards cloud-based diagnostics underscores the aftermarket's shift towards more connected, efficient, and intelligent vehicle management solutions.
Regional Analysis
The OBD aftermarket in North America commands a substantial 46.4% market share in 2023.
The On-Board Diagnostics (OBD) aftermarket is witnessing significant regional disparities in terms of growth, technological adoption, and market dynamics. In North America, the region's dominance is pronounced, holding a substantial 46.4% share of the global market. This can be attributed to stringent emission control norms, a high level of consumer awareness regarding vehicle health, and the presence of key industry players. Furthermore, the adoption of advanced telematics and connected vehicle technologies in the U.S. and Canada significantly propels the demand for OBD aftermarket services and products.
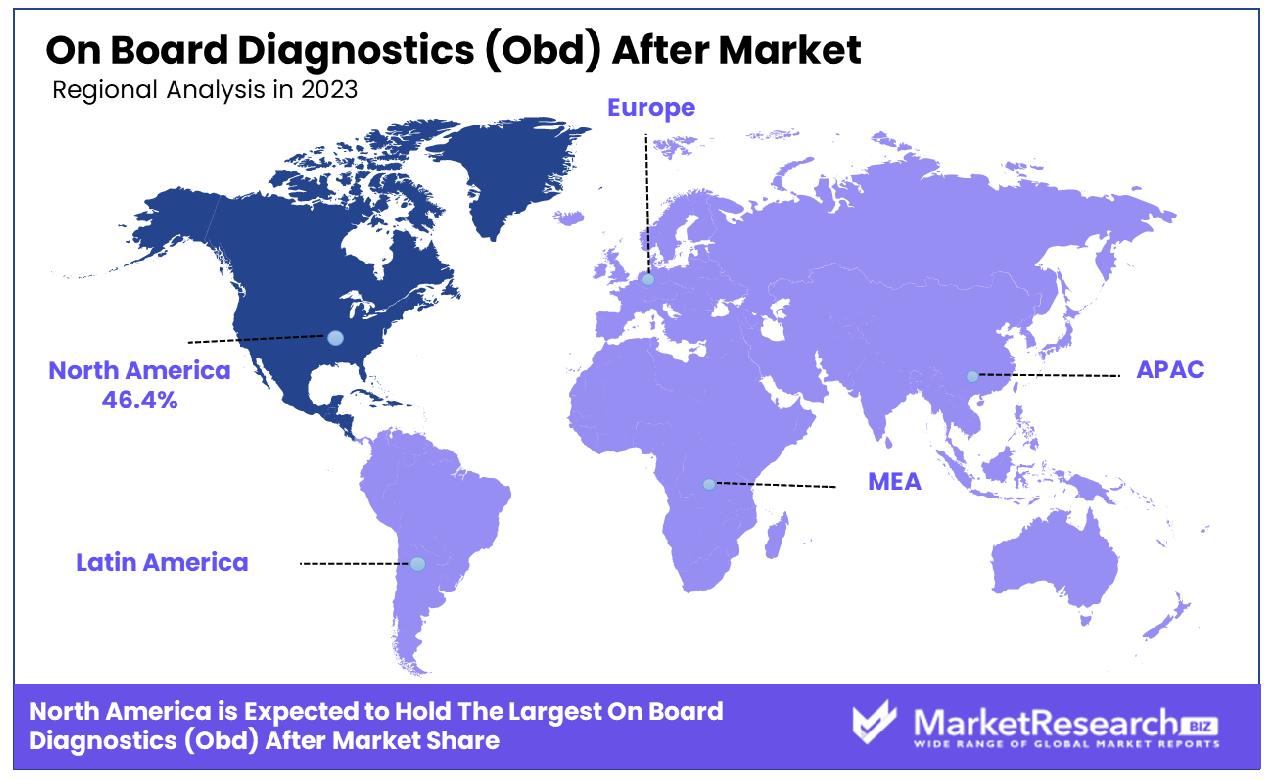
Moving to Europe, the market is characterized by strict environmental regulations and a strong inclination towards sustainable transportation solutions. The European Union's rigorous policies on vehicle emissions and diagnostics have fostered a conducive environment for the growth of the OBD aftermarket. Moreover, the region's advanced automotive infrastructure and high penetration of electric vehicles (EVs) are pivotal in driving the adoption of next-generation OBD systems.
The Asia Pacific region is emerging as a lucrative market, driven by rapid urbanization, increasing vehicle penetration, and evolving emission standards, especially in countries like China and India. The escalating demand for passenger vehicles, coupled with the burgeoning automotive manufacturing sector, underscores the region's potential for substantial OBD aftermarket expansion.
Conversely, the Middle East & Africa and Latin America regions are gradually catching up, with growth fueled by improving automotive standards, economic development, and increasing awareness about vehicle maintenance. Although these regions currently hold smaller market shares, the rising demand for automotive diagnostics and consumer propensity towards vehicle longevity are likely to enhance their market stance over the forecast period.
Key Regions and Countries
North America
- The US
- Canada
- Rest of North America
Europe
- Germany
- France
- The UK
- Spain
- Netherlands
- Russia
- Italy
- Rest of Europe
Asia-Pacific
- China
- Japan
- Singapore
- Thailand
- South Korea
- Vietnam
- India
- New Zealand
- Rest of Asia Pacific
Latin America
- Mexico
- Brazil
- Rest of Latin America
Middle East & Africa
- Saudi Arabia
- South Africa
- UAE
- Rest of the Middle East & Africa
Key Players Analysis
In the rapidly evolving landscape of the global On-Board Diagnostics (OBD) aftermarket in 2023, several key players have significantly contributed to the sector's expansion and technological advancements. Magneti Marelli S.p.A., with its rich heritage in automotive innovation, has continued to influence the market through the development of advanced OBD systems that enhance vehicle diagnostics and maintenance efficiency. Intel Corporation, a titan in the technology industry, has leveraged its expertise in computing and connectivity to introduce cutting-edge solutions that bolster the OBD aftermarket's capabilities, particularly in telematics and vehicle data analytics.
Innova Electronics Corporation has carved a niche for itself by focusing on user-friendly OBD diagnostic tools that cater to both professional technicians and automotive enthusiasts. This approach has facilitated a deeper understanding of vehicle health among a broader audience. Hella GmbH & Co. KGaA has also made notable contributions, especially in integrating lighting systems with diagnostic functionalities, thereby enriching the diagnostics ecosystem.
Geotab Inc. stands out for its emphasis on GPS fleet tracking and management solutions integrated with OBD technology, offering invaluable insights into vehicle performance and operational efficiency. Similarly, CalAmp Corporation has excelled in providing telematics solutions that leverage OBD data to enhance fleet management and vehicle security.
Continental AG, with its comprehensive suite of automotive components and systems, has played a pivotal role in advancing OBD technologies, particularly through innovations in-vehicle communication systems. Bosch Diagnostic (Robert Bosch GmbH), a name synonymous with automotive excellence, has continued to lead in the development of diagnostic tools and software, significantly impacting the aftermarket landscape.
Companies like Danlaw Inc., Azuga Inc., AVL DiTEST GmbH, and Autel Intelligent Technology Corp., Ltd., have also made significant strides in the OBD aftermarket, each contributing specialized expertise in diagnostics, telematics, and vehicle data analytics. Their collective efforts have not only enhanced vehicle diagnostics and maintenance but also propelled the OBD aftermarket toward greater connectivity and intelligence.
Market Key Players
- Magneti Marelli S.p.A.
- Intel Corporation
- Innova Electronics Corporation
- Hella GmbH & Co. KGaA
- Geotab Inc.
- Electronic System LTD
- ERM
- Continental AG
- CalAmp Corporation
- Danlaw Inc.
- Bosch Diagnostic (Robert Bosch GmbH)
- Azuga Inc.
- AVL DiTEST GmbH
- Autel Intelligent Technology Corp., Ltd.
Recent Development
- In January 2024, Mankaran integrates Redmi Note 9 Pro with Maruti Alto, enabling autonomous driving via the FlowDrive algorithm. Despite government caution, the innovation signals the potential for responsible advancement in automotive technology.
- In November 2023, Reliance Jio launched JioMotive, an OBD device, that turns cars into smart vehicles. It offers real-time tracking, geofencing, and vehicle health monitoring. Subscription-based services with first-year complimentary.
- In June 2023, NHTSA backed vehicle telematics secrecy, opposing Massachusetts' right-to-repair law. Ignoring telematics security flaws favors automakers' control. Advocates call for robust cybersecurity oversight.
Report Scope
Report Features Description Market Value (2023) USD 4.7 Billion Forecast Revenue (2033) USD 31.1 Billion CAGR (2024-2032) 21.4% Base Year for Estimation 2023 Historic Period 2016-2023 Forecast Period 2024-2033 Report Coverage Revenue Forecast, Market Dynamics, COVID-19 Impact, Competitive Landscape, Recent Developments Segments Covered By Components(Empennage, Wings, Fuselage, Nacelle & Pylon, Nose, Others), By Application(Fleet Management, Consumer Telematics, Car Sharing, Used-based Insurance), By Platform(Fixed-Wing Aircraft(Military, Commercial, General Aviation Aircraft, Business Jet), Rotary-Wing Aircraft(Military Helicopters, Commercial Helicopters, UAVs)), By End-User(OEM, Aftermarket) Regional Analysis North America - The US, Canada, Rest of North America, Europe - Germany, France, The UK, Spain, Italy, Russia, Netherlands, Rest of Europe, Asia-Pacific - China, Japan, South Korea, India, New Zealand, Singapore, Thailand, Vietnam, Rest of Asia Pacific, Latin America - Brazil, Mexico, Rest of Latin America, Middle East & Africa - South Africa, Saudi Arabia, UAE, Rest of Middle East & Africa Competitive Landscape Magneti Marelli S.p.A., Intel Corporation, Innova Electronics Corporation, Hella GmbH & Co. KGaA, Geotab Inc., Electronic System LTD, ERM, Continental AG, CalAmp Corporation, Danlaw Inc., Bosch Diagnostic (Robert Bosch GmbH), Azuga Inc., AVL DiTEST GmbH, Autel Intelligent Technology Corp., Ltd. Customization Scope Customization for segments, region/country-level will be provided. Moreover, additional customization can be done based on the requirements. Purchase Options We have three licenses to opt for Single User License, Multi-User License (Up to 5 Users), Corporate Use License (Unlimited User and Printable PDF) -
- 1. Executive Summary
- 1.1. Definition
- 1.2. Taxonomy
- 1.3. Research Scope
- 1.4. Key Analysis
- 1.5. Key Findings by Major Segments
- 1.6. Top strategies by Major Players
- 2. Global On Board Diagnostics (Obd) After Market Overview
- 2.1. On Board Diagnostics (Obd) After Market Dynamics
- 2.1.1. Drivers
- 2.1.2. Opportunities
- 2.1.3. Restraints
- 2.1.4. Challenges
- 2.2. Macro-economic Factors
- 2.3. Regulatory Framework
- 2.4. Market Investment Feasibility Index
- 2.5. PEST Analysis
- 2.6. PORTER’S Five Force Analysis
- 2.7. Drivers & Restraints Impact Analysis
- 2.8. Industry Chain Analysis
- 2.9. Cost Structure Analysis
- 2.10. Marketing Strategy
- 2.11. Russia-Ukraine War Impact Analysis
- 2.12. Opportunity Map Analysis
- 2.13. Market Competition Scenario Analysis
- 2.14. Product Life Cycle Analysis
- 2.15. Opportunity Orbits
- 2.16. Manufacturer Intensity Map
- 2.17. Major Companies sales by Value & Volume
- 2.1. On Board Diagnostics (Obd) After Market Dynamics
- 3. Global On Board Diagnostics (Obd) After Market Analysis, Opportunity and Forecast, 2016-2032
- 3.1. Global On Board Diagnostics (Obd) After Market Analysis, 2016-2021
- 3.2. Global On Board Diagnostics (Obd) After Market Opportunity and Forecast, 2023-2032
- 3.3. Global On Board Diagnostics (Obd) After Market Analysis, Opportunity and Forecast, By By Components, 2016-2032
- 3.3.1. Global On Board Diagnostics (Obd) After Market Analysis by By Components: Introduction
- 3.3.2. Market Size Absolute $ Opportunity Analysis and Forecast, By By Components, 2016-2032
- 3.3.3. Empennage
- 3.3.4. Wings
- 3.3.5. Fuselage
- 3.3.6. Nacelle & Pylon
- 3.3.7. Nose
- 3.3.8. Others
- 3.4. Global On Board Diagnostics (Obd) After Market Analysis, Opportunity and Forecast, By By Application, 2016-2032
- 3.4.1. Global On Board Diagnostics (Obd) After Market Analysis by By Application: Introduction
- 3.4.2. Market Size Absolute $ Opportunity Analysis and Forecast, By By Application, 2016-2032
- 3.4.3. Fleet Management
- 3.4.4. Consumer Telematics
- 3.4.5. Car Sharing
- 3.4.6. Used-based Insurance
- 3.5. Global On Board Diagnostics (Obd) After Market Analysis, Opportunity and Forecast, By By Platform, 2016-2032
- 3.5.1. Global On Board Diagnostics (Obd) After Market Analysis by By Platform: Introduction
- 3.5.2. Market Size Absolute $ Opportunity Analysis and Forecast, By By Platform, 2016-2032
- 3.5.3. Fixed-Wing Aircraft
- 3.5.3.1. Military
- 3.5.3.2. Commercial
- 3.5.3.3. General Aviation Aircraft
- 3.5.3.4. Business Jet
- 3.5.4. Rotary-Wing Aircraft
- 3.5.4.1. Military Helicopters
- 3.5.4.2. Commercial Helicopters
- 3.5.4.3. UAVs
- 3.6. Global On Board Diagnostics (Obd) After Market Analysis, Opportunity and Forecast, By By End-User, 2016-2032
- 3.6.1. Global On Board Diagnostics (Obd) After Market Analysis by By End-User: Introduction
- 3.6.2. Market Size Absolute $ Opportunity Analysis and Forecast, By By End-User, 2016-2032
- 3.6.3. OEM
- 3.6.4. Aftermarket
- 4. North America On Board Diagnostics (Obd) After Market Analysis, Opportunity and Forecast, 2016-2032
- 4.1. North America On Board Diagnostics (Obd) After Market Analysis, 2016-2021
- 4.2. North America On Board Diagnostics (Obd) After Market Opportunity and Forecast, 2023-2032
- 4.3. North America On Board Diagnostics (Obd) After Market Analysis, Opportunity and Forecast, By By Components, 2016-2032
- 4.3.1. North America On Board Diagnostics (Obd) After Market Analysis by By Components: Introduction
- 4.3.2. Market Size Absolute $ Opportunity Analysis and Forecast, By By Components, 2016-2032
- 4.3.3. Empennage
- 4.3.4. Wings
- 4.3.5. Fuselage
- 4.3.6. Nacelle & Pylon
- 4.3.7. Nose
- 4.3.8. Others
- 4.4. North America On Board Diagnostics (Obd) After Market Analysis, Opportunity and Forecast, By By Application, 2016-2032
- 4.4.1. North America On Board Diagnostics (Obd) After Market Analysis by By Application: Introduction
- 4.4.2. Market Size Absolute $ Opportunity Analysis and Forecast, By By Application, 2016-2032
- 4.4.3. Fleet Management
- 4.4.4. Consumer Telematics
- 4.4.5. Car Sharing
- 4.4.6. Used-based Insurance
- 4.5. North America On Board Diagnostics (Obd) After Market Analysis, Opportunity and Forecast, By By Platform, 2016-2032
- 4.5.1. North America On Board Diagnostics (Obd) After Market Analysis by By Platform: Introduction
- 4.5.2. Market Size Absolute $ Opportunity Analysis and Forecast, By By Platform, 2016-2032
- 4.5.3. Fixed-Wing Aircraft
- 4.5.3.1. Military
- 4.5.3.2. Commercial
- 4.5.3.3. General Aviation Aircraft
- 4.5.3.4. Business Jet
- 4.5.4. Rotary-Wing Aircraft
- 4.5.4.1. Military Helicopters
- 4.5.4.2. Commercial Helicopters
- 4.5.4.3. UAVs
- 4.6. North America On Board Diagnostics (Obd) After Market Analysis, Opportunity and Forecast, By By End-User, 2016-2032
- 4.6.1. North America On Board Diagnostics (Obd) After Market Analysis by By End-User: Introduction
- 4.6.2. Market Size Absolute $ Opportunity Analysis and Forecast, By By End-User, 2016-2032
- 4.6.3. OEM
- 4.6.4. Aftermarket
- 4.7. North America On Board Diagnostics (Obd) After Market Analysis, Opportunity and Forecast, By Country , 2016-2032
- 4.7.1. North America On Board Diagnostics (Obd) After Market Analysis by Country : Introduction
- 4.7.2. Market Size Absolute $ Opportunity Analysis and Forecast, Country , 2016-2032
- 4.7.2.1. The US
- 4.7.2.2. Canada
- 4.7.2.3. Mexico
- 5. Western Europe On Board Diagnostics (Obd) After Market Analysis, Opportunity and Forecast, 2016-2032
- 5.1. Western Europe On Board Diagnostics (Obd) After Market Analysis, 2016-2021
- 5.2. Western Europe On Board Diagnostics (Obd) After Market Opportunity and Forecast, 2023-2032
- 5.3. Western Europe On Board Diagnostics (Obd) After Market Analysis, Opportunity and Forecast, By By Components, 2016-2032
- 5.3.1. Western Europe On Board Diagnostics (Obd) After Market Analysis by By Components: Introduction
- 5.3.2. Market Size Absolute $ Opportunity Analysis and Forecast, By By Components, 2016-2032
- 5.3.3. Empennage
- 5.3.4. Wings
- 5.3.5. Fuselage
- 5.3.6. Nacelle & Pylon
- 5.3.7. Nose
- 5.3.8. Others
- 5.4. Western Europe On Board Diagnostics (Obd) After Market Analysis, Opportunity and Forecast, By By Application, 2016-2032
- 5.4.1. Western Europe On Board Diagnostics (Obd) After Market Analysis by By Application: Introduction
- 5.4.2. Market Size Absolute $ Opportunity Analysis and Forecast, By By Application, 2016-2032
- 5.4.3. Fleet Management
- 5.4.4. Consumer Telematics
- 5.4.5. Car Sharing
- 5.4.6. Used-based Insurance
- 5.5. Western Europe On Board Diagnostics (Obd) After Market Analysis, Opportunity and Forecast, By By Platform, 2016-2032
- 5.5.1. Western Europe On Board Diagnostics (Obd) After Market Analysis by By Platform: Introduction
- 5.5.2. Market Size Absolute $ Opportunity Analysis and Forecast, By By Platform, 2016-2032
- 5.5.3. Fixed-Wing Aircraft
- 5.5.3.1. Military
- 5.5.3.2. Commercial
- 5.5.3.3. General Aviation Aircraft
- 5.5.3.4. Business Jet
- 5.5.4. Rotary-Wing Aircraft
- 5.5.4.1. Military Helicopters
- 5.5.4.2. Commercial Helicopters
- 5.5.4.3. UAVs
- 5.6. Western Europe On Board Diagnostics (Obd) After Market Analysis, Opportunity and Forecast, By By End-User, 2016-2032
- 5.6.1. Western Europe On Board Diagnostics (Obd) After Market Analysis by By End-User: Introduction
- 5.6.2. Market Size Absolute $ Opportunity Analysis and Forecast, By By End-User, 2016-2032
- 5.6.3. OEM
- 5.6.4. Aftermarket
- 5.7. Western Europe On Board Diagnostics (Obd) After Market Analysis, Opportunity and Forecast, By Country , 2016-2032
- 5.7.1. Western Europe On Board Diagnostics (Obd) After Market Analysis by Country : Introduction
- 5.7.2. Market Size Absolute $ Opportunity Analysis and Forecast, Country , 2016-2032
- 5.7.2.1. Germany
- 5.7.2.2. France
- 5.7.2.3. The UK
- 5.7.2.4. Spain
- 5.7.2.5. Italy
- 5.7.2.6. Portugal
- 5.7.2.7. Ireland
- 5.7.2.8. Austria
- 5.7.2.9. Switzerland
- 5.7.2.10. Benelux
- 5.7.2.11. Nordic
- 5.7.2.12. Rest of Western Europe
- 6. Eastern Europe On Board Diagnostics (Obd) After Market Analysis, Opportunity and Forecast, 2016-2032
- 6.1. Eastern Europe On Board Diagnostics (Obd) After Market Analysis, 2016-2021
- 6.2. Eastern Europe On Board Diagnostics (Obd) After Market Opportunity and Forecast, 2023-2032
- 6.3. Eastern Europe On Board Diagnostics (Obd) After Market Analysis, Opportunity and Forecast, By By Components, 2016-2032
- 6.3.1. Eastern Europe On Board Diagnostics (Obd) After Market Analysis by By Components: Introduction
- 6.3.2. Market Size Absolute $ Opportunity Analysis and Forecast, By By Components, 2016-2032
- 6.3.3. Empennage
- 6.3.4. Wings
- 6.3.5. Fuselage
- 6.3.6. Nacelle & Pylon
- 6.3.7. Nose
- 6.3.8. Others
- 6.4. Eastern Europe On Board Diagnostics (Obd) After Market Analysis, Opportunity and Forecast, By By Application, 2016-2032
- 6.4.1. Eastern Europe On Board Diagnostics (Obd) After Market Analysis by By Application: Introduction
- 6.4.2. Market Size Absolute $ Opportunity Analysis and Forecast, By By Application, 2016-2032
- 6.4.3. Fleet Management
- 6.4.4. Consumer Telematics
- 6.4.5. Car Sharing
- 6.4.6. Used-based Insurance
- 6.5. Eastern Europe On Board Diagnostics (Obd) After Market Analysis, Opportunity and Forecast, By By Platform, 2016-2032
- 6.5.1. Eastern Europe On Board Diagnostics (Obd) After Market Analysis by By Platform: Introduction
- 6.5.2. Market Size Absolute $ Opportunity Analysis and Forecast, By By Platform, 2016-2032
- 6.5.3. Fixed-Wing Aircraft
- 6.5.3.1. Military
- 6.5.3.2. Commercial
- 6.5.3.3. General Aviation Aircraft
- 6.5.3.4. Business Jet
- 6.5.4. Rotary-Wing Aircraft
- 6.5.4.1. Military Helicopters
- 6.5.4.2. Commercial Helicopters
- 6.5.4.3. UAVs
- 6.6. Eastern Europe On Board Diagnostics (Obd) After Market Analysis, Opportunity and Forecast, By By End-User, 2016-2032
- 6.6.1. Eastern Europe On Board Diagnostics (Obd) After Market Analysis by By End-User: Introduction
- 6.6.2. Market Size Absolute $ Opportunity Analysis and Forecast, By By End-User, 2016-2032
- 6.6.3. OEM
- 6.6.4. Aftermarket
- 6.7. Eastern Europe On Board Diagnostics (Obd) After Market Analysis, Opportunity and Forecast, By Country , 2016-2032
- 6.7.1. Eastern Europe On Board Diagnostics (Obd) After Market Analysis by Country : Introduction
- 6.7.2. Market Size Absolute $ Opportunity Analysis and Forecast, Country , 2016-2032
- 6.7.2.1. Russia
- 6.7.2.2. Poland
- 6.7.2.3. The Czech Republic
- 6.7.2.4. Greece
- 6.7.2.5. Rest of Eastern Europe
- 7. APAC On Board Diagnostics (Obd) After Market Analysis, Opportunity and Forecast, 2016-2032
- 7.1. APAC On Board Diagnostics (Obd) After Market Analysis, 2016-2021
- 7.2. APAC On Board Diagnostics (Obd) After Market Opportunity and Forecast, 2023-2032
- 7.3. APAC On Board Diagnostics (Obd) After Market Analysis, Opportunity and Forecast, By By Components, 2016-2032
- 7.3.1. APAC On Board Diagnostics (Obd) After Market Analysis by By Components: Introduction
- 7.3.2. Market Size Absolute $ Opportunity Analysis and Forecast, By By Components, 2016-2032
- 7.3.3. Empennage
- 7.3.4. Wings
- 7.3.5. Fuselage
- 7.3.6. Nacelle & Pylon
- 7.3.7. Nose
- 7.3.8. Others
- 7.4. APAC On Board Diagnostics (Obd) After Market Analysis, Opportunity and Forecast, By By Application, 2016-2032
- 7.4.1. APAC On Board Diagnostics (Obd) After Market Analysis by By Application: Introduction
- 7.4.2. Market Size Absolute $ Opportunity Analysis and Forecast, By By Application, 2016-2032
- 7.4.3. Fleet Management
- 7.4.4. Consumer Telematics
- 7.4.5. Car Sharing
- 7.4.6. Used-based Insurance
- 7.5. APAC On Board Diagnostics (Obd) After Market Analysis, Opportunity and Forecast, By By Platform, 2016-2032
- 7.5.1. APAC On Board Diagnostics (Obd) After Market Analysis by By Platform: Introduction
- 7.5.2. Market Size Absolute $ Opportunity Analysis and Forecast, By By Platform, 2016-2032
- 7.5.3. Fixed-Wing Aircraft
- 7.5.3.1. Military
- 7.5.3.2. Commercial
- 7.5.3.3. General Aviation Aircraft
- 7.5.3.4. Business Jet
- 7.5.4. Rotary-Wing Aircraft
- 7.5.4.1. Military Helicopters
- 7.5.4.2. Commercial Helicopters
- 7.5.4.3. UAVs
- 7.6. APAC On Board Diagnostics (Obd) After Market Analysis, Opportunity and Forecast, By By End-User, 2016-2032
- 7.6.1. APAC On Board Diagnostics (Obd) After Market Analysis by By End-User: Introduction
- 7.6.2. Market Size Absolute $ Opportunity Analysis and Forecast, By By End-User, 2016-2032
- 7.6.3. OEM
- 7.6.4. Aftermarket
- 7.7. APAC On Board Diagnostics (Obd) After Market Analysis, Opportunity and Forecast, By Country , 2016-2032
- 7.7.1. APAC On Board Diagnostics (Obd) After Market Analysis by Country : Introduction
- 7.7.2. Market Size Absolute $ Opportunity Analysis and Forecast, Country , 2016-2032
- 7.7.2.1. China
- 7.7.2.2. Japan
- 7.7.2.3. South Korea
- 7.7.2.4. India
- 7.7.2.5. Australia & New Zeland
- 7.7.2.6. Indonesia
- 7.7.2.7. Malaysia
- 7.7.2.8. Philippines
- 7.7.2.9. Singapore
- 7.7.2.10. Thailand
- 7.7.2.11. Vietnam
- 7.7.2.12. Rest of APAC
- 8. Latin America On Board Diagnostics (Obd) After Market Analysis, Opportunity and Forecast, 2016-2032
- 8.1. Latin America On Board Diagnostics (Obd) After Market Analysis, 2016-2021
- 8.2. Latin America On Board Diagnostics (Obd) After Market Opportunity and Forecast, 2023-2032
- 8.3. Latin America On Board Diagnostics (Obd) After Market Analysis, Opportunity and Forecast, By By Components, 2016-2032
- 8.3.1. Latin America On Board Diagnostics (Obd) After Market Analysis by By Components: Introduction
- 8.3.2. Market Size Absolute $ Opportunity Analysis and Forecast, By By Components, 2016-2032
- 8.3.3. Empennage
- 8.3.4. Wings
- 8.3.5. Fuselage
- 8.3.6. Nacelle & Pylon
- 8.3.7. Nose
- 8.3.8. Others
- 8.4. Latin America On Board Diagnostics (Obd) After Market Analysis, Opportunity and Forecast, By By Application, 2016-2032
- 8.4.1. Latin America On Board Diagnostics (Obd) After Market Analysis by By Application: Introduction
- 8.4.2. Market Size Absolute $ Opportunity Analysis and Forecast, By By Application, 2016-2032
- 8.4.3. Fleet Management
- 8.4.4. Consumer Telematics
- 8.4.5. Car Sharing
- 8.4.6. Used-based Insurance
- 8.5. Latin America On Board Diagnostics (Obd) After Market Analysis, Opportunity and Forecast, By By Platform, 2016-2032
- 8.5.1. Latin America On Board Diagnostics (Obd) After Market Analysis by By Platform: Introduction
- 8.5.2. Market Size Absolute $ Opportunity Analysis and Forecast, By By Platform, 2016-2032
- 8.5.3. Fixed-Wing Aircraft
- 8.5.3.1. Military
- 8.5.3.2. Commercial
- 8.5.3.3. General Aviation Aircraft
- 8.5.3.4. Business Jet
- 8.5.4. Rotary-Wing Aircraft
- 8.5.4.1. Military Helicopters
- 8.5.4.2. Commercial Helicopters
- 8.5.4.3. UAVs
- 8.6. Latin America On Board Diagnostics (Obd) After Market Analysis, Opportunity and Forecast, By By End-User, 2016-2032
- 8.6.1. Latin America On Board Diagnostics (Obd) After Market Analysis by By End-User: Introduction
- 8.6.2. Market Size Absolute $ Opportunity Analysis and Forecast, By By End-User, 2016-2032
- 8.6.3. OEM
- 8.6.4. Aftermarket
- 8.7. Latin America On Board Diagnostics (Obd) After Market Analysis, Opportunity and Forecast, By Country , 2016-2032
- 8.7.1. Latin America On Board Diagnostics (Obd) After Market Analysis by Country : Introduction
- 8.7.2. Market Size Absolute $ Opportunity Analysis and Forecast, Country , 2016-2032
- 8.7.2.1. Brazil
- 8.7.2.2. Colombia
- 8.7.2.3. Chile
- 8.7.2.4. Argentina
- 8.7.2.5. Costa Rica
- 8.7.2.6. Rest of Latin America
- 9. Middle East & Africa On Board Diagnostics (Obd) After Market Analysis, Opportunity and Forecast, 2016-2032
- 9.1. Middle East & Africa On Board Diagnostics (Obd) After Market Analysis, 2016-2021
- 9.2. Middle East & Africa On Board Diagnostics (Obd) After Market Opportunity and Forecast, 2023-2032
- 9.3. Middle East & Africa On Board Diagnostics (Obd) After Market Analysis, Opportunity and Forecast, By By Components, 2016-2032
- 9.3.1. Middle East & Africa On Board Diagnostics (Obd) After Market Analysis by By Components: Introduction
- 9.3.2. Market Size Absolute $ Opportunity Analysis and Forecast, By By Components, 2016-2032
- 9.3.3. Empennage
- 9.3.4. Wings
- 9.3.5. Fuselage
- 9.3.6. Nacelle & Pylon
- 9.3.7. Nose
- 9.3.8. Others
- 9.4. Middle East & Africa On Board Diagnostics (Obd) After Market Analysis, Opportunity and Forecast, By By Application, 2016-2032
- 9.4.1. Middle East & Africa On Board Diagnostics (Obd) After Market Analysis by By Application: Introduction
- 9.4.2. Market Size Absolute $ Opportunity Analysis and Forecast, By By Application, 2016-2032
- 9.4.3. Fleet Management
- 9.4.4. Consumer Telematics
- 9.4.5. Car Sharing
- 9.4.6. Used-based Insurance
- 9.5. Middle East & Africa On Board Diagnostics (Obd) After Market Analysis, Opportunity and Forecast, By By Platform, 2016-2032
- 9.5.1. Middle East & Africa On Board Diagnostics (Obd) After Market Analysis by By Platform: Introduction
- 9.5.2. Market Size Absolute $ Opportunity Analysis and Forecast, By By Platform, 2016-2032
- 9.5.3. Fixed-Wing Aircraft
- 9.5.3.1. Military
- 9.5.3.2. Commercial
- 9.5.3.3. General Aviation Aircraft
- 9.5.3.4. Business Jet
- 9.5.4. Rotary-Wing Aircraft
- 9.5.4.1. Military Helicopters
- 9.5.4.2. Commercial Helicopters
- 9.5.4.3. UAVs
- 9.6. Middle East & Africa On Board Diagnostics (Obd) After Market Analysis, Opportunity and Forecast, By By End-User, 2016-2032
- 9.6.1. Middle East & Africa On Board Diagnostics (Obd) After Market Analysis by By End-User: Introduction
- 9.6.2. Market Size Absolute $ Opportunity Analysis and Forecast, By By End-User, 2016-2032
- 9.6.3. OEM
- 9.6.4. Aftermarket
- 9.7. Middle East & Africa On Board Diagnostics (Obd) After Market Analysis, Opportunity and Forecast, By Country , 2016-2032
- 9.7.1. Middle East & Africa On Board Diagnostics (Obd) After Market Analysis by Country : Introduction
- 9.7.2. Market Size Absolute $ Opportunity Analysis and Forecast, Country , 2016-2032
- 9.7.2.1. Algeria
- 9.7.2.2. Egypt
- 9.7.2.3. Israel
- 9.7.2.4. Kuwait
- 9.7.2.5. Nigeria
- 9.7.2.6. Saudi Arabia
- 9.7.2.7. South Africa
- 9.7.2.8. Turkey
- 9.7.2.9. The UAE
- 9.7.2.10. Rest of MEA
- 10. Global On Board Diagnostics (Obd) After Market Analysis, Opportunity and Forecast, By Region , 2016-2032
- 10.1. Global On Board Diagnostics (Obd) After Market Analysis by Region : Introduction
- 10.2. Market Size Absolute $ Opportunity Analysis and Forecast, By Region , 2016-2032
- 10.2.1. North America
- 10.2.2. Western Europe
- 10.2.3. Eastern Europe
- 10.2.4. APAC
- 10.2.5. Latin America
- 10.2.6. Middle East & Africa
- 11. Global On Board Diagnostics (Obd) After Market Competitive Landscape, Market Share Analysis, and Company Profiles
- 11.1. Market Share Analysis
- 11.2. Company Profiles
- 11.3. Magneti Marelli S.p.A.
- 11.3.1. Company Overview
- 11.3.2. Financial Highlights
- 11.3.3. Product Portfolio
- 11.3.4. SWOT Analysis
- 11.3.5. Key Strategies and Developments
- 11.4. Intel Corporation
- 11.4.1. Company Overview
- 11.4.2. Financial Highlights
- 11.4.3. Product Portfolio
- 11.4.4. SWOT Analysis
- 11.4.5. Key Strategies and Developments
- 11.5. Innova Electronics Corporation
- 11.5.1. Company Overview
- 11.5.2. Financial Highlights
- 11.5.3. Product Portfolio
- 11.5.4. SWOT Analysis
- 11.5.5. Key Strategies and Developments
- 11.6. Hella GmbH & Co. KGaA
- 11.6.1. Company Overview
- 11.6.2. Financial Highlights
- 11.6.3. Product Portfolio
- 11.6.4. SWOT Analysis
- 11.6.5. Key Strategies and Developments
- 11.7. Geotab Inc.
- 11.7.1. Company Overview
- 11.7.2. Financial Highlights
- 11.7.3. Product Portfolio
- 11.7.4. SWOT Analysis
- 11.7.5. Key Strategies and Developments
- 11.8. Electronic System LTD
- 11.8.1. Company Overview
- 11.8.2. Financial Highlights
- 11.8.3. Product Portfolio
- 11.8.4. SWOT Analysis
- 11.8.5. Key Strategies and Developments
- 11.9. ERM
- 11.9.1. Company Overview
- 11.9.2. Financial Highlights
- 11.9.3. Product Portfolio
- 11.9.4. SWOT Analysis
- 11.9.5. Key Strategies and Developments
- 11.10. Continental AG
- 11.10.1. Company Overview
- 11.10.2. Financial Highlights
- 11.10.3. Product Portfolio
- 11.10.4. SWOT Analysis
- 11.10.5. Key Strategies and Developments
- 11.11. CalAmp Corporation
- 11.11.1. Company Overview
- 11.11.2. Financial Highlights
- 11.11.3. Product Portfolio
- 11.11.4. SWOT Analysis
- 11.11.5. Key Strategies and Developments
- 11.12. Danlaw Inc.
- 11.12.1. Company Overview
- 11.12.2. Financial Highlights
- 11.12.3. Product Portfolio
- 11.12.4. SWOT Analysis
- 11.12.5. Key Strategies and Developments
- 11.13.1. Company Overview
- 11.13.2. Financial Highlights
- 11.13.3. Product Portfolio
- 11.13.4. SWOT Analysis
- 11.13.5. Key Strategies and Developments
- 11.14. Bosch Diagnostic (Robert Bosch GmbH)
- 11.14.1. Company Overview
- 11.14.2. Financial Highlights
- 11.14.3. Product Portfolio
- 11.14.4. SWOT Analysis
- 11.14.5. Key Strategies and Developments
- 11.15. AVL DiTEST GmbH
- 11.15.1. Company Overview
- 11.15.2. Financial Highlights
- 11.15.3. Product Portfolio
- 11.15.4. SWOT Analysis
- 11.15.5. Key Strategies and Developments
- 11.16. Autel Intelligent Technology Corp., Ltd.
- 11.16.1. Company Overview
- 11.16.2. Financial Highlights
- 11.16.3. Product Portfolio
- 11.16.4. SWOT Analysis
- 11.16.5. Key Strategies and Developments
- 12. Assumptions and Acronyms
- 13. Research Methodology
- 14. Contact
"
- List of Figures
- "
- Figure 1: Global On Board Diagnostics (Obd) After Market Revenue (US$ Mn) Market Share by By Components in 2022
- Figure 2: Global On Board Diagnostics (Obd) After Market Market Attractiveness Analysis by By Components, 2016-2032
- Figure 3: Global On Board Diagnostics (Obd) After Market Revenue (US$ Mn) Market Share by By Applicationin 2022
- Figure 4: Global On Board Diagnostics (Obd) After Market Market Attractiveness Analysis by By Application, 2016-2032
- Figure 5: Global On Board Diagnostics (Obd) After Market Revenue (US$ Mn) Market Share by By Platformin 2022
- Figure 6: Global On Board Diagnostics (Obd) After Market Market Attractiveness Analysis by By Platform, 2016-2032
- Figure 7: Global On Board Diagnostics (Obd) After Market Revenue (US$ Mn) Market Share by By End-Userin 2022
- Figure 8: Global On Board Diagnostics (Obd) After Market Market Attractiveness Analysis by By End-User, 2016-2032
- Figure 9: Global On Board Diagnostics (Obd) After Market Revenue (US$ Mn) Market Share by Region in 2022
- Figure 10: Global On Board Diagnostics (Obd) After Market Market Attractiveness Analysis by Region, 2016-2032
- Figure 11: Global On Board Diagnostics (Obd) After Market Market Revenue (US$ Mn) (2016-2032)
- Figure 12: Global On Board Diagnostics (Obd) After Market Market Revenue (US$ Mn) Comparison by Region (2016-2032)
- Figure 13: Global On Board Diagnostics (Obd) After Market Market Revenue (US$ Mn) Comparison by By Components (2016-2032)
- Figure 14: Global On Board Diagnostics (Obd) After Market Market Revenue (US$ Mn) Comparison by By Application (2016-2032)
- Figure 15: Global On Board Diagnostics (Obd) After Market Market Revenue (US$ Mn) Comparison by By Platform (2016-2032)
- Figure 16: Global On Board Diagnostics (Obd) After Market Market Revenue (US$ Mn) Comparison by By End-User (2016-2032)
- Figure 17: Global On Board Diagnostics (Obd) After Market Market Y-o-Y Growth Rate Comparison by Region (2016-2032)
- Figure 18: Global On Board Diagnostics (Obd) After Market Market Y-o-Y Growth Rate Comparison by By Components (2016-2032)
- Figure 19: Global On Board Diagnostics (Obd) After Market Market Y-o-Y Growth Rate Comparison by By Application (2016-2032)
- Figure 20: Global On Board Diagnostics (Obd) After Market Market Y-o-Y Growth Rate Comparison by By Platform (2016-2032)
- Figure 21: Global On Board Diagnostics (Obd) After Market Market Y-o-Y Growth Rate Comparison by By End-User (2016-2032)
- Figure 22: Global On Board Diagnostics (Obd) After Market Market Share Comparison by Region (2016-2032)
- Figure 23: Global On Board Diagnostics (Obd) After Market Market Share Comparison by By Components (2016-2032)
- Figure 24: Global On Board Diagnostics (Obd) After Market Market Share Comparison by By Application (2016-2032)
- Figure 25: Global On Board Diagnostics (Obd) After Market Market Share Comparison by By Platform (2016-2032)
- Figure 26: Global On Board Diagnostics (Obd) After Market Market Share Comparison by By End-User (2016-2032)
- Figure 27: North America On Board Diagnostics (Obd) After Market Revenue (US$ Mn) Market Share by By Componentsin 2022
- Figure 28: North America On Board Diagnostics (Obd) After Market Market Attractiveness Analysis by By Components, 2016-2032
- Figure 29: North America On Board Diagnostics (Obd) After Market Revenue (US$ Mn) Market Share by By Applicationin 2022
- Figure 30: North America On Board Diagnostics (Obd) After Market Market Attractiveness Analysis by By Application, 2016-2032
- Figure 31: North America On Board Diagnostics (Obd) After Market Revenue (US$ Mn) Market Share by By Platformin 2022
- Figure 32: North America On Board Diagnostics (Obd) After Market Market Attractiveness Analysis by By Platform, 2016-2032
- Figure 33: North America On Board Diagnostics (Obd) After Market Revenue (US$ Mn) Market Share by By End-Userin 2022
- Figure 34: North America On Board Diagnostics (Obd) After Market Market Attractiveness Analysis by By End-User, 2016-2032
- Figure 35: North America On Board Diagnostics (Obd) After Market Revenue (US$ Mn) Market Share by Country in 2022
- Figure 36: North America On Board Diagnostics (Obd) After Market Market Attractiveness Analysis by Country, 2016-2032
- Figure 37: North America On Board Diagnostics (Obd) After Market Market Revenue (US$ Mn) (2016-2032)
- Figure 38: North America On Board Diagnostics (Obd) After Market Market Revenue (US$ Mn) Comparison by Country (2016-2032)
- Figure 39: North America On Board Diagnostics (Obd) After Market Market Revenue (US$ Mn) Comparison by By Components (2016-2032)
- Figure 40: North America On Board Diagnostics (Obd) After Market Market Revenue (US$ Mn) Comparison by By Application (2016-2032)
- Figure 41: North America On Board Diagnostics (Obd) After Market Market Revenue (US$ Mn) Comparison by By Platform (2016-2032)
- Figure 42: North America On Board Diagnostics (Obd) After Market Market Revenue (US$ Mn) Comparison by By End-User (2016-2032)
- Figure 43: North America On Board Diagnostics (Obd) After Market Market Y-o-Y Growth Rate Comparison by Country (2016-2032)
- Figure 44: North America On Board Diagnostics (Obd) After Market Market Y-o-Y Growth Rate Comparison by By Components (2016-2032)
- Figure 45: North America On Board Diagnostics (Obd) After Market Market Y-o-Y Growth Rate Comparison by By Application (2016-2032)
- Figure 46: North America On Board Diagnostics (Obd) After Market Market Y-o-Y Growth Rate Comparison by By Platform (2016-2032)
- Figure 47: North America On Board Diagnostics (Obd) After Market Market Y-o-Y Growth Rate Comparison by By End-User (2016-2032)
- Figure 48: North America On Board Diagnostics (Obd) After Market Market Share Comparison by Country (2016-2032)
- Figure 49: North America On Board Diagnostics (Obd) After Market Market Share Comparison by By Components (2016-2032)
- Figure 50: North America On Board Diagnostics (Obd) After Market Market Share Comparison by By Application (2016-2032)
- Figure 51: North America On Board Diagnostics (Obd) After Market Market Share Comparison by By Platform (2016-2032)
- Figure 52: North America On Board Diagnostics (Obd) After Market Market Share Comparison by By End-User (2016-2032)
- Figure 53: Western Europe On Board Diagnostics (Obd) After Market Revenue (US$ Mn) Market Share by By Componentsin 2022
- Figure 54: Western Europe On Board Diagnostics (Obd) After Market Market Attractiveness Analysis by By Components, 2016-2032
- Figure 55: Western Europe On Board Diagnostics (Obd) After Market Revenue (US$ Mn) Market Share by By Applicationin 2022
- Figure 56: Western Europe On Board Diagnostics (Obd) After Market Market Attractiveness Analysis by By Application, 2016-2032
- Figure 57: Western Europe On Board Diagnostics (Obd) After Market Revenue (US$ Mn) Market Share by By Platformin 2022
- Figure 58: Western Europe On Board Diagnostics (Obd) After Market Market Attractiveness Analysis by By Platform, 2016-2032
- Figure 59: Western Europe On Board Diagnostics (Obd) After Market Revenue (US$ Mn) Market Share by By End-Userin 2022
- Figure 60: Western Europe On Board Diagnostics (Obd) After Market Market Attractiveness Analysis by By End-User, 2016-2032
- Figure 61: Western Europe On Board Diagnostics (Obd) After Market Revenue (US$ Mn) Market Share by Country in 2022
- Figure 62: Western Europe On Board Diagnostics (Obd) After Market Market Attractiveness Analysis by Country, 2016-2032
- Figure 63: Western Europe On Board Diagnostics (Obd) After Market Market Revenue (US$ Mn) (2016-2032)
- Figure 64: Western Europe On Board Diagnostics (Obd) After Market Market Revenue (US$ Mn) Comparison by Country (2016-2032)
- Figure 65: Western Europe On Board Diagnostics (Obd) After Market Market Revenue (US$ Mn) Comparison by By Components (2016-2032)
- Figure 66: Western Europe On Board Diagnostics (Obd) After Market Market Revenue (US$ Mn) Comparison by By Application (2016-2032)
- Figure 67: Western Europe On Board Diagnostics (Obd) After Market Market Revenue (US$ Mn) Comparison by By Platform (2016-2032)
- Figure 68: Western Europe On Board Diagnostics (Obd) After Market Market Revenue (US$ Mn) Comparison by By End-User (2016-2032)
- Figure 69: Western Europe On Board Diagnostics (Obd) After Market Market Y-o-Y Growth Rate Comparison by Country (2016-2032)
- Figure 70: Western Europe On Board Diagnostics (Obd) After Market Market Y-o-Y Growth Rate Comparison by By Components (2016-2032)
- Figure 71: Western Europe On Board Diagnostics (Obd) After Market Market Y-o-Y Growth Rate Comparison by By Application (2016-2032)
- Figure 72: Western Europe On Board Diagnostics (Obd) After Market Market Y-o-Y Growth Rate Comparison by By Platform (2016-2032)
- Figure 73: Western Europe On Board Diagnostics (Obd) After Market Market Y-o-Y Growth Rate Comparison by By End-User (2016-2032)
- Figure 74: Western Europe On Board Diagnostics (Obd) After Market Market Share Comparison by Country (2016-2032)
- Figure 75: Western Europe On Board Diagnostics (Obd) After Market Market Share Comparison by By Components (2016-2032)
- Figure 76: Western Europe On Board Diagnostics (Obd) After Market Market Share Comparison by By Application (2016-2032)
- Figure 77: Western Europe On Board Diagnostics (Obd) After Market Market Share Comparison by By Platform (2016-2032)
- Figure 78: Western Europe On Board Diagnostics (Obd) After Market Market Share Comparison by By End-User (2016-2032)
- Figure 79: Eastern Europe On Board Diagnostics (Obd) After Market Revenue (US$ Mn) Market Share by By Componentsin 2022
- Figure 80: Eastern Europe On Board Diagnostics (Obd) After Market Market Attractiveness Analysis by By Components, 2016-2032
- Figure 81: Eastern Europe On Board Diagnostics (Obd) After Market Revenue (US$ Mn) Market Share by By Applicationin 2022
- Figure 82: Eastern Europe On Board Diagnostics (Obd) After Market Market Attractiveness Analysis by By Application, 2016-2032
- Figure 83: Eastern Europe On Board Diagnostics (Obd) After Market Revenue (US$ Mn) Market Share by By Platformin 2022
- Figure 84: Eastern Europe On Board Diagnostics (Obd) After Market Market Attractiveness Analysis by By Platform, 2016-2032
- Figure 85: Eastern Europe On Board Diagnostics (Obd) After Market Revenue (US$ Mn) Market Share by By End-Userin 2022
- Figure 86: Eastern Europe On Board Diagnostics (Obd) After Market Market Attractiveness Analysis by By End-User, 2016-2032
- Figure 87: Eastern Europe On Board Diagnostics (Obd) After Market Revenue (US$ Mn) Market Share by Country in 2022
- Figure 88: Eastern Europe On Board Diagnostics (Obd) After Market Market Attractiveness Analysis by Country, 2016-2032
- Figure 89: Eastern Europe On Board Diagnostics (Obd) After Market Market Revenue (US$ Mn) (2016-2032)
- Figure 90: Eastern Europe On Board Diagnostics (Obd) After Market Market Revenue (US$ Mn) Comparison by Country (2016-2032)
- Figure 91: Eastern Europe On Board Diagnostics (Obd) After Market Market Revenue (US$ Mn) Comparison by By Components (2016-2032)
- Figure 92: Eastern Europe On Board Diagnostics (Obd) After Market Market Revenue (US$ Mn) Comparison by By Application (2016-2032)
- Figure 93: Eastern Europe On Board Diagnostics (Obd) After Market Market Revenue (US$ Mn) Comparison by By Platform (2016-2032)
- Figure 94: Eastern Europe On Board Diagnostics (Obd) After Market Market Revenue (US$ Mn) Comparison by By End-User (2016-2032)
- Figure 95: Eastern Europe On Board Diagnostics (Obd) After Market Market Y-o-Y Growth Rate Comparison by Country (2016-2032)
- Figure 96: Eastern Europe On Board Diagnostics (Obd) After Market Market Y-o-Y Growth Rate Comparison by By Components (2016-2032)
- Figure 97: Eastern Europe On Board Diagnostics (Obd) After Market Market Y-o-Y Growth Rate Comparison by By Application (2016-2032)
- Figure 98: Eastern Europe On Board Diagnostics (Obd) After Market Market Y-o-Y Growth Rate Comparison by By Platform (2016-2032)
- Figure 99: Eastern Europe On Board Diagnostics (Obd) After Market Market Y-o-Y Growth Rate Comparison by By End-User (2016-2032)
- Figure 100: Eastern Europe On Board Diagnostics (Obd) After Market Market Share Comparison by Country (2016-2032)
- Figure 101: Eastern Europe On Board Diagnostics (Obd) After Market Market Share Comparison by By Components (2016-2032)
- Figure 102: Eastern Europe On Board Diagnostics (Obd) After Market Market Share Comparison by By Application (2016-2032)
- Figure 103: Eastern Europe On Board Diagnostics (Obd) After Market Market Share Comparison by By Platform (2016-2032)
- Figure 104: Eastern Europe On Board Diagnostics (Obd) After Market Market Share Comparison by By End-User (2016-2032)
- Figure 105: APAC On Board Diagnostics (Obd) After Market Revenue (US$ Mn) Market Share by By Componentsin 2022
- Figure 106: APAC On Board Diagnostics (Obd) After Market Market Attractiveness Analysis by By Components, 2016-2032
- Figure 107: APAC On Board Diagnostics (Obd) After Market Revenue (US$ Mn) Market Share by By Applicationin 2022
- Figure 108: APAC On Board Diagnostics (Obd) After Market Market Attractiveness Analysis by By Application, 2016-2032
- Figure 109: APAC On Board Diagnostics (Obd) After Market Revenue (US$ Mn) Market Share by By Platformin 2022
- Figure 110: APAC On Board Diagnostics (Obd) After Market Market Attractiveness Analysis by By Platform, 2016-2032
- Figure 111: APAC On Board Diagnostics (Obd) After Market Revenue (US$ Mn) Market Share by By End-Userin 2022
- Figure 112: APAC On Board Diagnostics (Obd) After Market Market Attractiveness Analysis by By End-User, 2016-2032
- Figure 113: APAC On Board Diagnostics (Obd) After Market Revenue (US$ Mn) Market Share by Country in 2022
- Figure 114: APAC On Board Diagnostics (Obd) After Market Market Attractiveness Analysis by Country, 2016-2032
- Figure 115: APAC On Board Diagnostics (Obd) After Market Market Revenue (US$ Mn) (2016-2032)
- Figure 116: APAC On Board Diagnostics (Obd) After Market Market Revenue (US$ Mn) Comparison by Country (2016-2032)
- Figure 117: APAC On Board Diagnostics (Obd) After Market Market Revenue (US$ Mn) Comparison by By Components (2016-2032)
- Figure 118: APAC On Board Diagnostics (Obd) After Market Market Revenue (US$ Mn) Comparison by By Application (2016-2032)
- Figure 119: APAC On Board Diagnostics (Obd) After Market Market Revenue (US$ Mn) Comparison by By Platform (2016-2032)
- Figure 120: APAC On Board Diagnostics (Obd) After Market Market Revenue (US$ Mn) Comparison by By End-User (2016-2032)
- Figure 121: APAC On Board Diagnostics (Obd) After Market Market Y-o-Y Growth Rate Comparison by Country (2016-2032)
- Figure 122: APAC On Board Diagnostics (Obd) After Market Market Y-o-Y Growth Rate Comparison by By Components (2016-2032)
- Figure 123: APAC On Board Diagnostics (Obd) After Market Market Y-o-Y Growth Rate Comparison by By Application (2016-2032)
- Figure 124: APAC On Board Diagnostics (Obd) After Market Market Y-o-Y Growth Rate Comparison by By Platform (2016-2032)
- Figure 125: APAC On Board Diagnostics (Obd) After Market Market Y-o-Y Growth Rate Comparison by By End-User (2016-2032)
- Figure 126: APAC On Board Diagnostics (Obd) After Market Market Share Comparison by Country (2016-2032)
- Figure 127: APAC On Board Diagnostics (Obd) After Market Market Share Comparison by By Components (2016-2032)
- Figure 128: APAC On Board Diagnostics (Obd) After Market Market Share Comparison by By Application (2016-2032)
- Figure 129: APAC On Board Diagnostics (Obd) After Market Market Share Comparison by By Platform (2016-2032)
- Figure 130: APAC On Board Diagnostics (Obd) After Market Market Share Comparison by By End-User (2016-2032)
- Figure 131: Latin America On Board Diagnostics (Obd) After Market Revenue (US$ Mn) Market Share by By Componentsin 2022
- Figure 132: Latin America On Board Diagnostics (Obd) After Market Market Attractiveness Analysis by By Components, 2016-2032
- Figure 133: Latin America On Board Diagnostics (Obd) After Market Revenue (US$ Mn) Market Share by By Applicationin 2022
- Figure 134: Latin America On Board Diagnostics (Obd) After Market Market Attractiveness Analysis by By Application, 2016-2032
- Figure 135: Latin America On Board Diagnostics (Obd) After Market Revenue (US$ Mn) Market Share by By Platformin 2022
- Figure 136: Latin America On Board Diagnostics (Obd) After Market Market Attractiveness Analysis by By Platform, 2016-2032
- Figure 137: Latin America On Board Diagnostics (Obd) After Market Revenue (US$ Mn) Market Share by By End-Userin 2022
- Figure 138: Latin America On Board Diagnostics (Obd) After Market Market Attractiveness Analysis by By End-User, 2016-2032
- Figure 139: Latin America On Board Diagnostics (Obd) After Market Revenue (US$ Mn) Market Share by Country in 2022
- Figure 140: Latin America On Board Diagnostics (Obd) After Market Market Attractiveness Analysis by Country, 2016-2032
- Figure 141: Latin America On Board Diagnostics (Obd) After Market Market Revenue (US$ Mn) (2016-2032)
- Figure 142: Latin America On Board Diagnostics (Obd) After Market Market Revenue (US$ Mn) Comparison by Country (2016-2032)
- Figure 143: Latin America On Board Diagnostics (Obd) After Market Market Revenue (US$ Mn) Comparison by By Components (2016-2032)
- Figure 144: Latin America On Board Diagnostics (Obd) After Market Market Revenue (US$ Mn) Comparison by By Application (2016-2032)
- Figure 145: Latin America On Board Diagnostics (Obd) After Market Market Revenue (US$ Mn) Comparison by By Platform (2016-2032)
- Figure 146: Latin America On Board Diagnostics (Obd) After Market Market Revenue (US$ Mn) Comparison by By End-User (2016-2032)
- Figure 147: Latin America On Board Diagnostics (Obd) After Market Market Y-o-Y Growth Rate Comparison by Country (2016-2032)
- Figure 148: Latin America On Board Diagnostics (Obd) After Market Market Y-o-Y Growth Rate Comparison by By Components (2016-2032)
- Figure 149: Latin America On Board Diagnostics (Obd) After Market Market Y-o-Y Growth Rate Comparison by By Application (2016-2032)
- Figure 150: Latin America On Board Diagnostics (Obd) After Market Market Y-o-Y Growth Rate Comparison by By Platform (2016-2032)
- Figure 151: Latin America On Board Diagnostics (Obd) After Market Market Y-o-Y Growth Rate Comparison by By End-User (2016-2032)
- Figure 152: Latin America On Board Diagnostics (Obd) After Market Market Share Comparison by Country (2016-2032)
- Figure 153: Latin America On Board Diagnostics (Obd) After Market Market Share Comparison by By Components (2016-2032)
- Figure 154: Latin America On Board Diagnostics (Obd) After Market Market Share Comparison by By Application (2016-2032)
- Figure 155: Latin America On Board Diagnostics (Obd) After Market Market Share Comparison by By Platform (2016-2032)
- Figure 156: Latin America On Board Diagnostics (Obd) After Market Market Share Comparison by By End-User (2016-2032)
- Figure 157: Middle East & Africa On Board Diagnostics (Obd) After Market Revenue (US$ Mn) Market Share by By Componentsin 2022
- Figure 158: Middle East & Africa On Board Diagnostics (Obd) After Market Market Attractiveness Analysis by By Components, 2016-2032
- Figure 159: Middle East & Africa On Board Diagnostics (Obd) After Market Revenue (US$ Mn) Market Share by By Applicationin 2022
- Figure 160: Middle East & Africa On Board Diagnostics (Obd) After Market Market Attractiveness Analysis by By Application, 2016-2032
- Figure 161: Middle East & Africa On Board Diagnostics (Obd) After Market Revenue (US$ Mn) Market Share by By Platformin 2022
- Figure 162: Middle East & Africa On Board Diagnostics (Obd) After Market Market Attractiveness Analysis by By Platform, 2016-2032
- Figure 163: Middle East & Africa On Board Diagnostics (Obd) After Market Revenue (US$ Mn) Market Share by By End-Userin 2022
- Figure 164: Middle East & Africa On Board Diagnostics (Obd) After Market Market Attractiveness Analysis by By End-User, 2016-2032
- Figure 165: Middle East & Africa On Board Diagnostics (Obd) After Market Revenue (US$ Mn) Market Share by Country in 2022
- Figure 166: Middle East & Africa On Board Diagnostics (Obd) After Market Market Attractiveness Analysis by Country, 2016-2032
- Figure 167: Middle East & Africa On Board Diagnostics (Obd) After Market Market Revenue (US$ Mn) (2016-2032)
- Figure 168: Middle East & Africa On Board Diagnostics (Obd) After Market Market Revenue (US$ Mn) Comparison by Country (2016-2032)
- Figure 169: Middle East & Africa On Board Diagnostics (Obd) After Market Market Revenue (US$ Mn) Comparison by By Components (2016-2032)
- Figure 170: Middle East & Africa On Board Diagnostics (Obd) After Market Market Revenue (US$ Mn) Comparison by By Application (2016-2032)
- Figure 171: Middle East & Africa On Board Diagnostics (Obd) After Market Market Revenue (US$ Mn) Comparison by By Platform (2016-2032)
- Figure 172: Middle East & Africa On Board Diagnostics (Obd) After Market Market Revenue (US$ Mn) Comparison by By End-User (2016-2032)
- Figure 173: Middle East & Africa On Board Diagnostics (Obd) After Market Market Y-o-Y Growth Rate Comparison by Country (2016-2032)
- Figure 174: Middle East & Africa On Board Diagnostics (Obd) After Market Market Y-o-Y Growth Rate Comparison by By Components (2016-2032)
- Figure 175: Middle East & Africa On Board Diagnostics (Obd) After Market Market Y-o-Y Growth Rate Comparison by By Application (2016-2032)
- Figure 176: Middle East & Africa On Board Diagnostics (Obd) After Market Market Y-o-Y Growth Rate Comparison by By Platform (2016-2032)
- Figure 177: Middle East & Africa On Board Diagnostics (Obd) After Market Market Y-o-Y Growth Rate Comparison by By End-User (2016-2032)
- Figure 178: Middle East & Africa On Board Diagnostics (Obd) After Market Market Share Comparison by Country (2016-2032)
- Figure 179: Middle East & Africa On Board Diagnostics (Obd) After Market Market Share Comparison by By Components (2016-2032)
- Figure 180: Middle East & Africa On Board Diagnostics (Obd) After Market Market Share Comparison by By Application (2016-2032)
- Figure 181: Middle East & Africa On Board Diagnostics (Obd) After Market Market Share Comparison by By Platform (2016-2032)
- Figure 182: Middle East & Africa On Board Diagnostics (Obd) After Market Market Share Comparison by By End-User (2016-2032)
"
- List of Tables
- "
- Table 1: Global On Board Diagnostics (Obd) After Market Market Comparison by By Components (2016-2032)
- Table 2: Global On Board Diagnostics (Obd) After Market Market Comparison by By Application (2016-2032)
- Table 3: Global On Board Diagnostics (Obd) After Market Market Comparison by By Platform (2016-2032)
- Table 4: Global On Board Diagnostics (Obd) After Market Market Comparison by By End-User (2016-2032)
- Table 5: Global On Board Diagnostics (Obd) After Market Revenue (US$ Mn) Comparison by Region (2016-2032)
- Table 6: Global On Board Diagnostics (Obd) After Market Market Revenue (US$ Mn) (2016-2032)
- Table 7: Global On Board Diagnostics (Obd) After Market Market Revenue (US$ Mn) Comparison by Region (2016-2032)
- Table 8: Global On Board Diagnostics (Obd) After Market Market Revenue (US$ Mn) Comparison by By Components (2016-2032)
- Table 9: Global On Board Diagnostics (Obd) After Market Market Revenue (US$ Mn) Comparison by By Application (2016-2032)
- Table 10: Global On Board Diagnostics (Obd) After Market Market Revenue (US$ Mn) Comparison by By Platform (2016-2032)
- Table 11: Global On Board Diagnostics (Obd) After Market Market Revenue (US$ Mn) Comparison by By End-User (2016-2032)
- Table 12: Global On Board Diagnostics (Obd) After Market Market Y-o-Y Growth Rate Comparison by Region (2016-2032)
- Table 13: Global On Board Diagnostics (Obd) After Market Market Y-o-Y Growth Rate Comparison by By Components (2016-2032)
- Table 14: Global On Board Diagnostics (Obd) After Market Market Y-o-Y Growth Rate Comparison by By Application (2016-2032)
- Table 15: Global On Board Diagnostics (Obd) After Market Market Y-o-Y Growth Rate Comparison by By Platform (2016-2032)
- Table 16: Global On Board Diagnostics (Obd) After Market Market Y-o-Y Growth Rate Comparison by By End-User (2016-2032)
- Table 17: Global On Board Diagnostics (Obd) After Market Market Share Comparison by Region (2016-2032)
- Table 18: Global On Board Diagnostics (Obd) After Market Market Share Comparison by By Components (2016-2032)
- Table 19: Global On Board Diagnostics (Obd) After Market Market Share Comparison by By Application (2016-2032)
- Table 20: Global On Board Diagnostics (Obd) After Market Market Share Comparison by By Platform (2016-2032)
- Table 21: Global On Board Diagnostics (Obd) After Market Market Share Comparison by By End-User (2016-2032)
- Table 22: North America On Board Diagnostics (Obd) After Market Market Comparison by By Application (2016-2032)
- Table 23: North America On Board Diagnostics (Obd) After Market Market Comparison by By Platform (2016-2032)
- Table 24: North America On Board Diagnostics (Obd) After Market Market Comparison by By End-User (2016-2032)
- Table 25: North America On Board Diagnostics (Obd) After Market Revenue (US$ Mn) Comparison by Country (2016-2032)
- Table 26: North America On Board Diagnostics (Obd) After Market Market Revenue (US$ Mn) (2016-2032)
- Table 27: North America On Board Diagnostics (Obd) After Market Market Revenue (US$ Mn) Comparison by Country (2016-2032)
- Table 28: North America On Board Diagnostics (Obd) After Market Market Revenue (US$ Mn) Comparison by By Components (2016-2032)
- Table 29: North America On Board Diagnostics (Obd) After Market Market Revenue (US$ Mn) Comparison by By Application (2016-2032)
- Table 30: North America On Board Diagnostics (Obd) After Market Market Revenue (US$ Mn) Comparison by By Platform (2016-2032)
- Table 31: North America On Board Diagnostics (Obd) After Market Market Revenue (US$ Mn) Comparison by By End-User (2016-2032)
- Table 32: North America On Board Diagnostics (Obd) After Market Market Y-o-Y Growth Rate Comparison by Country (2016-2032)
- Table 33: North America On Board Diagnostics (Obd) After Market Market Y-o-Y Growth Rate Comparison by By Components (2016-2032)
- Table 34: North America On Board Diagnostics (Obd) After Market Market Y-o-Y Growth Rate Comparison by By Application (2016-2032)
- Table 35: North America On Board Diagnostics (Obd) After Market Market Y-o-Y Growth Rate Comparison by By Platform (2016-2032)
- Table 36: North America On Board Diagnostics (Obd) After Market Market Y-o-Y Growth Rate Comparison by By End-User (2016-2032)
- Table 37: North America On Board Diagnostics (Obd) After Market Market Share Comparison by Country (2016-2032)
- Table 38: North America On Board Diagnostics (Obd) After Market Market Share Comparison by By Components (2016-2032)
- Table 39: North America On Board Diagnostics (Obd) After Market Market Share Comparison by By Application (2016-2032)
- Table 40: North America On Board Diagnostics (Obd) After Market Market Share Comparison by By Platform (2016-2032)
- Table 41: North America On Board Diagnostics (Obd) After Market Market Share Comparison by By End-User (2016-2032)
- Table 42: Western Europe On Board Diagnostics (Obd) After Market Market Comparison by By Components (2016-2032)
- Table 43: Western Europe On Board Diagnostics (Obd) After Market Market Comparison by By Application (2016-2032)
- Table 44: Western Europe On Board Diagnostics (Obd) After Market Market Comparison by By Platform (2016-2032)
- Table 45: Western Europe On Board Diagnostics (Obd) After Market Market Comparison by By End-User (2016-2032)
- Table 46: Western Europe On Board Diagnostics (Obd) After Market Revenue (US$ Mn) Comparison by Country (2016-2032)
- Table 47: Western Europe On Board Diagnostics (Obd) After Market Market Revenue (US$ Mn) (2016-2032)
- Table 48: Western Europe On Board Diagnostics (Obd) After Market Market Revenue (US$ Mn) Comparison by Country (2016-2032)
- Table 49: Western Europe On Board Diagnostics (Obd) After Market Market Revenue (US$ Mn) Comparison by By Components (2016-2032)
- Table 50: Western Europe On Board Diagnostics (Obd) After Market Market Revenue (US$ Mn) Comparison by By Application (2016-2032)
- Table 51: Western Europe On Board Diagnostics (Obd) After Market Market Revenue (US$ Mn) Comparison by By Platform (2016-2032)
- Table 52: Western Europe On Board Diagnostics (Obd) After Market Market Revenue (US$ Mn) Comparison by By End-User (2016-2032)
- Table 53: Western Europe On Board Diagnostics (Obd) After Market Market Y-o-Y Growth Rate Comparison by Country (2016-2032)
- Table 54: Western Europe On Board Diagnostics (Obd) After Market Market Y-o-Y Growth Rate Comparison by By Components (2016-2032)
- Table 55: Western Europe On Board Diagnostics (Obd) After Market Market Y-o-Y Growth Rate Comparison by By Application (2016-2032)
- Table 56: Western Europe On Board Diagnostics (Obd) After Market Market Y-o-Y Growth Rate Comparison by By Platform (2016-2032)
- Table 57: Western Europe On Board Diagnostics (Obd) After Market Market Y-o-Y Growth Rate Comparison by By End-User (2016-2032)
- Table 58: Western Europe On Board Diagnostics (Obd) After Market Market Share Comparison by Country (2016-2032)
- Table 59: Western Europe On Board Diagnostics (Obd) After Market Market Share Comparison by By Components (2016-2032)
- Table 60: Western Europe On Board Diagnostics (Obd) After Market Market Share Comparison by By Application (2016-2032)
- Table 61: Western Europe On Board Diagnostics (Obd) After Market Market Share Comparison by By Platform (2016-2032)
- Table 62: Western Europe On Board Diagnostics (Obd) After Market Market Share Comparison by By End-User (2016-2032)
- Table 63: Eastern Europe On Board Diagnostics (Obd) After Market Market Comparison by By Components (2016-2032)
- Table 64: Eastern Europe On Board Diagnostics (Obd) After Market Market Comparison by By Application (2016-2032)
- Table 65: Eastern Europe On Board Diagnostics (Obd) After Market Market Comparison by By Platform (2016-2032)
- Table 66: Eastern Europe On Board Diagnostics (Obd) After Market Market Comparison by By End-User (2016-2032)
- Table 67: Eastern Europe On Board Diagnostics (Obd) After Market Revenue (US$ Mn) Comparison by Country (2016-2032)
- Table 68: Eastern Europe On Board Diagnostics (Obd) After Market Market Revenue (US$ Mn) (2016-2032)
- Table 69: Eastern Europe On Board Diagnostics (Obd) After Market Market Revenue (US$ Mn) Comparison by Country (2016-2032)
- Table 70: Eastern Europe On Board Diagnostics (Obd) After Market Market Revenue (US$ Mn) Comparison by By Components (2016-2032)
- Table 71: Eastern Europe On Board Diagnostics (Obd) After Market Market Revenue (US$ Mn) Comparison by By Application (2016-2032)
- Table 72: Eastern Europe On Board Diagnostics (Obd) After Market Market Revenue (US$ Mn) Comparison by By Platform (2016-2032)
- Table 73: Eastern Europe On Board Diagnostics (Obd) After Market Market Revenue (US$ Mn) Comparison by By End-User (2016-2032)
- Table 74: Eastern Europe On Board Diagnostics (Obd) After Market Market Y-o-Y Growth Rate Comparison by Country (2016-2032)
- Table 75: Eastern Europe On Board Diagnostics (Obd) After Market Market Y-o-Y Growth Rate Comparison by By Components (2016-2032)
- Table 76: Eastern Europe On Board Diagnostics (Obd) After Market Market Y-o-Y Growth Rate Comparison by By Application (2016-2032)
- Table 77: Eastern Europe On Board Diagnostics (Obd) After Market Market Y-o-Y Growth Rate Comparison by By Platform (2016-2032)
- Table 78: Eastern Europe On Board Diagnostics (Obd) After Market Market Y-o-Y Growth Rate Comparison by By End-User (2016-2032)
- Table 79: Eastern Europe On Board Diagnostics (Obd) After Market Market Share Comparison by Country (2016-2032)
- Table 80: Eastern Europe On Board Diagnostics (Obd) After Market Market Share Comparison by By Components (2016-2032)
- Table 81: Eastern Europe On Board Diagnostics (Obd) After Market Market Share Comparison by By Application (2016-2032)
- Table 82: Eastern Europe On Board Diagnostics (Obd) After Market Market Share Comparison by By Platform (2016-2032)
- Table 83: Eastern Europe On Board Diagnostics (Obd) After Market Market Share Comparison by By End-User (2016-2032)
- Table 84: APAC On Board Diagnostics (Obd) After Market Market Comparison by By Components (2016-2032)
- Table 85: APAC On Board Diagnostics (Obd) After Market Market Comparison by By Application (2016-2032)
- Table 86: APAC On Board Diagnostics (Obd) After Market Market Comparison by By Platform (2016-2032)
- Table 87: APAC On Board Diagnostics (Obd) After Market Market Comparison by By End-User (2016-2032)
- Table 88: APAC On Board Diagnostics (Obd) After Market Revenue (US$ Mn) Comparison by Country (2016-2032)
- Table 89: APAC On Board Diagnostics (Obd) After Market Market Revenue (US$ Mn) (2016-2032)
- Table 90: APAC On Board Diagnostics (Obd) After Market Market Revenue (US$ Mn) Comparison by Country (2016-2032)
- Table 91: APAC On Board Diagnostics (Obd) After Market Market Revenue (US$ Mn) Comparison by By Components (2016-2032)
- Table 92: APAC On Board Diagnostics (Obd) After Market Market Revenue (US$ Mn) Comparison by By Application (2016-2032)
- Table 93: APAC On Board Diagnostics (Obd) After Market Market Revenue (US$ Mn) Comparison by By Platform (2016-2032)
- Table 94: APAC On Board Diagnostics (Obd) After Market Market Revenue (US$ Mn) Comparison by By End-User (2016-2032)
- Table 95: APAC On Board Diagnostics (Obd) After Market Market Y-o-Y Growth Rate Comparison by Country (2016-2032)
- Table 96: APAC On Board Diagnostics (Obd) After Market Market Y-o-Y Growth Rate Comparison by By Components (2016-2032)
- Table 97: APAC On Board Diagnostics (Obd) After Market Market Y-o-Y Growth Rate Comparison by By Application (2016-2032)
- Table 98: APAC On Board Diagnostics (Obd) After Market Market Y-o-Y Growth Rate Comparison by By Platform (2016-2032)
- Table 99: APAC On Board Diagnostics (Obd) After Market Market Y-o-Y Growth Rate Comparison by By End-User (2016-2032)
- Table 100: APAC On Board Diagnostics (Obd) After Market Market Share Comparison by Country (2016-2032)
- Table 101: APAC On Board Diagnostics (Obd) After Market Market Share Comparison by By Components (2016-2032)
- Table 102: APAC On Board Diagnostics (Obd) After Market Market Share Comparison by By Application (2016-2032)
- Table 103: APAC On Board Diagnostics (Obd) After Market Market Share Comparison by By Platform (2016-2032)
- Table 104: APAC On Board Diagnostics (Obd) After Market Market Share Comparison by By End-User (2016-2032)
- Table 105: Latin America On Board Diagnostics (Obd) After Market Market Comparison by By Components (2016-2032)
- Table 106: Latin America On Board Diagnostics (Obd) After Market Market Comparison by By Application (2016-2032)
- Table 107: Latin America On Board Diagnostics (Obd) After Market Market Comparison by By Platform (2016-2032)
- Table 108: Latin America On Board Diagnostics (Obd) After Market Market Comparison by By End-User (2016-2032)
- Table 109: Latin America On Board Diagnostics (Obd) After Market Revenue (US$ Mn) Comparison by Country (2016-2032)
- Table 110: Latin America On Board Diagnostics (Obd) After Market Market Revenue (US$ Mn) (2016-2032)
- Table 111: Latin America On Board Diagnostics (Obd) After Market Market Revenue (US$ Mn) Comparison by Country (2016-2032)
- Table 112: Latin America On Board Diagnostics (Obd) After Market Market Revenue (US$ Mn) Comparison by By Components (2016-2032)
- Table 113: Latin America On Board Diagnostics (Obd) After Market Market Revenue (US$ Mn) Comparison by By Application (2016-2032)
- Table 114: Latin America On Board Diagnostics (Obd) After Market Market Revenue (US$ Mn) Comparison by By Platform (2016-2032)
- Table 115: Latin America On Board Diagnostics (Obd) After Market Market Revenue (US$ Mn) Comparison by By End-User (2016-2032)
- Table 116: Latin America On Board Diagnostics (Obd) After Market Market Y-o-Y Growth Rate Comparison by Country (2016-2032)
- Table 117: Latin America On Board Diagnostics (Obd) After Market Market Y-o-Y Growth Rate Comparison by By Components (2016-2032)
- Table 118: Latin America On Board Diagnostics (Obd) After Market Market Y-o-Y Growth Rate Comparison by By Application (2016-2032)
- Table 119: Latin America On Board Diagnostics (Obd) After Market Market Y-o-Y Growth Rate Comparison by By Platform (2016-2032)
- Table 120: Latin America On Board Diagnostics (Obd) After Market Market Y-o-Y Growth Rate Comparison by By End-User (2016-2032)
- Table 121: Latin America On Board Diagnostics (Obd) After Market Market Share Comparison by Country (2016-2032)
- Table 122: Latin America On Board Diagnostics (Obd) After Market Market Share Comparison by By Components (2016-2032)
- Table 123: Latin America On Board Diagnostics (Obd) After Market Market Share Comparison by By Application (2016-2032)
- Table 124: Latin America On Board Diagnostics (Obd) After Market Market Share Comparison by By Platform (2016-2032)
- Table 125: Latin America On Board Diagnostics (Obd) After Market Market Share Comparison by By End-User (2016-2032)
- Table 126: Middle East & Africa On Board Diagnostics (Obd) After Market Market Comparison by By Components (2016-2032)
- Table 127: Middle East & Africa On Board Diagnostics (Obd) After Market Market Comparison by By Application (2016-2032)
- Table 128: Middle East & Africa On Board Diagnostics (Obd) After Market Market Comparison by By Platform (2016-2032)
- Table 129: Middle East & Africa On Board Diagnostics (Obd) After Market Market Comparison by By End-User (2016-2032)
- Table 130: Middle East & Africa On Board Diagnostics (Obd) After Market Revenue (US$ Mn) Comparison by Country (2016-2032)
- Table 131: Middle East & Africa On Board Diagnostics (Obd) After Market Market Revenue (US$ Mn) (2016-2032)
- Table 132: Middle East & Africa On Board Diagnostics (Obd) After Market Market Revenue (US$ Mn) Comparison by Country (2016-2032)
- Table 133: Middle East & Africa On Board Diagnostics (Obd) After Market Market Revenue (US$ Mn) Comparison by By Components (2016-2032)
- Table 134: Middle East & Africa On Board Diagnostics (Obd) After Market Market Revenue (US$ Mn) Comparison by By Application (2016-2032)
- Table 135: Middle East & Africa On Board Diagnostics (Obd) After Market Market Revenue (US$ Mn) Comparison by By Platform (2016-2032)
- Table 136: Middle East & Africa On Board Diagnostics (Obd) After Market Market Revenue (US$ Mn) Comparison by By End-User (2016-2032)
- Table 137: Middle East & Africa On Board Diagnostics (Obd) After Market Market Y-o-Y Growth Rate Comparison by Country (2016-2032)
- Table 138: Middle East & Africa On Board Diagnostics (Obd) After Market Market Y-o-Y Growth Rate Comparison by By Components (2016-2032)
- Table 139: Middle East & Africa On Board Diagnostics (Obd) After Market Market Y-o-Y Growth Rate Comparison by By Application (2016-2032)
- Table 140: Middle East & Africa On Board Diagnostics (Obd) After Market Market Y-o-Y Growth Rate Comparison by By Platform (2016-2032)
- Table 141: Middle East & Africa On Board Diagnostics (Obd) After Market Market Y-o-Y Growth Rate Comparison by By End-User (2016-2032)
- Table 142: Middle East & Africa On Board Diagnostics (Obd) After Market Market Share Comparison by Country (2016-2032)
- Table 143: Middle East & Africa On Board Diagnostics (Obd) After Market Market Share Comparison by By Components (2016-2032)
- Table 144: Middle East & Africa On Board Diagnostics (Obd) After Market Market Share Comparison by By Application (2016-2032)
- Table 145: Middle East & Africa On Board Diagnostics (Obd) After Market Market Share Comparison by By Platform (2016-2032)
- Table 146: Middle East & Africa On Board Diagnostics (Obd) After Market Market Share Comparison by By End-User (2016-2032)
- 1. Executive Summary
-
- Magneti Marelli S.p.A.
- Intel Corporation
- Innova Electronics Corporation
- Hella GmbH & Co. KGaA
- Geotab Inc.
- Electronic System LTD
- ERM
- Continental AG
- CalAmp Corporation
- Danlaw Inc.
- Bosch Diagnostic (Robert Bosch GmbH)
- Azuga Inc.
- AVL DiTEST GmbH
- Autel Intelligent Technology Corp., Ltd.
Our Clients


View Our Licence Options
