
Next Generation Cancer Diagnostics Market By Technology(Next-generation Sequencing, Lab-on-a-chip (LOAC) & Reverse Transcriptase-PCR (RT-PCR)), By Application(Biomarker Development, Proteomic Analysis, CTC Analysis), By Cancer Type(Breast Cancer , Lung Cancer, Others), By Function(Therapeutic Monitoring, Prognostics, Companion Diagnostics), By Region And Companies - Industry Segment Outlook, Market Assessment, Competition Scenario, Trends, And Forecast 2023-2032
-
42347
-
Dec 2022
-
179
-


-
This report was compiled by Correspondence Linkedin | Detailed Market research Methodology Our methodology involves a mix of primary research, including interviews with leading mental health experts, and secondary research from reputable medical journals and databases. View Detailed Methodology Page
-
Quick Navigation
- Next Generation Cancer Diagnostics Market Size, Share, Trends Analysis
- Next Generation Cancer Diagnostics Market Dynamics
- Next Generation Cancer Diagnostics Market Segmentation Analysis
- Next Generation Cancer Diagnostics Industry Segments
- Next Generation Cancer Diagnostics Market Growth Opportunity
- Next Generation Cancer Diagnostics Market Regional Analysis
- Next Generation Cancer Diagnostics Industry By Region
- Next Generation Cancer Diagnostics Market Share Analysis
- Next Generation Cancer Diagnostics Industry Key Players
- Next Generation Cancer Diagnostics Market Recent Development
- Report Scope
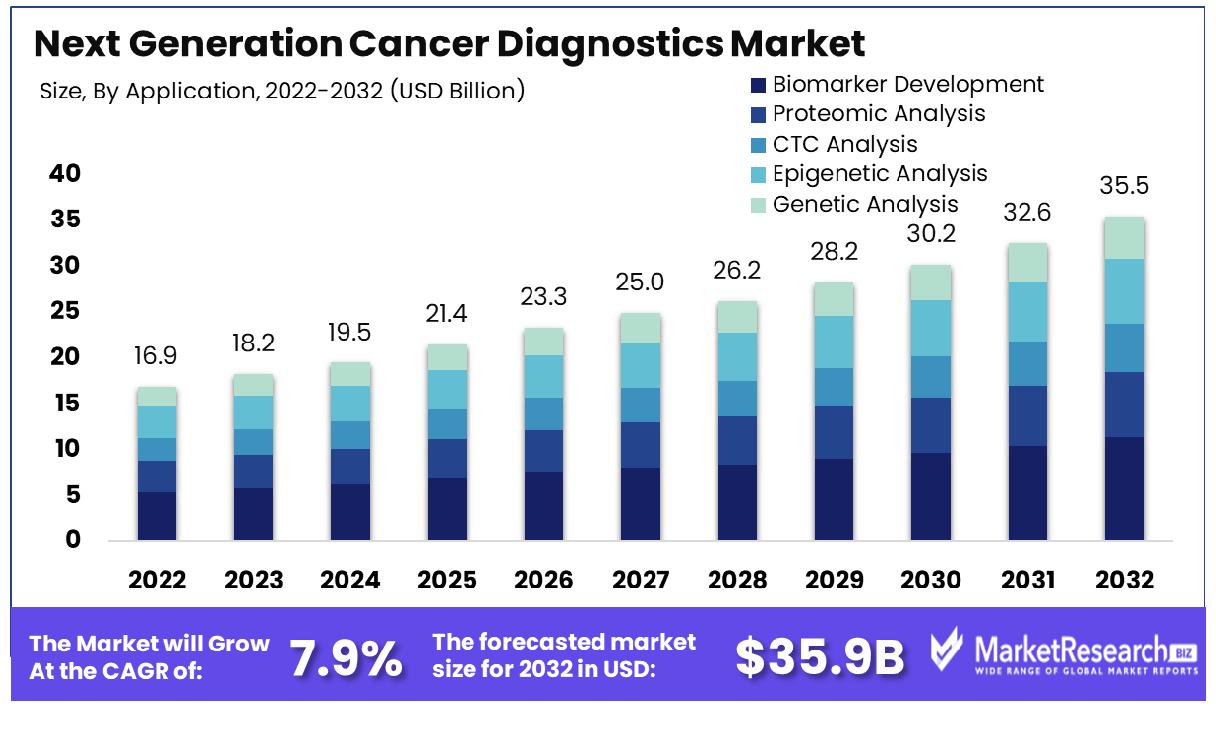
Next Generation Cancer Diagnostics Market size is predicted to reach approximately USD 35.5 Bn by 2032, from a valuation of USD 16.9 Bn in 2022, growing at a CAGR of 7.9% during the forecast period from 2023 to 2032.
Next Generation Cancer Diagnostics refers to emerging techniques that allow for earlier and more precise cancer detection compared to traditional diagnostic methods. These innovative technologies include liquid biopsies, which analyze blood samples for traces of circulating tumor DNA, and genomic sequencing.
This enables customized treatment plans tailored to a patient's genetic makeup. Advanced imaging modalities like MRIs and PET scans with higher resolution; as well as machine learning algorithms designed to identify cancerous tissues more precisely are part of this revolution in care. Together these technologies promise to revolutionize treatment by providing noninvasive screening, targeted therapies, and effective monitoring of treatment effectiveness.
The Next Generation Cancer Diagnostics Market is being propelled forward by factors including rising prevalence rates, advances in genomics and proteomics research, as well as increases in funding for research. Key innovations like next-gen sequencing technologies, lab-on-a-chip devices, and liquid biopsies are driving next-generation cancer diagnostics size market expansion. This is because they offer noninvasive yet accurate testing services that offer timely results.
The American Cancer Society estimates 1,958,310 new cancer cases and 609,820 cancer deaths projected for 2023 in the US. Lung and bronchus are expected to account for 21% of deaths while breast cancer could account for 15%. This poses a substantial burden on healthcare systems.
Companies in the next-generation cancer diagnostics space have significant opportunities for expansion into emerging markets, where increasing health awareness and improving health infrastructure are driving the adoption of advanced oncology testing services. There is also ample room for growth in the developing Next Generation Cancer Diagnostics market, where demand is growing for early and highly specific screening tests.
Strategic mergers and acquisitions are also providing growth avenues for key companies looking to expand their product portfolios with innovative diagnostics platforms.
For Instance, In May 2023, Thermo Fisher Scientific and Pfizer are collaborating to expand access to next-generation sequencing (NGS) testing for breast and lung cancer patients in over 30 countries in Latin America, Africa, the Middle East, and Asia. Thermo Fisher will identify and support local labs using its NGS technology, ensuring infrastructure and quality control, while Pfizer aims to make NGS testing financially accessible for patients in these regions.
In June 2023, Exact Sciences Corporation partnered with the Broad Institute and Baylor Scott & White to advance technologies. The collaboration with the Broad Institute includes a 5-year research agreement and an exclusive license for MAESTRO, a next-gen circulating tumor DNA tech, enabling highly sensitive detection of residual disease for enhanced scalability.
Advances in genomics, proteomics, metabolomics, and other omics technologies are enabling the development of highly sensitive and specific next-generation cancer diagnostics. Substantial investments into R&D to identify new cancer biomarkers and create innovative platforms like liquid biopsies and multiplexing assays are fueling rapid market growth and allowing earlier detection and more precise diagnosis.
Researchers at the Perelman School of Medicine (University of Pennsylvania) introduced Direct Methylation Sequencing (DM-Seq), a novel DNA sequencing method targeting 5-methylcytosine (5mC) markings crucial for gene expression and implicated in health conditions, including cancer. This advancement holds promise for more accurate and efficient testing, especially in early detection via liquid biopsies.
The Next Generation Cancer Diagnostics Market is poised for remarkable growth, driven by advancements in technology, increased emphasis on personalized medicine, and rising demand for early and accurate detection.
Next Generation Cancer Diagnostics Market Dynamics
Cancer Prevalence and Aging Population Drive Diagnostic Advances
The increasing prevalence of cancer and the rising aging population are significant drivers of the Next Generation Cancer Diagnostics Market. As the world's population ages and incidence grows, it calls for more efficient methods of diagnosis. Prompt and precise detection of cancer is vital for effective treatment. As the rate of cancer rises, so do the requirements for more sophisticated diagnostic methods. This is crucial in the case of cancers that are age-related as the method of detection is crucial to the treatment.
The increasing rate of cancer across the globe isn't just an everyday health issue and a chance to keep improving and progressing regarding the treatment of cancer type. The market is expected to grow in the coming years because of the need to fight the increasing prevalence of cancer, specifically among people over the age of. This could mean the development of new diagnostic techniques that will be vital in the treatment. They can provide faster and more certainty in the diagnosis.
R&D Investments Propel Diagnostic Solutions
Rising investments in research and development for advanced diagnostic solutions are fueling the growth of the Market. Significant funding is allocated to developing new technologies that can detect more accurately and at earlier stages. This investment is a reaction to the demand for better diagnosis and is a testament to the potential of new techniques to transform treatment.
The research and development effort is focusing on developing more sensitive more effective, less invasive, and quicker diagnostic tools. These advancements promise to improve patient outcomes significantly by enabling earlier intervention. The continuous flow of investments into R&D indicates a market that is evolving rapidly, with potential breakthroughs on the horizon. This trend is expected to continue, driving the market towards more advanced, efficient diagnostics, and effective diagnostic solutions.
Precision Medicine Enhances Early and Accurate Diagnosis
The emphasis on precision medicine and the need for accurate and early diagnosis are reshaping the market. Precision medicine aims to tailor treatment to the individual characteristics of each patient, and accurate diagnosis is key to this approach. The latest diagnostic technology provides detailed insight into the molecular and genetic aspects of, allowing more precise and customized treatment strategies.
The emphasis on precision medicine is a reflection of the shift in the healthcare industry toward more individualized treatment, which is based on a better comprehension of diseases on a molecular level. The market is anticipated to expand as the use of precision medicine increases due to the demand for diagnostic tools that offer the exact information required to create targeted treatment strategies. The long-term impact is the healthcare environment where the next generation of diagnostics is essential to the treatment of, providing more precise and efficient treatment options.
Personalized Medicine and Targeted Therapies Demand Specific Diagnostics
The growing demand for personalized medicine and targeted therapies for specific types is significantly influencing the Next Generation Cancer Diagnostics Market. The concept of personalized medicine is to tailor treatments to each patient's specific genetic profile, and targeted therapies are developed to treat specific kinds of cells that are cancerous. These strategies require precise diagnostic tests that determine the specific characteristics of each and make next-generation diagnostics crucial.
The market is growing as more targeted treatments are created, each requiring specific tests for diagnosis. This suggests the future of treatment that is becoming more personalized and diagnostic tests play an important role in determining the best treatment option for every patient. The need for specific therapies and tailored medicine is predicted to continue driving expansion in the market and a major focus is on developing tests that help with these individual treatment strategies.
High Cost and Stringent Regulatory Framework Restrain Next Generation Cancer Diagnostics Market Growth
The expansion of the market for next-generation cancer diagnostics is severely limited by the cost of these diagnostics which are highly advanced and have an extremely strict regulatory framework. Implementing and developing new-generation diagnostics, like liquid biopsies and genomic sequencing are substantial research and development costs and can result in increased costs for patients.
Additionally, the complex and strict regulatory landscape for approval of new diagnostic technologies further adds to the time and expense. These factors make such diagnostics less accessible, particularly in resource-limited settings, and can slow down their entry into the market, thereby limiting the market's overall growth potential.
Data Privacy and Security Concerns Limit Next-Generation Cancer Diagnostics Market Growth
Security and privacy concerns regarding data pose significant obstacles in the expansion of the market for next-generation cancer diagnostics. The most advanced diagnostic techniques usually require the gathering and analysis of huge amounts of patient information that is sensitive to unauthorized access. The risk of data breaches and the potential misuse of personal health information raise considerable concerns among patients and healthcare providers.
Adherence to data protection regulations, such as HIPAA in the United States, is crucial but also complex. These privacy and security challenges can lead to reluctance to adopt these new technologies, impeding market growth as ensuring patient data safety is paramount in healthcare.
Next Generation Cancer Diagnostics Market Segmentation Analysis
By Technology Analysis
Next-generation Sequencing (NGS) leads the technology segment in next-generation cancer diagnostics. Its dominance is due to its comprehensive genomic profiling abilities, enabling the identification of multiple cancer types and biomarkers from a single test. NGS technology has revolutionized diagnostics by providing high throughput, scalability, and speed, facilitating personalized treatment plans. Advancements in NGS, such as improved accuracy and reduced sequencing costs, have further propelled its adoption in clinical settings.
Lab-on-a-chip and RT-PCR technologies are pivotal for rapid, on-site testing. qPCR and multiplexing offer high sensitivity and specificity for detecting specific cancer-type markers. Protein and DNA microarrays are essential for analyzing the expression of numerous genes or proteins simultaneously, contributing to understanding biology and developing targeted therapies.
By Application Analysis
Biomarker development is the leading application in next-generation cancer diagnostics. The focus on identifying specific biomarkers for different cancer types facilitates early detection, prognosis, and the customization of treatment strategies. Biomarkers play a crucial role in the development of targeted therapies and monitoring treatment response, driving the demand for advanced diagnostic technologies.
Proteomic analysis provides insights into protein expressions related to cancer type. Circulating Tumor Cell (CTC) analysis aids in assessing metastasis and treatment efficacy. Epigenetic analysis reveals modifications in gene expression, while genetic analysis identifies hereditary risks and mutations. These applications are integral to comprehensive cancer-type diagnosis and management.
By Cancer Type Analysis
Breast cancer diagnostics is the most significant segment, driven by the high prevalence of the disease and the need for early detection. Advances in diagnostics, such as genomic profiling and liquid biopsies, have enhanced breast cancer detection and treatment personalization. The use of genomic profiling for breast cancer diagnosis allows healthcare professionals to customize treatment plans based on the specific genetic profile of each patient's tumor and improve the therapeutic results.
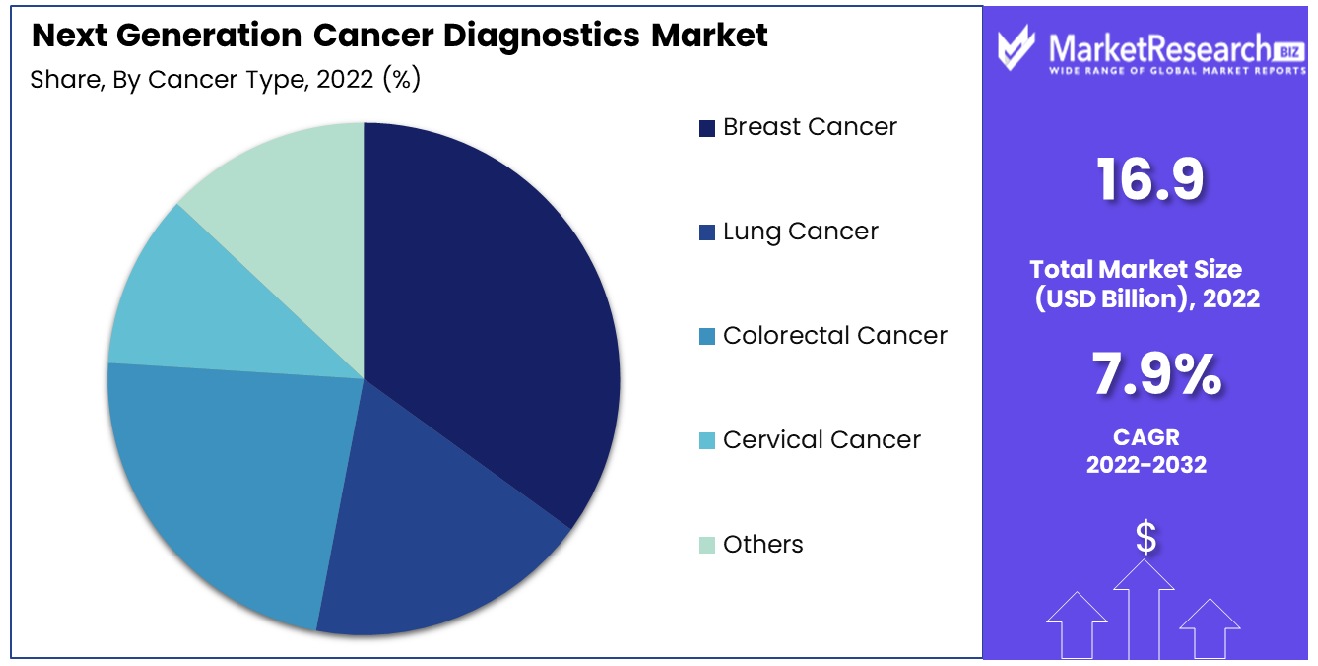
Colorectal and lung cancer diagnoses are vital because of their high incidence and mortality rates. Cervical diagnostics benefit from advancements in HPV testing. Other cancer types, including prostate and ovarian cancer types, are also significant, contributing to the market's diversity.
By Function Analysis
Therapeutic monitoring is a key function, enabling the assessment of treatment effectiveness and therapy adjustments. This segment's growth is driven by the need for personalized treatment regimens and monitoring drug resistance in therapy. By closely scrutinizing the outcomes of therapeutic measures, healthcare professionals can make informed decisions about modifying or fine-tuning the treatment plan, optimizing the chances of successful outcomes for patients.
Prognostics help in predicting disease outcomes. Companion diagnostics identify patients who would benefit from specific therapies. Cancer-type screening and risk analysis are essential for early detection and prevention strategies. Each function plays a vital role in comprehensive care.
Next Generation Cancer Diagnostics Industry Segments
By Technology
- Next-generation Sequencing
- Lab-on-a-chip (LOAC) & Reverse Transcriptase-PCR (RT-PCR)
- qPCR & Multiplexing
- Protein Microarrays
- DNA Microarrays
By Application
- Biomarker Development
- Proteomic Analysis
- CTC Analysis
- Epigenetic Analysis
- Genetic Analysis
By Cancer Type
- Breast Cancer
- Lung Cancer
- Colorectal Cancer
- Cervical Cancer
- Others
By Function
- Therapeutic Monitoring
- Prognostics
- Companion Diagnostics
- Cancer Screening
- Risk Analysis
Next Generation Cancer Diagnostics Market Growth Opportunity
Advancements in Technology Offer Growth Opportunity in Next Generation Cancer Diagnostics Market
The advancement in technology is a crucial reason for the rapid growth of the new generation of diagnosis. Recent advancements in genomics, proteomics, and bioinformatics have led to the development of new precise, more precise, and efficient tools for diagnosing.
Techniques like next-generation sequencing (NGS) and liquid biopsies are revolutionizing the process of diagnosis, allowing doctors to identify earlier and create personalized treatments. The rapid speed of technological advancement in this area indicates the potential for significant growth as these sophisticated diagnostic techniques are made more accessible and essential to the treatment.
Improving Healthcare Infrastructure Fuels Growth in Next Generation Cancer Diagnostics Market
The continuous improvement in healthcare infrastructure globally fuels growth in the next-generation cancer diagnostics market. Investments in healthcare facilities, particularly in developing countries, are increasing access to advanced diagnostic services. This includes the expansion of specialized centers equipped with cutting-edge diagnostic technologies.
The improvement in healthcare systems, combined with growing awareness of the importance of early cancer detection, is driving the demand for next-generation diagnostic tools. The trend towards enhancing healthcare infrastructure, thereby enabling widespread adoption of advanced diagnostics, signifies a substantial growth opportunity in the market
Next Generation Cancer Diagnostics Market Regional Analysis
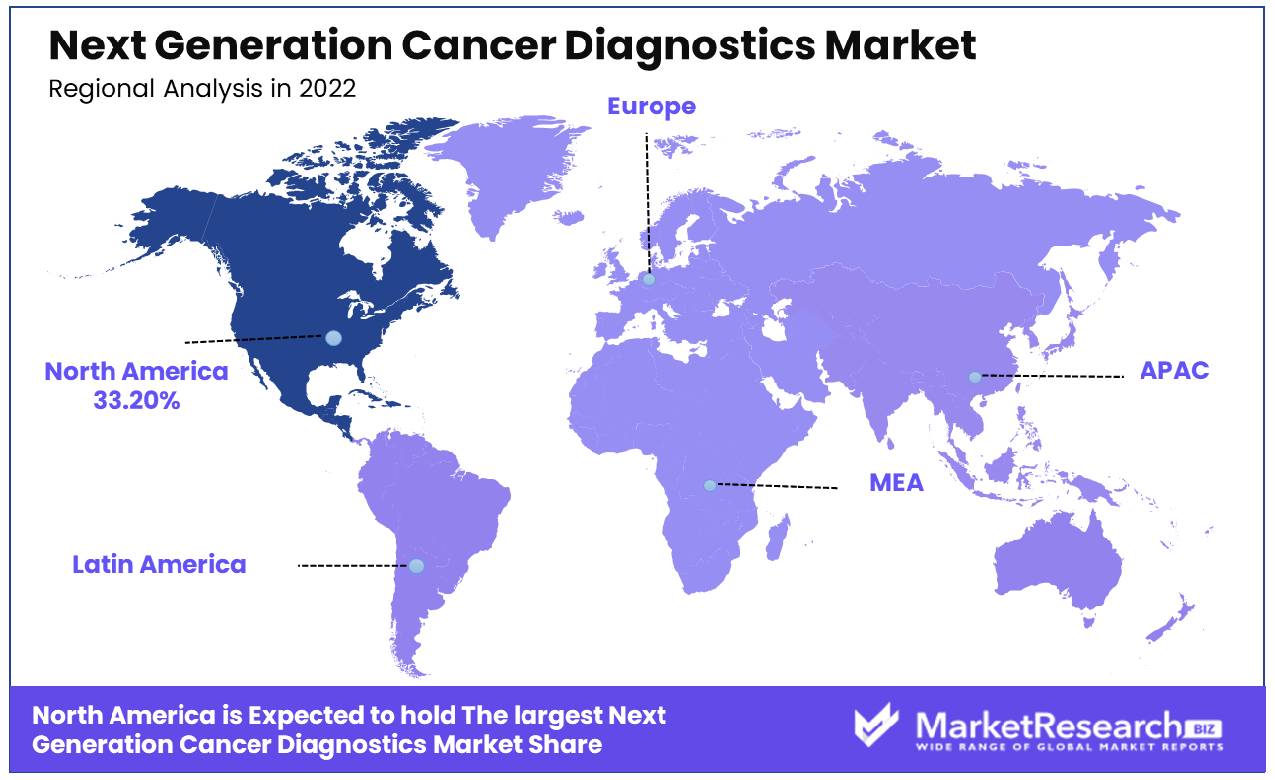
North America Dominates with a 33.20% Market Share
North America’s 33.20% share in the Next Generation Cancer Diagnostics Market is largely attributed to the region's advanced healthcare infrastructure and strong focus on cancer research and personalized medicine. The United States, in particular, hosts some of the world's leading research institutes and biotechnology firms, driving innovation in next-generation diagnostics. High healthcare expenditure and the presence of a sophisticated healthcare technology market also contribute significantly to this market dominance.
The market dynamics in North America are influenced by the increasing incidence of cancer and a growing emphasis on early detection and targeted treatment approaches. The adoption of advanced technologies such as genomic sequencing, liquid biopsies, and molecular imaging in cancer diagnostics is prevalent in the region. Furthermore, supportive government policies and funding for research, along with collaborations between academic institutions and the biotech industry, enhance the development and commercialization of innovative diagnostic methods.
Europe Has A Strong Focus on Innovation and Quality Healthcare
Europe's next-generation cancer diagnostics market is characterized by a strong focus on innovation and quality healthcare. The region benefits from extensive research initiatives, well-established healthcare systems, and stringent regulatory frameworks that ensure high standards in diagnostic technologies. Collaboration between European Union-funded research projects and private companies in the healthcare sector fosters the development of advanced diagnostic solutions.
Asia-Pacific’s Rapid Growth and Technological Advancements
The next-generation cancer diagnostics market in Asia-Pacific is experiencing rapid growth. Factors such as increasing healthcare spending, growing technological capabilities, and rising prevalence contribute to this expansion. Countries like Japan, China, and South Korea are investing in healthcare innovation, including cancer diagnostics, and are fast becoming significant players in the market. The region's focus on adopting cutting-edge technologies and improving healthcare infrastructure positions Asia-Pacific as a key emerging market in next-generation cancer diagnostics.
Next Generation Cancer Diagnostics Industry By Region
North America
- The US
- Canada
- Rest of North America
Europe
- Germany
- France
- The UK
- Spain
- Italy
- Russia
- Netherlands
- Rest of Europe
Asia-Pacific
- China
- Japan
- South Korea
- India
- New Zealand
- Singapore
- Thailand
- Vietnam
- Rest of Asia Pacific
Latin America
- Brazil
- Mexico
- Rest of Latin America
Middle East & Africa
- South Africa
- Saudi Arabia
- UAE
- Rest of Middle East & Africa
Next Generation Cancer Diagnostics Market is a rapidly evolving market segment of healthcare, the listed companies are pivotal in driving innovation and market growth. Cepheid and F. Hoffmann-La Roche Ltd, with their advanced molecular diagnostic technologies, play crucial roles in the development of precise and rapid cancer diagnostic tools, reflecting the market's focus on early and accurate detection.
Koninklijke Philips N.V. and GE Healthcare, leveraging their expertise in medical imaging and health technology, contribute significantly to the integration of diagnostic imaging with next-generation detection methods. Qiagen and Thermo Fisher Scientific, renowned for their capabilities in genetic and molecular analysis, are instrumental in advancing genomic and proteomic approaches for cancer diagnostics.
Novartis AG and Abbott, global healthcare key companies with broad portfolios, underscore the importance of comprehensive diagnostic solutions in personalized medicine and targeted therapies. Opko Health and Myriad Genetics, focusing on unique diagnostic tests and genomic profiling, reflect the industry's shift toward personalized and predictive cancer diagnostics.
Agilent Technologies and PerkinElmer, with their extensive range of diagnostic instruments and reagents, play key roles in supporting the laboratory infrastructure necessary for advanced cancer diagnostics. Genomic Health and Illumina, leading in genomic analysis, showcases the growing importance of next-generation sequencing and genomic data in understanding and diagnosing.
Hologic, specializing in women's health diagnostics, highlights the market's emphasis on specific types and the development of targeted diagnostic solutions. Collectively, these major companies not only drive advancements in the Next Generation Diagnostics Market but also represent diverse strategies, from genomic profiling to advanced imaging and molecular diagnostics, crucial for revolutionizing diagnosis and treatment.
Next Generation Cancer Diagnostics Industry Key Players
- Cepheid
- Koninklijke Philips N.V.
- F. Hoffmann-La Roche Ltd
- Qiagen
- Novartis AG
- Abbott Laboratories.
- Thermo Fisher Scientific Inc.
- Opko Health
- Myriad Genetics
- Agilent Technologies
- GE Healthcare
- PerkinElmer
- Genomic Health
- Illumina Inc.
- Hologic Inc.
- Sysmex Corporation
- Danaher Corporation
- Johnson & Johnson
- Siemens Healthineers AG
- Bio-Rad Laboratories
Next Generation Cancer Diagnostics Market Recent Development
- In November 2023, Royal Philips announced significant advancements in cancer diagnostics with the introduction of their next-generation ultrasound systems at RSNA23.
- In June 2023, Samiran Dey, European business development manager at Fujifilm Healthcare Europe, emphasized the persistent stigma surrounding lung cancer and the need for early diagnosis to improve patient outcomes. Dey discusses the challenges within the therapy area and upcoming innovations in lung cancer diagnostics.
- In March 2023, French AI biotech unicorn Owkin launched a groundbreaking €33 million AI-powered precision medicine project for cancer diagnosis and treatment named PortrAIt. This initiative received backing from the French Government.
- In March 2023, Proscia announced that PathGroup, one of the largest providers of pathology services in the United States, has chosen Proscia's Concentric Dx platform to advance the standard of diagnosis for diseases. This move aims to provide faster and higher quality results for millions of patients, improving treatment decisions.
Report Scope
Report Features Description Market Value (2022) USD 16.9 Billion Forecast Revenue (2032) USD 35.5 Billion CAGR (2023-2032) 7.9% Base Year for Estimation 2022 Historic Period 2016-2022 Forecast Period 2023-2032 Report Coverage Revenue Forecast, Market Dynamics, COVID-19 Impact, Competitive Landscape, Recent Developments Segments Covered By Technology(Next-generation Sequencing, Lab-on-a-chip (LOAC) & Reverse Transcriptase-PCR (RT-PCR), qPCR & Multiplexing, Protein Microarrays, DNA Microarrays), By Application(Biomarker Development, Proteomic Analysis, CTC Analysis, Epigenetic Analysis, Genetic Analysis), By Cancer Type(Breast Cancer , Lung Cancer, Colorectal Cancer, Cervical Cancer, Others), By Function(Therapeutic Monitoring, Prognostics, Companion Diagnostics, Cancer Screening, Risk Analysis) Regional Analysis North America - The US, Canada, Rest of North America, Europe - Germany, France, The UK, Spain, Italy, Russia, Netherlands, Rest of Europe, Asia-Pacific - China, Japan, South Korea, India, New Zealand, Singapore, Thailand, Vietnam, Rest of Asia Pacific, Latin America - Brazil, Mexico, Rest of Latin America, Middle East & Africa - South Africa, Saudi Arabia, UAE, Rest of Middle East & Africa Competitive Landscape Cepheid, Koninklijke Philips N.V., F. Hoffmann-La Roche Ltd, Qiagen, Abbott Laboratories., Thermo Fisher Scientific Inc., Myriad Genetics, Agilent Technologies, GE Healthcare, PerkinElmer, Genomic Health, Illumina Inc., Hologic Inc., Sysmex Corporation, Danaher Corporation, Johnson & Johnson, Siemens Healthineers AG, Bio-Rad Laboratories Customization Scope Customization for segments, region/country-level will be provided. Moreover, additional customization can be done based on the requirements. Purchase Options We have three licenses to opt for Single User License, Multi-User License (Up to 5 Users), Corporate Use License (Unlimited User and Printable PDF) -
- 1. Executive Summary
- 1.1. Definition
- 1.2. Taxonomy
- 1.3. Research Scope
- 1.4. Key Analysis
- 1.5. Key Findings by Major Segments
- 1.6. Top strategies by Major Players
- 2. Global Next Generation Cancer Diagnostics Market Overview
- 2.1. Next Generation Cancer Diagnostics Market Dynamics
- 2.1.1. Drivers
- 2.1.2. Opportunities
- 2.1.3. Restraints
- 2.1.4. Challenges
- 2.2. Macro-economic Factors
- 2.3. Regulatory Framework
- 2.4. Market Investment Feasibility Index
- 2.5. PEST Analysis
- 2.6. PORTER’S Five Force Analysis
- 2.7. Drivers & Restraints Impact Analysis
- 2.8. Industry Chain Analysis
- 2.9. Cost Structure Analysis
- 2.10. Marketing Strategy
- 2.11. Russia-Ukraine War Impact Analysis
- 2.12. Opportunity Map Analysis
- 2.13. Market Competition Scenario Analysis
- 2.14. Product Life Cycle Analysis
- 2.15. Opportunity Orbits
- 2.16. Manufacturer Intensity Map
- 2.17. Major Companies sales by Value & Volume
- 2.1. Next Generation Cancer Diagnostics Market Dynamics
- 3. Global Next Generation Cancer Diagnostics Market Analysis, Opportunity and Forecast, 2016-2032
- 3.1. Global Next Generation Cancer Diagnostics Market Analysis, 2016-2021
- 3.2. Global Next Generation Cancer Diagnostics Market Opportunity and Forecast, 2023-2032
- 3.3. Global Next Generation Cancer Diagnostics Market Analysis, Opportunity and Forecast, By By Technology, 2016-2032
- 3.3.1. Global Next Generation Cancer Diagnostics Market Analysis by By Technology: Introduction
- 3.3.2. Market Size Absolute $ Opportunity Analysis and Forecast, By By Technology, 2016-2032
- 3.3.3. Next-generation Sequencing
- 3.3.4. Lab-on-a-chip (LOAC) & Reverse Transcriptase-PCR (RT-PCR)
- 3.3.5. qPCR & Multiplexing
- 3.3.6. Protein Microarrays
- 3.3.7. DNA Microarrays
- 3.4. Global Next Generation Cancer Diagnostics Market Analysis, Opportunity and Forecast, By By Application, 2016-2032
- 3.4.1. Global Next Generation Cancer Diagnostics Market Analysis by By Application: Introduction
- 3.4.2. Market Size Absolute $ Opportunity Analysis and Forecast, By By Application, 2016-2032
- 3.4.3. Biomarker Development
- 3.4.4. Proteomic Analysis
- 3.4.5. CTC Analysis
- 3.4.6. Epigenetic Analysis
- 3.4.7. Genetic Analysis
- 3.5. Global Next Generation Cancer Diagnostics Market Analysis, Opportunity and Forecast, By By Cancer Type, 2016-2032
- 3.5.1. Global Next Generation Cancer Diagnostics Market Analysis by By Cancer Type: Introduction
- 3.5.2. Market Size Absolute $ Opportunity Analysis and Forecast, By By Cancer Type, 2016-2032
- 3.5.4. Breast Cancer
- 3.5.5. Lung Cancer
- 3.5.6. Colorectal Cancer
- 3.5.7. Cervical Cancer
- 3.5.8. Others
- 3.6. Global Next Generation Cancer Diagnostics Market Analysis, Opportunity and Forecast, By By Function, 2016-2032
- 3.6.1. Global Next Generation Cancer Diagnostics Market Analysis by By Function: Introduction
- 3.6.2. Market Size Absolute $ Opportunity Analysis and Forecast, By By Function, 2016-2032
- 3.6.3. Therapeutic Monitoring
- 3.6.4. Prognostics
- 3.6.5. Companion Diagnostics
- 3.6.6. Cancer Screening
- 3.6.7. Risk Analysis
- 4. North America Next Generation Cancer Diagnostics Market Analysis, Opportunity and Forecast, 2016-2032
- 4.1. North America Next Generation Cancer Diagnostics Market Analysis, 2016-2021
- 4.2. North America Next Generation Cancer Diagnostics Market Opportunity and Forecast, 2023-2032
- 4.3. North America Next Generation Cancer Diagnostics Market Analysis, Opportunity and Forecast, By By Technology, 2016-2032
- 4.3.1. North America Next Generation Cancer Diagnostics Market Analysis by By Technology: Introduction
- 4.3.2. Market Size Absolute $ Opportunity Analysis and Forecast, By By Technology, 2016-2032
- 4.3.3. Next-generation Sequencing
- 4.3.4. Lab-on-a-chip (LOAC) & Reverse Transcriptase-PCR (RT-PCR)
- 4.3.5. qPCR & Multiplexing
- 4.3.6. Protein Microarrays
- 4.3.7. DNA Microarrays
- 4.4. North America Next Generation Cancer Diagnostics Market Analysis, Opportunity and Forecast, By By Application, 2016-2032
- 4.4.1. North America Next Generation Cancer Diagnostics Market Analysis by By Application: Introduction
- 4.4.2. Market Size Absolute $ Opportunity Analysis and Forecast, By By Application, 2016-2032
- 4.4.3. Biomarker Development
- 4.4.4. Proteomic Analysis
- 4.4.5. CTC Analysis
- 4.4.6. Epigenetic Analysis
- 4.4.7. Genetic Analysis
- 4.5. North America Next Generation Cancer Diagnostics Market Analysis, Opportunity and Forecast, By By Cancer Type, 2016-2032
- 4.5.1. North America Next Generation Cancer Diagnostics Market Analysis by By Cancer Type: Introduction
- 4.5.2. Market Size Absolute $ Opportunity Analysis and Forecast, By By Cancer Type, 2016-2032
- 4.5.4. Breast Cancer
- 4.5.5. Lung Cancer
- 4.5.6. Colorectal Cancer
- 4.5.7. Cervical Cancer
- 4.5.8. Others
- 4.6. North America Next Generation Cancer Diagnostics Market Analysis, Opportunity and Forecast, By By Function, 2016-2032
- 4.6.1. North America Next Generation Cancer Diagnostics Market Analysis by By Function: Introduction
- 4.6.2. Market Size Absolute $ Opportunity Analysis and Forecast, By By Function, 2016-2032
- 4.6.3. Therapeutic Monitoring
- 4.6.4. Prognostics
- 4.6.5. Companion Diagnostics
- 4.6.6. Cancer Screening
- 4.6.7. Risk Analysis
- 4.7. North America Next Generation Cancer Diagnostics Market Analysis, Opportunity and Forecast, By Country , 2016-2032
- 4.7.1. North America Next Generation Cancer Diagnostics Market Analysis by Country : Introduction
- 4.7.2. Market Size Absolute $ Opportunity Analysis and Forecast, Country , 2016-2032
- 4.7.2.1. The US
- 4.7.2.2. Canada
- 4.7.2.3. Mexico
- 5. Western Europe Next Generation Cancer Diagnostics Market Analysis, Opportunity and Forecast, 2016-2032
- 5.1. Western Europe Next Generation Cancer Diagnostics Market Analysis, 2016-2021
- 5.2. Western Europe Next Generation Cancer Diagnostics Market Opportunity and Forecast, 2023-2032
- 5.3. Western Europe Next Generation Cancer Diagnostics Market Analysis, Opportunity and Forecast, By By Technology, 2016-2032
- 5.3.1. Western Europe Next Generation Cancer Diagnostics Market Analysis by By Technology: Introduction
- 5.3.2. Market Size Absolute $ Opportunity Analysis and Forecast, By By Technology, 2016-2032
- 5.3.3. Next-generation Sequencing
- 5.3.4. Lab-on-a-chip (LOAC) & Reverse Transcriptase-PCR (RT-PCR)
- 5.3.5. qPCR & Multiplexing
- 5.3.6. Protein Microarrays
- 5.3.7. DNA Microarrays
- 5.4. Western Europe Next Generation Cancer Diagnostics Market Analysis, Opportunity and Forecast, By By Application, 2016-2032
- 5.4.1. Western Europe Next Generation Cancer Diagnostics Market Analysis by By Application: Introduction
- 5.4.2. Market Size Absolute $ Opportunity Analysis and Forecast, By By Application, 2016-2032
- 5.4.3. Biomarker Development
- 5.4.4. Proteomic Analysis
- 5.4.5. CTC Analysis
- 5.4.6. Epigenetic Analysis
- 5.4.7. Genetic Analysis
- 5.5. Western Europe Next Generation Cancer Diagnostics Market Analysis, Opportunity and Forecast, By By Cancer Type, 2016-2032
- 5.5.1. Western Europe Next Generation Cancer Diagnostics Market Analysis by By Cancer Type: Introduction
- 5.5.2. Market Size Absolute $ Opportunity Analysis and Forecast, By By Cancer Type, 2016-2032
- 5.5.4. Breast Cancer
- 5.5.5. Lung Cancer
- 5.5.6. Colorectal Cancer
- 5.5.7. Cervical Cancer
- 5.5.8. Others
- 5.6. Western Europe Next Generation Cancer Diagnostics Market Analysis, Opportunity and Forecast, By By Function, 2016-2032
- 5.6.1. Western Europe Next Generation Cancer Diagnostics Market Analysis by By Function: Introduction
- 5.6.2. Market Size Absolute $ Opportunity Analysis and Forecast, By By Function, 2016-2032
- 5.6.3. Therapeutic Monitoring
- 5.6.4. Prognostics
- 5.6.5. Companion Diagnostics
- 5.6.6. Cancer Screening
- 5.6.7. Risk Analysis
- 5.7. Western Europe Next Generation Cancer Diagnostics Market Analysis, Opportunity and Forecast, By Country , 2016-2032
- 5.7.1. Western Europe Next Generation Cancer Diagnostics Market Analysis by Country : Introduction
- 5.7.2. Market Size Absolute $ Opportunity Analysis and Forecast, Country , 2016-2032
- 5.7.2.1. Germany
- 5.7.2.2. France
- 5.7.2.3. The UK
- 5.7.2.4. Spain
- 5.7.2.5. Italy
- 5.7.2.6. Portugal
- 5.7.2.7. Ireland
- 5.7.2.8. Austria
- 5.7.2.9. Switzerland
- 5.7.2.10. Benelux
- 5.7.2.11. Nordic
- 5.7.2.12. Rest of Western Europe
- 6. Eastern Europe Next Generation Cancer Diagnostics Market Analysis, Opportunity and Forecast, 2016-2032
- 6.1. Eastern Europe Next Generation Cancer Diagnostics Market Analysis, 2016-2021
- 6.2. Eastern Europe Next Generation Cancer Diagnostics Market Opportunity and Forecast, 2023-2032
- 6.3. Eastern Europe Next Generation Cancer Diagnostics Market Analysis, Opportunity and Forecast, By By Technology, 2016-2032
- 6.3.1. Eastern Europe Next Generation Cancer Diagnostics Market Analysis by By Technology: Introduction
- 6.3.2. Market Size Absolute $ Opportunity Analysis and Forecast, By By Technology, 2016-2032
- 6.3.3. Next-generation Sequencing
- 6.3.4. Lab-on-a-chip (LOAC) & Reverse Transcriptase-PCR (RT-PCR)
- 6.3.5. qPCR & Multiplexing
- 6.3.6. Protein Microarrays
- 6.3.7. DNA Microarrays
- 6.4. Eastern Europe Next Generation Cancer Diagnostics Market Analysis, Opportunity and Forecast, By By Application, 2016-2032
- 6.4.1. Eastern Europe Next Generation Cancer Diagnostics Market Analysis by By Application: Introduction
- 6.4.2. Market Size Absolute $ Opportunity Analysis and Forecast, By By Application, 2016-2032
- 6.4.3. Biomarker Development
- 6.4.4. Proteomic Analysis
- 6.4.5. CTC Analysis
- 6.4.6. Epigenetic Analysis
- 6.4.7. Genetic Analysis
- 6.5. Eastern Europe Next Generation Cancer Diagnostics Market Analysis, Opportunity and Forecast, By By Cancer Type, 2016-2032
- 6.5.1. Eastern Europe Next Generation Cancer Diagnostics Market Analysis by By Cancer Type: Introduction
- 6.5.2. Market Size Absolute $ Opportunity Analysis and Forecast, By By Cancer Type, 2016-2032
- 6.5.4. Breast Cancer
- 6.5.5. Lung Cancer
- 6.5.6. Colorectal Cancer
- 6.5.7. Cervical Cancer
- 6.5.8. Others
- 6.6. Eastern Europe Next Generation Cancer Diagnostics Market Analysis, Opportunity and Forecast, By By Function, 2016-2032
- 6.6.1. Eastern Europe Next Generation Cancer Diagnostics Market Analysis by By Function: Introduction
- 6.6.2. Market Size Absolute $ Opportunity Analysis and Forecast, By By Function, 2016-2032
- 6.6.3. Therapeutic Monitoring
- 6.6.4. Prognostics
- 6.6.5. Companion Diagnostics
- 6.6.6. Cancer Screening
- 6.6.7. Risk Analysis
- 6.7. Eastern Europe Next Generation Cancer Diagnostics Market Analysis, Opportunity and Forecast, By Country , 2016-2032
- 6.7.1. Eastern Europe Next Generation Cancer Diagnostics Market Analysis by Country : Introduction
- 6.7.2. Market Size Absolute $ Opportunity Analysis and Forecast, Country , 2016-2032
- 6.7.2.1. Russia
- 6.7.2.2. Poland
- 6.7.2.3. The Czech Republic
- 6.7.2.4. Greece
- 6.7.2.5. Rest of Eastern Europe
- 7. APAC Next Generation Cancer Diagnostics Market Analysis, Opportunity and Forecast, 2016-2032
- 7.1. APAC Next Generation Cancer Diagnostics Market Analysis, 2016-2021
- 7.2. APAC Next Generation Cancer Diagnostics Market Opportunity and Forecast, 2023-2032
- 7.3. APAC Next Generation Cancer Diagnostics Market Analysis, Opportunity and Forecast, By By Technology, 2016-2032
- 7.3.1. APAC Next Generation Cancer Diagnostics Market Analysis by By Technology: Introduction
- 7.3.2. Market Size Absolute $ Opportunity Analysis and Forecast, By By Technology, 2016-2032
- 7.3.3. Next-generation Sequencing
- 7.3.4. Lab-on-a-chip (LOAC) & Reverse Transcriptase-PCR (RT-PCR)
- 7.3.5. qPCR & Multiplexing
- 7.3.6. Protein Microarrays
- 7.3.7. DNA Microarrays
- 7.4. APAC Next Generation Cancer Diagnostics Market Analysis, Opportunity and Forecast, By By Application, 2016-2032
- 7.4.1. APAC Next Generation Cancer Diagnostics Market Analysis by By Application: Introduction
- 7.4.2. Market Size Absolute $ Opportunity Analysis and Forecast, By By Application, 2016-2032
- 7.4.3. Biomarker Development
- 7.4.4. Proteomic Analysis
- 7.4.5. CTC Analysis
- 7.4.6. Epigenetic Analysis
- 7.4.7. Genetic Analysis
- 7.5. APAC Next Generation Cancer Diagnostics Market Analysis, Opportunity and Forecast, By By Cancer Type, 2016-2032
- 7.5.1. APAC Next Generation Cancer Diagnostics Market Analysis by By Cancer Type: Introduction
- 7.5.2. Market Size Absolute $ Opportunity Analysis and Forecast, By By Cancer Type, 2016-2032
- 7.5.4. Breast Cancer
- 7.5.5. Lung Cancer
- 7.5.6. Colorectal Cancer
- 7.5.7. Cervical Cancer
- 7.5.8. Others
- 7.6. APAC Next Generation Cancer Diagnostics Market Analysis, Opportunity and Forecast, By By Function, 2016-2032
- 7.6.1. APAC Next Generation Cancer Diagnostics Market Analysis by By Function: Introduction
- 7.6.2. Market Size Absolute $ Opportunity Analysis and Forecast, By By Function, 2016-2032
- 7.6.3. Therapeutic Monitoring
- 7.6.4. Prognostics
- 7.6.5. Companion Diagnostics
- 7.6.6. Cancer Screening
- 7.6.7. Risk Analysis
- 7.7. APAC Next Generation Cancer Diagnostics Market Analysis, Opportunity and Forecast, By Country , 2016-2032
- 7.7.1. APAC Next Generation Cancer Diagnostics Market Analysis by Country : Introduction
- 7.7.2. Market Size Absolute $ Opportunity Analysis and Forecast, Country , 2016-2032
- 7.7.2.1. China
- 7.7.2.2. Japan
- 7.7.2.3. South Korea
- 7.7.2.4. India
- 7.7.2.5. Australia & New Zeland
- 7.7.2.6. Indonesia
- 7.7.2.7. Malaysia
- 7.7.2.8. Philippines
- 7.7.2.9. Singapore
- 7.7.2.10. Thailand
- 7.7.2.11. Vietnam
- 7.7.2.12. Rest of APAC
- 8. Latin America Next Generation Cancer Diagnostics Market Analysis, Opportunity and Forecast, 2016-2032
- 8.1. Latin America Next Generation Cancer Diagnostics Market Analysis, 2016-2021
- 8.2. Latin America Next Generation Cancer Diagnostics Market Opportunity and Forecast, 2023-2032
- 8.3. Latin America Next Generation Cancer Diagnostics Market Analysis, Opportunity and Forecast, By By Technology, 2016-2032
- 8.3.1. Latin America Next Generation Cancer Diagnostics Market Analysis by By Technology: Introduction
- 8.3.2. Market Size Absolute $ Opportunity Analysis and Forecast, By By Technology, 2016-2032
- 8.3.3. Next-generation Sequencing
- 8.3.4. Lab-on-a-chip (LOAC) & Reverse Transcriptase-PCR (RT-PCR)
- 8.3.5. qPCR & Multiplexing
- 8.3.6. Protein Microarrays
- 8.3.7. DNA Microarrays
- 8.4. Latin America Next Generation Cancer Diagnostics Market Analysis, Opportunity and Forecast, By By Application, 2016-2032
- 8.4.1. Latin America Next Generation Cancer Diagnostics Market Analysis by By Application: Introduction
- 8.4.2. Market Size Absolute $ Opportunity Analysis and Forecast, By By Application, 2016-2032
- 8.4.3. Biomarker Development
- 8.4.4. Proteomic Analysis
- 8.4.5. CTC Analysis
- 8.4.6. Epigenetic Analysis
- 8.4.7. Genetic Analysis
- 8.5. Latin America Next Generation Cancer Diagnostics Market Analysis, Opportunity and Forecast, By By Cancer Type, 2016-2032
- 8.5.1. Latin America Next Generation Cancer Diagnostics Market Analysis by By Cancer Type: Introduction
- 8.5.2. Market Size Absolute $ Opportunity Analysis and Forecast, By By Cancer Type, 2016-2032
- 8.5.4. Breast Cancer
- 8.5.5. Lung Cancer
- 8.5.6. Colorectal Cancer
- 8.5.7. Cervical Cancer
- 8.5.8. Others
- 8.6. Latin America Next Generation Cancer Diagnostics Market Analysis, Opportunity and Forecast, By By Function, 2016-2032
- 8.6.1. Latin America Next Generation Cancer Diagnostics Market Analysis by By Function: Introduction
- 8.6.2. Market Size Absolute $ Opportunity Analysis and Forecast, By By Function, 2016-2032
- 8.6.3. Therapeutic Monitoring
- 8.6.4. Prognostics
- 8.6.5. Companion Diagnostics
- 8.6.6. Cancer Screening
- 8.6.7. Risk Analysis
- 8.7. Latin America Next Generation Cancer Diagnostics Market Analysis, Opportunity and Forecast, By Country , 2016-2032
- 8.7.1. Latin America Next Generation Cancer Diagnostics Market Analysis by Country : Introduction
- 8.7.2. Market Size Absolute $ Opportunity Analysis and Forecast, Country , 2016-2032
- 8.7.2.1. Brazil
- 8.7.2.2. Colombia
- 8.7.2.3. Chile
- 8.7.2.4. Argentina
- 8.7.2.5. Costa Rica
- 8.7.2.6. Rest of Latin America
- 9. Middle East & Africa Next Generation Cancer Diagnostics Market Analysis, Opportunity and Forecast, 2016-2032
- 9.1. Middle East & Africa Next Generation Cancer Diagnostics Market Analysis, 2016-2021
- 9.2. Middle East & Africa Next Generation Cancer Diagnostics Market Opportunity and Forecast, 2023-2032
- 9.3. Middle East & Africa Next Generation Cancer Diagnostics Market Analysis, Opportunity and Forecast, By By Technology, 2016-2032
- 9.3.1. Middle East & Africa Next Generation Cancer Diagnostics Market Analysis by By Technology: Introduction
- 9.3.2. Market Size Absolute $ Opportunity Analysis and Forecast, By By Technology, 2016-2032
- 9.3.3. Next-generation Sequencing
- 9.3.4. Lab-on-a-chip (LOAC) & Reverse Transcriptase-PCR (RT-PCR)
- 9.3.5. qPCR & Multiplexing
- 9.3.6. Protein Microarrays
- 9.3.7. DNA Microarrays
- 9.4. Middle East & Africa Next Generation Cancer Diagnostics Market Analysis, Opportunity and Forecast, By By Application, 2016-2032
- 9.4.1. Middle East & Africa Next Generation Cancer Diagnostics Market Analysis by By Application: Introduction
- 9.4.2. Market Size Absolute $ Opportunity Analysis and Forecast, By By Application, 2016-2032
- 9.4.3. Biomarker Development
- 9.4.4. Proteomic Analysis
- 9.4.5. CTC Analysis
- 9.4.6. Epigenetic Analysis
- 9.4.7. Genetic Analysis
- 9.5. Middle East & Africa Next Generation Cancer Diagnostics Market Analysis, Opportunity and Forecast, By By Cancer Type, 2016-2032
- 9.5.1. Middle East & Africa Next Generation Cancer Diagnostics Market Analysis by By Cancer Type: Introduction
- 9.5.2. Market Size Absolute $ Opportunity Analysis and Forecast, By By Cancer Type, 2016-2032
- 9.5.4. Breast Cancer
- 9.5.5. Lung Cancer
- 9.5.6. Colorectal Cancer
- 9.5.7. Cervical Cancer
- 9.5.8. Others
- 9.6. Middle East & Africa Next Generation Cancer Diagnostics Market Analysis, Opportunity and Forecast, By By Function, 2016-2032
- 9.6.1. Middle East & Africa Next Generation Cancer Diagnostics Market Analysis by By Function: Introduction
- 9.6.2. Market Size Absolute $ Opportunity Analysis and Forecast, By By Function, 2016-2032
- 9.6.3. Therapeutic Monitoring
- 9.6.4. Prognostics
- 9.6.5. Companion Diagnostics
- 9.6.6. Cancer Screening
- 9.6.7. Risk Analysis
- 9.7. Middle East & Africa Next Generation Cancer Diagnostics Market Analysis, Opportunity and Forecast, By Country , 2016-2032
- 9.7.1. Middle East & Africa Next Generation Cancer Diagnostics Market Analysis by Country : Introduction
- 9.7.2. Market Size Absolute $ Opportunity Analysis and Forecast, Country , 2016-2032
- 9.7.2.1. Algeria
- 9.7.2.2. Egypt
- 9.7.2.3. Israel
- 9.7.2.4. Kuwait
- 9.7.2.5. Nigeria
- 9.7.2.6. Saudi Arabia
- 9.7.2.7. South Africa
- 9.7.2.8. Turkey
- 9.7.2.9. The UAE
- 9.7.2.10. Rest of MEA
- 10. Global Next Generation Cancer Diagnostics Market Analysis, Opportunity and Forecast, By Region , 2016-2032
- 10.1. Global Next Generation Cancer Diagnostics Market Analysis by Region : Introduction
- 10.2. Market Size Absolute $ Opportunity Analysis and Forecast, By Region , 2016-2032
- 10.2.1. North America
- 10.2.2. Western Europe
- 10.2.3. Eastern Europe
- 10.2.4. APAC
- 10.2.5. Latin America
- 10.2.6. Middle East & Africa
- 11. Global Next Generation Cancer Diagnostics Market Competitive Landscape, Market Share Analysis, and Company Profiles
- 11.1. Market Share Analysis
- 11.2. Company Profiles
- 11.3. Cepheid
- 11.3.1. Company Overview
- 11.3.2. Financial Highlights
- 11.3.3. Product Portfolio
- 11.3.4. SWOT Analysis
- 11.3.5. Key Strategies and Developments
- 11.4. Koninklijke Philips N.V.
- 11.4.1. Company Overview
- 11.4.2. Financial Highlights
- 11.4.3. Product Portfolio
- 11.4.4. SWOT Analysis
- 11.4.5. Key Strategies and Developments
- 11.5. F. Hoffmann-La Roche Ltd
- 11.5.1. Company Overview
- 11.5.2. Financial Highlights
- 11.5.3. Product Portfolio
- 11.5.4. SWOT Analysis
- 11.5.5. Key Strategies and Developments
- 11.6. Qiagen
- 11.6.1. Company Overview
- 11.6.2. Financial Highlights
- 11.6.3. Product Portfolio
- 11.6.4. SWOT Analysis
- 11.6.5. Key Strategies and Developments
- 11.7. Novartis AG
- 11.7.1. Company Overview
- 11.7.2. Financial Highlights
- 11.7.3. Product Portfolio
- 11.7.4. SWOT Analysis
- 11.7.5. Key Strategies and Developments
- 11.8. Abbott Laboratories.
- 11.8.1. Company Overview
- 11.8.2. Financial Highlights
- 11.8.3. Product Portfolio
- 11.8.4. SWOT Analysis
- 11.8.5. Key Strategies and Developments
- 11.9. Thermo Fisher Scientific Inc.
- 11.9.1. Company Overview
- 11.9.2. Financial Highlights
- 11.9.3. Product Portfolio
- 11.9.4. SWOT Analysis
- 11.9.5. Key Strategies and Developments
- 11.10. Opko Health
- 11.10.1. Company Overview
- 11.10.2. Financial Highlights
- 11.10.3. Product Portfolio
- 11.10.4. SWOT Analysis
- 11.10.5. Key Strategies and Developments
- 11.11. Myriad Genetics
- 11.11.1. Company Overview
- 11.11.2. Financial Highlights
- 11.11.3. Product Portfolio
- 11.11.4. SWOT Analysis
- 11.11.5. Key Strategies and Developments
- 11.12. Agilent Technologies
- 11.12.1. Company Overview
- 11.12.2. Financial Highlights
- 11.12.3. Product Portfolio
- 11.12.4. SWOT Analysis
- 11.12.5. Key Strategies and Developments
- 11.13.1. Company Overview
- 11.13.2. Financial Highlights
- 11.13.3. Product Portfolio
- 11.13.4. SWOT Analysis
- 11.13.5. Key Strategies and Developments
- 11.14. GE Healthcare
- 11.14.1. Company Overview
- 11.14.2. Financial Highlights
- 11.14.3. Product Portfolio
- 11.14.4. SWOT Analysis
- 11.14.5. Key Strategies and Developments
- 11.15. Genomic Health
- 11.15.1. Company Overview
- 11.15.2. Financial Highlights
- 11.15.3. Product Portfolio
- 11.15.4. SWOT Analysis
- 11.15.5. Key Strategies and Developments
- 11.16. Illumina Inc.
- 11.16.1. Company Overview
- 11.16.2. Financial Highlights
- 11.16.3. Product Portfolio
- 11.16.4. SWOT Analysis
- 11.16.5. Key Strategies and Developments
- 11.17. Hologic Inc.
- 11.17.1. Company Overview
- 11.17.2. Financial Highlights
- 11.17.3. Product Portfolio
- 11.17.4. SWOT Analysis
- 11.17.5. Key Strategies and Developments
- 11.18. Sysmex Corporation
- 11.18.1. Company Overview
- 11.18.2. Financial Highlights
- 11.18.3. Product Portfolio
- 11.18.4. SWOT Analysis
- 11.18.5. Key Strategies and Developments
- 11.19. Danaher Corporation
- 11.19.1. Company Overview
- 11.19.2. Financial Highlights
- 11.19.3. Product Portfolio
- 11.19.4. SWOT Analysis
- 11.19.5. Key Strategies and Developments
- 11.20. Johnson & Johnson
- 11.20.1. Company Overview
- 11.20.2. Financial Highlights
- 11.20.3. Product Portfolio
- 11.20.4. SWOT Analysis
- 11.20.5. Key Strategies and Developments
- 11.21. Siemens Healthineers AG
- 11.21.1. Company Overview
- 11.21.2. Financial Highlights
- 11.21.3. Product Portfolio
- 11.21.4. SWOT Analysis
- 11.21.5. Key Strategies and Developments
- 11.22. Bio-Rad Laboratories
- 11.22.1. Company Overview
- 11.22.2. Financial Highlights
- 11.22.3. Product Portfolio
- 11.22.4. SWOT Analysis
- 11.22.5. Key Strategies and Developments
- 12. Assumptions and Acronyms
- 13. Research Methodology
- 14. Contact
"
- List of Figures
- "
- Figure 1: Global Next Generation Cancer Diagnostics Market Revenue (US$ Mn) Market Share by By Technology in 2022
- Figure 2: Global Next Generation Cancer Diagnostics Market Market Attractiveness Analysis by By Technology, 2016-2032
- Figure 3: Global Next Generation Cancer Diagnostics Market Revenue (US$ Mn) Market Share by By Applicationin 2022
- Figure 4: Global Next Generation Cancer Diagnostics Market Market Attractiveness Analysis by By Application, 2016-2032
- Figure 5: Global Next Generation Cancer Diagnostics Market Revenue (US$ Mn) Market Share by By Cancer Typein 2022
- Figure 6: Global Next Generation Cancer Diagnostics Market Market Attractiveness Analysis by By Cancer Type, 2016-2032
- Figure 7: Global Next Generation Cancer Diagnostics Market Revenue (US$ Mn) Market Share by By Functionin 2022
- Figure 8: Global Next Generation Cancer Diagnostics Market Market Attractiveness Analysis by By Function, 2016-2032
- Figure 9: Global Next Generation Cancer Diagnostics Market Revenue (US$ Mn) Market Share by Region in 2022
- Figure 10: Global Next Generation Cancer Diagnostics Market Market Attractiveness Analysis by Region, 2016-2032
- Figure 11: Global Next Generation Cancer Diagnostics Market Market Revenue (US$ Mn) (2016-2032)
- Figure 12: Global Next Generation Cancer Diagnostics Market Market Revenue (US$ Mn) Comparison by Region (2016-2032)
- Figure 13: Global Next Generation Cancer Diagnostics Market Market Revenue (US$ Mn) Comparison by By Technology (2016-2032)
- Figure 14: Global Next Generation Cancer Diagnostics Market Market Revenue (US$ Mn) Comparison by By Application (2016-2032)
- Figure 15: Global Next Generation Cancer Diagnostics Market Market Revenue (US$ Mn) Comparison by By Cancer Type (2016-2032)
- Figure 16: Global Next Generation Cancer Diagnostics Market Market Revenue (US$ Mn) Comparison by By Function (2016-2032)
- Figure 17: Global Next Generation Cancer Diagnostics Market Market Y-o-Y Growth Rate Comparison by Region (2016-2032)
- Figure 18: Global Next Generation Cancer Diagnostics Market Market Y-o-Y Growth Rate Comparison by By Technology (2016-2032)
- Figure 19: Global Next Generation Cancer Diagnostics Market Market Y-o-Y Growth Rate Comparison by By Application (2016-2032)
- Figure 20: Global Next Generation Cancer Diagnostics Market Market Y-o-Y Growth Rate Comparison by By Cancer Type (2016-2032)
- Figure 21: Global Next Generation Cancer Diagnostics Market Market Y-o-Y Growth Rate Comparison by By Function (2016-2032)
- Figure 22: Global Next Generation Cancer Diagnostics Market Market Share Comparison by Region (2016-2032)
- Figure 23: Global Next Generation Cancer Diagnostics Market Market Share Comparison by By Technology (2016-2032)
- Figure 24: Global Next Generation Cancer Diagnostics Market Market Share Comparison by By Application (2016-2032)
- Figure 25: Global Next Generation Cancer Diagnostics Market Market Share Comparison by By Cancer Type (2016-2032)
- Figure 26: Global Next Generation Cancer Diagnostics Market Market Share Comparison by By Function (2016-2032)
- Figure 27: North America Next Generation Cancer Diagnostics Market Revenue (US$ Mn) Market Share by By Technologyin 2022
- Figure 28: North America Next Generation Cancer Diagnostics Market Market Attractiveness Analysis by By Technology, 2016-2032
- Figure 29: North America Next Generation Cancer Diagnostics Market Revenue (US$ Mn) Market Share by By Applicationin 2022
- Figure 30: North America Next Generation Cancer Diagnostics Market Market Attractiveness Analysis by By Application, 2016-2032
- Figure 31: North America Next Generation Cancer Diagnostics Market Revenue (US$ Mn) Market Share by By Cancer Typein 2022
- Figure 32: North America Next Generation Cancer Diagnostics Market Market Attractiveness Analysis by By Cancer Type, 2016-2032
- Figure 33: North America Next Generation Cancer Diagnostics Market Revenue (US$ Mn) Market Share by By Functionin 2022
- Figure 34: North America Next Generation Cancer Diagnostics Market Market Attractiveness Analysis by By Function, 2016-2032
- Figure 35: North America Next Generation Cancer Diagnostics Market Revenue (US$ Mn) Market Share by Country in 2022
- Figure 36: North America Next Generation Cancer Diagnostics Market Market Attractiveness Analysis by Country, 2016-2032
- Figure 37: North America Next Generation Cancer Diagnostics Market Market Revenue (US$ Mn) (2016-2032)
- Figure 38: North America Next Generation Cancer Diagnostics Market Market Revenue (US$ Mn) Comparison by Country (2016-2032)
- Figure 39: North America Next Generation Cancer Diagnostics Market Market Revenue (US$ Mn) Comparison by By Technology (2016-2032)
- Figure 40: North America Next Generation Cancer Diagnostics Market Market Revenue (US$ Mn) Comparison by By Application (2016-2032)
- Figure 41: North America Next Generation Cancer Diagnostics Market Market Revenue (US$ Mn) Comparison by By Cancer Type (2016-2032)
- Figure 42: North America Next Generation Cancer Diagnostics Market Market Revenue (US$ Mn) Comparison by By Function (2016-2032)
- Figure 43: North America Next Generation Cancer Diagnostics Market Market Y-o-Y Growth Rate Comparison by Country (2016-2032)
- Figure 44: North America Next Generation Cancer Diagnostics Market Market Y-o-Y Growth Rate Comparison by By Technology (2016-2032)
- Figure 45: North America Next Generation Cancer Diagnostics Market Market Y-o-Y Growth Rate Comparison by By Application (2016-2032)
- Figure 46: North America Next Generation Cancer Diagnostics Market Market Y-o-Y Growth Rate Comparison by By Cancer Type (2016-2032)
- Figure 47: North America Next Generation Cancer Diagnostics Market Market Y-o-Y Growth Rate Comparison by By Function (2016-2032)
- Figure 48: North America Next Generation Cancer Diagnostics Market Market Share Comparison by Country (2016-2032)
- Figure 49: North America Next Generation Cancer Diagnostics Market Market Share Comparison by By Technology (2016-2032)
- Figure 50: North America Next Generation Cancer Diagnostics Market Market Share Comparison by By Application (2016-2032)
- Figure 51: North America Next Generation Cancer Diagnostics Market Market Share Comparison by By Cancer Type (2016-2032)
- Figure 52: North America Next Generation Cancer Diagnostics Market Market Share Comparison by By Function (2016-2032)
- Figure 53: Western Europe Next Generation Cancer Diagnostics Market Revenue (US$ Mn) Market Share by By Technologyin 2022
- Figure 54: Western Europe Next Generation Cancer Diagnostics Market Market Attractiveness Analysis by By Technology, 2016-2032
- Figure 55: Western Europe Next Generation Cancer Diagnostics Market Revenue (US$ Mn) Market Share by By Applicationin 2022
- Figure 56: Western Europe Next Generation Cancer Diagnostics Market Market Attractiveness Analysis by By Application, 2016-2032
- Figure 57: Western Europe Next Generation Cancer Diagnostics Market Revenue (US$ Mn) Market Share by By Cancer Typein 2022
- Figure 58: Western Europe Next Generation Cancer Diagnostics Market Market Attractiveness Analysis by By Cancer Type, 2016-2032
- Figure 59: Western Europe Next Generation Cancer Diagnostics Market Revenue (US$ Mn) Market Share by By Functionin 2022
- Figure 60: Western Europe Next Generation Cancer Diagnostics Market Market Attractiveness Analysis by By Function, 2016-2032
- Figure 61: Western Europe Next Generation Cancer Diagnostics Market Revenue (US$ Mn) Market Share by Country in 2022
- Figure 62: Western Europe Next Generation Cancer Diagnostics Market Market Attractiveness Analysis by Country, 2016-2032
- Figure 63: Western Europe Next Generation Cancer Diagnostics Market Market Revenue (US$ Mn) (2016-2032)
- Figure 64: Western Europe Next Generation Cancer Diagnostics Market Market Revenue (US$ Mn) Comparison by Country (2016-2032)
- Figure 65: Western Europe Next Generation Cancer Diagnostics Market Market Revenue (US$ Mn) Comparison by By Technology (2016-2032)
- Figure 66: Western Europe Next Generation Cancer Diagnostics Market Market Revenue (US$ Mn) Comparison by By Application (2016-2032)
- Figure 67: Western Europe Next Generation Cancer Diagnostics Market Market Revenue (US$ Mn) Comparison by By Cancer Type (2016-2032)
- Figure 68: Western Europe Next Generation Cancer Diagnostics Market Market Revenue (US$ Mn) Comparison by By Function (2016-2032)
- Figure 69: Western Europe Next Generation Cancer Diagnostics Market Market Y-o-Y Growth Rate Comparison by Country (2016-2032)
- Figure 70: Western Europe Next Generation Cancer Diagnostics Market Market Y-o-Y Growth Rate Comparison by By Technology (2016-2032)
- Figure 71: Western Europe Next Generation Cancer Diagnostics Market Market Y-o-Y Growth Rate Comparison by By Application (2016-2032)
- Figure 72: Western Europe Next Generation Cancer Diagnostics Market Market Y-o-Y Growth Rate Comparison by By Cancer Type (2016-2032)
- Figure 73: Western Europe Next Generation Cancer Diagnostics Market Market Y-o-Y Growth Rate Comparison by By Function (2016-2032)
- Figure 74: Western Europe Next Generation Cancer Diagnostics Market Market Share Comparison by Country (2016-2032)
- Figure 75: Western Europe Next Generation Cancer Diagnostics Market Market Share Comparison by By Technology (2016-2032)
- Figure 76: Western Europe Next Generation Cancer Diagnostics Market Market Share Comparison by By Application (2016-2032)
- Figure 77: Western Europe Next Generation Cancer Diagnostics Market Market Share Comparison by By Cancer Type (2016-2032)
- Figure 78: Western Europe Next Generation Cancer Diagnostics Market Market Share Comparison by By Function (2016-2032)
- Figure 79: Eastern Europe Next Generation Cancer Diagnostics Market Revenue (US$ Mn) Market Share by By Technologyin 2022
- Figure 80: Eastern Europe Next Generation Cancer Diagnostics Market Market Attractiveness Analysis by By Technology, 2016-2032
- Figure 81: Eastern Europe Next Generation Cancer Diagnostics Market Revenue (US$ Mn) Market Share by By Applicationin 2022
- Figure 82: Eastern Europe Next Generation Cancer Diagnostics Market Market Attractiveness Analysis by By Application, 2016-2032
- Figure 83: Eastern Europe Next Generation Cancer Diagnostics Market Revenue (US$ Mn) Market Share by By Cancer Typein 2022
- Figure 84: Eastern Europe Next Generation Cancer Diagnostics Market Market Attractiveness Analysis by By Cancer Type, 2016-2032
- Figure 85: Eastern Europe Next Generation Cancer Diagnostics Market Revenue (US$ Mn) Market Share by By Functionin 2022
- Figure 86: Eastern Europe Next Generation Cancer Diagnostics Market Market Attractiveness Analysis by By Function, 2016-2032
- Figure 87: Eastern Europe Next Generation Cancer Diagnostics Market Revenue (US$ Mn) Market Share by Country in 2022
- Figure 88: Eastern Europe Next Generation Cancer Diagnostics Market Market Attractiveness Analysis by Country, 2016-2032
- Figure 89: Eastern Europe Next Generation Cancer Diagnostics Market Market Revenue (US$ Mn) (2016-2032)
- Figure 90: Eastern Europe Next Generation Cancer Diagnostics Market Market Revenue (US$ Mn) Comparison by Country (2016-2032)
- Figure 91: Eastern Europe Next Generation Cancer Diagnostics Market Market Revenue (US$ Mn) Comparison by By Technology (2016-2032)
- Figure 92: Eastern Europe Next Generation Cancer Diagnostics Market Market Revenue (US$ Mn) Comparison by By Application (2016-2032)
- Figure 93: Eastern Europe Next Generation Cancer Diagnostics Market Market Revenue (US$ Mn) Comparison by By Cancer Type (2016-2032)
- Figure 94: Eastern Europe Next Generation Cancer Diagnostics Market Market Revenue (US$ Mn) Comparison by By Function (2016-2032)
- Figure 95: Eastern Europe Next Generation Cancer Diagnostics Market Market Y-o-Y Growth Rate Comparison by Country (2016-2032)
- Figure 96: Eastern Europe Next Generation Cancer Diagnostics Market Market Y-o-Y Growth Rate Comparison by By Technology (2016-2032)
- Figure 97: Eastern Europe Next Generation Cancer Diagnostics Market Market Y-o-Y Growth Rate Comparison by By Application (2016-2032)
- Figure 98: Eastern Europe Next Generation Cancer Diagnostics Market Market Y-o-Y Growth Rate Comparison by By Cancer Type (2016-2032)
- Figure 99: Eastern Europe Next Generation Cancer Diagnostics Market Market Y-o-Y Growth Rate Comparison by By Function (2016-2032)
- Figure 100: Eastern Europe Next Generation Cancer Diagnostics Market Market Share Comparison by Country (2016-2032)
- Figure 101: Eastern Europe Next Generation Cancer Diagnostics Market Market Share Comparison by By Technology (2016-2032)
- Figure 102: Eastern Europe Next Generation Cancer Diagnostics Market Market Share Comparison by By Application (2016-2032)
- Figure 103: Eastern Europe Next Generation Cancer Diagnostics Market Market Share Comparison by By Cancer Type (2016-2032)
- Figure 104: Eastern Europe Next Generation Cancer Diagnostics Market Market Share Comparison by By Function (2016-2032)
- Figure 105: APAC Next Generation Cancer Diagnostics Market Revenue (US$ Mn) Market Share by By Technologyin 2022
- Figure 106: APAC Next Generation Cancer Diagnostics Market Market Attractiveness Analysis by By Technology, 2016-2032
- Figure 107: APAC Next Generation Cancer Diagnostics Market Revenue (US$ Mn) Market Share by By Applicationin 2022
- Figure 108: APAC Next Generation Cancer Diagnostics Market Market Attractiveness Analysis by By Application, 2016-2032
- Figure 109: APAC Next Generation Cancer Diagnostics Market Revenue (US$ Mn) Market Share by By Cancer Typein 2022
- Figure 110: APAC Next Generation Cancer Diagnostics Market Market Attractiveness Analysis by By Cancer Type, 2016-2032
- Figure 111: APAC Next Generation Cancer Diagnostics Market Revenue (US$ Mn) Market Share by By Functionin 2022
- Figure 112: APAC Next Generation Cancer Diagnostics Market Market Attractiveness Analysis by By Function, 2016-2032
- Figure 113: APAC Next Generation Cancer Diagnostics Market Revenue (US$ Mn) Market Share by Country in 2022
- Figure 114: APAC Next Generation Cancer Diagnostics Market Market Attractiveness Analysis by Country, 2016-2032
- Figure 115: APAC Next Generation Cancer Diagnostics Market Market Revenue (US$ Mn) (2016-2032)
- Figure 116: APAC Next Generation Cancer Diagnostics Market Market Revenue (US$ Mn) Comparison by Country (2016-2032)
- Figure 117: APAC Next Generation Cancer Diagnostics Market Market Revenue (US$ Mn) Comparison by By Technology (2016-2032)
- Figure 118: APAC Next Generation Cancer Diagnostics Market Market Revenue (US$ Mn) Comparison by By Application (2016-2032)
- Figure 119: APAC Next Generation Cancer Diagnostics Market Market Revenue (US$ Mn) Comparison by By Cancer Type (2016-2032)
- Figure 120: APAC Next Generation Cancer Diagnostics Market Market Revenue (US$ Mn) Comparison by By Function (2016-2032)
- Figure 121: APAC Next Generation Cancer Diagnostics Market Market Y-o-Y Growth Rate Comparison by Country (2016-2032)
- Figure 122: APAC Next Generation Cancer Diagnostics Market Market Y-o-Y Growth Rate Comparison by By Technology (2016-2032)
- Figure 123: APAC Next Generation Cancer Diagnostics Market Market Y-o-Y Growth Rate Comparison by By Application (2016-2032)
- Figure 124: APAC Next Generation Cancer Diagnostics Market Market Y-o-Y Growth Rate Comparison by By Cancer Type (2016-2032)
- Figure 125: APAC Next Generation Cancer Diagnostics Market Market Y-o-Y Growth Rate Comparison by By Function (2016-2032)
- Figure 126: APAC Next Generation Cancer Diagnostics Market Market Share Comparison by Country (2016-2032)
- Figure 127: APAC Next Generation Cancer Diagnostics Market Market Share Comparison by By Technology (2016-2032)
- Figure 128: APAC Next Generation Cancer Diagnostics Market Market Share Comparison by By Application (2016-2032)
- Figure 129: APAC Next Generation Cancer Diagnostics Market Market Share Comparison by By Cancer Type (2016-2032)
- Figure 130: APAC Next Generation Cancer Diagnostics Market Market Share Comparison by By Function (2016-2032)
- Figure 131: Latin America Next Generation Cancer Diagnostics Market Revenue (US$ Mn) Market Share by By Technologyin 2022
- Figure 132: Latin America Next Generation Cancer Diagnostics Market Market Attractiveness Analysis by By Technology, 2016-2032
- Figure 133: Latin America Next Generation Cancer Diagnostics Market Revenue (US$ Mn) Market Share by By Applicationin 2022
- Figure 134: Latin America Next Generation Cancer Diagnostics Market Market Attractiveness Analysis by By Application, 2016-2032
- Figure 135: Latin America Next Generation Cancer Diagnostics Market Revenue (US$ Mn) Market Share by By Cancer Typein 2022
- Figure 136: Latin America Next Generation Cancer Diagnostics Market Market Attractiveness Analysis by By Cancer Type, 2016-2032
- Figure 137: Latin America Next Generation Cancer Diagnostics Market Revenue (US$ Mn) Market Share by By Functionin 2022
- Figure 138: Latin America Next Generation Cancer Diagnostics Market Market Attractiveness Analysis by By Function, 2016-2032
- Figure 139: Latin America Next Generation Cancer Diagnostics Market Revenue (US$ Mn) Market Share by Country in 2022
- Figure 140: Latin America Next Generation Cancer Diagnostics Market Market Attractiveness Analysis by Country, 2016-2032
- Figure 141: Latin America Next Generation Cancer Diagnostics Market Market Revenue (US$ Mn) (2016-2032)
- Figure 142: Latin America Next Generation Cancer Diagnostics Market Market Revenue (US$ Mn) Comparison by Country (2016-2032)
- Figure 143: Latin America Next Generation Cancer Diagnostics Market Market Revenue (US$ Mn) Comparison by By Technology (2016-2032)
- Figure 144: Latin America Next Generation Cancer Diagnostics Market Market Revenue (US$ Mn) Comparison by By Application (2016-2032)
- Figure 145: Latin America Next Generation Cancer Diagnostics Market Market Revenue (US$ Mn) Comparison by By Cancer Type (2016-2032)
- Figure 146: Latin America Next Generation Cancer Diagnostics Market Market Revenue (US$ Mn) Comparison by By Function (2016-2032)
- Figure 147: Latin America Next Generation Cancer Diagnostics Market Market Y-o-Y Growth Rate Comparison by Country (2016-2032)
- Figure 148: Latin America Next Generation Cancer Diagnostics Market Market Y-o-Y Growth Rate Comparison by By Technology (2016-2032)
- Figure 149: Latin America Next Generation Cancer Diagnostics Market Market Y-o-Y Growth Rate Comparison by By Application (2016-2032)
- Figure 150: Latin America Next Generation Cancer Diagnostics Market Market Y-o-Y Growth Rate Comparison by By Cancer Type (2016-2032)
- Figure 151: Latin America Next Generation Cancer Diagnostics Market Market Y-o-Y Growth Rate Comparison by By Function (2016-2032)
- Figure 152: Latin America Next Generation Cancer Diagnostics Market Market Share Comparison by Country (2016-2032)
- Figure 153: Latin America Next Generation Cancer Diagnostics Market Market Share Comparison by By Technology (2016-2032)
- Figure 154: Latin America Next Generation Cancer Diagnostics Market Market Share Comparison by By Application (2016-2032)
- Figure 155: Latin America Next Generation Cancer Diagnostics Market Market Share Comparison by By Cancer Type (2016-2032)
- Figure 156: Latin America Next Generation Cancer Diagnostics Market Market Share Comparison by By Function (2016-2032)
- Figure 157: Middle East & Africa Next Generation Cancer Diagnostics Market Revenue (US$ Mn) Market Share by By Technologyin 2022
- Figure 158: Middle East & Africa Next Generation Cancer Diagnostics Market Market Attractiveness Analysis by By Technology, 2016-2032
- Figure 159: Middle East & Africa Next Generation Cancer Diagnostics Market Revenue (US$ Mn) Market Share by By Applicationin 2022
- Figure 160: Middle East & Africa Next Generation Cancer Diagnostics Market Market Attractiveness Analysis by By Application, 2016-2032
- Figure 161: Middle East & Africa Next Generation Cancer Diagnostics Market Revenue (US$ Mn) Market Share by By Cancer Typein 2022
- Figure 162: Middle East & Africa Next Generation Cancer Diagnostics Market Market Attractiveness Analysis by By Cancer Type, 2016-2032
- Figure 163: Middle East & Africa Next Generation Cancer Diagnostics Market Revenue (US$ Mn) Market Share by By Functionin 2022
- Figure 164: Middle East & Africa Next Generation Cancer Diagnostics Market Market Attractiveness Analysis by By Function, 2016-2032
- Figure 165: Middle East & Africa Next Generation Cancer Diagnostics Market Revenue (US$ Mn) Market Share by Country in 2022
- Figure 166: Middle East & Africa Next Generation Cancer Diagnostics Market Market Attractiveness Analysis by Country, 2016-2032
- Figure 167: Middle East & Africa Next Generation Cancer Diagnostics Market Market Revenue (US$ Mn) (2016-2032)
- Figure 168: Middle East & Africa Next Generation Cancer Diagnostics Market Market Revenue (US$ Mn) Comparison by Country (2016-2032)
- Figure 169: Middle East & Africa Next Generation Cancer Diagnostics Market Market Revenue (US$ Mn) Comparison by By Technology (2016-2032)
- Figure 170: Middle East & Africa Next Generation Cancer Diagnostics Market Market Revenue (US$ Mn) Comparison by By Application (2016-2032)
- Figure 171: Middle East & Africa Next Generation Cancer Diagnostics Market Market Revenue (US$ Mn) Comparison by By Cancer Type (2016-2032)
- Figure 172: Middle East & Africa Next Generation Cancer Diagnostics Market Market Revenue (US$ Mn) Comparison by By Function (2016-2032)
- Figure 173: Middle East & Africa Next Generation Cancer Diagnostics Market Market Y-o-Y Growth Rate Comparison by Country (2016-2032)
- Figure 174: Middle East & Africa Next Generation Cancer Diagnostics Market Market Y-o-Y Growth Rate Comparison by By Technology (2016-2032)
- Figure 175: Middle East & Africa Next Generation Cancer Diagnostics Market Market Y-o-Y Growth Rate Comparison by By Application (2016-2032)
- Figure 176: Middle East & Africa Next Generation Cancer Diagnostics Market Market Y-o-Y Growth Rate Comparison by By Cancer Type (2016-2032)
- Figure 177: Middle East & Africa Next Generation Cancer Diagnostics Market Market Y-o-Y Growth Rate Comparison by By Function (2016-2032)
- Figure 178: Middle East & Africa Next Generation Cancer Diagnostics Market Market Share Comparison by Country (2016-2032)
- Figure 179: Middle East & Africa Next Generation Cancer Diagnostics Market Market Share Comparison by By Technology (2016-2032)
- Figure 180: Middle East & Africa Next Generation Cancer Diagnostics Market Market Share Comparison by By Application (2016-2032)
- Figure 181: Middle East & Africa Next Generation Cancer Diagnostics Market Market Share Comparison by By Cancer Type (2016-2032)
- Figure 182: Middle East & Africa Next Generation Cancer Diagnostics Market Market Share Comparison by By Function (2016-2032)
"
- List of Tables
- "
- Table 1: Global Next Generation Cancer Diagnostics Market Market Comparison by By Technology (2016-2032)
- Table 2: Global Next Generation Cancer Diagnostics Market Market Comparison by By Application (2016-2032)
- Table 3: Global Next Generation Cancer Diagnostics Market Market Comparison by By Cancer Type (2016-2032)
- Table 4: Global Next Generation Cancer Diagnostics Market Market Comparison by By Function (2016-2032)
- Table 5: Global Next Generation Cancer Diagnostics Market Revenue (US$ Mn) Comparison by Region (2016-2032)
- Table 6: Global Next Generation Cancer Diagnostics Market Market Revenue (US$ Mn) (2016-2032)
- Table 7: Global Next Generation Cancer Diagnostics Market Market Revenue (US$ Mn) Comparison by Region (2016-2032)
- Table 8: Global Next Generation Cancer Diagnostics Market Market Revenue (US$ Mn) Comparison by By Technology (2016-2032)
- Table 9: Global Next Generation Cancer Diagnostics Market Market Revenue (US$ Mn) Comparison by By Application (2016-2032)
- Table 10: Global Next Generation Cancer Diagnostics Market Market Revenue (US$ Mn) Comparison by By Cancer Type (2016-2032)
- Table 11: Global Next Generation Cancer Diagnostics Market Market Revenue (US$ Mn) Comparison by By Function (2016-2032)
- Table 12: Global Next Generation Cancer Diagnostics Market Market Y-o-Y Growth Rate Comparison by Region (2016-2032)
- Table 13: Global Next Generation Cancer Diagnostics Market Market Y-o-Y Growth Rate Comparison by By Technology (2016-2032)
- Table 14: Global Next Generation Cancer Diagnostics Market Market Y-o-Y Growth Rate Comparison by By Application (2016-2032)
- Table 15: Global Next Generation Cancer Diagnostics Market Market Y-o-Y Growth Rate Comparison by By Cancer Type (2016-2032)
- Table 16: Global Next Generation Cancer Diagnostics Market Market Y-o-Y Growth Rate Comparison by By Function (2016-2032)
- Table 17: Global Next Generation Cancer Diagnostics Market Market Share Comparison by Region (2016-2032)
- Table 18: Global Next Generation Cancer Diagnostics Market Market Share Comparison by By Technology (2016-2032)
- Table 19: Global Next Generation Cancer Diagnostics Market Market Share Comparison by By Application (2016-2032)
- Table 20: Global Next Generation Cancer Diagnostics Market Market Share Comparison by By Cancer Type (2016-2032)
- Table 21: Global Next Generation Cancer Diagnostics Market Market Share Comparison by By Function (2016-2032)
- Table 22: North America Next Generation Cancer Diagnostics Market Market Comparison by By Application (2016-2032)
- Table 23: North America Next Generation Cancer Diagnostics Market Market Comparison by By Cancer Type (2016-2032)
- Table 24: North America Next Generation Cancer Diagnostics Market Market Comparison by By Function (2016-2032)
- Table 25: North America Next Generation Cancer Diagnostics Market Revenue (US$ Mn) Comparison by Country (2016-2032)
- Table 26: North America Next Generation Cancer Diagnostics Market Market Revenue (US$ Mn) (2016-2032)
- Table 27: North America Next Generation Cancer Diagnostics Market Market Revenue (US$ Mn) Comparison by Country (2016-2032)
- Table 28: North America Next Generation Cancer Diagnostics Market Market Revenue (US$ Mn) Comparison by By Technology (2016-2032)
- Table 29: North America Next Generation Cancer Diagnostics Market Market Revenue (US$ Mn) Comparison by By Application (2016-2032)
- Table 30: North America Next Generation Cancer Diagnostics Market Market Revenue (US$ Mn) Comparison by By Cancer Type (2016-2032)
- Table 31: North America Next Generation Cancer Diagnostics Market Market Revenue (US$ Mn) Comparison by By Function (2016-2032)
- Table 32: North America Next Generation Cancer Diagnostics Market Market Y-o-Y Growth Rate Comparison by Country (2016-2032)
- Table 33: North America Next Generation Cancer Diagnostics Market Market Y-o-Y Growth Rate Comparison by By Technology (2016-2032)
- Table 34: North America Next Generation Cancer Diagnostics Market Market Y-o-Y Growth Rate Comparison by By Application (2016-2032)
- Table 35: North America Next Generation Cancer Diagnostics Market Market Y-o-Y Growth Rate Comparison by By Cancer Type (2016-2032)
- Table 36: North America Next Generation Cancer Diagnostics Market Market Y-o-Y Growth Rate Comparison by By Function (2016-2032)
- Table 37: North America Next Generation Cancer Diagnostics Market Market Share Comparison by Country (2016-2032)
- Table 38: North America Next Generation Cancer Diagnostics Market Market Share Comparison by By Technology (2016-2032)
- Table 39: North America Next Generation Cancer Diagnostics Market Market Share Comparison by By Application (2016-2032)
- Table 40: North America Next Generation Cancer Diagnostics Market Market Share Comparison by By Cancer Type (2016-2032)
- Table 41: North America Next Generation Cancer Diagnostics Market Market Share Comparison by By Function (2016-2032)
- Table 42: Western Europe Next Generation Cancer Diagnostics Market Market Comparison by By Technology (2016-2032)
- Table 43: Western Europe Next Generation Cancer Diagnostics Market Market Comparison by By Application (2016-2032)
- Table 44: Western Europe Next Generation Cancer Diagnostics Market Market Comparison by By Cancer Type (2016-2032)
- Table 45: Western Europe Next Generation Cancer Diagnostics Market Market Comparison by By Function (2016-2032)
- Table 46: Western Europe Next Generation Cancer Diagnostics Market Revenue (US$ Mn) Comparison by Country (2016-2032)
- Table 47: Western Europe Next Generation Cancer Diagnostics Market Market Revenue (US$ Mn) (2016-2032)
- Table 48: Western Europe Next Generation Cancer Diagnostics Market Market Revenue (US$ Mn) Comparison by Country (2016-2032)
- Table 49: Western Europe Next Generation Cancer Diagnostics Market Market Revenue (US$ Mn) Comparison by By Technology (2016-2032)
- Table 50: Western Europe Next Generation Cancer Diagnostics Market Market Revenue (US$ Mn) Comparison by By Application (2016-2032)
- Table 51: Western Europe Next Generation Cancer Diagnostics Market Market Revenue (US$ Mn) Comparison by By Cancer Type (2016-2032)
- Table 52: Western Europe Next Generation Cancer Diagnostics Market Market Revenue (US$ Mn) Comparison by By Function (2016-2032)
- Table 53: Western Europe Next Generation Cancer Diagnostics Market Market Y-o-Y Growth Rate Comparison by Country (2016-2032)
- Table 54: Western Europe Next Generation Cancer Diagnostics Market Market Y-o-Y Growth Rate Comparison by By Technology (2016-2032)
- Table 55: Western Europe Next Generation Cancer Diagnostics Market Market Y-o-Y Growth Rate Comparison by By Application (2016-2032)
- Table 56: Western Europe Next Generation Cancer Diagnostics Market Market Y-o-Y Growth Rate Comparison by By Cancer Type (2016-2032)
- Table 57: Western Europe Next Generation Cancer Diagnostics Market Market Y-o-Y Growth Rate Comparison by By Function (2016-2032)
- Table 58: Western Europe Next Generation Cancer Diagnostics Market Market Share Comparison by Country (2016-2032)
- Table 59: Western Europe Next Generation Cancer Diagnostics Market Market Share Comparison by By Technology (2016-2032)
- Table 60: Western Europe Next Generation Cancer Diagnostics Market Market Share Comparison by By Application (2016-2032)
- Table 61: Western Europe Next Generation Cancer Diagnostics Market Market Share Comparison by By Cancer Type (2016-2032)
- Table 62: Western Europe Next Generation Cancer Diagnostics Market Market Share Comparison by By Function (2016-2032)
- Table 63: Eastern Europe Next Generation Cancer Diagnostics Market Market Comparison by By Technology (2016-2032)
- Table 64: Eastern Europe Next Generation Cancer Diagnostics Market Market Comparison by By Application (2016-2032)
- Table 65: Eastern Europe Next Generation Cancer Diagnostics Market Market Comparison by By Cancer Type (2016-2032)
- Table 66: Eastern Europe Next Generation Cancer Diagnostics Market Market Comparison by By Function (2016-2032)
- Table 67: Eastern Europe Next Generation Cancer Diagnostics Market Revenue (US$ Mn) Comparison by Country (2016-2032)
- Table 68: Eastern Europe Next Generation Cancer Diagnostics Market Market Revenue (US$ Mn) (2016-2032)
- Table 69: Eastern Europe Next Generation Cancer Diagnostics Market Market Revenue (US$ Mn) Comparison by Country (2016-2032)
- Table 70: Eastern Europe Next Generation Cancer Diagnostics Market Market Revenue (US$ Mn) Comparison by By Technology (2016-2032)
- Table 71: Eastern Europe Next Generation Cancer Diagnostics Market Market Revenue (US$ Mn) Comparison by By Application (2016-2032)
- Table 72: Eastern Europe Next Generation Cancer Diagnostics Market Market Revenue (US$ Mn) Comparison by By Cancer Type (2016-2032)
- Table 73: Eastern Europe Next Generation Cancer Diagnostics Market Market Revenue (US$ Mn) Comparison by By Function (2016-2032)
- Table 74: Eastern Europe Next Generation Cancer Diagnostics Market Market Y-o-Y Growth Rate Comparison by Country (2016-2032)
- Table 75: Eastern Europe Next Generation Cancer Diagnostics Market Market Y-o-Y Growth Rate Comparison by By Technology (2016-2032)
- Table 76: Eastern Europe Next Generation Cancer Diagnostics Market Market Y-o-Y Growth Rate Comparison by By Application (2016-2032)
- Table 77: Eastern Europe Next Generation Cancer Diagnostics Market Market Y-o-Y Growth Rate Comparison by By Cancer Type (2016-2032)
- Table 78: Eastern Europe Next Generation Cancer Diagnostics Market Market Y-o-Y Growth Rate Comparison by By Function (2016-2032)
- Table 79: Eastern Europe Next Generation Cancer Diagnostics Market Market Share Comparison by Country (2016-2032)
- Table 80: Eastern Europe Next Generation Cancer Diagnostics Market Market Share Comparison by By Technology (2016-2032)
- Table 81: Eastern Europe Next Generation Cancer Diagnostics Market Market Share Comparison by By Application (2016-2032)
- Table 82: Eastern Europe Next Generation Cancer Diagnostics Market Market Share Comparison by By Cancer Type (2016-2032)
- Table 83: Eastern Europe Next Generation Cancer Diagnostics Market Market Share Comparison by By Function (2016-2032)
- Table 84: APAC Next Generation Cancer Diagnostics Market Market Comparison by By Technology (2016-2032)
- Table 85: APAC Next Generation Cancer Diagnostics Market Market Comparison by By Application (2016-2032)
- Table 86: APAC Next Generation Cancer Diagnostics Market Market Comparison by By Cancer Type (2016-2032)
- Table 87: APAC Next Generation Cancer Diagnostics Market Market Comparison by By Function (2016-2032)
- Table 88: APAC Next Generation Cancer Diagnostics Market Revenue (US$ Mn) Comparison by Country (2016-2032)
- Table 89: APAC Next Generation Cancer Diagnostics Market Market Revenue (US$ Mn) (2016-2032)
- Table 90: APAC Next Generation Cancer Diagnostics Market Market Revenue (US$ Mn) Comparison by Country (2016-2032)
- Table 91: APAC Next Generation Cancer Diagnostics Market Market Revenue (US$ Mn) Comparison by By Technology (2016-2032)
- Table 92: APAC Next Generation Cancer Diagnostics Market Market Revenue (US$ Mn) Comparison by By Application (2016-2032)
- Table 93: APAC Next Generation Cancer Diagnostics Market Market Revenue (US$ Mn) Comparison by By Cancer Type (2016-2032)
- Table 94: APAC Next Generation Cancer Diagnostics Market Market Revenue (US$ Mn) Comparison by By Function (2016-2032)
- Table 95: APAC Next Generation Cancer Diagnostics Market Market Y-o-Y Growth Rate Comparison by Country (2016-2032)
- Table 96: APAC Next Generation Cancer Diagnostics Market Market Y-o-Y Growth Rate Comparison by By Technology (2016-2032)
- Table 97: APAC Next Generation Cancer Diagnostics Market Market Y-o-Y Growth Rate Comparison by By Application (2016-2032)
- Table 98: APAC Next Generation Cancer Diagnostics Market Market Y-o-Y Growth Rate Comparison by By Cancer Type (2016-2032)
- Table 99: APAC Next Generation Cancer Diagnostics Market Market Y-o-Y Growth Rate Comparison by By Function (2016-2032)
- Table 100: APAC Next Generation Cancer Diagnostics Market Market Share Comparison by Country (2016-2032)
- Table 101: APAC Next Generation Cancer Diagnostics Market Market Share Comparison by By Technology (2016-2032)
- Table 102: APAC Next Generation Cancer Diagnostics Market Market Share Comparison by By Application (2016-2032)
- Table 103: APAC Next Generation Cancer Diagnostics Market Market Share Comparison by By Cancer Type (2016-2032)
- Table 104: APAC Next Generation Cancer Diagnostics Market Market Share Comparison by By Function (2016-2032)
- Table 105: Latin America Next Generation Cancer Diagnostics Market Market Comparison by By Technology (2016-2032)
- Table 106: Latin America Next Generation Cancer Diagnostics Market Market Comparison by By Application (2016-2032)
- Table 107: Latin America Next Generation Cancer Diagnostics Market Market Comparison by By Cancer Type (2016-2032)
- Table 108: Latin America Next Generation Cancer Diagnostics Market Market Comparison by By Function (2016-2032)
- Table 109: Latin America Next Generation Cancer Diagnostics Market Revenue (US$ Mn) Comparison by Country (2016-2032)
- Table 110: Latin America Next Generation Cancer Diagnostics Market Market Revenue (US$ Mn) (2016-2032)
- Table 111: Latin America Next Generation Cancer Diagnostics Market Market Revenue (US$ Mn) Comparison by Country (2016-2032)
- Table 112: Latin America Next Generation Cancer Diagnostics Market Market Revenue (US$ Mn) Comparison by By Technology (2016-2032)
- Table 113: Latin America Next Generation Cancer Diagnostics Market Market Revenue (US$ Mn) Comparison by By Application (2016-2032)
- Table 114: Latin America Next Generation Cancer Diagnostics Market Market Revenue (US$ Mn) Comparison by By Cancer Type (2016-2032)
- Table 115: Latin America Next Generation Cancer Diagnostics Market Market Revenue (US$ Mn) Comparison by By Function (2016-2032)
- Table 116: Latin America Next Generation Cancer Diagnostics Market Market Y-o-Y Growth Rate Comparison by Country (2016-2032)
- Table 117: Latin America Next Generation Cancer Diagnostics Market Market Y-o-Y Growth Rate Comparison by By Technology (2016-2032)
- Table 118: Latin America Next Generation Cancer Diagnostics Market Market Y-o-Y Growth Rate Comparison by By Application (2016-2032)
- Table 119: Latin America Next Generation Cancer Diagnostics Market Market Y-o-Y Growth Rate Comparison by By Cancer Type (2016-2032)
- Table 120: Latin America Next Generation Cancer Diagnostics Market Market Y-o-Y Growth Rate Comparison by By Function (2016-2032)
- Table 121: Latin America Next Generation Cancer Diagnostics Market Market Share Comparison by Country (2016-2032)
- Table 122: Latin America Next Generation Cancer Diagnostics Market Market Share Comparison by By Technology (2016-2032)
- Table 123: Latin America Next Generation Cancer Diagnostics Market Market Share Comparison by By Application (2016-2032)
- Table 124: Latin America Next Generation Cancer Diagnostics Market Market Share Comparison by By Cancer Type (2016-2032)
- Table 125: Latin America Next Generation Cancer Diagnostics Market Market Share Comparison by By Function (2016-2032)
- Table 126: Middle East & Africa Next Generation Cancer Diagnostics Market Market Comparison by By Technology (2016-2032)
- Table 127: Middle East & Africa Next Generation Cancer Diagnostics Market Market Comparison by By Application (2016-2032)
- Table 128: Middle East & Africa Next Generation Cancer Diagnostics Market Market Comparison by By Cancer Type (2016-2032)
- Table 129: Middle East & Africa Next Generation Cancer Diagnostics Market Market Comparison by By Function (2016-2032)
- Table 130: Middle East & Africa Next Generation Cancer Diagnostics Market Revenue (US$ Mn) Comparison by Country (2016-2032)
- Table 131: Middle East & Africa Next Generation Cancer Diagnostics Market Market Revenue (US$ Mn) (2016-2032)
- Table 132: Middle East & Africa Next Generation Cancer Diagnostics Market Market Revenue (US$ Mn) Comparison by Country (2016-2032)
- Table 133: Middle East & Africa Next Generation Cancer Diagnostics Market Market Revenue (US$ Mn) Comparison by By Technology (2016-2032)
- Table 134: Middle East & Africa Next Generation Cancer Diagnostics Market Market Revenue (US$ Mn) Comparison by By Application (2016-2032)
- Table 135: Middle East & Africa Next Generation Cancer Diagnostics Market Market Revenue (US$ Mn) Comparison by By Cancer Type (2016-2032)
- Table 136: Middle East & Africa Next Generation Cancer Diagnostics Market Market Revenue (US$ Mn) Comparison by By Function (2016-2032)
- Table 137: Middle East & Africa Next Generation Cancer Diagnostics Market Market Y-o-Y Growth Rate Comparison by Country (2016-2032)
- Table 138: Middle East & Africa Next Generation Cancer Diagnostics Market Market Y-o-Y Growth Rate Comparison by By Technology (2016-2032)
- Table 139: Middle East & Africa Next Generation Cancer Diagnostics Market Market Y-o-Y Growth Rate Comparison by By Application (2016-2032)
- Table 140: Middle East & Africa Next Generation Cancer Diagnostics Market Market Y-o-Y Growth Rate Comparison by By Cancer Type (2016-2032)
- Table 141: Middle East & Africa Next Generation Cancer Diagnostics Market Market Y-o-Y Growth Rate Comparison by By Function (2016-2032)
- Table 142: Middle East & Africa Next Generation Cancer Diagnostics Market Market Share Comparison by Country (2016-2032)
- Table 143: Middle East & Africa Next Generation Cancer Diagnostics Market Market Share Comparison by By Technology (2016-2032)
- Table 144: Middle East & Africa Next Generation Cancer Diagnostics Market Market Share Comparison by By Application (2016-2032)
- Table 145: Middle East & Africa Next Generation Cancer Diagnostics Market Market Share Comparison by By Cancer Type (2016-2032)
- Table 146: Middle East & Africa Next Generation Cancer Diagnostics Market Market Share Comparison by By Function (2016-2032)
- 1. Executive Summary
-
- Cepheid
- Koninklijke Philips N.V.
- F. Hoffmann-La Roche Ltd
- Qiagen
- Novartis AG
- Abbott Laboratories.
- Thermo Fisher Scientific Inc.
- Opko Health
- Myriad Genetics
- Agilent Technologies
- GE Healthcare
- PerkinElmer
- Genomic Health
- Illumina Inc.
- Hologic Inc.
- Sysmex Corporation
- Danaher Corporation
- Johnson & Johnson
- Siemens Healthineers AG
- Bio-Rad Laboratories
Our Clients


View Our Licence Options
