
Nephrology Drugs Market By Drug Class (ACE inhibitors, Angiotensin receptor blockers (ARBs), Others), Phosphate binders, Others), By Route of Administration (Oral, Parenteral drugs), By Distribution Channel, By Region And Companies - Industry Segment Outlook, Market Assessment, Competition Scenario, Trends And Forecast 2023-2032
-
41714
-
Oct 2023
-
167
-


-
This report was compiled by Correspondence Linkedin | Detailed Market research Methodology Our methodology involves a mix of primary research, including interviews with leading mental health experts, and secondary research from reputable medical journals and databases. View Detailed Methodology Page
-
Quick Navigation
Report Overview
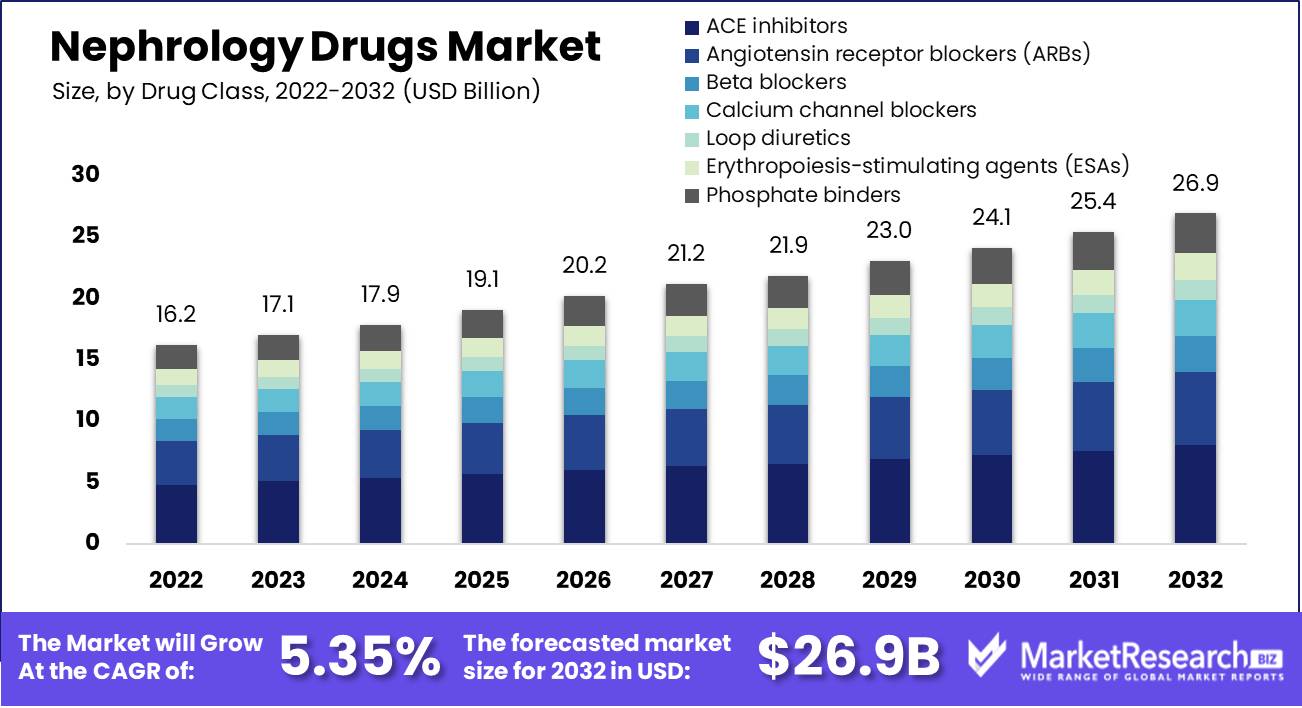
Nephrology Drugs Market size is expected to be worth around USD 26.9 Bn by 2032 from USD 16.2 Bn in 2022, growing at a compound annual growth rate of 5.35% during the forecast period from 2023 to 2032.
Nephrology drugs are prescribed to treat various kidney-related conditions such as chronic kidney disease, diabetic nephropathy, kidney infections, and acute kidney injury. Their increasing prevalence coupled with an aging population is driving this market's expansion. Furthermore, ESRD patients play a pivotal role in its success story and further fuel its expansion.
Novo Nordisk recently made headlines when it entered the nephrology drugs market by purchasing late-stage hypertension and chronic kidney disease (CKD) medications from KBP Biosciences that have advanced through Phase 3 trials and show promise as potential therapies to treat uncontrolled hypertension or advanced CKD. Their strategic acquisition highlights nephrology's growing significance within healthcare as an industry; specifically their dedication towards meeting unfulfilled patient needs related to kidney issues.
Roxadustat from AstraZeneca received European Commission approval in June 2022 as a treatment option to address anemia among chronic kidney disease (CKD) patients, an often debilitating complication. This development marked a crucial step toward expanding treatment options available to those living with the chronic disease while offering new approaches for managing one of its more challenging symptoms.
In August 2023, the U.S. House of Representatives witnessed a critical development in further research and treatment for chronic kidney disease (CKD), with the introduction of the Chronic Kidney Disease Improvement in Research and Treatment Act (CKD-IRTA). This legislation showed recognition for advances required for nephrology care while increasing research options available to those affected by chronic kidney disease - strengthening pharmaceutical products available for kidney patients as well as overall care given.
As global kidney diseases increase with an aging population and lifestyle-related conditions such as diabetes and hypertension, so does the patient base. Furthermore, ongoing advances in research and development are providing new therapies and pharmaceuticals that give nephrology patients more treatment options available to them.
Awareness and proactive healthcare initiatives designed to identify kidney diseases at earlier stages are driving early intervention and ultimately market expansion. Further, strategic acquisitions and legislation such as Novo Nordisk's Chronic Kidney Disease Improvement in Research and Treatment Act show the industry's dedication to optimizing patient care while driving the growth of its market for nephrology pharmaceuticals.
Driving factors
Rising Incidence of Chronic Kidney Disease
One major driver for the growth of the nephrology drugs market is due to increasing prevalence of chronic kidney disease, due to its increasing incidence.
Product Innovation
One key trend gaining ground in the nephrology drugs market is product innovation. Companies are focused on developing new medications or improving existing ones to meet rising demands for effective therapies. AstraZeneca recently gained FDA approval for its anemia drug roxadustat for treating anemia among those living with chronic kidney disease.
Increased Geriatric Population
Aging is also one of the major drivers behind the expansion of the nephrology drug market, as as people age their risk for kidney disease increases significantly.
Technological Advancements
Technological advancements within the healthcare industry are also contributing to the expansion of the nephrology drugs market. New diagnostic tools and imaging techniques allow physicians to detect kidney diseases at an earlier stage, leading to improved treatment outcomes, thus creating greater demand for nephrology drugs.
Restraining Factors
High Cost of Nephrology Drugs
One of the main factors inhibiting growth in the market for nephrology drugs is their high cost, particularly in developing countries where healthcare access may be limited. This makes their adoption much less likely.
Stringent Regulatory Requirements
One factor holding back the growth of the nephrology drugs market is the stringent regulatory requirements that must be fulfilled for their approval for use. Approving new medications can be a long and expensive process as a result, many major companies hesitate to invest in developing new medicines in light of this uncertain regulatory environment.
Increased Incidence of Chronic Kidney Disease
One of the key challenges facing the market today is an increasing prevalence of chronic kidney disease (CKD) and end-stage renal disease (ESRD) globally, due to several factors like an aging population, rising rates of diabetes and hypertension as well as lifestyle changes.
High cost of treatment
One challenge facing the nephrology drugs market is its high treatment costs. Patients suffering from chronic kidney disease and end-stage renal disease need ongoing medical care, including dialysis or transplants which can be costly; thus prompting demand for more affordable and accessible therapies that can manage these conditions more effectively.
Drug Class Analysis
The market for nephrology drugs can be divided by drug class and application. Major drug categories in this market include ACE inhibitors, ARBs, beta-blockers, calcium channel blockers, loop diuretics, ESAs (erythropoiesis-stimulating agents), and phosphate binders.
ACE inhibitors segment held the largest market share in 2022 due to their widespread application in treating high blood pressure and heart failure by relaxing blood vessels, and they are projected to continue their dominance through 2032. ARBs were the second-most-popular class, commonly used to treat these ailments by blocking angiotensin II production; beta-blockers could potentially offer applications across high blood pressure, heart failure, and angina while growing at an estimated compound annual compound growth rate of 4.0% until 2032.
Calcium channel blockers for high blood pressure and arrhythmia, loop diuretics for edema and hypertension, ESAs to treat anemia associated with chronic kidney disease patients, and phosphate binders for treating hyperphosphatemia are other key drug classes.
Segmenting by application would analyze how nephrology drugs are prescribed for various diagnoses such as chronic kidney disease, diabetes, hypertension, and other renal conditions. Examining market share and growth trends by drug class and application provides further insight into the structure and future growth areas for the market for these products.
Route of Administration Analysis
The global nephrology drugs market can be divided by route of administration into oral and parenteral drugs, with oral drugs leading the pack by taking place directly by mouth while parenteral ones being administered through non-oral routes such as injection.
According to our research team, oral medications are expected to generate maximum revenue and experience the fastest growth through 2032. This is attributable to their convenience for self-administration by patients.
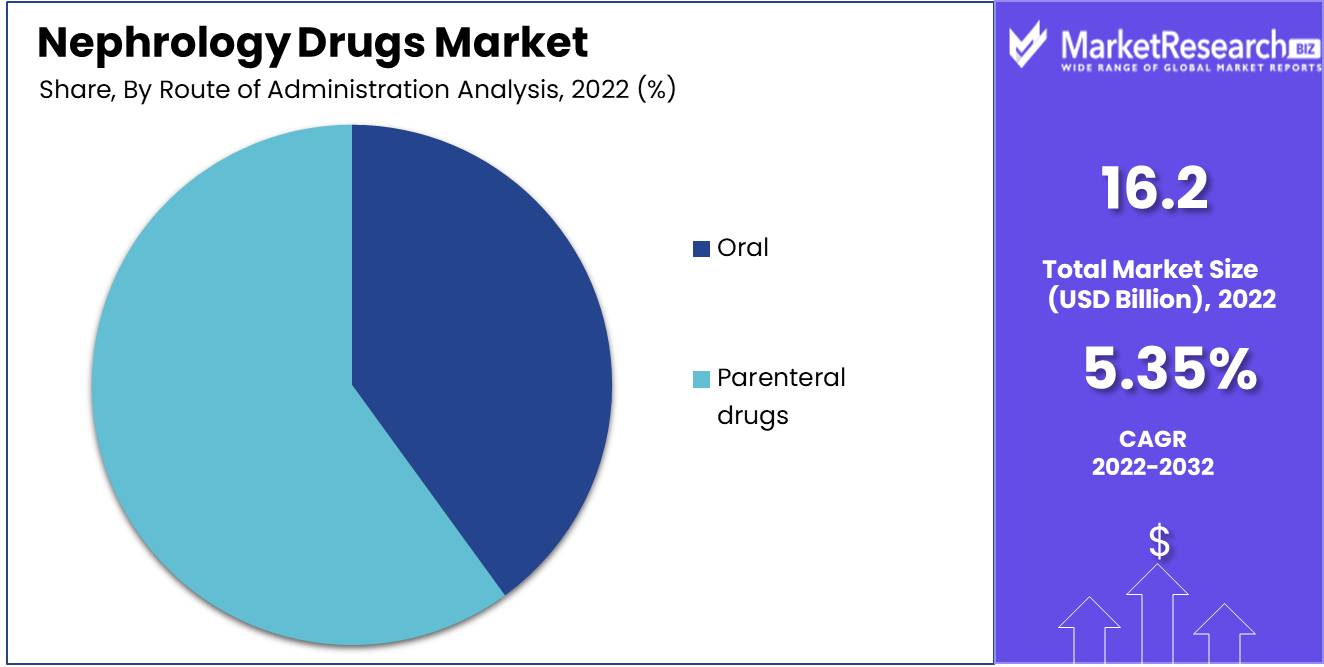
Parenteral drugs - injections, intravenous infusions, and other non-oral routes - are frequently utilized during acute situations requiring immediate action, so their sub-segment is expected to experience exponential growth during this forecast period despite being less convenient for patients.
Oral medication's ease of use is one-factor driving growth in this subsegment, while parenteral treatments will still hold onto an impressive share of the market due to their effectiveness and emergency use. Looking at the nephrology drugs market by route of administration provides further insight into key trends impacting its future growth and product development.
Distribution Channel Analysis
The global nephrology drugs market can be divided into three distribution channels, retail pharmacies, hospital pharmacies, and online pharmacies. Hospital pharmacies dominate due to hospitals being the primary points of care for people living with kidney diseases who require prescriptions of nephrology drugs in hospital settings.
Retail pharmacies remain an important segment in the global nephrology drugs market, accounting for approximately two-fifths of its overall share. Patients benefit from easily accessible retail pharmacies that provide an extensive range of nephrology drugs - making this option increasingly attractive for many patients.
Online pharmacies are becoming an increasingly popular distribution channel for nephrology drugs, offering patients the convenience of ordering their medications from home and having them sent directly. This segment of pharmacy sales is expected to experience explosive growth over the coming years.
Key Market Segmentation
By Drug Class
- ACE inhibitors
- Angiotensin receptor blockers (ARBs)
- Beta blockers
- Calcium channel blockers
- Loop diuretics
- Erythropoiesis-stimulating agents (ESAs)
- Phosphate binders
- Others
By Route of Administration
- Oral
- Parenteral drugs
By Distribution Channel
- Retail pharmacies
- Hospital pharmacies
- Online pharmacies
Growth Opportunity
- New medications to address specific pathways related to chronic kidney diseases (CKD) or end-stage kidney disease (ESRD) have become increasingly crucial. Such therapies may stop or slow disease progression while improving transplant results.
- Personalized treatments tailored specifically to an individual patient depend on factors like their medical history and genetic profile, such as biomarkers or diagnostic tools that identify those at risk of kidney disease and track their response to treatment.
- This report indicates that demand for erythropoietin-stimulating agents (ESAs) will likely surge over the coming years due to increasing rates of chronic kidney disease and anemia treatment. ESAs are used as treatments for anemia caused by this condition and will likely experience rapid expansion as more individuals seek solutions with them.
Latest Trends
Emergence of Chronic Nephrology Conditions and Aging
The rising incidence of chronic kidney ailments coupled with an aging population are major drivers behind an increase in demand for nephrology medications. Furthermore, poor lifestyle choices such as smoking cigarettes and poor eating habits contribute to an increase in chronic kidney cases.
Asia-Pacific as an Emerging Hotspot
The Asia-Pacific region is expected to experience rapid expansion over the coming years, due to an increasing number of individuals suffering from chronic kidney issues across China and India.
Global Intensity of Chronic Kidney Disease
Chronic kidney disease (CKD) is on the rise globally. CKD is one of the risk factors leading to end-stage renal disease (ESRD), which requires dialysis or transplantation in severe cases. With population aging and increased incidences of hypertension and diabetes globally, risks for CKD will only grow.
Biologic Therapies Gain Popularity
Demand for biologics has steadily been on the rise. Biologics are molecules made from living organisms and used to treat illnesses such as autoimmune disorders and cancer care among others. Within nephrology drug markets specifically, these agents such as erythropoietin-stimulating agents (ESAs) and monoclonal antibodies (mAbs) can treat anemia while decreasing inflammation respectively.
Regional Analysis
The global nephrology market can be divided into three regions - North America, Europe, and Asia Pacific. Of these regions, North America held the largest market share for nephrology drugs in 2022 - accounting for 44% of global market revenue due to high kidney-related disease prevalence as well as modern healthcare infrastructure availability being major drivers of growth here.
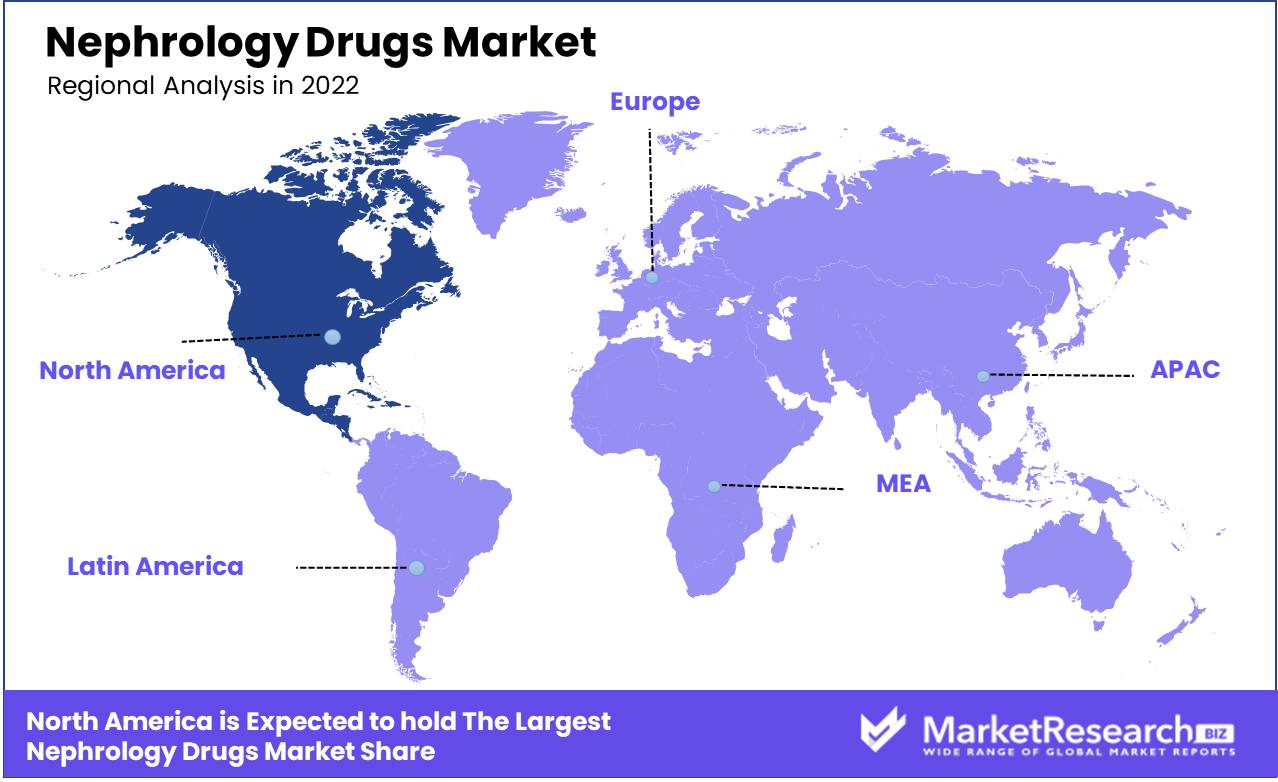
Europe is the second-largest market for nephrology medications globally, driven by increasing incidences of kidney disease among an aging population and access to new healthcare services.
Asia Pacific is projected to experience the fastest market expansion for nephrology medications over the forecast period. Rising kidney disease incidence, combined with a growing geriatric population and modern healthcare infrastructure and services will drive expansion here.
Nephrology drugs are poised for rapid expansion due to a rising burden of chronic diseases among aging populations and improved healthcare infrastructure in various regions; North America, Europe, and Asia Pacific will become key markets.
Key Regions and Countries
North America
- US
- Canada
- Mexico
Western Europe
- Germany
- France
- The UK
- Spain
- Italy
- Portugal
- Ireland
- Austria
- Switzerland
- Benelux
- Nordic
- Rest of Western Europe
Eastern Europe
- Russia
- Poland
- The Czech Republic
- Greece
- Rest of Eastern Europe
APAC
- China
- Japan
- South Korea
- India
- Australia & New Zealand
- Indonesia
- Malaysia
- Philippines
- Singapore
- Thailand
- Vietnam
- Rest of Asia Pacific
Latin America
- Brazil
- Colombia
- Chile
- Argentina
- Costa Rica
- Rest of Latin America
Middle East & Africa
- Algeria
- Egypt
- Israel
- Kuwait
- Nigeria
- Saudi Arabia
- South Africa
- Turkey
- United Arab Emirates
- Rest of Middle East
Key Players Analysis
- AstraZeneca PLC: is an international pharmaceutical company, producing medications designed to treat various kidney conditions such as type 2 diabetes. Their Farxiga treatment can treat this as well as chronic kidney issues.
- AbbVie Inc: As a research-driven pharmaceutical company that develops products to address various therapeutic areas such as Nephrology, AbbVie Inc is best known for producing Humira emulsion to treat autoimmune conditions like rheumatoid arthritis and psoriasis.
- Amgen Inc: Amgen Inc. is a biotechnology business that produces medicines to treat kidney diseases in various therapeutic areas, such as secondary hyperparathyroidism in adults living with chronic kidney diseases. Amgen products in this arena include Parsabiv for treating secondary hyperparathyroidism.
- F. Hoffmann-La Roche AG: FHLA is an internationally acclaimed pharmaceutical company known for offering innovative therapeutic solutions across various fields - such as CellCept (r), part of their nephrology offering that assists transplant recipients experiencing kidney rejection issues.
- Johnson &Johnson Inc: Johnson &Johnson is an international medical device, pharmaceutical, and consumer goods producer that is widely known for developing innovative therapies to treat kidney conditions such as Procrit for treating anemia as well as treating other symptoms of renal impairment.
Key Market Players
- Amgen Inc.
- AstraZeneca
- Pfizer Inc.
- Johnson & Johnson Inc
- F. Hoffmann-La Roche Ltd.
- Sanofi
- GlaxoSmithKline
- Otsuka Pharmaceutical Co., Ltd.
- Kyowa Hakko Kirin Co., Ltd.
- OPKO Health, Inc.
- FibroGen Inc
- Novartis AG
- Akebia Therapeutics Inc
Recent Development
- In August 2023, the U.S. House of Representatives saw a significant development in nephrology drugs and the treatment of chronic kidney disease (CKD) with the reintroduction of The Chronic Kidney Disease Improvement in Research and Treatment Act.
- Novo Nordisk has acquired late-stage hypertension and kidney disease drug from KBP Biosciences. The drug has reached Phase 3 testing as a potential treatment for uncontrolled hypertension and advanced chronic kidney disease. The deal is the latest in a series of acquisitions by Novo Nordisk aimed at expanding its presence in the nephrology drugs market.
- In June 2022, AstraZeneca announced that it had received approval from the European Commission for its drug roxadustat, used to treat anemia in chronic kidney disease patients.
- In May 2022, the US Food and Drug Administration (FDA) approved a new drug called Korsuva for the treatment of pruritus, or severe itching, in patients with chronic kidney disease undergoing hemodialysis.
- In September 2022, Boehringer Ingelheim announced that it had received approval from the European Medicines Agency for its drug Jardiance to be used in the treatment of chronic kidney disease.
Report Scope
Report Features Description Market Value (2022) USD 16.2Bn Forecast Revenue (2032) USD 26.9Bn CAGR (2023-2032) 5.35% Base Year for Estimation 2022 Historic Period 2016-2022 Forecast Period 2023-2032 Report Coverage Revenue Forecast, Market Dynamics, COVID-19 Impact, Competitive Landscape, Recent Developments Segments Covered By Drug Class (ACE inhibitors, Angiotensin receptor blockers (ARBs), Beta-blockers, Calcium channel blockers, Loop diuretics, Erythropoiesis-stimulating agents (ESAs), Phosphate binders, Others), By Route of Administration (Oral, Parenteral drugs), By Distribution Channel (Retail Pharmacies, Hospital Pharmacies, Online pharmacies) Regional Analysis North America – The US, Canada, Mexico, Latin America – Brazil, Colombia, Chile, Argentina, Costa Rica, & Rest of Latin America, Eastern Europe – Russia, Poland, The Czech Republic, Greece, Rest of Eastern Europe, Western Europe – Germany, France, The UK, Spain, Italy, Portugal, Ireland, Austria, Switzerland, Benelux, Nordic, Rest of Western Europe, APAC – China, Japan, South Korea, India, Australia & New Zealand, Indonesia, Malaysia, Philippines, Singapore, Thailand, Vietnam, Rest of APAC, Middle East & Africa – Algeria, Egypt, Israel, Kuwait, Nigeria, Saudi Arabia, South Africa, Turkey, United Arab Emirates, Rest of MEA Competitive Landscape Amgen Inc., AstraZeneca, Pfizer Inc., Johnson & Johnson, F. Hoffmann-La Roche Ltd., Sanofi, GlaxoSmithKline, Otsuka Pharmaceutical Co., Ltd., Kyowa Hakko Kirin Co., Ltd., OPKO Health, Inc. Customization Scope Customization for segments, region/country-level will be provided. Moreover, additional customization can be done based on the requirements. Purchase Options We have three licenses to opt for: Single User License, Multi-User License (Up to 5 Users), Corporate Use License (Unlimited User and Printable PDF) -
- 1. Executive Summary
- 1.1. Definition
- 1.2. Taxonomy
- 1.3. Research Scope
- 1.4. Key Analysis
- 1.5. Key Findings by Major Segments
- 1.6. Top strategies by Major Players
- 2. Global Nephrology Drugs Market Overview
- 2.1. Nephrology Drugs Market Dynamics
- 2.1.1. Drivers
- 2.1.2. Opportunities
- 2.1.3. Restraints
- 2.1.4. Challenges
- 2.2. Macro-economic Factors
- 2.3. Regulatory Framework
- 2.4. Market Investment Feasibility Index
- 2.5. PEST Analysis
- 2.6. PORTER’S Five Force Analysis
- 2.7. Drivers & Restraints Impact Analysis
- 2.8. Industry Chain Analysis
- 2.9. Cost Structure Analysis
- 2.10. Marketing Strategy
- 2.11. Russia-Ukraine War Impact Analysis
- 2.12. Opportunity Map Analysis
- 2.13. Market Competition Scenario Analysis
- 2.14. Product Life Cycle Analysis
- 2.15. Opportunity Orbits
- 2.16. Manufacturer Intensity Map
- 2.17. Major Companies sales by Value & Volume
- 2.1. Nephrology Drugs Market Dynamics
- 3. Global Nephrology Drugs Market Analysis, Opportunity and Forecast, 2016-2032
- 3.1. Global Nephrology Drugs Market Analysis, 2016-2021
- 3.2. Global Nephrology Drugs Market Opportunity and Forecast, 2023-2032
- 3.3. Global Nephrology Drugs Market Analysis, Opportunity and Forecast, By Drug Class, 2016-2032
- 3.3.1. Global Nephrology Drugs Market Analysis by Drug Class: Introduction
- 3.3.2. Market Size Absolute $ Opportunity Analysis and Forecast, By Drug Class, 2016-2032
- 3.3.3. ACE inhibitors
- 3.3.4. Angiotensin receptor blockers (ARBs)
- 3.3.5. Beta blockers
- 3.3.6. Calcium channel blockers
- 3.3.7. Loop diuretics
- 3.3.8. Erythropoiesis-stimulating agents (ESAs)
- 3.3.9. Phosphate binders
- 3.3.10. Others
- 3.4. Global Nephrology Drugs Market Analysis, Opportunity and Forecast, By Route of Administration, 2016-2032
- 3.4.1. Global Nephrology Drugs Market Analysis by Route of Administration: Introduction
- 3.4.2. Market Size Absolute $ Opportunity Analysis and Forecast, By Route of Administration, 2016-2032
- 3.4.3. Oral
- 3.4.4. Parenteral drugs
- 3.5. Global Nephrology Drugs Market Analysis, Opportunity and Forecast, By Distribution Channel, 2016-2032
- 3.5.1. Global Nephrology Drugs Market Analysis by Distribution Channel: Introduction
- 3.5.2. Market Size Absolute $ Opportunity Analysis and Forecast, By Distribution Channel, 2016-2032
- 3.5.3. Retail pharmacies
- 3.5.4. Hospital pharmacies
- 3.5.5. Online pharmacies
- 4. North America Nephrology Drugs Market Analysis, Opportunity and Forecast, 2016-2032
- 4.1. North America Nephrology Drugs Market Analysis, 2016-2021
- 4.2. North America Nephrology Drugs Market Opportunity and Forecast, 2023-2032
- 4.3. North America Nephrology Drugs Market Analysis, Opportunity and Forecast, By Drug Class, 2016-2032
- 4.3.1. North America Nephrology Drugs Market Analysis by Drug Class: Introduction
- 4.3.2. Market Size Absolute $ Opportunity Analysis and Forecast, By Drug Class, 2016-2032
- 4.3.3. ACE inhibitors
- 4.3.4. Angiotensin receptor blockers (ARBs)
- 4.3.5. Beta blockers
- 4.3.6. Calcium channel blockers
- 4.3.7. Loop diuretics
- 4.3.8. Erythropoiesis-stimulating agents (ESAs)
- 4.3.9. Phosphate binders
- 4.3.10. Others
- 4.4. North America Nephrology Drugs Market Analysis, Opportunity and Forecast, By Route of Administration, 2016-2032
- 4.4.1. North America Nephrology Drugs Market Analysis by Route of Administration: Introduction
- 4.4.2. Market Size Absolute $ Opportunity Analysis and Forecast, By Route of Administration, 2016-2032
- 4.4.3. Oral
- 4.4.4. Parenteral drugs
- 4.5. North America Nephrology Drugs Market Analysis, Opportunity and Forecast, By Distribution Channel, 2016-2032
- 4.5.1. North America Nephrology Drugs Market Analysis by Distribution Channel: Introduction
- 4.5.2. Market Size Absolute $ Opportunity Analysis and Forecast, By Distribution Channel, 2016-2032
- 4.5.3. Retail pharmacies
- 4.5.4. Hospital pharmacies
- 4.5.5. Online pharmacies
- 4.6. North America Nephrology Drugs Market Analysis, Opportunity and Forecast, By Country , 2016-2032
- 4.6.1. North America Nephrology Drugs Market Analysis by Country : Introduction
- 4.6.2. Market Size Absolute $ Opportunity Analysis and Forecast, Country , 2016-2032
- 4.6.2.1. The US
- 4.6.2.2. Canada
- 4.6.2.3. Mexico
- 5. Western Europe Nephrology Drugs Market Analysis, Opportunity and Forecast, 2016-2032
- 5.1. Western Europe Nephrology Drugs Market Analysis, 2016-2021
- 5.2. Western Europe Nephrology Drugs Market Opportunity and Forecast, 2023-2032
- 5.3. Western Europe Nephrology Drugs Market Analysis, Opportunity and Forecast, By Drug Class, 2016-2032
- 5.3.1. Western Europe Nephrology Drugs Market Analysis by Drug Class: Introduction
- 5.3.2. Market Size Absolute $ Opportunity Analysis and Forecast, By Drug Class, 2016-2032
- 5.3.3. ACE inhibitors
- 5.3.4. Angiotensin receptor blockers (ARBs)
- 5.3.5. Beta blockers
- 5.3.6. Calcium channel blockers
- 5.3.7. Loop diuretics
- 5.3.8. Erythropoiesis-stimulating agents (ESAs)
- 5.3.9. Phosphate binders
- 5.3.10. Others
- 5.4. Western Europe Nephrology Drugs Market Analysis, Opportunity and Forecast, By Route of Administration, 2016-2032
- 5.4.1. Western Europe Nephrology Drugs Market Analysis by Route of Administration: Introduction
- 5.4.2. Market Size Absolute $ Opportunity Analysis and Forecast, By Route of Administration, 2016-2032
- 5.4.3. Oral
- 5.4.4. Parenteral drugs
- 5.5. Western Europe Nephrology Drugs Market Analysis, Opportunity and Forecast, By Distribution Channel, 2016-2032
- 5.5.1. Western Europe Nephrology Drugs Market Analysis by Distribution Channel: Introduction
- 5.5.2. Market Size Absolute $ Opportunity Analysis and Forecast, By Distribution Channel, 2016-2032
- 5.5.3. Retail pharmacies
- 5.5.4. Hospital pharmacies
- 5.5.5. Online pharmacies
- 5.6. Western Europe Nephrology Drugs Market Analysis, Opportunity and Forecast, By Country , 2016-2032
- 5.6.1. Western Europe Nephrology Drugs Market Analysis by Country : Introduction
- 5.6.2. Market Size Absolute $ Opportunity Analysis and Forecast, Country , 2016-2032
- 5.6.2.1. Germany
- 5.6.2.2. France
- 5.6.2.3. The UK
- 5.6.2.4. Spain
- 5.6.2.5. Italy
- 5.6.2.6. Portugal
- 5.6.2.7. Ireland
- 5.6.2.8. Austria
- 5.6.2.9. Switzerland
- 5.6.2.10. Benelux
- 5.6.2.11. Nordic
- 5.6.2.12. Rest of Western Europe
- 6. Eastern Europe Nephrology Drugs Market Analysis, Opportunity and Forecast, 2016-2032
- 6.1. Eastern Europe Nephrology Drugs Market Analysis, 2016-2021
- 6.2. Eastern Europe Nephrology Drugs Market Opportunity and Forecast, 2023-2032
- 6.3. Eastern Europe Nephrology Drugs Market Analysis, Opportunity and Forecast, By Drug Class, 2016-2032
- 6.3.1. Eastern Europe Nephrology Drugs Market Analysis by Drug Class: Introduction
- 6.3.2. Market Size Absolute $ Opportunity Analysis and Forecast, By Drug Class, 2016-2032
- 6.3.3. ACE inhibitors
- 6.3.4. Angiotensin receptor blockers (ARBs)
- 6.3.5. Beta blockers
- 6.3.6. Calcium channel blockers
- 6.3.7. Loop diuretics
- 6.3.8. Erythropoiesis-stimulating agents (ESAs)
- 6.3.9. Phosphate binders
- 6.3.10. Others
- 6.4. Eastern Europe Nephrology Drugs Market Analysis, Opportunity and Forecast, By Route of Administration, 2016-2032
- 6.4.1. Eastern Europe Nephrology Drugs Market Analysis by Route of Administration: Introduction
- 6.4.2. Market Size Absolute $ Opportunity Analysis and Forecast, By Route of Administration, 2016-2032
- 6.4.3. Oral
- 6.4.4. Parenteral drugs
- 6.5. Eastern Europe Nephrology Drugs Market Analysis, Opportunity and Forecast, By Distribution Channel, 2016-2032
- 6.5.1. Eastern Europe Nephrology Drugs Market Analysis by Distribution Channel: Introduction
- 6.5.2. Market Size Absolute $ Opportunity Analysis and Forecast, By Distribution Channel, 2016-2032
- 6.5.3. Retail pharmacies
- 6.5.4. Hospital pharmacies
- 6.5.5. Online pharmacies
- 6.6. Eastern Europe Nephrology Drugs Market Analysis, Opportunity and Forecast, By Country , 2016-2032
- 6.6.1. Eastern Europe Nephrology Drugs Market Analysis by Country : Introduction
- 6.6.2. Market Size Absolute $ Opportunity Analysis and Forecast, Country , 2016-2032
- 6.6.2.1. Russia
- 6.6.2.2. Poland
- 6.6.2.3. The Czech Republic
- 6.6.2.4. Greece
- 6.6.2.5. Rest of Eastern Europe
- 7. APAC Nephrology Drugs Market Analysis, Opportunity and Forecast, 2016-2032
- 7.1. APAC Nephrology Drugs Market Analysis, 2016-2021
- 7.2. APAC Nephrology Drugs Market Opportunity and Forecast, 2023-2032
- 7.3. APAC Nephrology Drugs Market Analysis, Opportunity and Forecast, By Drug Class, 2016-2032
- 7.3.1. APAC Nephrology Drugs Market Analysis by Drug Class: Introduction
- 7.3.2. Market Size Absolute $ Opportunity Analysis and Forecast, By Drug Class, 2016-2032
- 7.3.3. ACE inhibitors
- 7.3.4. Angiotensin receptor blockers (ARBs)
- 7.3.5. Beta blockers
- 7.3.6. Calcium channel blockers
- 7.3.7. Loop diuretics
- 7.3.8. Erythropoiesis-stimulating agents (ESAs)
- 7.3.9. Phosphate binders
- 7.3.10. Others
- 7.4. APAC Nephrology Drugs Market Analysis, Opportunity and Forecast, By Route of Administration, 2016-2032
- 7.4.1. APAC Nephrology Drugs Market Analysis by Route of Administration: Introduction
- 7.4.2. Market Size Absolute $ Opportunity Analysis and Forecast, By Route of Administration, 2016-2032
- 7.4.3. Oral
- 7.4.4. Parenteral drugs
- 7.5. APAC Nephrology Drugs Market Analysis, Opportunity and Forecast, By Distribution Channel, 2016-2032
- 7.5.1. APAC Nephrology Drugs Market Analysis by Distribution Channel: Introduction
- 7.5.2. Market Size Absolute $ Opportunity Analysis and Forecast, By Distribution Channel, 2016-2032
- 7.5.3. Retail pharmacies
- 7.5.4. Hospital pharmacies
- 7.5.5. Online pharmacies
- 7.6. APAC Nephrology Drugs Market Analysis, Opportunity and Forecast, By Country , 2016-2032
- 7.6.1. APAC Nephrology Drugs Market Analysis by Country : Introduction
- 7.6.2. Market Size Absolute $ Opportunity Analysis and Forecast, Country , 2016-2032
- 7.6.2.1. China
- 7.6.2.2. Japan
- 7.6.2.3. South Korea
- 7.6.2.4. India
- 7.6.2.5. Australia & New Zeland
- 7.6.2.6. Indonesia
- 7.6.2.7. Malaysia
- 7.6.2.8. Philippines
- 7.6.2.9. Singapore
- 7.6.2.10. Thailand
- 7.6.2.11. Vietnam
- 7.6.2.12. Rest of APAC
- 8. Latin America Nephrology Drugs Market Analysis, Opportunity and Forecast, 2016-2032
- 8.1. Latin America Nephrology Drugs Market Analysis, 2016-2021
- 8.2. Latin America Nephrology Drugs Market Opportunity and Forecast, 2023-2032
- 8.3. Latin America Nephrology Drugs Market Analysis, Opportunity and Forecast, By Drug Class, 2016-2032
- 8.3.1. Latin America Nephrology Drugs Market Analysis by Drug Class: Introduction
- 8.3.2. Market Size Absolute $ Opportunity Analysis and Forecast, By Drug Class, 2016-2032
- 8.3.3. ACE inhibitors
- 8.3.4. Angiotensin receptor blockers (ARBs)
- 8.3.5. Beta blockers
- 8.3.6. Calcium channel blockers
- 8.3.7. Loop diuretics
- 8.3.8. Erythropoiesis-stimulating agents (ESAs)
- 8.3.9. Phosphate binders
- 8.3.10. Others
- 8.4. Latin America Nephrology Drugs Market Analysis, Opportunity and Forecast, By Route of Administration, 2016-2032
- 8.4.1. Latin America Nephrology Drugs Market Analysis by Route of Administration: Introduction
- 8.4.2. Market Size Absolute $ Opportunity Analysis and Forecast, By Route of Administration, 2016-2032
- 8.4.3. Oral
- 8.4.4. Parenteral drugs
- 8.5. Latin America Nephrology Drugs Market Analysis, Opportunity and Forecast, By Distribution Channel, 2016-2032
- 8.5.1. Latin America Nephrology Drugs Market Analysis by Distribution Channel: Introduction
- 8.5.2. Market Size Absolute $ Opportunity Analysis and Forecast, By Distribution Channel, 2016-2032
- 8.5.3. Retail pharmacies
- 8.5.4. Hospital pharmacies
- 8.5.5. Online pharmacies
- 8.6. Latin America Nephrology Drugs Market Analysis, Opportunity and Forecast, By Country , 2016-2032
- 8.6.1. Latin America Nephrology Drugs Market Analysis by Country : Introduction
- 8.6.2. Market Size Absolute $ Opportunity Analysis and Forecast, Country , 2016-2032
- 8.6.2.1. Brazil
- 8.6.2.2. Colombia
- 8.6.2.3. Chile
- 8.6.2.4. Argentina
- 8.6.2.5. Costa Rica
- 8.6.2.6. Rest of Latin America
- 9. Middle East & Africa Nephrology Drugs Market Analysis, Opportunity and Forecast, 2016-2032
- 9.1. Middle East & Africa Nephrology Drugs Market Analysis, 2016-2021
- 9.2. Middle East & Africa Nephrology Drugs Market Opportunity and Forecast, 2023-2032
- 9.3. Middle East & Africa Nephrology Drugs Market Analysis, Opportunity and Forecast, By Drug Class, 2016-2032
- 9.3.1. Middle East & Africa Nephrology Drugs Market Analysis by Drug Class: Introduction
- 9.3.2. Market Size Absolute $ Opportunity Analysis and Forecast, By Drug Class, 2016-2032
- 9.3.3. ACE inhibitors
- 9.3.4. Angiotensin receptor blockers (ARBs)
- 9.3.5. Beta blockers
- 9.3.6. Calcium channel blockers
- 9.3.7. Loop diuretics
- 9.3.8. Erythropoiesis-stimulating agents (ESAs)
- 9.3.9. Phosphate binders
- 9.3.10. Others
- 9.4. Middle East & Africa Nephrology Drugs Market Analysis, Opportunity and Forecast, By Route of Administration, 2016-2032
- 9.4.1. Middle East & Africa Nephrology Drugs Market Analysis by Route of Administration: Introduction
- 9.4.2. Market Size Absolute $ Opportunity Analysis and Forecast, By Route of Administration, 2016-2032
- 9.4.3. Oral
- 9.4.4. Parenteral drugs
- 9.5. Middle East & Africa Nephrology Drugs Market Analysis, Opportunity and Forecast, By Distribution Channel, 2016-2032
- 9.5.1. Middle East & Africa Nephrology Drugs Market Analysis by Distribution Channel: Introduction
- 9.5.2. Market Size Absolute $ Opportunity Analysis and Forecast, By Distribution Channel, 2016-2032
- 9.5.3. Retail pharmacies
- 9.5.4. Hospital pharmacies
- 9.5.5. Online pharmacies
- 9.6. Middle East & Africa Nephrology Drugs Market Analysis, Opportunity and Forecast, By Country , 2016-2032
- 9.6.1. Middle East & Africa Nephrology Drugs Market Analysis by Country : Introduction
- 9.6.2. Market Size Absolute $ Opportunity Analysis and Forecast, Country , 2016-2032
- 9.6.2.1. Algeria
- 9.6.2.2. Egypt
- 9.6.2.3. Israel
- 9.6.2.4. Kuwait
- 9.6.2.5. Nigeria
- 9.6.2.6. Saudi Arabia
- 9.6.2.7. South Africa
- 9.6.2.8. Turkey
- 9.6.2.9. The UAE
- 9.6.2.10. Rest of MEA
- 10. Global Nephrology Drugs Market Analysis, Opportunity and Forecast, By Region , 2016-2032
- 10.1. Global Nephrology Drugs Market Analysis by Region : Introduction
- 10.2. Market Size Absolute $ Opportunity Analysis and Forecast, By Region , 2016-2032
- 10.2.1. North America
- 10.2.2. Western Europe
- 10.2.3. Eastern Europe
- 10.2.4. APAC
- 10.2.5. Latin America
- 10.2.6. Middle East & Africa
- 11. Global Nephrology Drugs Market Competitive Landscape, Market Share Analysis, and Company Profiles
- 11.1. Market Share Analysis
- 11.2. Company Profiles
- 11.3. Amgen Inc.
- 11.3.1. Company Overview
- 11.3.2. Financial Highlights
- 11.3.3. Product Portfolio
- 11.3.4. SWOT Analysis
- 11.3.5. Key Strategies and Developments
- 11.4. AstraZeneca
- 11.4.1. Company Overview
- 11.4.2. Financial Highlights
- 11.4.3. Product Portfolio
- 11.4.4. SWOT Analysis
- 11.4.5. Key Strategies and Developments
- 11.5. Pfizer Inc.
- 11.5.1. Company Overview
- 11.5.2. Financial Highlights
- 11.5.3. Product Portfolio
- 11.5.4. SWOT Analysis
- 11.5.5. Key Strategies and Developments
- 11.6. Johnson & Johnson Inc
- 11.6.1. Company Overview
- 11.6.2. Financial Highlights
- 11.6.3. Product Portfolio
- 11.6.4. SWOT Analysis
- 11.6.5. Key Strategies and Developments
- 11.7. F. Hoffmann-La Roche Ltd.
- 11.7.1. Company Overview
- 11.7.2. Financial Highlights
- 11.7.3. Product Portfolio
- 11.7.4. SWOT Analysis
- 11.7.5. Key Strategies and Developments
- 11.8. Sanofi
- 11.8.1. Company Overview
- 11.8.2. Financial Highlights
- 11.8.3. Product Portfolio
- 11.8.4. SWOT Analysis
- 11.8.5. Key Strategies and Developments
- 11.9. GlaxoSmithKline
- 11.9.1. Company Overview
- 11.9.2. Financial Highlights
- 11.9.3. Product Portfolio
- 11.9.4. SWOT Analysis
- 11.9.5. Key Strategies and Developments
- 11.10. Otsuka Pharmaceutical Co., Ltd.
- 11.10.1. Company Overview
- 11.10.2. Financial Highlights
- 11.10.3. Product Portfolio
- 11.10.4. SWOT Analysis
- 11.10.5. Key Strategies and Developments
- 11.11. Kyowa Hakko Kirin Co., Ltd.
- 11.11.1. Company Overview
- 11.11.2. Financial Highlights
- 11.11.3. Product Portfolio
- 11.11.4. SWOT Analysis
- 11.11.5. Key Strategies and Developments
- 11.12. OPKO Health, Inc.
- 11.12.1. Company Overview
- 11.12.2. Financial Highlights
- 11.12.3. Product Portfolio
- 11.12.4. SWOT Analysis
- 11.12.5. Key Strategies and Developments
- 11.13. FibroGen Inc
- 11.13.1. Company Overview
- 11.13.2. Financial Highlights
- 11.13.3. Product Portfolio
- 11.13.4. SWOT Analysis
- 11.13.5. Key Strategies and Developments
- 11.14. Novartis AG
- 11.14.1. Company Overview
- 11.14.2. Financial Highlights
- 11.14.3. Product Portfolio
- 11.14.4. SWOT Analysis
- 11.14.5. Key Strategies and Developments
- 11.15. Akebia Therapeutics Inc
- 11.15.1. Company Overview
- 11.15.2. Financial Highlights
- 11.15.3. Product Portfolio
- 11.15.4. SWOT Analysis
- 11.15.5. Key Strategies and Developments
- 12. Assumptions and Acronyms
- 13. Research Methodology
- 14. Contact
- List of Figures
- Figure 1: Global Nephrology Drugs Market Revenue (US$ Mn) Market Share by Drug Class in 2022
- Figure 2: Global Nephrology Drugs Market Market Attractiveness Analysis by Drug Class, 2016-2032
- Figure 3: Global Nephrology Drugs Market Revenue (US$ Mn) Market Share by Route of Administrationin 2022
- Figure 4: Global Nephrology Drugs Market Market Attractiveness Analysis by Route of Administration, 2016-2032
- Figure 5: Global Nephrology Drugs Market Revenue (US$ Mn) Market Share by Distribution Channelin 2022
- Figure 6: Global Nephrology Drugs Market Market Attractiveness Analysis by Distribution Channel, 2016-2032
- Figure 7: Global Nephrology Drugs Market Revenue (US$ Mn) Market Share by Region in 2022
- Figure 8: Global Nephrology Drugs Market Market Attractiveness Analysis by Region, 2016-2032
- Figure 9: Global Nephrology Drugs Market Market Revenue (US$ Mn) (2016-2032)
- Figure 10: Global Nephrology Drugs Market Market Revenue (US$ Mn) Comparison by Region (2016-2032)
- Figure 11: Global Nephrology Drugs Market Market Revenue (US$ Mn) Comparison by Drug Class (2016-2032)
- Figure 12: Global Nephrology Drugs Market Market Revenue (US$ Mn) Comparison by Route of Administration (2016-2032)
- Figure 13: Global Nephrology Drugs Market Market Revenue (US$ Mn) Comparison by Distribution Channel (2016-2032)
- Figure 14: Global Nephrology Drugs Market Market Y-o-Y Growth Rate Comparison by Region (2016-2032)
- Figure 15: Global Nephrology Drugs Market Market Y-o-Y Growth Rate Comparison by Drug Class (2016-2032)
- Figure 16: Global Nephrology Drugs Market Market Y-o-Y Growth Rate Comparison by Route of Administration (2016-2032)
- Figure 17: Global Nephrology Drugs Market Market Y-o-Y Growth Rate Comparison by Distribution Channel (2016-2032)
- Figure 18: Global Nephrology Drugs Market Market Share Comparison by Region (2016-2032)
- Figure 19: Global Nephrology Drugs Market Market Share Comparison by Drug Class (2016-2032)
- Figure 20: Global Nephrology Drugs Market Market Share Comparison by Route of Administration (2016-2032)
- Figure 21: Global Nephrology Drugs Market Market Share Comparison by Distribution Channel (2016-2032)
- Figure 22: North America Nephrology Drugs Market Revenue (US$ Mn) Market Share by Drug Classin 2022
- Figure 23: North America Nephrology Drugs Market Market Attractiveness Analysis by Drug Class, 2016-2032
- Figure 24: North America Nephrology Drugs Market Revenue (US$ Mn) Market Share by Route of Administrationin 2022
- Figure 25: North America Nephrology Drugs Market Market Attractiveness Analysis by Route of Administration, 2016-2032
- Figure 26: North America Nephrology Drugs Market Revenue (US$ Mn) Market Share by Distribution Channelin 2022
- Figure 27: North America Nephrology Drugs Market Market Attractiveness Analysis by Distribution Channel, 2016-2032
- Figure 28: North America Nephrology Drugs Market Revenue (US$ Mn) Market Share by Country in 2022
- Figure 29: North America Nephrology Drugs Market Market Attractiveness Analysis by Country, 2016-2032
- Figure 30: North America Nephrology Drugs Market Market Revenue (US$ Mn) (2016-2032)
- Figure 31: North America Nephrology Drugs Market Market Revenue (US$ Mn) Comparison by Country (2016-2032)
- Figure 32: North America Nephrology Drugs Market Market Revenue (US$ Mn) Comparison by Drug Class (2016-2032)
- Figure 33: North America Nephrology Drugs Market Market Revenue (US$ Mn) Comparison by Route of Administration (2016-2032)
- Figure 34: North America Nephrology Drugs Market Market Revenue (US$ Mn) Comparison by Distribution Channel (2016-2032)
- Figure 35: North America Nephrology Drugs Market Market Y-o-Y Growth Rate Comparison by Country (2016-2032)
- Figure 36: North America Nephrology Drugs Market Market Y-o-Y Growth Rate Comparison by Drug Class (2016-2032)
- Figure 37: North America Nephrology Drugs Market Market Y-o-Y Growth Rate Comparison by Route of Administration (2016-2032)
- Figure 38: North America Nephrology Drugs Market Market Y-o-Y Growth Rate Comparison by Distribution Channel (2016-2032)
- Figure 39: North America Nephrology Drugs Market Market Share Comparison by Country (2016-2032)
- Figure 40: North America Nephrology Drugs Market Market Share Comparison by Drug Class (2016-2032)
- Figure 41: North America Nephrology Drugs Market Market Share Comparison by Route of Administration (2016-2032)
- Figure 42: North America Nephrology Drugs Market Market Share Comparison by Distribution Channel (2016-2032)
- Figure 43: Western Europe Nephrology Drugs Market Revenue (US$ Mn) Market Share by Drug Classin 2022
- Figure 44: Western Europe Nephrology Drugs Market Market Attractiveness Analysis by Drug Class, 2016-2032
- Figure 45: Western Europe Nephrology Drugs Market Revenue (US$ Mn) Market Share by Route of Administrationin 2022
- Figure 46: Western Europe Nephrology Drugs Market Market Attractiveness Analysis by Route of Administration, 2016-2032
- Figure 47: Western Europe Nephrology Drugs Market Revenue (US$ Mn) Market Share by Distribution Channelin 2022
- Figure 48: Western Europe Nephrology Drugs Market Market Attractiveness Analysis by Distribution Channel, 2016-2032
- Figure 49: Western Europe Nephrology Drugs Market Revenue (US$ Mn) Market Share by Country in 2022
- Figure 50: Western Europe Nephrology Drugs Market Market Attractiveness Analysis by Country, 2016-2032
- Figure 51: Western Europe Nephrology Drugs Market Market Revenue (US$ Mn) (2016-2032)
- Figure 52: Western Europe Nephrology Drugs Market Market Revenue (US$ Mn) Comparison by Country (2016-2032)
- Figure 53: Western Europe Nephrology Drugs Market Market Revenue (US$ Mn) Comparison by Drug Class (2016-2032)
- Figure 54: Western Europe Nephrology Drugs Market Market Revenue (US$ Mn) Comparison by Route of Administration (2016-2032)
- Figure 55: Western Europe Nephrology Drugs Market Market Revenue (US$ Mn) Comparison by Distribution Channel (2016-2032)
- Figure 56: Western Europe Nephrology Drugs Market Market Y-o-Y Growth Rate Comparison by Country (2016-2032)
- Figure 57: Western Europe Nephrology Drugs Market Market Y-o-Y Growth Rate Comparison by Drug Class (2016-2032)
- Figure 58: Western Europe Nephrology Drugs Market Market Y-o-Y Growth Rate Comparison by Route of Administration (2016-2032)
- Figure 59: Western Europe Nephrology Drugs Market Market Y-o-Y Growth Rate Comparison by Distribution Channel (2016-2032)
- Figure 60: Western Europe Nephrology Drugs Market Market Share Comparison by Country (2016-2032)
- Figure 61: Western Europe Nephrology Drugs Market Market Share Comparison by Drug Class (2016-2032)
- Figure 62: Western Europe Nephrology Drugs Market Market Share Comparison by Route of Administration (2016-2032)
- Figure 63: Western Europe Nephrology Drugs Market Market Share Comparison by Distribution Channel (2016-2032)
- Figure 64: Eastern Europe Nephrology Drugs Market Revenue (US$ Mn) Market Share by Drug Classin 2022
- Figure 65: Eastern Europe Nephrology Drugs Market Market Attractiveness Analysis by Drug Class, 2016-2032
- Figure 66: Eastern Europe Nephrology Drugs Market Revenue (US$ Mn) Market Share by Route of Administrationin 2022
- Figure 67: Eastern Europe Nephrology Drugs Market Market Attractiveness Analysis by Route of Administration, 2016-2032
- Figure 68: Eastern Europe Nephrology Drugs Market Revenue (US$ Mn) Market Share by Distribution Channelin 2022
- Figure 69: Eastern Europe Nephrology Drugs Market Market Attractiveness Analysis by Distribution Channel, 2016-2032
- Figure 70: Eastern Europe Nephrology Drugs Market Revenue (US$ Mn) Market Share by Country in 2022
- Figure 71: Eastern Europe Nephrology Drugs Market Market Attractiveness Analysis by Country, 2016-2032
- Figure 72: Eastern Europe Nephrology Drugs Market Market Revenue (US$ Mn) (2016-2032)
- Figure 73: Eastern Europe Nephrology Drugs Market Market Revenue (US$ Mn) Comparison by Country (2016-2032)
- Figure 74: Eastern Europe Nephrology Drugs Market Market Revenue (US$ Mn) Comparison by Drug Class (2016-2032)
- Figure 75: Eastern Europe Nephrology Drugs Market Market Revenue (US$ Mn) Comparison by Route of Administration (2016-2032)
- Figure 76: Eastern Europe Nephrology Drugs Market Market Revenue (US$ Mn) Comparison by Distribution Channel (2016-2032)
- Figure 77: Eastern Europe Nephrology Drugs Market Market Y-o-Y Growth Rate Comparison by Country (2016-2032)
- Figure 78: Eastern Europe Nephrology Drugs Market Market Y-o-Y Growth Rate Comparison by Drug Class (2016-2032)
- Figure 79: Eastern Europe Nephrology Drugs Market Market Y-o-Y Growth Rate Comparison by Route of Administration (2016-2032)
- Figure 80: Eastern Europe Nephrology Drugs Market Market Y-o-Y Growth Rate Comparison by Distribution Channel (2016-2032)
- Figure 81: Eastern Europe Nephrology Drugs Market Market Share Comparison by Country (2016-2032)
- Figure 82: Eastern Europe Nephrology Drugs Market Market Share Comparison by Drug Class (2016-2032)
- Figure 83: Eastern Europe Nephrology Drugs Market Market Share Comparison by Route of Administration (2016-2032)
- Figure 84: Eastern Europe Nephrology Drugs Market Market Share Comparison by Distribution Channel (2016-2032)
- Figure 85: APAC Nephrology Drugs Market Revenue (US$ Mn) Market Share by Drug Classin 2022
- Figure 86: APAC Nephrology Drugs Market Market Attractiveness Analysis by Drug Class, 2016-2032
- Figure 87: APAC Nephrology Drugs Market Revenue (US$ Mn) Market Share by Route of Administrationin 2022
- Figure 88: APAC Nephrology Drugs Market Market Attractiveness Analysis by Route of Administration, 2016-2032
- Figure 89: APAC Nephrology Drugs Market Revenue (US$ Mn) Market Share by Distribution Channelin 2022
- Figure 90: APAC Nephrology Drugs Market Market Attractiveness Analysis by Distribution Channel, 2016-2032
- Figure 91: APAC Nephrology Drugs Market Revenue (US$ Mn) Market Share by Country in 2022
- Figure 92: APAC Nephrology Drugs Market Market Attractiveness Analysis by Country, 2016-2032
- Figure 93: APAC Nephrology Drugs Market Market Revenue (US$ Mn) (2016-2032)
- Figure 94: APAC Nephrology Drugs Market Market Revenue (US$ Mn) Comparison by Country (2016-2032)
- Figure 95: APAC Nephrology Drugs Market Market Revenue (US$ Mn) Comparison by Drug Class (2016-2032)
- Figure 96: APAC Nephrology Drugs Market Market Revenue (US$ Mn) Comparison by Route of Administration (2016-2032)
- Figure 97: APAC Nephrology Drugs Market Market Revenue (US$ Mn) Comparison by Distribution Channel (2016-2032)
- Figure 98: APAC Nephrology Drugs Market Market Y-o-Y Growth Rate Comparison by Country (2016-2032)
- Figure 99: APAC Nephrology Drugs Market Market Y-o-Y Growth Rate Comparison by Drug Class (2016-2032)
- Figure 100: APAC Nephrology Drugs Market Market Y-o-Y Growth Rate Comparison by Route of Administration (2016-2032)
- Figure 101: APAC Nephrology Drugs Market Market Y-o-Y Growth Rate Comparison by Distribution Channel (2016-2032)
- Figure 102: APAC Nephrology Drugs Market Market Share Comparison by Country (2016-2032)
- Figure 103: APAC Nephrology Drugs Market Market Share Comparison by Drug Class (2016-2032)
- Figure 104: APAC Nephrology Drugs Market Market Share Comparison by Route of Administration (2016-2032)
- Figure 105: APAC Nephrology Drugs Market Market Share Comparison by Distribution Channel (2016-2032)
- Figure 106: Latin America Nephrology Drugs Market Revenue (US$ Mn) Market Share by Drug Classin 2022
- Figure 107: Latin America Nephrology Drugs Market Market Attractiveness Analysis by Drug Class, 2016-2032
- Figure 108: Latin America Nephrology Drugs Market Revenue (US$ Mn) Market Share by Route of Administrationin 2022
- Figure 109: Latin America Nephrology Drugs Market Market Attractiveness Analysis by Route of Administration, 2016-2032
- Figure 110: Latin America Nephrology Drugs Market Revenue (US$ Mn) Market Share by Distribution Channelin 2022
- Figure 111: Latin America Nephrology Drugs Market Market Attractiveness Analysis by Distribution Channel, 2016-2032
- Figure 112: Latin America Nephrology Drugs Market Revenue (US$ Mn) Market Share by Country in 2022
- Figure 113: Latin America Nephrology Drugs Market Market Attractiveness Analysis by Country, 2016-2032
- Figure 114: Latin America Nephrology Drugs Market Market Revenue (US$ Mn) (2016-2032)
- Figure 115: Latin America Nephrology Drugs Market Market Revenue (US$ Mn) Comparison by Country (2016-2032)
- Figure 116: Latin America Nephrology Drugs Market Market Revenue (US$ Mn) Comparison by Drug Class (2016-2032)
- Figure 117: Latin America Nephrology Drugs Market Market Revenue (US$ Mn) Comparison by Route of Administration (2016-2032)
- Figure 118: Latin America Nephrology Drugs Market Market Revenue (US$ Mn) Comparison by Distribution Channel (2016-2032)
- Figure 119: Latin America Nephrology Drugs Market Market Y-o-Y Growth Rate Comparison by Country (2016-2032)
- Figure 120: Latin America Nephrology Drugs Market Market Y-o-Y Growth Rate Comparison by Drug Class (2016-2032)
- Figure 121: Latin America Nephrology Drugs Market Market Y-o-Y Growth Rate Comparison by Route of Administration (2016-2032)
- Figure 122: Latin America Nephrology Drugs Market Market Y-o-Y Growth Rate Comparison by Distribution Channel (2016-2032)
- Figure 123: Latin America Nephrology Drugs Market Market Share Comparison by Country (2016-2032)
- Figure 124: Latin America Nephrology Drugs Market Market Share Comparison by Drug Class (2016-2032)
- Figure 125: Latin America Nephrology Drugs Market Market Share Comparison by Route of Administration (2016-2032)
- Figure 126: Latin America Nephrology Drugs Market Market Share Comparison by Distribution Channel (2016-2032)
- Figure 127: Middle East & Africa Nephrology Drugs Market Revenue (US$ Mn) Market Share by Drug Classin 2022
- Figure 128: Middle East & Africa Nephrology Drugs Market Market Attractiveness Analysis by Drug Class, 2016-2032
- Figure 129: Middle East & Africa Nephrology Drugs Market Revenue (US$ Mn) Market Share by Route of Administrationin 2022
- Figure 130: Middle East & Africa Nephrology Drugs Market Market Attractiveness Analysis by Route of Administration, 2016-2032
- Figure 131: Middle East & Africa Nephrology Drugs Market Revenue (US$ Mn) Market Share by Distribution Channelin 2022
- Figure 132: Middle East & Africa Nephrology Drugs Market Market Attractiveness Analysis by Distribution Channel, 2016-2032
- Figure 133: Middle East & Africa Nephrology Drugs Market Revenue (US$ Mn) Market Share by Country in 2022
- Figure 134: Middle East & Africa Nephrology Drugs Market Market Attractiveness Analysis by Country, 2016-2032
- Figure 135: Middle East & Africa Nephrology Drugs Market Market Revenue (US$ Mn) (2016-2032)
- Figure 136: Middle East & Africa Nephrology Drugs Market Market Revenue (US$ Mn) Comparison by Country (2016-2032)
- Figure 137: Middle East & Africa Nephrology Drugs Market Market Revenue (US$ Mn) Comparison by Drug Class (2016-2032)
- Figure 138: Middle East & Africa Nephrology Drugs Market Market Revenue (US$ Mn) Comparison by Route of Administration (2016-2032)
- Figure 139: Middle East & Africa Nephrology Drugs Market Market Revenue (US$ Mn) Comparison by Distribution Channel (2016-2032)
- Figure 140: Middle East & Africa Nephrology Drugs Market Market Y-o-Y Growth Rate Comparison by Country (2016-2032)
- Figure 141: Middle East & Africa Nephrology Drugs Market Market Y-o-Y Growth Rate Comparison by Drug Class (2016-2032)
- Figure 142: Middle East & Africa Nephrology Drugs Market Market Y-o-Y Growth Rate Comparison by Route of Administration (2016-2032)
- Figure 143: Middle East & Africa Nephrology Drugs Market Market Y-o-Y Growth Rate Comparison by Distribution Channel (2016-2032)
- Figure 144: Middle East & Africa Nephrology Drugs Market Market Share Comparison by Country (2016-2032)
- Figure 145: Middle East & Africa Nephrology Drugs Market Market Share Comparison by Drug Class (2016-2032)
- Figure 146: Middle East & Africa Nephrology Drugs Market Market Share Comparison by Route of Administration (2016-2032)
- Figure 147: Middle East & Africa Nephrology Drugs Market Market Share Comparison by Distribution Channel (2016-2032)
- List of Tables
- Table 1: Global Nephrology Drugs Market Market Comparison by Drug Class (2016-2032)
- Table 2: Global Nephrology Drugs Market Market Comparison by Route of Administration (2016-2032)
- Table 3: Global Nephrology Drugs Market Market Comparison by Distribution Channel (2016-2032)
- Table 4: Global Nephrology Drugs Market Revenue (US$ Mn) Comparison by Region (2016-2032)
- Table 5: Global Nephrology Drugs Market Market Revenue (US$ Mn) (2016-2032)
- Table 6: Global Nephrology Drugs Market Market Revenue (US$ Mn) Comparison by Region (2016-2032)
- Table 7: Global Nephrology Drugs Market Market Revenue (US$ Mn) Comparison by Drug Class (2016-2032)
- Table 8: Global Nephrology Drugs Market Market Revenue (US$ Mn) Comparison by Route of Administration (2016-2032)
- Table 9: Global Nephrology Drugs Market Market Revenue (US$ Mn) Comparison by Distribution Channel (2016-2032)
- Table 10: Global Nephrology Drugs Market Market Y-o-Y Growth Rate Comparison by Region (2016-2032)
- Table 11: Global Nephrology Drugs Market Market Y-o-Y Growth Rate Comparison by Drug Class (2016-2032)
- Table 12: Global Nephrology Drugs Market Market Y-o-Y Growth Rate Comparison by Route of Administration (2016-2032)
- Table 13: Global Nephrology Drugs Market Market Y-o-Y Growth Rate Comparison by Distribution Channel (2016-2032)
- Table 14: Global Nephrology Drugs Market Market Share Comparison by Region (2016-2032)
- Table 15: Global Nephrology Drugs Market Market Share Comparison by Drug Class (2016-2032)
- Table 16: Global Nephrology Drugs Market Market Share Comparison by Route of Administration (2016-2032)
- Table 17: Global Nephrology Drugs Market Market Share Comparison by Distribution Channel (2016-2032)
- Table 18: North America Nephrology Drugs Market Market Comparison by Route of Administration (2016-2032)
- Table 19: North America Nephrology Drugs Market Market Comparison by Distribution Channel (2016-2032)
- Table 20: North America Nephrology Drugs Market Revenue (US$ Mn) Comparison by Country (2016-2032)
- Table 21: North America Nephrology Drugs Market Market Revenue (US$ Mn) (2016-2032)
- Table 22: North America Nephrology Drugs Market Market Revenue (US$ Mn) Comparison by Country (2016-2032)
- Table 23: North America Nephrology Drugs Market Market Revenue (US$ Mn) Comparison by Drug Class (2016-2032)
- Table 24: North America Nephrology Drugs Market Market Revenue (US$ Mn) Comparison by Route of Administration (2016-2032)
- Table 25: North America Nephrology Drugs Market Market Revenue (US$ Mn) Comparison by Distribution Channel (2016-2032)
- Table 26: North America Nephrology Drugs Market Market Y-o-Y Growth Rate Comparison by Country (2016-2032)
- Table 27: North America Nephrology Drugs Market Market Y-o-Y Growth Rate Comparison by Drug Class (2016-2032)
- Table 28: North America Nephrology Drugs Market Market Y-o-Y Growth Rate Comparison by Route of Administration (2016-2032)
- Table 29: North America Nephrology Drugs Market Market Y-o-Y Growth Rate Comparison by Distribution Channel (2016-2032)
- Table 30: North America Nephrology Drugs Market Market Share Comparison by Country (2016-2032)
- Table 31: North America Nephrology Drugs Market Market Share Comparison by Drug Class (2016-2032)
- Table 32: North America Nephrology Drugs Market Market Share Comparison by Route of Administration (2016-2032)
- Table 33: North America Nephrology Drugs Market Market Share Comparison by Distribution Channel (2016-2032)
- Table 34: Western Europe Nephrology Drugs Market Market Comparison by Drug Class (2016-2032)
- Table 35: Western Europe Nephrology Drugs Market Market Comparison by Route of Administration (2016-2032)
- Table 36: Western Europe Nephrology Drugs Market Market Comparison by Distribution Channel (2016-2032)
- Table 37: Western Europe Nephrology Drugs Market Revenue (US$ Mn) Comparison by Country (2016-2032)
- Table 38: Western Europe Nephrology Drugs Market Market Revenue (US$ Mn) (2016-2032)
- Table 39: Western Europe Nephrology Drugs Market Market Revenue (US$ Mn) Comparison by Country (2016-2032)
- Table 40: Western Europe Nephrology Drugs Market Market Revenue (US$ Mn) Comparison by Drug Class (2016-2032)
- Table 41: Western Europe Nephrology Drugs Market Market Revenue (US$ Mn) Comparison by Route of Administration (2016-2032)
- Table 42: Western Europe Nephrology Drugs Market Market Revenue (US$ Mn) Comparison by Distribution Channel (2016-2032)
- Table 43: Western Europe Nephrology Drugs Market Market Y-o-Y Growth Rate Comparison by Country (2016-2032)
- Table 44: Western Europe Nephrology Drugs Market Market Y-o-Y Growth Rate Comparison by Drug Class (2016-2032)
- Table 45: Western Europe Nephrology Drugs Market Market Y-o-Y Growth Rate Comparison by Route of Administration (2016-2032)
- Table 46: Western Europe Nephrology Drugs Market Market Y-o-Y Growth Rate Comparison by Distribution Channel (2016-2032)
- Table 47: Western Europe Nephrology Drugs Market Market Share Comparison by Country (2016-2032)
- Table 48: Western Europe Nephrology Drugs Market Market Share Comparison by Drug Class (2016-2032)
- Table 49: Western Europe Nephrology Drugs Market Market Share Comparison by Route of Administration (2016-2032)
- Table 50: Western Europe Nephrology Drugs Market Market Share Comparison by Distribution Channel (2016-2032)
- Table 51: Eastern Europe Nephrology Drugs Market Market Comparison by Drug Class (2016-2032)
- Table 52: Eastern Europe Nephrology Drugs Market Market Comparison by Route of Administration (2016-2032)
- Table 53: Eastern Europe Nephrology Drugs Market Market Comparison by Distribution Channel (2016-2032)
- Table 54: Eastern Europe Nephrology Drugs Market Revenue (US$ Mn) Comparison by Country (2016-2032)
- Table 55: Eastern Europe Nephrology Drugs Market Market Revenue (US$ Mn) (2016-2032)
- Table 56: Eastern Europe Nephrology Drugs Market Market Revenue (US$ Mn) Comparison by Country (2016-2032)
- Table 57: Eastern Europe Nephrology Drugs Market Market Revenue (US$ Mn) Comparison by Drug Class (2016-2032)
- Table 58: Eastern Europe Nephrology Drugs Market Market Revenue (US$ Mn) Comparison by Route of Administration (2016-2032)
- Table 59: Eastern Europe Nephrology Drugs Market Market Revenue (US$ Mn) Comparison by Distribution Channel (2016-2032)
- Table 60: Eastern Europe Nephrology Drugs Market Market Y-o-Y Growth Rate Comparison by Country (2016-2032)
- Table 61: Eastern Europe Nephrology Drugs Market Market Y-o-Y Growth Rate Comparison by Drug Class (2016-2032)
- Table 62: Eastern Europe Nephrology Drugs Market Market Y-o-Y Growth Rate Comparison by Route of Administration (2016-2032)
- Table 63: Eastern Europe Nephrology Drugs Market Market Y-o-Y Growth Rate Comparison by Distribution Channel (2016-2032)
- Table 64: Eastern Europe Nephrology Drugs Market Market Share Comparison by Country (2016-2032)
- Table 65: Eastern Europe Nephrology Drugs Market Market Share Comparison by Drug Class (2016-2032)
- Table 66: Eastern Europe Nephrology Drugs Market Market Share Comparison by Route of Administration (2016-2032)
- Table 67: Eastern Europe Nephrology Drugs Market Market Share Comparison by Distribution Channel (2016-2032)
- Table 68: APAC Nephrology Drugs Market Market Comparison by Drug Class (2016-2032)
- Table 69: APAC Nephrology Drugs Market Market Comparison by Route of Administration (2016-2032)
- Table 70: APAC Nephrology Drugs Market Market Comparison by Distribution Channel (2016-2032)
- Table 71: APAC Nephrology Drugs Market Revenue (US$ Mn) Comparison by Country (2016-2032)
- Table 72: APAC Nephrology Drugs Market Market Revenue (US$ Mn) (2016-2032)
- Table 73: APAC Nephrology Drugs Market Market Revenue (US$ Mn) Comparison by Country (2016-2032)
- Table 74: APAC Nephrology Drugs Market Market Revenue (US$ Mn) Comparison by Drug Class (2016-2032)
- Table 75: APAC Nephrology Drugs Market Market Revenue (US$ Mn) Comparison by Route of Administration (2016-2032)
- Table 76: APAC Nephrology Drugs Market Market Revenue (US$ Mn) Comparison by Distribution Channel (2016-2032)
- Table 77: APAC Nephrology Drugs Market Market Y-o-Y Growth Rate Comparison by Country (2016-2032)
- Table 78: APAC Nephrology Drugs Market Market Y-o-Y Growth Rate Comparison by Drug Class (2016-2032)
- Table 79: APAC Nephrology Drugs Market Market Y-o-Y Growth Rate Comparison by Route of Administration (2016-2032)
- Table 80: APAC Nephrology Drugs Market Market Y-o-Y Growth Rate Comparison by Distribution Channel (2016-2032)
- Table 81: APAC Nephrology Drugs Market Market Share Comparison by Country (2016-2032)
- Table 82: APAC Nephrology Drugs Market Market Share Comparison by Drug Class (2016-2032)
- Table 83: APAC Nephrology Drugs Market Market Share Comparison by Route of Administration (2016-2032)
- Table 84: APAC Nephrology Drugs Market Market Share Comparison by Distribution Channel (2016-2032)
- Table 85: Latin America Nephrology Drugs Market Market Comparison by Drug Class (2016-2032)
- Table 86: Latin America Nephrology Drugs Market Market Comparison by Route of Administration (2016-2032)
- Table 87: Latin America Nephrology Drugs Market Market Comparison by Distribution Channel (2016-2032)
- Table 88: Latin America Nephrology Drugs Market Revenue (US$ Mn) Comparison by Country (2016-2032)
- Table 89: Latin America Nephrology Drugs Market Market Revenue (US$ Mn) (2016-2032)
- Table 90: Latin America Nephrology Drugs Market Market Revenue (US$ Mn) Comparison by Country (2016-2032)
- Table 91: Latin America Nephrology Drugs Market Market Revenue (US$ Mn) Comparison by Drug Class (2016-2032)
- Table 92: Latin America Nephrology Drugs Market Market Revenue (US$ Mn) Comparison by Route of Administration (2016-2032)
- Table 93: Latin America Nephrology Drugs Market Market Revenue (US$ Mn) Comparison by Distribution Channel (2016-2032)
- Table 94: Latin America Nephrology Drugs Market Market Y-o-Y Growth Rate Comparison by Country (2016-2032)
- Table 95: Latin America Nephrology Drugs Market Market Y-o-Y Growth Rate Comparison by Drug Class (2016-2032)
- Table 96: Latin America Nephrology Drugs Market Market Y-o-Y Growth Rate Comparison by Route of Administration (2016-2032)
- Table 97: Latin America Nephrology Drugs Market Market Y-o-Y Growth Rate Comparison by Distribution Channel (2016-2032)
- Table 98: Latin America Nephrology Drugs Market Market Share Comparison by Country (2016-2032)
- Table 99: Latin America Nephrology Drugs Market Market Share Comparison by Drug Class (2016-2032)
- Table 100: Latin America Nephrology Drugs Market Market Share Comparison by Route of Administration (2016-2032)
- Table 101: Latin America Nephrology Drugs Market Market Share Comparison by Distribution Channel (2016-2032)
- Table 102: Middle East & Africa Nephrology Drugs Market Market Comparison by Drug Class (2016-2032)
- Table 103: Middle East & Africa Nephrology Drugs Market Market Comparison by Route of Administration (2016-2032)
- Table 104: Middle East & Africa Nephrology Drugs Market Market Comparison by Distribution Channel (2016-2032)
- Table 105: Middle East & Africa Nephrology Drugs Market Revenue (US$ Mn) Comparison by Country (2016-2032)
- Table 106: Middle East & Africa Nephrology Drugs Market Market Revenue (US$ Mn) (2016-2032)
- Table 107: Middle East & Africa Nephrology Drugs Market Market Revenue (US$ Mn) Comparison by Country (2016-2032)
- Table 108: Middle East & Africa Nephrology Drugs Market Market Revenue (US$ Mn) Comparison by Drug Class (2016-2032)
- Table 109: Middle East & Africa Nephrology Drugs Market Market Revenue (US$ Mn) Comparison by Route of Administration (2016-2032)
- Table 110: Middle East & Africa Nephrology Drugs Market Market Revenue (US$ Mn) Comparison by Distribution Channel (2016-2032)
- Table 111: Middle East & Africa Nephrology Drugs Market Market Y-o-Y Growth Rate Comparison by Country (2016-2032)
- Table 112: Middle East & Africa Nephrology Drugs Market Market Y-o-Y Growth Rate Comparison by Drug Class (2016-2032)
- Table 113: Middle East & Africa Nephrology Drugs Market Market Y-o-Y Growth Rate Comparison by Route of Administration (2016-2032)
- Table 114: Middle East & Africa Nephrology Drugs Market Market Y-o-Y Growth Rate Comparison by Distribution Channel (2016-2032)
- Table 115: Middle East & Africa Nephrology Drugs Market Market Share Comparison by Country (2016-2032)
- Table 116: Middle East & Africa Nephrology Drugs Market Market Share Comparison by Drug Class (2016-2032)
- Table 117: Middle East & Africa Nephrology Drugs Market Market Share Comparison by Route of Administration (2016-2032)
- Table 118: Middle East & Africa Nephrology Drugs Market Market Share Comparison by Distribution Channel (2016-2032)
- 1. Executive Summary
-
- Amgen Inc.
- AstraZeneca
- Pfizer Inc.
- Johnson & Johnson Inc
- F. Hoffmann-La Roche Ltd.
- Sanofi
- GlaxoSmithKline
- Otsuka Pharmaceutical Co., Ltd.
- Kyowa Hakko Kirin Co., Ltd.
- OPKO Health, Inc.
- FibroGen Inc
- Novartis AG
- Akebia Therapeutics Inc
Our Clients


View Our Licence Options
