
Natural Household Cleaners Market By Ingredients(Chemical, Natural), By Product(Surface Cleaner, Glass Cleaner, Toilet Bowl Cleaner, Others), By Distribution Channel(Offline, Online), By Region And Companies - Industry Segment Outlook, Market Assessment, Competition Scenario, Trends, And Forecast 2024-2033
-
44065
-
March 2024
-
179
-


-
This report was compiled by Research Team Research team of over 50 passionate professionals leverages advanced research methodologies and analytical expertise to deliver insightful, data-driven market intelligence that empowers businesses across diverse industries to make strategic, well-informed Correspondence Research Team Linkedin | Detailed Market research Methodology Our methodology involves a mix of primary research, including interviews with leading mental health experts, and secondary research from reputable medical journals and databases. View Detailed Methodology Page
-
Quick Navigation
Report Overview
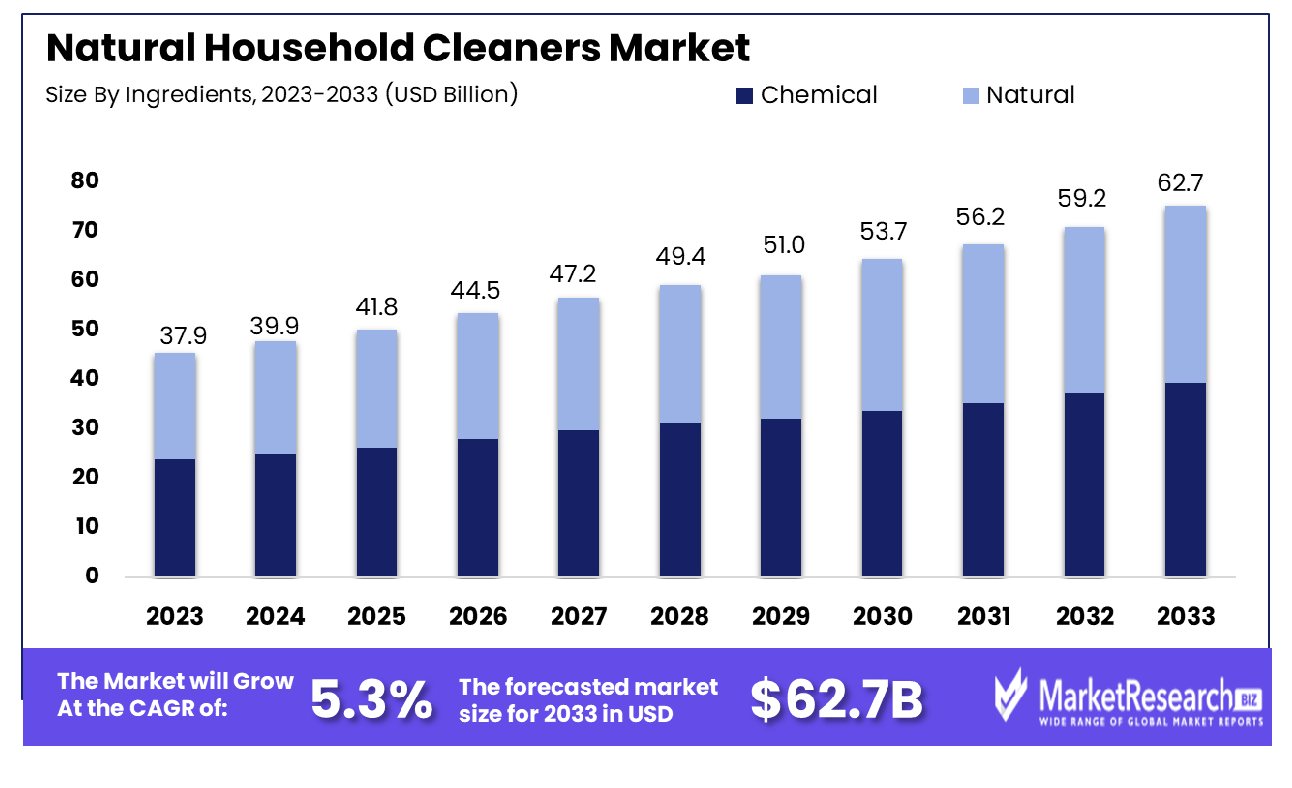
The Natural Household Cleaners Market was valued at USD 37.9 billion in 2023. It is expected to reach USD 62.7 billion by 2033, with a CAGR of 5.3% during the forecast period from 2024 to 2033. The surge in demand for organic and natural products, and the rise in health concerns are some of the main key driving factors for the natural household market.
Natural household cleaners are defined as eco-friendly options to conventional natural cleaning products made from non-toxic, organic, and biodegradable ingredients. Common ingredients include vinegar, baking soda, essential oils such as tea tree, lavender, and lemon juice. Vinegar has good quality acidic properties which efficiently cleans surfaces and eradicates odors or any type of foul smell. Baking soda has a gentle abrasive and deodorizer. Lemon juice offers a pleasant smell and has antibacterial properties. Essential oils add fragrances as well as provide antimicrobial advantages.
 Such type of natural cleaners are free from harsh and harmful chemicals, and decrease the chances of respiratory issues and skin irritation. Moreover, these are sustainable and eco-friendly, as their production and disposal have less impact. DIY natural household cleaners market is quite popular these days as well as it is simple, convenient, cost-effective, and also promotes a healthier living environment for both the individuals as well as for the planet.
WHO in March 2023, highlighted that skin conditions such as skin infections, skin irritations, and other types of skin-related disorders are estimated to affect more than 1.8 billion people. In many of the commodities, there are skin NTDs form which are about 10% of skin diseases.
Natural household cleaners play a significant role in providing a good and healthy quality of life. It contributes to enhancing indoor air quality by eliminating harmful chemicals and decreasing the chance of respiratory issues and allergies. The usage of biodegradable ingredients decreases environmental impact by avoiding water and soil pollution. Moreover, such cleaners come in sustainable packaging that leads to reduced waste.
Opting for natural and organic alternatives aids sustainable practices and encourages responsible customer behavior. By using biodegradable resources and preventing harmful chemicals, these natural household cleaners provide a safer and healthier living space while contributing to an eco-friendly and sustainable lifestyle. The demand for natural household cleaners will increase due to their organic and eco-friendly properties which will help in market expansion in the coming years.
Key Takeaways
- Market Growth: The Natural Household Cleaners Market was valued at USD 37.9 billion in 2023. It is expected to reach USD 62.7 billion by 2033, with a CAGR of 5.3% during the forecast period from 2024 to 2033.
- By Ingredients: The chemical ingredient segment commands an 86.3% share of the market.
- By Product: Surface cleaners hold a 55.4% market share by product category.
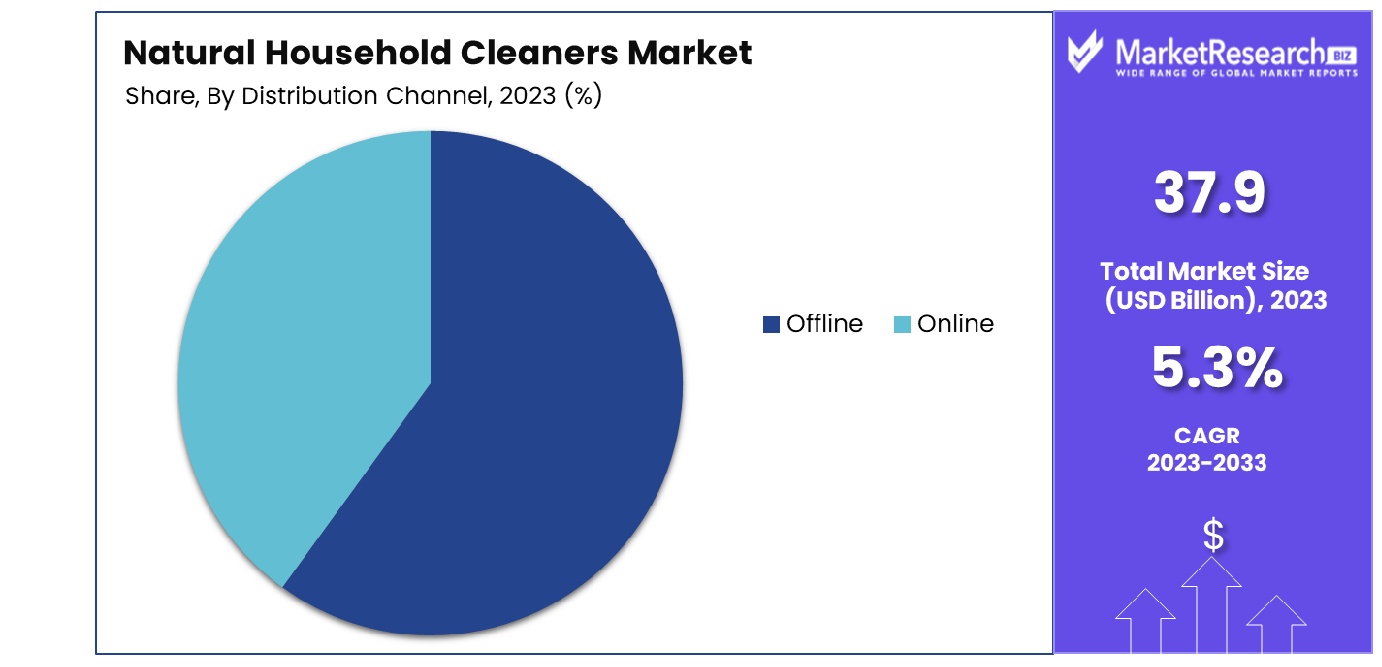
- By Distribution Channel: Offline distribution channels dominate with an 83.5% market share.
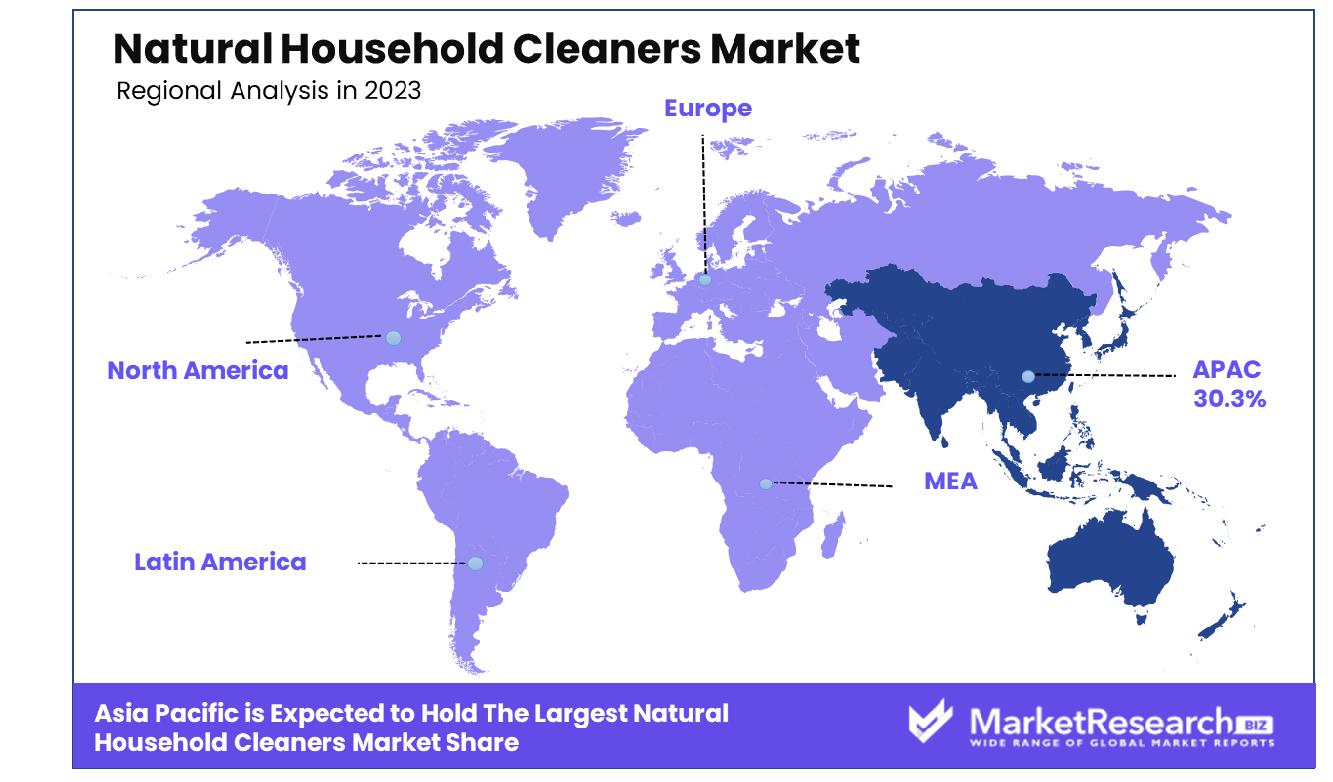
- Regional Dominance: In the Asia Pacific region, the natural household cleaners market grew by 30.3%.
- Growth Opportunity: In 2023, targeted marketing emphasized natural ingredients and sustainability, while retail expansion broadened accessibility, driving growth in the global Natural Household Cleaners Market.
Driving factors
Eco-Friendly and Sustainable Products Demand Fuels Market Expansion
The growth of the Natural Household Cleaners Market can be significantly attributed to rising consumer demand for eco-friendly and sustainable cleaning solutions. This trend analysis is underpinned by a growing societal awareness of environmental issues and a collective desire to reduce pollution and waste.
Consumers are increasingly opting for products that minimize environmental impact, driving manufacturers to focus on green formulations and sustainable packaging. This shift not only responds to consumer preferences but also aligns with global sustainability goals, creating a robust market for natural household cleaners.
Enhanced Hygiene Awareness Propels Market Growth
In the wake of global health concerns, there has been a marked increase in consumer awareness regarding the importance of hygiene and cleanliness in living spaces. This heightened awareness has translated into a demand surge for household cleaning products, with a particular emphasis on those that promise safety and efficacy.
Natural household cleaners, perceived as safer for both human health and the environment, have gained traction. This key trend is bolstered by studies indicating that consumers are willing to invest more in health-conscious products, further driving market expansion.
Shift Towards Natural Alternatives Accelerates Market Dynamics
The market for natural household cleaners is experiencing accelerated growth, driven by a consumer shift towards natural and eco-friendly alternatives. This shift is motivated by a deeper understanding of the harmful effects associated with conventional cleaning products, including potential health risks and environmental damage. Natural cleaners, formulated with biodegradable ingredients and devoid of harsh chemicals, address these concerns.
Moreover, the innovation in natural product formulations and effectiveness has reinforced consumer confidence and adoption, contributing to the market's growth. These key trends are indicative of a broader movement towards sustainable living practices, reflecting a collective effort to foster a healthier planet and well-being.
Restraining Factors
Influence of Lifestyle Standards and Awareness
The growth of the Natural Household Cleaners Market can be significantly influenced by evolving consumer behavior, primarily driven by heightened lifestyle standards and increased awareness of health and environmental issues. As consumers become more informed about the environmental and health implications of their choices, there is a noticeable shift towards products deemed safer and more sustainable, including natural household cleaners.
This awareness is not just confined to the product's effectiveness but extends to its lifecycle, from production to disposal. The preference for eco-friendly and health-conscious products can be seen as a direct response to growing environmental concerns and a collective move towards more responsible consumerism. Statistics often show a positive correlation between consumer awareness and the inclination towards natural and organic products, suggesting a robust potential for market growth driven by informed consumer choices.
Challenges in Maintaining Consumer Loyalty
On the contrary, the Natural Household Cleaners Market faces a challenge in maintaining consumer loyalty due to the wide variety of options available and the dynamic nature of consumer preferences. The market is saturated with products claiming to be 'natural' or 'eco-friendly', making it difficult for consumers to remain loyal to a single brand or product. The dilemma is compounded by aggressive marketing strategies and frequent product launches, enticing consumers to switch brands.
This phenomenon, while creating opportunities for market entry and expansion, also introduces volatility, as brands struggle to retain a consistent consumer base. The difficulty in fostering brand loyalty could potentially restrain market growth unless companies innovate and adapt to consumer expectations continually, focusing on quality, transparency, and trust-building measures.
By Ingredients Analysis
Chemical ingredients dominate with an 86.3% share of the market.
In 2023, Chemical ingredients held a dominant market position in the "By Ingredients" segment of the Natural Household Cleaners Market, capturing more than an 86.3% share. This substantial market share underscores the pivotal role chemical components continue to play in the formulation of household cleaning products, despite the growing consumer inclination towards natural alternatives. The reliance on chemical ingredients can be attributed to their efficacy in disinfection, versatility in applications, and cost-effectiveness, which remain compelling factors for both manufacturers and consumers.
The remaining market share, amounting to 13.7%, was held by natural ingredients. This segment, although smaller in comparison, has exhibited a steady growth trajectory, driven by increasing consumer awareness regarding environmental sustainability and health concerns associated with synthetic chemicals. The natural segment's growth is further buoyed by advancements in green chemistry, which have enhanced the efficacy of natural ingredients, making them more competitive with their chemical counterparts.
The juxtaposition of the two segments reveals a market at a crossroads, with traditional chemical-based products maintaining their stronghold, while natural alternatives gradually carve out a niche. The ongoing shift in consumer preferences towards eco-friendly and health-conscious choices suggests the potential for the natural segment to increase its market share in the coming years. Manufacturers are responding to this trend by investing in research and development to improve the performance of natural cleaners, potentially altering the market dynamics in favor of more sustainable and environmentally friendly products.
By Product Analysis
Surface cleaners lead, holding a 55.4% market share.
In 2023, the Natural Household Cleaners Market was segmented by product into Surface Cleaner, Glass Cleaner, Toilet Bowl Cleaner, and Others. Surface Cleaner held a dominant market position, capturing more than 55.4% of the market share. This prominence can be attributed to the rising awareness among consumers regarding the health benefits of using natural and organic cleaning solutions, coupled with the effectiveness of surface cleaners in providing comprehensive cleaning solutions for a variety of surfaces.
The demand for Glass Cleaners also showed significant growth, driven by the increased emphasis on maintaining hygiene and cleanliness in residential as well as commercial cleaning spaces, further propelled by the ongoing global emphasis on health and wellness. Toilet Bowl Cleaners and other categories contributed to the market's diversity, catering to specific needs within the household cleaning sector.
The segmental analysis indicates a strong consumer preference towards natural and organic products, reflecting a broader trend towards environmentally friendly and sustainable living practices. This shift is supported by a growing body of research highlighting the adverse effects of chemical-based cleaners on human health and the environment. Consequently, manufacturers are increasingly focusing on innovation and product development to meet the evolving consumer demands within the Natural Household Cleaners Market.
By Distribution Channel Analysis
Offline distribution channels prevail, securing an 83.5% market share.
In 2023, the Natural Household Cleaners Market was characterized by a significant dichotomy in its distribution channels, with Offline and Online being the primary avenues. Offline held a dominant market position in the By Distribution Channel segment, capturing more than an 83.5% share. This predominance can be attributed to consumer preferences for tactile purchasing experiences, where the physical assessment of products plays a critical role in purchasing decisions. Furthermore, the extensive retail distribution network of natural household cleaners, encompassing supermarkets, hypermarkets, and specialty stores, has facilitated the accessibility and availability of these products to a broad consumer base.
Conversely, the Online distribution channel, while still in a nascent stage relative to its Offline counterpart, has exhibited a promising growth trajectory. Driven by the convenience of home delivery, a wider array of product choices, and the increasing penetration of internet and smartphone usage, the Online segment is anticipated to expand significantly. Market trends suggest a gradual shift towards digital platforms, underscored by a growing consumer inclination towards e-commerce shopping, motivated by ease of access and often competitive pricing.
The differential growth dynamics between Offline and Online distribution channels underscore the evolving consumer purchasing behaviors and the impact of digital transformation on the retail landscape. As the market progresses, a strategic emphasis on enhancing online visibility and digital marketing efforts could potentially catalyze the growth of the Online segment, gradually narrowing the market share gap with its Offline counterpart. Such trends are pivotal for stakeholders in formulating adaptive strategies to navigate the shifting paradigms within the Natural Household Cleaners Market.
Key Market Segments
By Ingredients
- Chemical
- Natural
By Product
- Surface Cleaner
- Glass Cleaner
- Toilet Bowl Cleaner
- Others
By Distribution Channel
- Offline
- Online
Growth Opportunity
Targeted Marketing Strategies
In 2023, the global Natural Household Cleaners Market witnessed a surge in demand fueled by heightened consumer awareness regarding health, environmental sustainability, and the desire for safer alternatives. Effective targeted marketing strategies emerged as a pivotal driver in capitalizing on this trend. Brands focused on tailoring their campaigns to accentuate the benefits of natural ingredients, eco-friendliness, and the safety they offer for families and pets.
By aligning messaging with the values of environmentally conscious consumers, companies successfully differentiated their products in a crowded marketplace. Through compelling storytelling and transparent communication, brands established trust and forged stronger connections with consumers, driving loyalty and repeat purchases.
Retail Expansion and Distribution Channels
The year 2023 witnessed a strategic shift in the distribution landscape of the global Natural Household Cleaners Market. Recognizing the burgeoning demand for natural cleaning solutions, companies aggressively expanded their presence across various retail channels. This expansion included supermarkets, specialty stores, and online platforms, capitalizing on the growing preference for convenience and accessibility among consumers.
By diversifying distribution channels, brands not only widened their reach but also enhanced brand visibility, thereby facilitating market penetration and capturing a broader consumer base. Moreover, the proliferation of e-commerce platforms enabled seamless access to natural household cleaners, catering to the evolving shopping behaviors of tech-savvy consumers. This strategic approach to retail expansion not only fueled revenue growth but also solidified the market position of key players in the natural household cleaners segment.
Latest Trends
Rising Popularity of Plant-Based Ingredients
In 2023, the global natural household cleaners market witnessed a significant surge in the adoption of plant-based ingredients. Consumers are increasingly prioritizing products derived from natural sources due to growing environmental concerns and health-conscious lifestyles. This trend is fueled by the awareness of the harmful effects of synthetic chemicals present in traditional cleaners on both human health and the environment.
Manufacturers are responding by formulating products with botanical extracts, essential oils, and other plant-derived compounds, catering to the demand for safer and more sustainable cleaning solutions. Market players are also emphasizing transparency in labeling, providing consumers with clear information about the origins and benefits of the ingredients used. As a result, the plant-based natural cleaner market is gaining traction across various demographic segments, driving market growth and influencing purchasing decisions globally.
Increased Demand for Eco-Friendly Packaging
In tandem with the rise of plant-based ingredients, 2023 witnessed a notable uptick in the demand for eco-friendly packaging within the natural household cleaners market. Consumers are becoming increasingly aware of the environmental impact of plastic pollution, prompting a shift towards sustainable packaging alternatives. Manufacturers are responding by exploring innovative packaging solutions such as recyclable, biodegradable, and compostable materials.
Additionally, there is a growing emphasis on minimizing packaging waste through initiatives like refillable containers and concentrated formulas, aligning with the principles of circular economy. This major trend reflects a broader consumer consciousness toward sustainability and responsible consumption practices. As the demand for eco-friendly packaging continues to grow, market major players are likely to invest in research and development to further enhance the sustainability credentials of their product packaging, driving positive environmental outcomes and meeting consumer expectations for greener alternatives in the years ahead.
Regional Analysis
In the Asia Pacific region, the natural household cleaners market achieved significant growth, accounting for a 30.3% share.
In North America, the natural household cleaners market continued its steady growth trajectory in 2023, driven by increasing consumer preference for environmentally friendly products. With heightened awareness of health and sustainability, demand surged for natural cleaners, particularly those featuring plant-based ingredients and eco-friendly packaging. Market analysis reveals robust growth, with the region accounting for a substantial share of the global market. Dominating this segment, North America showcased a significant market share, buoyed by a compound annual growth rate (CAGR) exceeding the global average.
Europe emerged as a prominent market for natural household cleaners in 2023, reflecting a growing consumer shift towards sustainable living practices. With stringent regulations promoting eco-friendly products, major manufacturers focused on innovation and product differentiation to capture market share. The region witnessed notable growth factors, fueled by increasing adoption among environmentally conscious consumers. Dominating a considerable portion of the global market, Europe maintained a competitive edge, supported by a steady increase in sales and distribution channels.
Asia Pacific experienced remarkable growth in the natural household cleaners market, accounting for a significant percentage of global sales in 2023. With a growing population and rising disposable incomes, consumer awareness regarding health and environmental sustainability surged, driving demand for natural cleaning solutions. The region dominated the market, capturing a substantial share with a growth rate of 30.3%. Market penetration expanded rapidly, propelled by aggressive marketing strategies and widespread retail distribution networks.
While the Middle East & Africa and Latin America regions exhibited a slower pace of growth compared to other regions, there was a noticeable increase in consumer interest in natural household cleaners. Market major players focused on targeted marketing efforts to capitalize on emerging opportunities in these regions. Despite facing challenges such as lower consumer awareness and limited distribution infrastructure, both regions showed potential for future market expansion.
Key Regions and Countries
North America
- The US
- Canada
- Rest of North America
Europe
- Germany
- France
- The UK
- Spain
- Netherlands
- Russia
- Italy
- Rest of Europe
Asia-Pacific
- China
- Japan
- Singapore
- Thailand
- South Korea
- Vietnam
- India
- New Zealand
- Rest of Asia Pacific
Latin America
- Mexico
- Brazil
- Rest of Latin America
Middle East & Africa
- Saudi Arabia
- South Africa
- UAE
- Rest of the Middle East & Africa
Key Players Analysis
In 2023, the global Natural Household Cleaners Market witnessed significant traction, with key players such as Procter & Gamble (Cascade), Unilever, Henkel AG & Co. KGaA (Pril), Reckitt Benckiser Group PLC (Finish), Colgate-Palmolive Company, Kao Corporation, and The Clorox Company exerting considerable influence. These industry giants have established themselves as frontrunners in the market, each contributing distinctively to the burgeoning demand for eco-friendly cleaning solutions.
Procter & Gamble (Cascade), renowned for its commitment to innovation and sustainability, has spearheaded the adoption of natural ingredients in its cleaning products. With a focus on efficacy and environmental responsibility, P&G continues to set industry benchmarks for quality and performance.
Similarly, Unilever, with its diverse portfolio and global presence, has played a pivotal role in shaping consumer preferences towards natural household cleaners. Through strategic acquisitions and product innovations, Unilever has strengthened its foothold in this rapidly evolving market segment.
Henkel AG & Co. KGaA (Pril) and Reckitt Benckiser Group PLC (Finish) have leveraged their expertise in household cleaning solutions to develop eco-friendly alternatives, catering to the growing demand for sustainable products.
Colgate-Palmolive Company, Kao Corporation, and The Clorox Company have also made significant strides in the natural household cleaners market, aligning their product offerings with evolving consumer preferences for environmentally friendly options.
Market Key Players
- Procter & Gamble (Cascade)
- Unilever
- Henkel AG & Co. KGaA (Pril)
- Reckitt Benckiser Group PLC (Finish)
- Colgate-Palmolive Company
- Kao Corporation
- The Clorox Company
Recent Development
- In March 2024, the Max Planck Society's research identifies fusion sites in bacterial enzyme complexes for targeted drug development. The evolution-inspired approach promises faster, more effective discovery of bioactive compounds, advancing synthetic biology.
- In March 2024, Natural Products Expo West showcases sustainability-focused innovations. Heraclea introduces infused olive oils with a protected designation of origin. Rudi’s Mountain Bakery partners with Voyage Foods for peanut-free Sandos. Lärabar launches regenerative almond trail mix bars. Theo's Plant-Based debuts sweet potato jerky, sourced sustainably.
- In March 2024, Pulmuone introduces new plant-based offerings at Natural Products Expo West, including Nasoya's Vegan Dumplings with dipping sauces, Vegan Dressings, plant-based chicken, and limited-edition tofu packaging for Earth Month.
Report Scope
Report Features Description Market Value (2023) USD 37.9 Billion Forecast Revenue (2033) USD 62.7 Billion CAGR (2024-2032) 5.3% Base Year for Estimation 2023 Historic Period 2016-2023 Forecast Period 2024-2033 Report Coverage Revenue Forecast, Market Dynamics, COVID-19 Impact, Competitive Landscape, Recent Developments Segments Covered By Ingredients(Chemical, Natural), By Product(Surface Cleaner, Glass Cleaner, Toilet Bowl Cleaner, Others), By Distribution Channel(Offline, Online) Regional Analysis North America - The US, Canada, Rest of North America, Europe - Germany, France, The UK, Spain, Italy, Russia, Netherlands, Rest of Europe, Asia-Pacific - China, Japan, South Korea, India, New Zealand, Singapore, Thailand, Vietnam, Rest of Asia Pacific, Latin America - Brazil, Mexico, Rest of Latin America, Middle East & Africa - South Africa, Saudi Arabia, UAE, Rest of Middle East & Africa Competitive Landscape Procter & Gamble (Cascade), Unilever, Henkel AG & Co. KGaA (Pril), Reckitt Benckiser Group PLC (Finish), Colgate-Palmolive Company, Kao Corporation, The Clorox Company Customization Scope Customization for segments, region/country-level will be provided. Moreover, additional customization can be done based on the requirements. Purchase Options We have three licenses to opt for Single User License, Multi-User License (Up to 5 Users), Corporate Use License (Unlimited User and Printable PDF) -
- 1. Executive Summary
- 1.1. Definition
- 1.2. Taxonomy
- 1.3. Research Scope
- 1.4. Key Analysis
- 1.5. Key Findings by Major Segments
- 1.6. Top strategies by Major Players
- 2. Global Natural Household Cleaners Market Overview
- 2.1. Natural Household Cleaners Market Dynamics
- 2.1.1. Drivers
- 2.1.2. Opportunities
- 2.1.3. Restraints
- 2.1.4. Challenges
- 2.2. Macro-economic Factors
- 2.3. Regulatory Framework
- 2.4. Market Investment Feasibility Index
- 2.5. PEST Analysis
- 2.6. PORTER’S Five Force Analysis
- 2.7. Drivers & Restraints Impact Analysis
- 2.8. Industry Chain Analysis
- 2.9. Cost Structure Analysis
- 2.10. Marketing Strategy
- 2.11. Russia-Ukraine War Impact Analysis
- 2.12. Opportunity Map Analysis
- 2.13. Market Competition Scenario Analysis
- 2.14. Product Life Cycle Analysis
- 2.15. Opportunity Orbits
- 2.16. Manufacturer Intensity Map
- 2.17. Major Companies sales by Value & Volume
- 2.1. Natural Household Cleaners Market Dynamics
- 3. Global Natural Household Cleaners Market Analysis, Opportunity and Forecast, 2016-2032
- 3.1. Global Natural Household Cleaners Market Analysis, 2016-2021
- 3.2. Global Natural Household Cleaners Market Opportunity and Forecast, 2023-2032
- 3.3. Global Natural Household Cleaners Market Analysis, Opportunity and Forecast, By By Ingredients , 2016-2032
- 3.3.1. Global Natural Household Cleaners Market Analysis by By Ingredients : Introduction
- 3.3.2. Market Size Absolute $ Opportunity Analysis and Forecast, By By Ingredients , 2016-2032
- 3.3.3. Chemical
- 3.3.4. Natural
- 3.4. Global Natural Household Cleaners Market Analysis, Opportunity and Forecast, By By Product , 2016-2032
- 3.4.1. Global Natural Household Cleaners Market Analysis by By Product : Introduction
- 3.4.2. Market Size Absolute $ Opportunity Analysis and Forecast, By By Product , 2016-2032
- 3.4.3. Surface Cleaner
- 3.4.4. Glass Cleaner
- 3.4.5. Toilet Bowl Cleaner
- 3.4.6. Others
- 3.5. Global Natural Household Cleaners Market Analysis, Opportunity and Forecast, By By Distribution Channel, 2016-2032
- 3.5.1. Global Natural Household Cleaners Market Analysis by By Distribution Channel: Introduction
- 3.5.2. Market Size Absolute $ Opportunity Analysis and Forecast, By By Distribution Channel, 2016-2032
- 3.5.3. Offline
- 3.5.4. Online
- 4. North America Natural Household Cleaners Market Analysis, Opportunity and Forecast, 2016-2032
- 4.1. North America Natural Household Cleaners Market Analysis, 2016-2021
- 4.2. North America Natural Household Cleaners Market Opportunity and Forecast, 2023-2032
- 4.3. North America Natural Household Cleaners Market Analysis, Opportunity and Forecast, By By Ingredients , 2016-2032
- 4.3.1. North America Natural Household Cleaners Market Analysis by By Ingredients : Introduction
- 4.3.2. Market Size Absolute $ Opportunity Analysis and Forecast, By By Ingredients , 2016-2032
- 4.3.3. Chemical
- 4.3.4. Natural
- 4.4. North America Natural Household Cleaners Market Analysis, Opportunity and Forecast, By By Product , 2016-2032
- 4.4.1. North America Natural Household Cleaners Market Analysis by By Product : Introduction
- 4.4.2. Market Size Absolute $ Opportunity Analysis and Forecast, By By Product , 2016-2032
- 4.4.3. Surface Cleaner
- 4.4.4. Glass Cleaner
- 4.4.5. Toilet Bowl Cleaner
- 4.4.6. Others
- 4.5. North America Natural Household Cleaners Market Analysis, Opportunity and Forecast, By By Distribution Channel, 2016-2032
- 4.5.1. North America Natural Household Cleaners Market Analysis by By Distribution Channel: Introduction
- 4.5.2. Market Size Absolute $ Opportunity Analysis and Forecast, By By Distribution Channel, 2016-2032
- 4.5.3. Offline
- 4.5.4. Online
- 4.6. North America Natural Household Cleaners Market Analysis, Opportunity and Forecast, By Country , 2016-2032
- 4.6.1. North America Natural Household Cleaners Market Analysis by Country : Introduction
- 4.6.2. Market Size Absolute $ Opportunity Analysis and Forecast, Country , 2016-2032
- 4.6.2.1. The US
- 4.6.2.2. Canada
- 4.6.2.3. Mexico
- 5. Western Europe Natural Household Cleaners Market Analysis, Opportunity and Forecast, 2016-2032
- 5.1. Western Europe Natural Household Cleaners Market Analysis, 2016-2021
- 5.2. Western Europe Natural Household Cleaners Market Opportunity and Forecast, 2023-2032
- 5.3. Western Europe Natural Household Cleaners Market Analysis, Opportunity and Forecast, By By Ingredients , 2016-2032
- 5.3.1. Western Europe Natural Household Cleaners Market Analysis by By Ingredients : Introduction
- 5.3.2. Market Size Absolute $ Opportunity Analysis and Forecast, By By Ingredients , 2016-2032
- 5.3.3. Chemical
- 5.3.4. Natural
- 5.4. Western Europe Natural Household Cleaners Market Analysis, Opportunity and Forecast, By By Product , 2016-2032
- 5.4.1. Western Europe Natural Household Cleaners Market Analysis by By Product : Introduction
- 5.4.2. Market Size Absolute $ Opportunity Analysis and Forecast, By By Product , 2016-2032
- 5.4.3. Surface Cleaner
- 5.4.4. Glass Cleaner
- 5.4.5. Toilet Bowl Cleaner
- 5.4.6. Others
- 5.5. Western Europe Natural Household Cleaners Market Analysis, Opportunity and Forecast, By By Distribution Channel, 2016-2032
- 5.5.1. Western Europe Natural Household Cleaners Market Analysis by By Distribution Channel: Introduction
- 5.5.2. Market Size Absolute $ Opportunity Analysis and Forecast, By By Distribution Channel, 2016-2032
- 5.5.3. Offline
- 5.5.4. Online
- 5.6. Western Europe Natural Household Cleaners Market Analysis, Opportunity and Forecast, By Country , 2016-2032
- 5.6.1. Western Europe Natural Household Cleaners Market Analysis by Country : Introduction
- 5.6.2. Market Size Absolute $ Opportunity Analysis and Forecast, Country , 2016-2032
- 5.6.2.1. Germany
- 5.6.2.2. France
- 5.6.2.3. The UK
- 5.6.2.4. Spain
- 5.6.2.5. Italy
- 5.6.2.6. Portugal
- 5.6.2.7. Ireland
- 5.6.2.8. Austria
- 5.6.2.9. Switzerland
- 5.6.2.10. Benelux
- 5.6.2.11. Nordic
- 5.6.2.12. Rest of Western Europe
- 6. Eastern Europe Natural Household Cleaners Market Analysis, Opportunity and Forecast, 2016-2032
- 6.1. Eastern Europe Natural Household Cleaners Market Analysis, 2016-2021
- 6.2. Eastern Europe Natural Household Cleaners Market Opportunity and Forecast, 2023-2032
- 6.3. Eastern Europe Natural Household Cleaners Market Analysis, Opportunity and Forecast, By By Ingredients , 2016-2032
- 6.3.1. Eastern Europe Natural Household Cleaners Market Analysis by By Ingredients : Introduction
- 6.3.2. Market Size Absolute $ Opportunity Analysis and Forecast, By By Ingredients , 2016-2032
- 6.3.3. Chemical
- 6.3.4. Natural
- 6.4. Eastern Europe Natural Household Cleaners Market Analysis, Opportunity and Forecast, By By Product , 2016-2032
- 6.4.1. Eastern Europe Natural Household Cleaners Market Analysis by By Product : Introduction
- 6.4.2. Market Size Absolute $ Opportunity Analysis and Forecast, By By Product , 2016-2032
- 6.4.3. Surface Cleaner
- 6.4.4. Glass Cleaner
- 6.4.5. Toilet Bowl Cleaner
- 6.4.6. Others
- 6.5. Eastern Europe Natural Household Cleaners Market Analysis, Opportunity and Forecast, By By Distribution Channel, 2016-2032
- 6.5.1. Eastern Europe Natural Household Cleaners Market Analysis by By Distribution Channel: Introduction
- 6.5.2. Market Size Absolute $ Opportunity Analysis and Forecast, By By Distribution Channel, 2016-2032
- 6.5.3. Offline
- 6.5.4. Online
- 6.6. Eastern Europe Natural Household Cleaners Market Analysis, Opportunity and Forecast, By Country , 2016-2032
- 6.6.1. Eastern Europe Natural Household Cleaners Market Analysis by Country : Introduction
- 6.6.2. Market Size Absolute $ Opportunity Analysis and Forecast, Country , 2016-2032
- 6.6.2.1. Russia
- 6.6.2.2. Poland
- 6.6.2.3. The Czech Republic
- 6.6.2.4. Greece
- 6.6.2.5. Rest of Eastern Europe
- 7. APAC Natural Household Cleaners Market Analysis, Opportunity and Forecast, 2016-2032
- 7.1. APAC Natural Household Cleaners Market Analysis, 2016-2021
- 7.2. APAC Natural Household Cleaners Market Opportunity and Forecast, 2023-2032
- 7.3. APAC Natural Household Cleaners Market Analysis, Opportunity and Forecast, By By Ingredients , 2016-2032
- 7.3.1. APAC Natural Household Cleaners Market Analysis by By Ingredients : Introduction
- 7.3.2. Market Size Absolute $ Opportunity Analysis and Forecast, By By Ingredients , 2016-2032
- 7.3.3. Chemical
- 7.3.4. Natural
- 7.4. APAC Natural Household Cleaners Market Analysis, Opportunity and Forecast, By By Product , 2016-2032
- 7.4.1. APAC Natural Household Cleaners Market Analysis by By Product : Introduction
- 7.4.2. Market Size Absolute $ Opportunity Analysis and Forecast, By By Product , 2016-2032
- 7.4.3. Surface Cleaner
- 7.4.4. Glass Cleaner
- 7.4.5. Toilet Bowl Cleaner
- 7.4.6. Others
- 7.5. APAC Natural Household Cleaners Market Analysis, Opportunity and Forecast, By By Distribution Channel, 2016-2032
- 7.5.1. APAC Natural Household Cleaners Market Analysis by By Distribution Channel: Introduction
- 7.5.2. Market Size Absolute $ Opportunity Analysis and Forecast, By By Distribution Channel, 2016-2032
- 7.5.3. Offline
- 7.5.4. Online
- 7.6. APAC Natural Household Cleaners Market Analysis, Opportunity and Forecast, By Country , 2016-2032
- 7.6.1. APAC Natural Household Cleaners Market Analysis by Country : Introduction
- 7.6.2. Market Size Absolute $ Opportunity Analysis and Forecast, Country , 2016-2032
- 7.6.2.1. China
- 7.6.2.2. Japan
- 7.6.2.3. South Korea
- 7.6.2.4. India
- 7.6.2.5. Australia & New Zeland
- 7.6.2.6. Indonesia
- 7.6.2.7. Malaysia
- 7.6.2.8. Philippines
- 7.6.2.9. Singapore
- 7.6.2.10. Thailand
- 7.6.2.11. Vietnam
- 7.6.2.12. Rest of APAC
- 8. Latin America Natural Household Cleaners Market Analysis, Opportunity and Forecast, 2016-2032
- 8.1. Latin America Natural Household Cleaners Market Analysis, 2016-2021
- 8.2. Latin America Natural Household Cleaners Market Opportunity and Forecast, 2023-2032
- 8.3. Latin America Natural Household Cleaners Market Analysis, Opportunity and Forecast, By By Ingredients , 2016-2032
- 8.3.1. Latin America Natural Household Cleaners Market Analysis by By Ingredients : Introduction
- 8.3.2. Market Size Absolute $ Opportunity Analysis and Forecast, By By Ingredients , 2016-2032
- 8.3.3. Chemical
- 8.3.4. Natural
- 8.4. Latin America Natural Household Cleaners Market Analysis, Opportunity and Forecast, By By Product , 2016-2032
- 8.4.1. Latin America Natural Household Cleaners Market Analysis by By Product : Introduction
- 8.4.2. Market Size Absolute $ Opportunity Analysis and Forecast, By By Product , 2016-2032
- 8.4.3. Surface Cleaner
- 8.4.4. Glass Cleaner
- 8.4.5. Toilet Bowl Cleaner
- 8.4.6. Others
- 8.5. Latin America Natural Household Cleaners Market Analysis, Opportunity and Forecast, By By Distribution Channel, 2016-2032
- 8.5.1. Latin America Natural Household Cleaners Market Analysis by By Distribution Channel: Introduction
- 8.5.2. Market Size Absolute $ Opportunity Analysis and Forecast, By By Distribution Channel, 2016-2032
- 8.5.3. Offline
- 8.5.4. Online
- 8.6. Latin America Natural Household Cleaners Market Analysis, Opportunity and Forecast, By Country , 2016-2032
- 8.6.1. Latin America Natural Household Cleaners Market Analysis by Country : Introduction
- 8.6.2. Market Size Absolute $ Opportunity Analysis and Forecast, Country , 2016-2032
- 8.6.2.1. Brazil
- 8.6.2.2. Colombia
- 8.6.2.3. Chile
- 8.6.2.4. Argentina
- 8.6.2.5. Costa Rica
- 8.6.2.6. Rest of Latin America
- 9. Middle East & Africa Natural Household Cleaners Market Analysis, Opportunity and Forecast, 2016-2032
- 9.1. Middle East & Africa Natural Household Cleaners Market Analysis, 2016-2021
- 9.2. Middle East & Africa Natural Household Cleaners Market Opportunity and Forecast, 2023-2032
- 9.3. Middle East & Africa Natural Household Cleaners Market Analysis, Opportunity and Forecast, By By Ingredients , 2016-2032
- 9.3.1. Middle East & Africa Natural Household Cleaners Market Analysis by By Ingredients : Introduction
- 9.3.2. Market Size Absolute $ Opportunity Analysis and Forecast, By By Ingredients , 2016-2032
- 9.3.3. Chemical
- 9.3.4. Natural
- 9.4. Middle East & Africa Natural Household Cleaners Market Analysis, Opportunity and Forecast, By By Product , 2016-2032
- 9.4.1. Middle East & Africa Natural Household Cleaners Market Analysis by By Product : Introduction
- 9.4.2. Market Size Absolute $ Opportunity Analysis and Forecast, By By Product , 2016-2032
- 9.4.3. Surface Cleaner
- 9.4.4. Glass Cleaner
- 9.4.5. Toilet Bowl Cleaner
- 9.4.6. Others
- 9.5. Middle East & Africa Natural Household Cleaners Market Analysis, Opportunity and Forecast, By By Distribution Channel, 2016-2032
- 9.5.1. Middle East & Africa Natural Household Cleaners Market Analysis by By Distribution Channel: Introduction
- 9.5.2. Market Size Absolute $ Opportunity Analysis and Forecast, By By Distribution Channel, 2016-2032
- 9.5.3. Offline
- 9.5.4. Online
- 9.6. Middle East & Africa Natural Household Cleaners Market Analysis, Opportunity and Forecast, By Country , 2016-2032
- 9.6.1. Middle East & Africa Natural Household Cleaners Market Analysis by Country : Introduction
- 9.6.2. Market Size Absolute $ Opportunity Analysis and Forecast, Country , 2016-2032
- 9.6.2.1. Algeria
- 9.6.2.2. Egypt
- 9.6.2.3. Israel
- 9.6.2.4. Kuwait
- 9.6.2.5. Nigeria
- 9.6.2.6. Saudi Arabia
- 9.6.2.7. South Africa
- 9.6.2.8. Turkey
- 9.6.2.9. The UAE
- 9.6.2.10. Rest of MEA
- 10. Global Natural Household Cleaners Market Analysis, Opportunity and Forecast, By Region , 2016-2032
- 10.1. Global Natural Household Cleaners Market Analysis by Region : Introduction
- 10.2. Market Size Absolute $ Opportunity Analysis and Forecast, By Region , 2016-2032
- 10.2.1. North America
- 10.2.2. Western Europe
- 10.2.3. Eastern Europe
- 10.2.4. APAC
- 10.2.5. Latin America
- 10.2.6. Middle East & Africa
- 11. Global Natural Household Cleaners Market Competitive Landscape, Market Share Analysis, and Company Profiles
- 11.1. Market Share Analysis
- 11.2. Company Profiles
- 11.3. Procter & Gamble (Cascade)
- 11.3.1. Company Overview
- 11.3.2. Financial Highlights
- 11.3.3. Product Portfolio
- 11.3.4. SWOT Analysis
- 11.3.5. Key Strategies and Developments
- 11.4. Unilever
- 11.4.1. Company Overview
- 11.4.2. Financial Highlights
- 11.4.3. Product Portfolio
- 11.4.4. SWOT Analysis
- 11.4.5. Key Strategies and Developments
- 11.5. Henkel AG & Co. KGaA (Pril)
- 11.5.1. Company Overview
- 11.5.2. Financial Highlights
- 11.5.3. Product Portfolio
- 11.5.4. SWOT Analysis
- 11.5.5. Key Strategies and Developments
- 11.6. Reckitt Benckiser Group PLC (Finish)
- 11.6.1. Company Overview
- 11.6.2. Financial Highlights
- 11.6.3. Product Portfolio
- 11.6.4. SWOT Analysis
- 11.6.5. Key Strategies and Developments
- 11.7. Colgate-Palmolive Company
- 11.7.1. Company Overview
- 11.7.2. Financial Highlights
- 11.7.3. Product Portfolio
- 11.7.4. SWOT Analysis
- 11.7.5. Key Strategies and Developments
- 11.8. Kao Corporation
- 11.8.1. Company Overview
- 11.8.2. Financial Highlights
- 11.8.3. Product Portfolio
- 11.8.4. SWOT Analysis
- 11.8.5. Key Strategies and Developments
- 11.9. The Clorox Company
- 11.9.1. Company Overview
- 11.9.2. Financial Highlights
- 11.9.3. Product Portfolio
- 11.9.4. SWOT Analysis
- 11.9.5. Key Strategies and Developments
- 11.13.1. Company Overview
- 11.13.2. Financial Highlights
- 11.13.3. Product Portfolio
- 11.13.4. SWOT Analysis
- 11.13.5. Key Strategies and Developments
- 12. Assumptions and Acronyms
- 13. Research Methodology
- 14. Contact
"
- List of Figures
- "
- Figure 1: Global Natural Household Cleaners Market Revenue (US$ Mn) Market Share by By Ingredients in 2022
- Figure 2: Global Natural Household Cleaners Market Market Attractiveness Analysis by By Ingredients , 2016-2032
- Figure 3: Global Natural Household Cleaners Market Revenue (US$ Mn) Market Share by By Product in 2022
- Figure 4: Global Natural Household Cleaners Market Market Attractiveness Analysis by By Product , 2016-2032
- Figure 5: Global Natural Household Cleaners Market Revenue (US$ Mn) Market Share by By Distribution Channelin 2022
- Figure 6: Global Natural Household Cleaners Market Market Attractiveness Analysis by By Distribution Channel, 2016-2032
- Figure 7: Global Natural Household Cleaners Market Revenue (US$ Mn) Market Share by Region in 2022
- Figure 8: Global Natural Household Cleaners Market Market Attractiveness Analysis by Region, 2016-2032
- Figure 9: Global Natural Household Cleaners Market Market Revenue (US$ Mn) (2016-2032)
- Figure 10: Global Natural Household Cleaners Market Market Revenue (US$ Mn) Comparison by Region (2016-2032)
- Figure 11: Global Natural Household Cleaners Market Market Revenue (US$ Mn) Comparison by By Ingredients (2016-2032)
- Figure 12: Global Natural Household Cleaners Market Market Revenue (US$ Mn) Comparison by By Product (2016-2032)
- Figure 13: Global Natural Household Cleaners Market Market Revenue (US$ Mn) Comparison by By Distribution Channel (2016-2032)
- Figure 14: Global Natural Household Cleaners Market Market Y-o-Y Growth Rate Comparison by Region (2016-2032)
- Figure 15: Global Natural Household Cleaners Market Market Y-o-Y Growth Rate Comparison by By Ingredients (2016-2032)
- Figure 16: Global Natural Household Cleaners Market Market Y-o-Y Growth Rate Comparison by By Product (2016-2032)
- Figure 17: Global Natural Household Cleaners Market Market Y-o-Y Growth Rate Comparison by By Distribution Channel (2016-2032)
- Figure 18: Global Natural Household Cleaners Market Market Share Comparison by Region (2016-2032)
- Figure 19: Global Natural Household Cleaners Market Market Share Comparison by By Ingredients (2016-2032)
- Figure 20: Global Natural Household Cleaners Market Market Share Comparison by By Product (2016-2032)
- Figure 21: Global Natural Household Cleaners Market Market Share Comparison by By Distribution Channel (2016-2032)
- Figure 22: North America Natural Household Cleaners Market Revenue (US$ Mn) Market Share by By Ingredients in 2022
- Figure 23: North America Natural Household Cleaners Market Market Attractiveness Analysis by By Ingredients , 2016-2032
- Figure 24: North America Natural Household Cleaners Market Revenue (US$ Mn) Market Share by By Product in 2022
- Figure 25: North America Natural Household Cleaners Market Market Attractiveness Analysis by By Product , 2016-2032
- Figure 26: North America Natural Household Cleaners Market Revenue (US$ Mn) Market Share by By Distribution Channelin 2022
- Figure 27: North America Natural Household Cleaners Market Market Attractiveness Analysis by By Distribution Channel, 2016-2032
- Figure 28: North America Natural Household Cleaners Market Revenue (US$ Mn) Market Share by Country in 2022
- Figure 29: North America Natural Household Cleaners Market Market Attractiveness Analysis by Country, 2016-2032
- Figure 30: North America Natural Household Cleaners Market Market Revenue (US$ Mn) (2016-2032)
- Figure 31: North America Natural Household Cleaners Market Market Revenue (US$ Mn) Comparison by Country (2016-2032)
- Figure 32: North America Natural Household Cleaners Market Market Revenue (US$ Mn) Comparison by By Ingredients (2016-2032)
- Figure 33: North America Natural Household Cleaners Market Market Revenue (US$ Mn) Comparison by By Product (2016-2032)
- Figure 34: North America Natural Household Cleaners Market Market Revenue (US$ Mn) Comparison by By Distribution Channel (2016-2032)
- Figure 35: North America Natural Household Cleaners Market Market Y-o-Y Growth Rate Comparison by Country (2016-2032)
- Figure 36: North America Natural Household Cleaners Market Market Y-o-Y Growth Rate Comparison by By Ingredients (2016-2032)
- Figure 37: North America Natural Household Cleaners Market Market Y-o-Y Growth Rate Comparison by By Product (2016-2032)
- Figure 38: North America Natural Household Cleaners Market Market Y-o-Y Growth Rate Comparison by By Distribution Channel (2016-2032)
- Figure 39: North America Natural Household Cleaners Market Market Share Comparison by Country (2016-2032)
- Figure 40: North America Natural Household Cleaners Market Market Share Comparison by By Ingredients (2016-2032)
- Figure 41: North America Natural Household Cleaners Market Market Share Comparison by By Product (2016-2032)
- Figure 42: North America Natural Household Cleaners Market Market Share Comparison by By Distribution Channel (2016-2032)
- Figure 43: Western Europe Natural Household Cleaners Market Revenue (US$ Mn) Market Share by By Ingredients in 2022
- Figure 44: Western Europe Natural Household Cleaners Market Market Attractiveness Analysis by By Ingredients , 2016-2032
- Figure 45: Western Europe Natural Household Cleaners Market Revenue (US$ Mn) Market Share by By Product in 2022
- Figure 46: Western Europe Natural Household Cleaners Market Market Attractiveness Analysis by By Product , 2016-2032
- Figure 47: Western Europe Natural Household Cleaners Market Revenue (US$ Mn) Market Share by By Distribution Channelin 2022
- Figure 48: Western Europe Natural Household Cleaners Market Market Attractiveness Analysis by By Distribution Channel, 2016-2032
- Figure 49: Western Europe Natural Household Cleaners Market Revenue (US$ Mn) Market Share by Country in 2022
- Figure 50: Western Europe Natural Household Cleaners Market Market Attractiveness Analysis by Country, 2016-2032
- Figure 51: Western Europe Natural Household Cleaners Market Market Revenue (US$ Mn) (2016-2032)
- Figure 52: Western Europe Natural Household Cleaners Market Market Revenue (US$ Mn) Comparison by Country (2016-2032)
- Figure 53: Western Europe Natural Household Cleaners Market Market Revenue (US$ Mn) Comparison by By Ingredients (2016-2032)
- Figure 54: Western Europe Natural Household Cleaners Market Market Revenue (US$ Mn) Comparison by By Product (2016-2032)
- Figure 55: Western Europe Natural Household Cleaners Market Market Revenue (US$ Mn) Comparison by By Distribution Channel (2016-2032)
- Figure 56: Western Europe Natural Household Cleaners Market Market Y-o-Y Growth Rate Comparison by Country (2016-2032)
- Figure 57: Western Europe Natural Household Cleaners Market Market Y-o-Y Growth Rate Comparison by By Ingredients (2016-2032)
- Figure 58: Western Europe Natural Household Cleaners Market Market Y-o-Y Growth Rate Comparison by By Product (2016-2032)
- Figure 59: Western Europe Natural Household Cleaners Market Market Y-o-Y Growth Rate Comparison by By Distribution Channel (2016-2032)
- Figure 60: Western Europe Natural Household Cleaners Market Market Share Comparison by Country (2016-2032)
- Figure 61: Western Europe Natural Household Cleaners Market Market Share Comparison by By Ingredients (2016-2032)
- Figure 62: Western Europe Natural Household Cleaners Market Market Share Comparison by By Product (2016-2032)
- Figure 63: Western Europe Natural Household Cleaners Market Market Share Comparison by By Distribution Channel (2016-2032)
- Figure 64: Eastern Europe Natural Household Cleaners Market Revenue (US$ Mn) Market Share by By Ingredients in 2022
- Figure 65: Eastern Europe Natural Household Cleaners Market Market Attractiveness Analysis by By Ingredients , 2016-2032
- Figure 66: Eastern Europe Natural Household Cleaners Market Revenue (US$ Mn) Market Share by By Product in 2022
- Figure 67: Eastern Europe Natural Household Cleaners Market Market Attractiveness Analysis by By Product , 2016-2032
- Figure 68: Eastern Europe Natural Household Cleaners Market Revenue (US$ Mn) Market Share by By Distribution Channelin 2022
- Figure 69: Eastern Europe Natural Household Cleaners Market Market Attractiveness Analysis by By Distribution Channel, 2016-2032
- Figure 70: Eastern Europe Natural Household Cleaners Market Revenue (US$ Mn) Market Share by Country in 2022
- Figure 71: Eastern Europe Natural Household Cleaners Market Market Attractiveness Analysis by Country, 2016-2032
- Figure 72: Eastern Europe Natural Household Cleaners Market Market Revenue (US$ Mn) (2016-2032)
- Figure 73: Eastern Europe Natural Household Cleaners Market Market Revenue (US$ Mn) Comparison by Country (2016-2032)
- Figure 74: Eastern Europe Natural Household Cleaners Market Market Revenue (US$ Mn) Comparison by By Ingredients (2016-2032)
- Figure 75: Eastern Europe Natural Household Cleaners Market Market Revenue (US$ Mn) Comparison by By Product (2016-2032)
- Figure 76: Eastern Europe Natural Household Cleaners Market Market Revenue (US$ Mn) Comparison by By Distribution Channel (2016-2032)
- Figure 77: Eastern Europe Natural Household Cleaners Market Market Y-o-Y Growth Rate Comparison by Country (2016-2032)
- Figure 78: Eastern Europe Natural Household Cleaners Market Market Y-o-Y Growth Rate Comparison by By Ingredients (2016-2032)
- Figure 79: Eastern Europe Natural Household Cleaners Market Market Y-o-Y Growth Rate Comparison by By Product (2016-2032)
- Figure 80: Eastern Europe Natural Household Cleaners Market Market Y-o-Y Growth Rate Comparison by By Distribution Channel (2016-2032)
- Figure 81: Eastern Europe Natural Household Cleaners Market Market Share Comparison by Country (2016-2032)
- Figure 82: Eastern Europe Natural Household Cleaners Market Market Share Comparison by By Ingredients (2016-2032)
- Figure 83: Eastern Europe Natural Household Cleaners Market Market Share Comparison by By Product (2016-2032)
- Figure 84: Eastern Europe Natural Household Cleaners Market Market Share Comparison by By Distribution Channel (2016-2032)
- Figure 85: APAC Natural Household Cleaners Market Revenue (US$ Mn) Market Share by By Ingredients in 2022
- Figure 86: APAC Natural Household Cleaners Market Market Attractiveness Analysis by By Ingredients , 2016-2032
- Figure 87: APAC Natural Household Cleaners Market Revenue (US$ Mn) Market Share by By Product in 2022
- Figure 88: APAC Natural Household Cleaners Market Market Attractiveness Analysis by By Product , 2016-2032
- Figure 89: APAC Natural Household Cleaners Market Revenue (US$ Mn) Market Share by By Distribution Channelin 2022
- Figure 90: APAC Natural Household Cleaners Market Market Attractiveness Analysis by By Distribution Channel, 2016-2032
- Figure 91: APAC Natural Household Cleaners Market Revenue (US$ Mn) Market Share by Country in 2022
- Figure 92: APAC Natural Household Cleaners Market Market Attractiveness Analysis by Country, 2016-2032
- Figure 93: APAC Natural Household Cleaners Market Market Revenue (US$ Mn) (2016-2032)
- Figure 94: APAC Natural Household Cleaners Market Market Revenue (US$ Mn) Comparison by Country (2016-2032)
- Figure 95: APAC Natural Household Cleaners Market Market Revenue (US$ Mn) Comparison by By Ingredients (2016-2032)
- Figure 96: APAC Natural Household Cleaners Market Market Revenue (US$ Mn) Comparison by By Product (2016-2032)
- Figure 97: APAC Natural Household Cleaners Market Market Revenue (US$ Mn) Comparison by By Distribution Channel (2016-2032)
- Figure 98: APAC Natural Household Cleaners Market Market Y-o-Y Growth Rate Comparison by Country (2016-2032)
- Figure 99: APAC Natural Household Cleaners Market Market Y-o-Y Growth Rate Comparison by By Ingredients (2016-2032)
- Figure 100: APAC Natural Household Cleaners Market Market Y-o-Y Growth Rate Comparison by By Product (2016-2032)
- Figure 101: APAC Natural Household Cleaners Market Market Y-o-Y Growth Rate Comparison by By Distribution Channel (2016-2032)
- Figure 102: APAC Natural Household Cleaners Market Market Share Comparison by Country (2016-2032)
- Figure 103: APAC Natural Household Cleaners Market Market Share Comparison by By Ingredients (2016-2032)
- Figure 104: APAC Natural Household Cleaners Market Market Share Comparison by By Product (2016-2032)
- Figure 105: APAC Natural Household Cleaners Market Market Share Comparison by By Distribution Channel (2016-2032)
- Figure 106: Latin America Natural Household Cleaners Market Revenue (US$ Mn) Market Share by By Ingredients in 2022
- Figure 107: Latin America Natural Household Cleaners Market Market Attractiveness Analysis by By Ingredients , 2016-2032
- Figure 108: Latin America Natural Household Cleaners Market Revenue (US$ Mn) Market Share by By Product in 2022
- Figure 109: Latin America Natural Household Cleaners Market Market Attractiveness Analysis by By Product , 2016-2032
- Figure 110: Latin America Natural Household Cleaners Market Revenue (US$ Mn) Market Share by By Distribution Channelin 2022
- Figure 111: Latin America Natural Household Cleaners Market Market Attractiveness Analysis by By Distribution Channel, 2016-2032
- Figure 112: Latin America Natural Household Cleaners Market Revenue (US$ Mn) Market Share by Country in 2022
- Figure 113: Latin America Natural Household Cleaners Market Market Attractiveness Analysis by Country, 2016-2032
- Figure 114: Latin America Natural Household Cleaners Market Market Revenue (US$ Mn) (2016-2032)
- Figure 115: Latin America Natural Household Cleaners Market Market Revenue (US$ Mn) Comparison by Country (2016-2032)
- Figure 116: Latin America Natural Household Cleaners Market Market Revenue (US$ Mn) Comparison by By Ingredients (2016-2032)
- Figure 117: Latin America Natural Household Cleaners Market Market Revenue (US$ Mn) Comparison by By Product (2016-2032)
- Figure 118: Latin America Natural Household Cleaners Market Market Revenue (US$ Mn) Comparison by By Distribution Channel (2016-2032)
- Figure 119: Latin America Natural Household Cleaners Market Market Y-o-Y Growth Rate Comparison by Country (2016-2032)
- Figure 120: Latin America Natural Household Cleaners Market Market Y-o-Y Growth Rate Comparison by By Ingredients (2016-2032)
- Figure 121: Latin America Natural Household Cleaners Market Market Y-o-Y Growth Rate Comparison by By Product (2016-2032)
- Figure 122: Latin America Natural Household Cleaners Market Market Y-o-Y Growth Rate Comparison by By Distribution Channel (2016-2032)
- Figure 123: Latin America Natural Household Cleaners Market Market Share Comparison by Country (2016-2032)
- Figure 124: Latin America Natural Household Cleaners Market Market Share Comparison by By Ingredients (2016-2032)
- Figure 125: Latin America Natural Household Cleaners Market Market Share Comparison by By Product (2016-2032)
- Figure 126: Latin America Natural Household Cleaners Market Market Share Comparison by By Distribution Channel (2016-2032)
- Figure 127: Middle East & Africa Natural Household Cleaners Market Revenue (US$ Mn) Market Share by By Ingredients in 2022
- Figure 128: Middle East & Africa Natural Household Cleaners Market Market Attractiveness Analysis by By Ingredients , 2016-2032
- Figure 129: Middle East & Africa Natural Household Cleaners Market Revenue (US$ Mn) Market Share by By Product in 2022
- Figure 130: Middle East & Africa Natural Household Cleaners Market Market Attractiveness Analysis by By Product , 2016-2032
- Figure 131: Middle East & Africa Natural Household Cleaners Market Revenue (US$ Mn) Market Share by By Distribution Channelin 2022
- Figure 132: Middle East & Africa Natural Household Cleaners Market Market Attractiveness Analysis by By Distribution Channel, 2016-2032
- Figure 133: Middle East & Africa Natural Household Cleaners Market Revenue (US$ Mn) Market Share by Country in 2022
- Figure 134: Middle East & Africa Natural Household Cleaners Market Market Attractiveness Analysis by Country, 2016-2032
- Figure 135: Middle East & Africa Natural Household Cleaners Market Market Revenue (US$ Mn) (2016-2032)
- Figure 136: Middle East & Africa Natural Household Cleaners Market Market Revenue (US$ Mn) Comparison by Country (2016-2032)
- Figure 137: Middle East & Africa Natural Household Cleaners Market Market Revenue (US$ Mn) Comparison by By Ingredients (2016-2032)
- Figure 138: Middle East & Africa Natural Household Cleaners Market Market Revenue (US$ Mn) Comparison by By Product (2016-2032)
- Figure 139: Middle East & Africa Natural Household Cleaners Market Market Revenue (US$ Mn) Comparison by By Distribution Channel (2016-2032)
- Figure 140: Middle East & Africa Natural Household Cleaners Market Market Y-o-Y Growth Rate Comparison by Country (2016-2032)
- Figure 141: Middle East & Africa Natural Household Cleaners Market Market Y-o-Y Growth Rate Comparison by By Ingredients (2016-2032)
- Figure 142: Middle East & Africa Natural Household Cleaners Market Market Y-o-Y Growth Rate Comparison by By Product (2016-2032)
- Figure 143: Middle East & Africa Natural Household Cleaners Market Market Y-o-Y Growth Rate Comparison by By Distribution Channel (2016-2032)
- Figure 144: Middle East & Africa Natural Household Cleaners Market Market Share Comparison by Country (2016-2032)
- Figure 145: Middle East & Africa Natural Household Cleaners Market Market Share Comparison by By Ingredients (2016-2032)
- Figure 146: Middle East & Africa Natural Household Cleaners Market Market Share Comparison by By Product (2016-2032)
- Figure 147: Middle East & Africa Natural Household Cleaners Market Market Share Comparison by By Distribution Channel (2016-2032)
"
- List of Tables
- "
- Table 1: Global Natural Household Cleaners Market Market Comparison by By Ingredients (2016-2032)
- Table 2: Global Natural Household Cleaners Market Market Comparison by By Product (2016-2032)
- Table 3: Global Natural Household Cleaners Market Market Comparison by By Distribution Channel (2016-2032)
- Table 4: Global Natural Household Cleaners Market Revenue (US$ Mn) Comparison by Region (2016-2032)
- Table 5: Global Natural Household Cleaners Market Market Revenue (US$ Mn) (2016-2032)
- Table 6: Global Natural Household Cleaners Market Market Revenue (US$ Mn) Comparison by Region (2016-2032)
- Table 7: Global Natural Household Cleaners Market Market Revenue (US$ Mn) Comparison by By Ingredients (2016-2032)
- Table 8: Global Natural Household Cleaners Market Market Revenue (US$ Mn) Comparison by By Product (2016-2032)
- Table 9: Global Natural Household Cleaners Market Market Revenue (US$ Mn) Comparison by By Distribution Channel (2016-2032)
- Table 10: Global Natural Household Cleaners Market Market Y-o-Y Growth Rate Comparison by Region (2016-2032)
- Table 11: Global Natural Household Cleaners Market Market Y-o-Y Growth Rate Comparison by By Ingredients (2016-2032)
- Table 12: Global Natural Household Cleaners Market Market Y-o-Y Growth Rate Comparison by By Product (2016-2032)
- Table 13: Global Natural Household Cleaners Market Market Y-o-Y Growth Rate Comparison by By Distribution Channel (2016-2032)
- Table 14: Global Natural Household Cleaners Market Market Share Comparison by Region (2016-2032)
- Table 15: Global Natural Household Cleaners Market Market Share Comparison by By Ingredients (2016-2032)
- Table 16: Global Natural Household Cleaners Market Market Share Comparison by By Product (2016-2032)
- Table 17: Global Natural Household Cleaners Market Market Share Comparison by By Distribution Channel (2016-2032)
- Table 18: North America Natural Household Cleaners Market Market Comparison by By Product (2016-2032)
- Table 19: North America Natural Household Cleaners Market Market Comparison by By Distribution Channel (2016-2032)
- Table 20: North America Natural Household Cleaners Market Revenue (US$ Mn) Comparison by Country (2016-2032)
- Table 21: North America Natural Household Cleaners Market Market Revenue (US$ Mn) (2016-2032)
- Table 22: North America Natural Household Cleaners Market Market Revenue (US$ Mn) Comparison by Country (2016-2032)
- Table 23: North America Natural Household Cleaners Market Market Revenue (US$ Mn) Comparison by By Ingredients (2016-2032)
- Table 24: North America Natural Household Cleaners Market Market Revenue (US$ Mn) Comparison by By Product (2016-2032)
- Table 25: North America Natural Household Cleaners Market Market Revenue (US$ Mn) Comparison by By Distribution Channel (2016-2032)
- Table 26: North America Natural Household Cleaners Market Market Y-o-Y Growth Rate Comparison by Country (2016-2032)
- Table 27: North America Natural Household Cleaners Market Market Y-o-Y Growth Rate Comparison by By Ingredients (2016-2032)
- Table 28: North America Natural Household Cleaners Market Market Y-o-Y Growth Rate Comparison by By Product (2016-2032)
- Table 29: North America Natural Household Cleaners Market Market Y-o-Y Growth Rate Comparison by By Distribution Channel (2016-2032)
- Table 30: North America Natural Household Cleaners Market Market Share Comparison by Country (2016-2032)
- Table 31: North America Natural Household Cleaners Market Market Share Comparison by By Ingredients (2016-2032)
- Table 32: North America Natural Household Cleaners Market Market Share Comparison by By Product (2016-2032)
- Table 33: North America Natural Household Cleaners Market Market Share Comparison by By Distribution Channel (2016-2032)
- Table 34: Western Europe Natural Household Cleaners Market Market Comparison by By Ingredients (2016-2032)
- Table 35: Western Europe Natural Household Cleaners Market Market Comparison by By Product (2016-2032)
- Table 36: Western Europe Natural Household Cleaners Market Market Comparison by By Distribution Channel (2016-2032)
- Table 37: Western Europe Natural Household Cleaners Market Revenue (US$ Mn) Comparison by Country (2016-2032)
- Table 38: Western Europe Natural Household Cleaners Market Market Revenue (US$ Mn) (2016-2032)
- Table 39: Western Europe Natural Household Cleaners Market Market Revenue (US$ Mn) Comparison by Country (2016-2032)
- Table 40: Western Europe Natural Household Cleaners Market Market Revenue (US$ Mn) Comparison by By Ingredients (2016-2032)
- Table 41: Western Europe Natural Household Cleaners Market Market Revenue (US$ Mn) Comparison by By Product (2016-2032)
- Table 42: Western Europe Natural Household Cleaners Market Market Revenue (US$ Mn) Comparison by By Distribution Channel (2016-2032)
- Table 43: Western Europe Natural Household Cleaners Market Market Y-o-Y Growth Rate Comparison by Country (2016-2032)
- Table 44: Western Europe Natural Household Cleaners Market Market Y-o-Y Growth Rate Comparison by By Ingredients (2016-2032)
- Table 45: Western Europe Natural Household Cleaners Market Market Y-o-Y Growth Rate Comparison by By Product (2016-2032)
- Table 46: Western Europe Natural Household Cleaners Market Market Y-o-Y Growth Rate Comparison by By Distribution Channel (2016-2032)
- Table 47: Western Europe Natural Household Cleaners Market Market Share Comparison by Country (2016-2032)
- Table 48: Western Europe Natural Household Cleaners Market Market Share Comparison by By Ingredients (2016-2032)
- Table 49: Western Europe Natural Household Cleaners Market Market Share Comparison by By Product (2016-2032)
- Table 50: Western Europe Natural Household Cleaners Market Market Share Comparison by By Distribution Channel (2016-2032)
- Table 51: Eastern Europe Natural Household Cleaners Market Market Comparison by By Ingredients (2016-2032)
- Table 52: Eastern Europe Natural Household Cleaners Market Market Comparison by By Product (2016-2032)
- Table 53: Eastern Europe Natural Household Cleaners Market Market Comparison by By Distribution Channel (2016-2032)
- Table 54: Eastern Europe Natural Household Cleaners Market Revenue (US$ Mn) Comparison by Country (2016-2032)
- Table 55: Eastern Europe Natural Household Cleaners Market Market Revenue (US$ Mn) (2016-2032)
- Table 56: Eastern Europe Natural Household Cleaners Market Market Revenue (US$ Mn) Comparison by Country (2016-2032)
- Table 57: Eastern Europe Natural Household Cleaners Market Market Revenue (US$ Mn) Comparison by By Ingredients (2016-2032)
- Table 58: Eastern Europe Natural Household Cleaners Market Market Revenue (US$ Mn) Comparison by By Product (2016-2032)
- Table 59: Eastern Europe Natural Household Cleaners Market Market Revenue (US$ Mn) Comparison by By Distribution Channel (2016-2032)
- Table 60: Eastern Europe Natural Household Cleaners Market Market Y-o-Y Growth Rate Comparison by Country (2016-2032)
- Table 61: Eastern Europe Natural Household Cleaners Market Market Y-o-Y Growth Rate Comparison by By Ingredients (2016-2032)
- Table 62: Eastern Europe Natural Household Cleaners Market Market Y-o-Y Growth Rate Comparison by By Product (2016-2032)
- Table 63: Eastern Europe Natural Household Cleaners Market Market Y-o-Y Growth Rate Comparison by By Distribution Channel (2016-2032)
- Table 64: Eastern Europe Natural Household Cleaners Market Market Share Comparison by Country (2016-2032)
- Table 65: Eastern Europe Natural Household Cleaners Market Market Share Comparison by By Ingredients (2016-2032)
- Table 66: Eastern Europe Natural Household Cleaners Market Market Share Comparison by By Product (2016-2032)
- Table 67: Eastern Europe Natural Household Cleaners Market Market Share Comparison by By Distribution Channel (2016-2032)
- Table 68: APAC Natural Household Cleaners Market Market Comparison by By Ingredients (2016-2032)
- Table 69: APAC Natural Household Cleaners Market Market Comparison by By Product (2016-2032)
- Table 70: APAC Natural Household Cleaners Market Market Comparison by By Distribution Channel (2016-2032)
- Table 71: APAC Natural Household Cleaners Market Revenue (US$ Mn) Comparison by Country (2016-2032)
- Table 72: APAC Natural Household Cleaners Market Market Revenue (US$ Mn) (2016-2032)
- Table 73: APAC Natural Household Cleaners Market Market Revenue (US$ Mn) Comparison by Country (2016-2032)
- Table 74: APAC Natural Household Cleaners Market Market Revenue (US$ Mn) Comparison by By Ingredients (2016-2032)
- Table 75: APAC Natural Household Cleaners Market Market Revenue (US$ Mn) Comparison by By Product (2016-2032)
- Table 76: APAC Natural Household Cleaners Market Market Revenue (US$ Mn) Comparison by By Distribution Channel (2016-2032)
- Table 77: APAC Natural Household Cleaners Market Market Y-o-Y Growth Rate Comparison by Country (2016-2032)
- Table 78: APAC Natural Household Cleaners Market Market Y-o-Y Growth Rate Comparison by By Ingredients (2016-2032)
- Table 79: APAC Natural Household Cleaners Market Market Y-o-Y Growth Rate Comparison by By Product (2016-2032)
- Table 80: APAC Natural Household Cleaners Market Market Y-o-Y Growth Rate Comparison by By Distribution Channel (2016-2032)
- Table 81: APAC Natural Household Cleaners Market Market Share Comparison by Country (2016-2032)
- Table 82: APAC Natural Household Cleaners Market Market Share Comparison by By Ingredients (2016-2032)
- Table 83: APAC Natural Household Cleaners Market Market Share Comparison by By Product (2016-2032)
- Table 84: APAC Natural Household Cleaners Market Market Share Comparison by By Distribution Channel (2016-2032)
- Table 85: Latin America Natural Household Cleaners Market Market Comparison by By Ingredients (2016-2032)
- Table 86: Latin America Natural Household Cleaners Market Market Comparison by By Product (2016-2032)
- Table 87: Latin America Natural Household Cleaners Market Market Comparison by By Distribution Channel (2016-2032)
- Table 88: Latin America Natural Household Cleaners Market Revenue (US$ Mn) Comparison by Country (2016-2032)
- Table 89: Latin America Natural Household Cleaners Market Market Revenue (US$ Mn) (2016-2032)
- Table 90: Latin America Natural Household Cleaners Market Market Revenue (US$ Mn) Comparison by Country (2016-2032)
- Table 91: Latin America Natural Household Cleaners Market Market Revenue (US$ Mn) Comparison by By Ingredients (2016-2032)
- Table 92: Latin America Natural Household Cleaners Market Market Revenue (US$ Mn) Comparison by By Product (2016-2032)
- Table 93: Latin America Natural Household Cleaners Market Market Revenue (US$ Mn) Comparison by By Distribution Channel (2016-2032)
- Table 94: Latin America Natural Household Cleaners Market Market Y-o-Y Growth Rate Comparison by Country (2016-2032)
- Table 95: Latin America Natural Household Cleaners Market Market Y-o-Y Growth Rate Comparison by By Ingredients (2016-2032)
- Table 96: Latin America Natural Household Cleaners Market Market Y-o-Y Growth Rate Comparison by By Product (2016-2032)
- Table 97: Latin America Natural Household Cleaners Market Market Y-o-Y Growth Rate Comparison by By Distribution Channel (2016-2032)
- Table 98: Latin America Natural Household Cleaners Market Market Share Comparison by Country (2016-2032)
- Table 99: Latin America Natural Household Cleaners Market Market Share Comparison by By Ingredients (2016-2032)
- Table 100: Latin America Natural Household Cleaners Market Market Share Comparison by By Product (2016-2032)
- Table 101: Latin America Natural Household Cleaners Market Market Share Comparison by By Distribution Channel (2016-2032)
- Table 102: Middle East & Africa Natural Household Cleaners Market Market Comparison by By Ingredients (2016-2032)
- Table 103: Middle East & Africa Natural Household Cleaners Market Market Comparison by By Product (2016-2032)
- Table 104: Middle East & Africa Natural Household Cleaners Market Market Comparison by By Distribution Channel (2016-2032)
- Table 105: Middle East & Africa Natural Household Cleaners Market Revenue (US$ Mn) Comparison by Country (2016-2032)
- Table 106: Middle East & Africa Natural Household Cleaners Market Market Revenue (US$ Mn) (2016-2032)
- Table 107: Middle East & Africa Natural Household Cleaners Market Market Revenue (US$ Mn) Comparison by Country (2016-2032)
- Table 108: Middle East & Africa Natural Household Cleaners Market Market Revenue (US$ Mn) Comparison by By Ingredients (2016-2032)
- Table 109: Middle East & Africa Natural Household Cleaners Market Market Revenue (US$ Mn) Comparison by By Product (2016-2032)
- Table 110: Middle East & Africa Natural Household Cleaners Market Market Revenue (US$ Mn) Comparison by By Distribution Channel (2016-2032)
- Table 111: Middle East & Africa Natural Household Cleaners Market Market Y-o-Y Growth Rate Comparison by Country (2016-2032)
- Table 112: Middle East & Africa Natural Household Cleaners Market Market Y-o-Y Growth Rate Comparison by By Ingredients (2016-2032)
- Table 113: Middle East & Africa Natural Household Cleaners Market Market Y-o-Y Growth Rate Comparison by By Product (2016-2032)
- Table 114: Middle East & Africa Natural Household Cleaners Market Market Y-o-Y Growth Rate Comparison by By Distribution Channel (2016-2032)
- Table 115: Middle East & Africa Natural Household Cleaners Market Market Share Comparison by Country (2016-2032)
- Table 116: Middle East & Africa Natural Household Cleaners Market Market Share Comparison by By Ingredients (2016-2032)
- Table 117: Middle East & Africa Natural Household Cleaners Market Market Share Comparison by By Product (2016-2032)
- Table 118: Middle East & Africa Natural Household Cleaners Market Market Share Comparison by By Distribution Channel (2016-2032)
- 1. Executive Summary
-
- Procter & Gamble (Cascade)
- Unilever
- Henkel AG & Co. KGaA (Pril)
- Reckitt Benckiser Group PLC (Finish)
- Colgate-Palmolive Company
- Kao Corporation
- The Clorox Company
Our Clients


View Our Licence Options
