
Natural Health Products Market Report By Product Type (Herbal Supplements, Vitamins & Minerals, Probiotics & Prebiotics, Omega-3 Fatty Acids, Homeopathic Remedies, Traditional Chinese Medicine (TCM), Ayurvedic Products, Other Natural Supplements), By Formulation (Capsules, Tablets, Softgels, Powders, Liquids, Teas, Topical Creams/Ointments, Others), By Health Benefit, By Distribution Channel, By Region and Companies - Industry Segment Outlook, Market Assessment, Competition Scenario, Trends and Forecast 2024-2033
-
45647
-
May 2024
-
321
-


-
This report was compiled by Trishita Deb Trishita Deb is an experienced market research and consulting professional with over 7 years of expertise across healthcare, consumer goods, and materials, contributing to over 400 healthcare-related reports. Correspondence Team Lead- Healthcare Linkedin | Detailed Market research Methodology Our methodology involves a mix of primary research, including interviews with leading mental health experts, and secondary research from reputable medical journals and databases. View Detailed Methodology Page
-
Quick Navigation
Report Overview
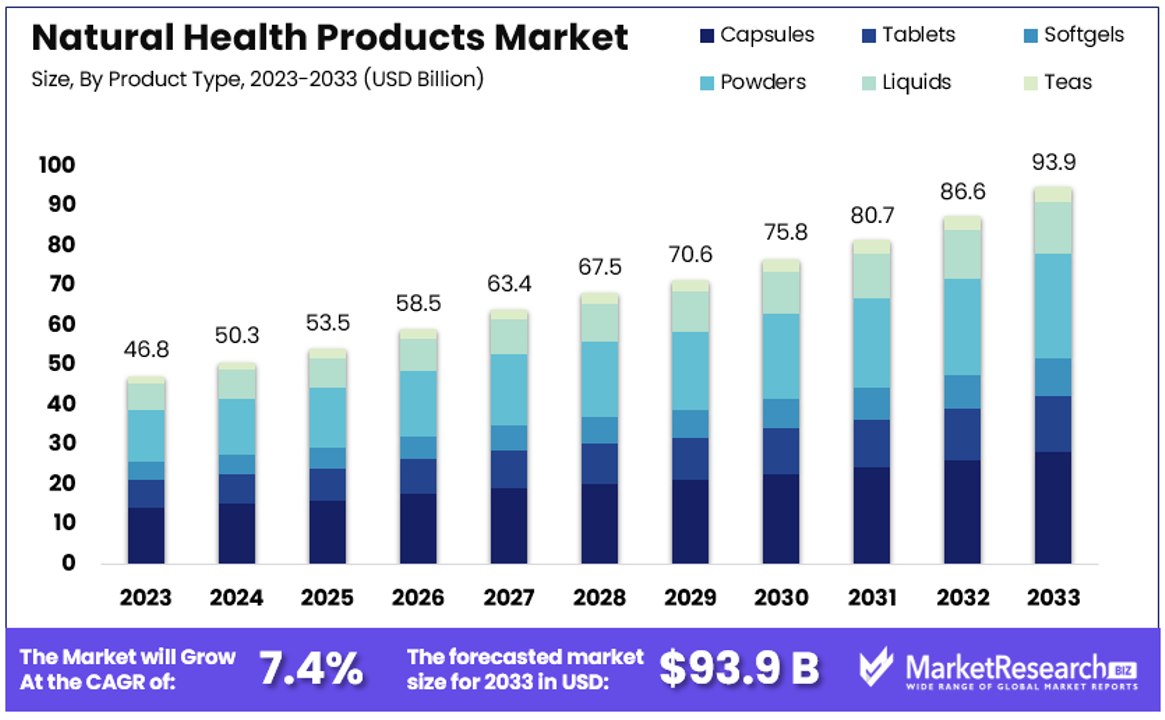
The Global Natural Health Products Market size is expected to be worth around USD 93.9 Billion by 2033, from USD 46.8 Billion in 2023, growing at a CAGR of 7.4% during the forecast period from 2024 to 2033.
The Natural Health Products Market encompasses a range of products derived from natural sources intended to enhance health. This market includes vitamins, minerals, herbal remedies, and other supplements that are increasingly popular for health maintenance and disease prevention. Consumers are driven by a growing preference for natural and organic options, often perceived as safer and more effective than synthetic alternatives.
Key players in this market are focusing on innovation, quality assurance, and compliance with regulatory standards to meet the discerning demands of health-conscious consumers. This sector presents significant growth opportunities for businesses aiming to capitalize on the trend towards healthier lifestyles.
The Natural Health Products Market is experiencing robust growth, driven by a shift in consumer preferences towards wellness and natural ingredients. In the United States, an impressive 43% of Millennials and Gen Z consumers express a preference for natural skincare products. This demographic trend is significant as these age groups often set consumer product trends and influence market dynamics.
Furthermore, a survey indicates that 61% of consumers expect natural product companies to adhere to higher standards in terms of quality, corporate mission, and sustainability practices. This reflects a broader consumer sentiment that companies in this sector are held to a more stringent accountability framework.
Additionally, the labeling of food products as "natural" strongly impacts consumer perception, with 51% of U.S. adults associating such labels with whole ingredients. This perception underscores the importance of clear and transparent labeling in driving product choice and loyalty. Companies operating in the Natural Health Products Market must navigate these expectations by integrating ethical sourcing and sustainable practices into their business models to maintain credibility and appeal to an increasingly discerning customer base.
The convergence of these factors creates a compelling growth narrative for the Natural Health Products Market. Companies that are proactive in leveraging these trends through strategic marketing, rigorous quality control, and sustainable practices are likely to secure competitive advantages. As the market continues to expand, the potential for innovation and differentiation will be key drivers for new entrants and existing players aiming to capture and retain market share in this dynamic industry segment.
Key Takeaways
- Market Value: The Global Natural Health Products Market is forecasted to reach USD 93.9 billion by 2033, reflecting growth from USD 46.8 billion in 2023, with a notable CAGR of 7.40% during the forecast period from 2024 to 2033.
- Product Type Analysis: Herbal Supplements lead with 35% market share, driven by widespread consumer trust and recognition of their health benefits, followed by vitamins and minerals, probiotics, prebiotics, omega-3 fatty acids, homeopathic remedies, and other natural supplements.
- Formulation Analysis: Capsules dominate with 30% market share due to ease of use and effective delivery of ingredients, followed by tablets, softgels, powders, liquids, teas, topical creams, and ointments.
- Health Benefit Analysis: Immune Support products dominate with 40% market share, spurred by increasing health awareness and pandemic effects, followed by Digestive Health, Bone & Joint Health, Heart Health, Weight Management, Skin & Hair Health, etc
- North America: Leads the market with a 35% market share, driven by high consumer health consciousness and the widespread availability of natural health products.
- Europe: Holds a 30% share of the market, benefiting from advanced healthcare systems and increasing consumer adoption of natural health products.
- Analyst Viewpoint: Analysts anticipate steady growth in the Natural Health Products Market, driven by rising consumer interest in natural and holistic wellness solutions, increased health awareness, and expanding distribution channels.
- Growth Opportunities: Growth opportunities lie in the development of innovative product formulations, expansion into emerging markets, strategic partnerships with healthcare professionals, and leveraging digital platforms for marketing and distribution.
Driving Factors
Rising Health Consciousness Drives Market Growth
The surge in health consciousness among consumers is a pivotal driver for the Natural Health Products Market. As awareness of the adverse side effects associated with synthetic medications grows, more individuals are turning towards natural remedies that offer perceived safety and effectiveness. For instance, the popularity of herbal supplements like turmeric and ginger, known for their anti-inflammatory properties, highlights this trend.
This shift is not just about avoiding synthetics but also about embracing products that support long-term health and wellness. The demand for natural alternatives spans across various demographics, particularly among those who are proactive about their health. This broad and growing interest directly contributes to the market expansion, as consumers not only seek but also trust natural products to maintain their health.
Increasing Prevalence of Chronic Diseases Fuels Market Expansion
The rising global incidence of chronic conditions such as diabetes, obesity, and heart disease is critically shaping the Natural Health Products Market. Many individuals perceive natural products as safer and potentially more effective than traditional pharmaceuticals, especially for long-term management and prevention.
Natural supplements like green tea and garcinia cambogia, which are favored for their weight management benefits, have become increasingly popular. This trend reflects a wider consumer shift towards natural health solutions that align with a holistic approach to healthcare. By integrating these natural options into their health regimes, consumers are actively addressing chronic health issues, thereby driving continuous growth in the market.
Shift Towards Preventive Healthcare Propels Market Growth
A significant shift towards preventive healthcare has become a major growth factor in the Natural Health Products Market. Today's consumers are more proactive than ever in adopting lifestyles that emphasize disease prevention and overall well-being. This preventive approach is markedly boosting the demand for products like probiotics, antioxidants, and natural immune boosters.
The popularity of these products is supported by a growing body of research that underscores their health benefits, leading to increased consumer trust and market demand. The focus on prevention rather than cure reflects a fundamental change in healthcare perspectives, catalyzing the expansion of the natural health products sector. This trend not only increases the current market size but also sets a stable foundation for future growth as more consumers adopt preventive healthcare practices.
Restraining Factors
Lack of Standardization and Quality Control Restrains Market Growth
The absence of standardized regulations and robust quality control in the Natural Health Products Market significantly hampers its growth. Despite ongoing regulatory efforts, inconsistencies remain prevalent in product quality, potency, and efficacy across different regions and brands. These inconsistencies can lead to products that do not meet consumer expectations or, worse, may be unsafe.
For instance, certain herbal supplements have been found to contain undisclosed ingredients or exhibit variable potency due to poor manufacturing controls. Such issues erode consumer trust and discourage adoption, as buyers are left unsure about the reliability and effectiveness of these products. Overcoming this challenge is crucial for the market to maintain its credibility and ensure sustained consumer engagement.
Limited Scientific Evidence and Research Restrains Market Growth
A major limitation facing the Natural Health Products Market is the lack of comprehensive scientific research and clinical trials to support many of the claims made by these products. While traditional and anecdotal evidence may be compelling, the modern healthcare environment demands rigorous scientific validation to support the safety and efficacy of health products.
The absence of such evidence can lead to skepticism among healthcare professionals and consumers alike. For example, many traditional remedies or plant-based extracts lack thorough, scientifically robust studies that verify their health benefits. This skepticism can limit the market's growth by restraining the widespread acceptance and integration of natural health products into mainstream healthcare and consumer health regimens.
Product Type Analysis
Herbal Supplements dominate with 35% due to widespread consumer trust and recognition of their health benefits.
The Product Type segment of the Natural Health Products Market is significantly led by Herbal Supplements, which currently hold approximately 35% of the market share. This dominance is largely attributed to the deep-rooted consumer perception of herbal products as safe and effective natural remedies. Herbal supplements, including popular choices like turmeric, ginseng, and echinacea, have been traditionally used for centuries, which lends them a credibility that newer or less familiar supplements may lack. The trust in these products is further bolstered by a growing body of scientific research that supports their health benefits, making them a go-to option for consumers looking for natural health solutions.
Vitamins and minerals form another critical sub-segment, supported by their well-established roles in maintaining essential body functions and preventing nutrient deficiencies. Probiotics and prebiotics are rapidly gaining market share due to increasing awareness of gut health's impact on overall well-being. Omega-3 fatty acids are recognized for their benefits to heart and brain health, making them popular among various consumer demographics. Homeopathic remedies, Traditional Chinese Medicine (TCM), and Ayurvedic products each cater to niche markets that value specific cultural and holistic treatment approaches. Other natural supplements, including novel plant extracts and blends, contribute to the diversity and depth of the market, fulfilling the demand for personalized health care solutions.
Formulation Analysis
Capsules lead with 30% due to ease of use and effective delivery of ingredients.
In the Formulation segment of the Natural Health Products Market, capsules emerge as the dominant sub-segment, holding about 30% of the market. Their popularity stems from the convenience they offer—capsules are easy to consume, carry, and store, making them a preferred choice for both consumers and manufacturers. Additionally, capsules effectively mask the taste and odor of their contents, which enhances consumer acceptance, especially for supplements like fish oil, which may have an unpleasant natural taste.
Tablets are another prevalent form, favored for their cost-effectiveness and long shelf life, which appeals to price-sensitive consumers. Softgels share similar advantages to capsules, including the ability to contain liquid ingredients, which can enhance the bioavailability of certain supplements like vitamin E and omega-3 fatty acids. Powders and liquids offer flexible dosing options and are particularly popular in the sports nutrition and weight management categories. Teas have a traditional appeal and are increasingly being infused with various herbs and supplements to enhance health benefits. Topical creams and ointments provide targeted relief and are essential in segments like natural pain relief and skin care. The diversity of formulations allows manufacturers to meet specific consumer needs, ensuring the sustained growth of each sub-segment within the broader market.
Health Benefit Analysis
Immune Support dominates with 40% due to increasing health awareness and pandemic effects.
In the Health Benefit segment of the Natural Health Products Market, Immune Support products are distinctly leading, holding approximately 40% of this market segment. This dominance has been significantly bolstered by the heightened consumer focus on health maintenance and disease prevention, especially in light of recent global health crises. Products that support immune health, including supplements rich in vitamins C and D, zinc, and elderberry, have seen a surge in demand as consumers seek to bolster their immune systems against potential infections.
Digestive Health is another key area, with products like probiotics and prebiotics gaining traction due to growing awareness of gut health's critical role in overall wellness. Bone & Joint Health remains a staple in the market, driven by an aging population and increasing incidences of arthritis and osteoporosis. Heart Health and Weight Management products also see steady demand, reflecting ongoing concerns over cardiovascular diseases and obesity, respectively.
The market for Skin & Hair Health products is expanding, fueled by consumer interest in natural beauty and personal care products that offer cosmetic benefits along with health improvements. Mental Wellness, Energy & Vitality, and Detoxification products cater to niche but growing segments, focusing on holistic health and the integration of mental and physical well-being. Each of these sub-segments contributes to the overall diversity and growth of the natural health products market, addressing a wide array of consumer health concerns.
Distribution Channel Analysis
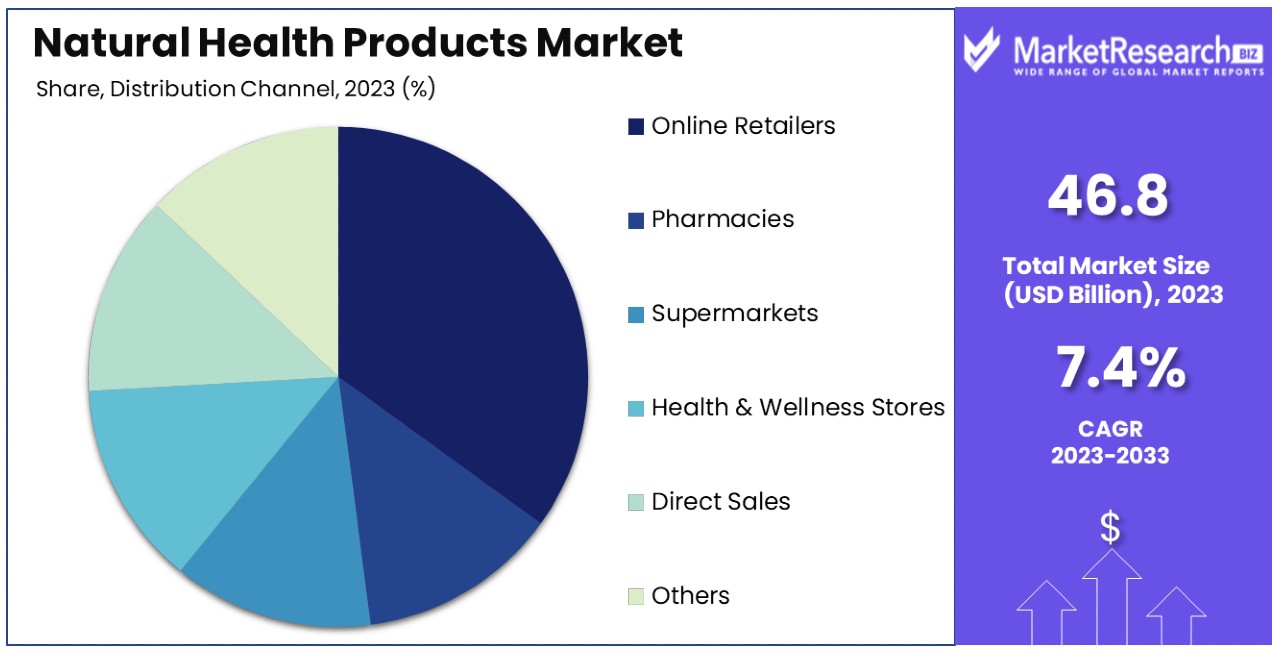
Online Retailers lead with 45% due to convenience and the rise of e-commerce.
In the Distribution Channel segment, Online Retailers currently dominate the Natural Health Products Market, capturing about 45% of the market share. This dominance is largely driven by the convenience and widespread availability of online shopping platforms, coupled with the increasing consumer preference for buying products from the comfort of their homes. The growth of e-commerce has been further accelerated by technological advancements and the expansion of digital marketing strategies, making it easier for consumers to access a wide range of natural health products globally.
Health & Wellness Stores continue to play a crucial role in the market, serving as trusted sources for consumers looking for personalized service and expert advice. Pharmacies and Drugstores are essential for distributing products that consumers perceive as more medical-oriented, such as vitamins and supplements for specific health conditions. Supermarkets and Hypermarkets have increased their health product ranges to capture the growing consumer interest in health and wellness, making natural health products more accessible alongside everyday grocery shopping.
Direct Sales, including MLM companies, exploit personal selling and network marketing strategies to reach and educate consumers about the benefits of their products, often focusing on specific supplements like weight management shakes or nutritional systems. Other distribution channels, including specialty stores and fitness centers, complement the overall market by targeting specific consumer segments and creating additional avenues for product sales. Each channel's role and strategy contribute to the sector's dynamics, influencing how products are marketed, accessed, and consumed within different consumer demographics.
Key Market Segments
By Product Type
- Herbal Supplements
- Vitamins & Minerals
- Probiotics & Prebiotics
- Omega-3 Fatty Acids
- Homeopathic Remedies
- Traditional Chinese Medicine (TCM)
- Ayurvedic Products
- Other Natural Supplements
By Formulation
- Capsules
- Tablets
- Softgels
- Powders
- Liquids
- Teas
- Topical Creams/Ointments
- Others
By Health Benefit
- Immune Support
- Digestive Health
- Bone & Joint Health
- Heart Health
- Weight Management
- Skin & Hair Health
- Mental Wellness
- Energy & Vitality
- Detoxification
- Others
By Distribution Channel
- Health & Wellness Stores
- Pharmacies/Drugstores
- Supermarkets/Hypermarkets
- Online Retailers
- Direct Sales (MLM Companies)
- Others
Growth Opportunities
E-commerce and Direct-to-Consumer (D2C) Channels Offer Growth Opportunity
The ascent of e-commerce and Direct-to-Consumer (D2C) channels marks a significant growth opportunity for the Natural Health Products Market. This shift allows companies to engage directly with consumers, bypassing traditional retail constraints and fostering a more personalized shopping experience. With the convenience of online shopping, consumers have easy access to a broader range of products, including those that are niche or region-specific.
Data analytics employed by these platforms enable companies to tailor their marketing strategies and product recommendations based on individual consumer behavior and preferences. Subscription models, which ensure regular product delivery, have become particularly popular, reinforcing customer loyalty and consistent revenue streams. This direct engagement not only increases visibility but also enhances consumer trust through personalized interactions and improved service quality.
Strategic Partnerships and Collaborations Offer Growth Opportunity
Strategic partnerships and collaborations present considerable growth opportunities within the Natural Health Products Market. By aligning with research institutions and healthcare professionals, companies can drive innovation and substantiate the health claims of their products through clinical research. Such collaborations often result in the development of scientifically backed products that can meet the stringent requirements of informed consumers and healthcare providers.
For instance, partnering with universities to conduct research can provide the necessary clinical evidence to support the efficacy and safety of natural health products, significantly boosting their market credibility. Moreover, these partnerships can facilitate entry into new markets and expand the consumer base by leveraging the established trust and authority of the academic and medical communities. These strategic alliances not only enhance product offerings but also fortify brand reputations and consumer confidence, setting the stage for sustained growth.
Trending Factors
Clean Label and Transparency Are Trending Factors
Clean label and transparency are becoming increasingly influential trends in the Natural Health Products Market. Consumers are more health-conscious than ever and demand clarity about what they consume. This trend towards transparency requires products to have straightforward, easily understandable labels that list all ingredients without any hidden or synthetic additives.
Companies that commit to clean label practices are rewarded with greater consumer trust and loyalty. For example, brands that use recognizable, non-artificial ingredients and provide comprehensive details about their sourcing are finding favor with consumers who prioritize product purity and ethical production methods. This push for transparency is not just a preference but a demand from consumers who are more informed and vigilant about their health and the environment.
Personalization and Customization Are Trending Factors
Personalization and customization are shaping up as key trends in the Natural Health Products Market. Today's consumers are not satisfied with one-size-fits-all solutions and seek products tailored to their specific health needs and lifestyle choices. The rising trend of personalized health care allows companies to offer products that are specifically designed to cater to individual dietary requirements, health conditions, and even genetic profiles.
For instance, the popularity of services like personalized vitamin subscriptions, which use algorithms to tailor supplement packs based on individual health data, highlights the growing demand for customized health products. This trend is driving innovation in the market, encouraging companies to develop new technologies and formulations that can meet the unique preferences and needs of each consumer, thus expanding the market's reach and penetration.
Regional Analysis
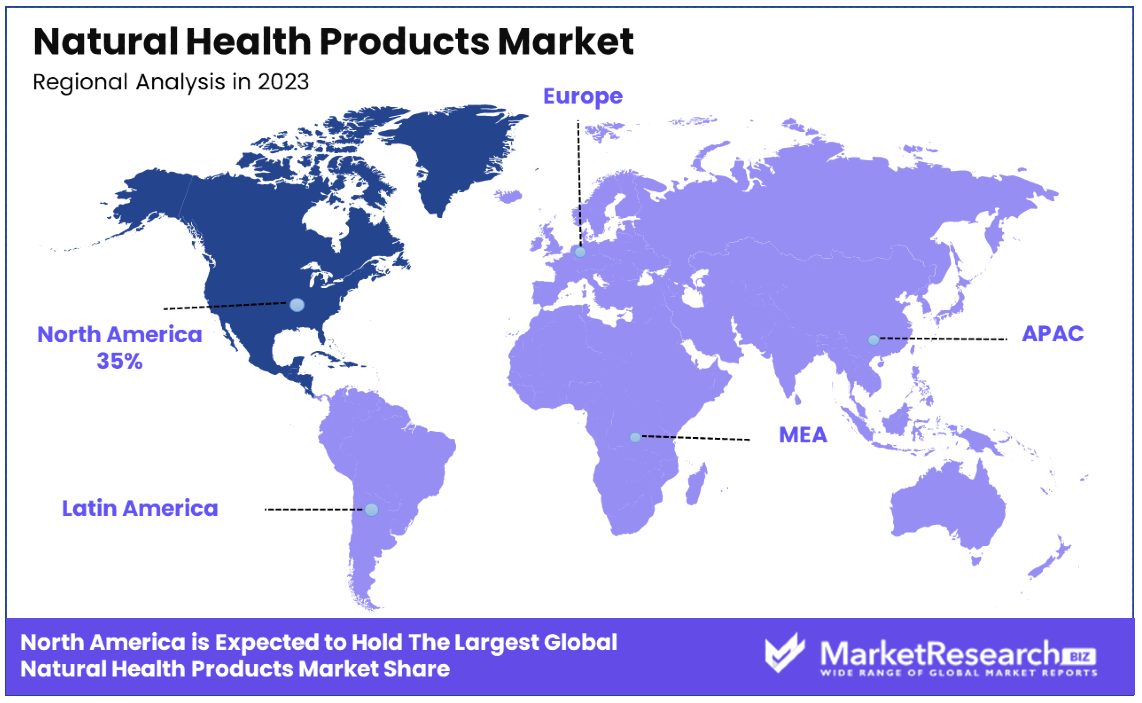
North America Dominates with 35% Market Share
North America holds a dominant position in the Natural Health Products Market, commanding a 35% market share. This leadership is primarily driven by high consumer awareness and acceptance of natural and alternative health solutions, especially in the U.S. and Canada. The region boasts a robust infrastructure for health and wellness, including extensive retail networks and a strong online presence, which facilitates wide product availability and accessibility. Additionally, North America has stringent regulatory standards ensuring product quality and safety, increasing consumer trust.
The market dynamics in North America are shaped by a proactive approach towards health and wellness, with consumers increasingly opting for preventive health care measures. There is also a significant trend towards clean labels and organic products, driven by consumer demand for transparency and quality. The presence of major global players in this region who invest heavily in research and development contributes to continuous innovation and product diversification, further strengthening the market's growth.
Regional Market Shares:
- Europe: Holds a 30% share of the market, driven by increasing consumer preference for natural and organic products and strong regulatory frameworks.
- Asia Pacific: Accounts for 25% of the market, with growth fueled by expanding middle-class populations and increasing awareness of health and wellness.
- Latin America: Represents 5% of the market, with potential growth due to rising health consciousness and improving healthcare infrastructure.
- Middle East & Africa: Contributes 5% to the market, where gradual awareness and the availability of natural health products are starting to gain traction.
Key Regions and Countries
- North America
- The US
- Canada
- Mexico
- Western Europe
- Germany
- France
- The UK
- Spain
- Italy
- Portugal
- Ireland
- Austria
- Switzerland
- Benelux
- Nordic
- Rest of Western Europe
- Eastern Europe
- Russia
- Poland
- The Czech Republic
- Greece
- Rest of Eastern Europe
- APAC
- China
- Japan
- South Korea
- India
- Australia & New Zealand
- Indonesia
- Malaysia
- Philippines
- Singapore
- Thailand
- Vietnam
- Rest of APAC
- Latin America
- Brazil
- Colombia
- Chile
- Argentina
- Costa Rica
- Rest of Latin America
- Middle East & Africa
- Algeria
- Egypt
- Israel
- Kuwait
- Nigeria
- Saudi Arabia
- South Africa
- Turkey
- United Arab Emirates
- Rest of MEA
Key Players Analysis
In the natural health products market, various companies play crucial roles, each with distinct impacts and strategic positioning contributing to market influence.
GFR Pharma, USANA Health Sciences, Inc., and Herbalife Nutrition are among the major players shaping the market landscape. Their diverse product portfolios and widespread distribution networks enable them to reach a broad consumer base, exerting significant market influence.
Nestlé Health Science, Blackmores, and Nature's Bounty also hold substantial market shares. Leveraging their strong brand presence and commitment to quality, these companies cater to evolving consumer preferences, driving market growth.
NOW Foods and GNC (General Nutrition Centers) play pivotal roles in the market, offering a wide range of natural health products and supplements. Their strategic partnerships and retail presence contribute to market expansion and consumer accessibility.
Gaia Herbs, Swisse Wellness, and The Himalaya Drug Company are notable players known for their focus on herbal remedies and natural ingredients. Their emphasis on sustainability and wellness resonates with consumers, enhancing their strategic positioning in the market.
Young Living, with its emphasis on essential oils and holistic wellness, occupies a significant market share. Its direct sales model and commitment to purity and authenticity position it as a key player driving market trends and consumer preferences.
Overall, the natural health products market is characterized by dynamic competition and continuous innovation. The strategic positioning and market influence of these key players contribute to the overall growth and evolution of the industry, catering to the increasing demand for natural and wellness-focused products.
Market Key Players
- GFR Pharma
- USANA Health Sciences, Inc.
- Herbalife Nutrition
- Nestlé Health Science
- Blackmores
- Nature's Bounty
- NOW Foods
- GNC (General Nutrition Centers)
- Gaia Herbs
- Swisse Wellness
- The Himalaya Drug Company
- Young Living
Recent Developments
- On April 2024, researchers at Dalhousie University in Canada, in collaboration with the pet nutraceutical company Adored Beast Apothecary, are developing a manufacturing process for natural health products to help manage cancers in dogs.
- On April 2024, the International Union for Conservation of Nature (IUCN) and its partners launched the One Health Central Asia project, which aims to mitigate the risk of zoonotic diseases in Central Asia.
- On March 2024, BranchOut Food Inc., a food technology company, announced that it will debut a brand refresh and launch two new product lines, including Salad Toppers and Kids' Snack Packs, at the Natural Products Expo West in Anaheim, California.
Report Scope
Report Features Description Market Value (2023) USD 46.8 Billion Forecast Revenue (2033) USD 93.9 Billion CAGR (2024-2033) 7.40% Base Year for Estimation 2023 Historic Period 2018-2023 Forecast Period 2024-2033 Report Coverage Revenue Forecast, Market Dynamics, Competitive Landscape, Recent Developments Segments Covered By Product Type (Herbal Supplements, Vitamins & Minerals, Probiotics & Prebiotics, Omega-3 Fatty Acids, Homeopathic Remedies, Traditional Chinese Medicine (TCM), Ayurvedic Products, Other Natural Supplements), By Formulation (Capsules, Tablets, Softgels, Powders, Liquids, Teas, Topical Creams/Ointments, Others), By Health Benefit (Immune Support, Digestive Health, Bone & Joint Health, Heart Health, Weight Management, Skin & Hair Health, Mental Wellness, Energy & Vitality, Detoxification, Others), By Distribution Channel (Health & Wellness Stores, Pharmacies/Drugstores, Supermarkets/Hypermarkets, Online Retailers, Direct Sales (MLM Companies), Others) Regional Analysis North America - The US, Canada, & Mexico; Western Europe - Germany, France, The UK, Spain, Italy, Portugal, Ireland, Austria, Switzerland, Benelux, Nordic, & Rest of Western Europe; Eastern Europe - Russia, Poland, The Czech Republic, Greece, & Rest of Eastern Europe; APAC - China, Japan, South Korea, India, Australia & New Zealand, Indonesia, Malaysia, Philippines, Singapore, Thailand, Vietnam, & Rest of APAC; Latin America - Brazil, Colombia, Chile, Argentina, Costa Rica, & Rest of Latin America; Middle East & Africa - Algeria, Egypt, Israel, Kuwait, Nigeria, Saudi Arabia, South Africa, Turkey, United Arab Emirates, & Rest of MEA Competitive Landscape GFR Pharma, USANA Health Sciences, Inc., Herbalife Nutrition, Nestlé Health Science, Blackmores, Nature's Bounty, NOW Foods, GNC (General Nutrition Centers), Gaia Herbs, Swisse Wellness, The Himalaya Drug Company, Young Living Customization Scope Customization for segments, region/country-level will be provided. Moreover, additional customization can be done based on the requirements. Purchase Options We have three licenses to opt for: Single User License, Multi-User License (Up to 5 Users), Corporate Use License (Unlimited User and Printable PDF) -
- 1. Executive Summary
- 1.1. Definition
- 1.2. Taxonomy
- 1.3. Research Scope
- 1.4. Key Analysis
- 1.5. Key Findings by Major Segments
- 1.6. Top strategies by Major Players
- 2. Global Natural Health Products Market Overview
- 2.1. Natural Health Products Market Dynamics
- 2.1.1. Drivers
- 2.1.2. Opportunities
- 2.1.3. Restraints
- 2.1.4. Challenges
- 2.2. Macro-economic Factors
- 2.3. Regulatory Framework
- 2.4. Market Investment Feasibility Index
- 2.5. PEST Analysis
- 2.6. PORTER’S Five Force Analysis
- 2.7. Drivers & Restraints Impact Analysis
- 2.8. Industry Chain Analysis
- 2.9. Cost Structure Analysis
- 2.10. Marketing Strategy
- 2.11. Russia-Ukraine War Impact Analysis
- 2.12. Opportunity Map Analysis
- 2.13. Market Competition Scenario Analysis
- 2.14. Product Life Cycle Analysis
- 2.15. Opportunity Orbits
- 2.16. Manufacturer Intensity Map
- 2.17. Major Companies sales by Value & Volume
- 2.1. Natural Health Products Market Dynamics
- 3. Global Natural Health Products Market Analysis, Opportunity and Forecast, 2016-2032
- 3.1. Global Natural Health Products Market Analysis, 2016-2021
- 3.2. Global Natural Health Products Market Opportunity and Forecast, 2023-2032
- 3.3. Global Natural Health Products Market Analysis, Opportunity and Forecast, By Product Type, 2016-2032
- 3.3.1. Global Natural Health Products Market Analysis by Product Type: Introduction
- 3.3.2. Market Size Absolute $ Opportunity Analysis and Forecast, By Product Type, 2016-2032
- 3.3.3. Herbal Supplements
- 3.3.4. Vitamins & Minerals
- 3.3.5. Probiotics & Prebiotics
- 3.3.6. Omega-3 Fatty Acids
- 3.3.7. Homeopathic Remedies
- 3.3.8. Traditional Chinese Medicine (TCM)
- 3.3.9. Ayurvedic Products
- 3.3.10. Other Natural Supplements
- 3.4. Global Natural Health Products Market Analysis, Opportunity and Forecast, By Formulation, 2016-2032
- 3.4.1. Global Natural Health Products Market Analysis by Formulation: Introduction
- 3.4.2. Market Size Absolute $ Opportunity Analysis and Forecast, By Formulation, 2016-2032
- 3.4.3. Capsules
- 3.4.4. Tablets
- 3.4.5. Softgels
- 3.4.6. Powders
- 3.4.7. Liquids
- 3.4.8. Teas
- 3.4.9. Topical Creams/Ointments
- 3.4.10. Others
- 3.5. Global Natural Health Products Market Analysis, Opportunity and Forecast, By Health Benefit, 2016-2032
- 3.5.1. Global Natural Health Products Market Analysis by Health Benefit: Introduction
- 3.5.2. Market Size Absolute $ Opportunity Analysis and Forecast, By Health Benefit, 2016-2032
- 3.5.3. Immune Support
- 3.5.4. Digestive Health
- 3.5.5. Bone & Joint Health
- 3.5.6. Heart Health
- 3.5.7. Weight Management
- 3.5.8. Skin & Hair Health
- 3.5.9. Mental Wellness
- 3.5.10. Energy & Vitality
- 3.5.11. Detoxification
- 3.5.12. Others
- 3.6. Global Natural Health Products Market Analysis, Opportunity and Forecast, By Distribution Channel, 2016-2032
- 3.6.1. Global Natural Health Products Market Analysis by Distribution Channel: Introduction
- 3.6.2. Market Size Absolute $ Opportunity Analysis and Forecast, By Distribution Channel, 2016-2032
- 3.6.3. Health & Wellness Stores
- 3.6.4. Pharmacies/Drugstores
- 3.6.5. Supermarkets/Hypermarkets
- 3.6.6. Online Retailers
- 3.6.7. Direct Sales (MLM Companies)
- 3.6.8. Others
- 4. North America Natural Health Products Market Analysis, Opportunity and Forecast, 2016-2032
- 4.1. North America Natural Health Products Market Analysis, 2016-2021
- 4.2. North America Natural Health Products Market Opportunity and Forecast, 2023-2032
- 4.3. North America Natural Health Products Market Analysis, Opportunity and Forecast, By Product Type, 2016-2032
- 4.3.1. North America Natural Health Products Market Analysis by Product Type: Introduction
- 4.3.2. Market Size Absolute $ Opportunity Analysis and Forecast, By Product Type, 2016-2032
- 4.3.3. Herbal Supplements
- 4.3.4. Vitamins & Minerals
- 4.3.5. Probiotics & Prebiotics
- 4.3.6. Omega-3 Fatty Acids
- 4.3.7. Homeopathic Remedies
- 4.3.8. Traditional Chinese Medicine (TCM)
- 4.3.9. Ayurvedic Products
- 4.3.10. Other Natural Supplements
- 4.4. North America Natural Health Products Market Analysis, Opportunity and Forecast, By Formulation, 2016-2032
- 4.4.1. North America Natural Health Products Market Analysis by Formulation: Introduction
- 4.4.2. Market Size Absolute $ Opportunity Analysis and Forecast, By Formulation, 2016-2032
- 4.4.3. Capsules
- 4.4.4. Tablets
- 4.4.5. Softgels
- 4.4.6. Powders
- 4.4.7. Liquids
- 4.4.8. Teas
- 4.4.9. Topical Creams/Ointments
- 4.4.10. Others
- 4.5. North America Natural Health Products Market Analysis, Opportunity and Forecast, By Health Benefit, 2016-2032
- 4.5.1. North America Natural Health Products Market Analysis by Health Benefit: Introduction
- 4.5.2. Market Size Absolute $ Opportunity Analysis and Forecast, By Health Benefit, 2016-2032
- 4.5.3. Immune Support
- 4.5.4. Digestive Health
- 4.5.5. Bone & Joint Health
- 4.5.6. Heart Health
- 4.5.7. Weight Management
- 4.5.8. Skin & Hair Health
- 4.5.9. Mental Wellness
- 4.5.10. Energy & Vitality
- 4.5.11. Detoxification
- 4.5.12. Others
- 4.6. North America Natural Health Products Market Analysis, Opportunity and Forecast, By Distribution Channel, 2016-2032
- 4.6.1. North America Natural Health Products Market Analysis by Distribution Channel: Introduction
- 4.6.2. Market Size Absolute $ Opportunity Analysis and Forecast, By Distribution Channel, 2016-2032
- 4.6.3. Health & Wellness Stores
- 4.6.4. Pharmacies/Drugstores
- 4.6.5. Supermarkets/Hypermarkets
- 4.6.6. Online Retailers
- 4.6.7. Direct Sales (MLM Companies)
- 4.6.8. Others
- 4.7. North America Natural Health Products Market Analysis, Opportunity and Forecast, By Country , 2016-2032
- 4.7.1. North America Natural Health Products Market Analysis by Country : Introduction
- 4.7.2. Market Size Absolute $ Opportunity Analysis and Forecast, Country , 2016-2032
- 4.7.2.1. The US
- 4.7.2.2. Canada
- 4.7.2.3. Mexico
- 5. Western Europe Natural Health Products Market Analysis, Opportunity and Forecast, 2016-2032
- 5.1. Western Europe Natural Health Products Market Analysis, 2016-2021
- 5.2. Western Europe Natural Health Products Market Opportunity and Forecast, 2023-2032
- 5.3. Western Europe Natural Health Products Market Analysis, Opportunity and Forecast, By Product Type, 2016-2032
- 5.3.1. Western Europe Natural Health Products Market Analysis by Product Type: Introduction
- 5.3.2. Market Size Absolute $ Opportunity Analysis and Forecast, By Product Type, 2016-2032
- 5.3.3. Herbal Supplements
- 5.3.4. Vitamins & Minerals
- 5.3.5. Probiotics & Prebiotics
- 5.3.6. Omega-3 Fatty Acids
- 5.3.7. Homeopathic Remedies
- 5.3.8. Traditional Chinese Medicine (TCM)
- 5.3.9. Ayurvedic Products
- 5.3.10. Other Natural Supplements
- 5.4. Western Europe Natural Health Products Market Analysis, Opportunity and Forecast, By Formulation, 2016-2032
- 5.4.1. Western Europe Natural Health Products Market Analysis by Formulation: Introduction
- 5.4.2. Market Size Absolute $ Opportunity Analysis and Forecast, By Formulation, 2016-2032
- 5.4.3. Capsules
- 5.4.4. Tablets
- 5.4.5. Softgels
- 5.4.6. Powders
- 5.4.7. Liquids
- 5.4.8. Teas
- 5.4.9. Topical Creams/Ointments
- 5.4.10. Others
- 5.5. Western Europe Natural Health Products Market Analysis, Opportunity and Forecast, By Health Benefit, 2016-2032
- 5.5.1. Western Europe Natural Health Products Market Analysis by Health Benefit: Introduction
- 5.5.2. Market Size Absolute $ Opportunity Analysis and Forecast, By Health Benefit, 2016-2032
- 5.5.3. Immune Support
- 5.5.4. Digestive Health
- 5.5.5. Bone & Joint Health
- 5.5.6. Heart Health
- 5.5.7. Weight Management
- 5.5.8. Skin & Hair Health
- 5.5.9. Mental Wellness
- 5.5.10. Energy & Vitality
- 5.5.11. Detoxification
- 5.5.12. Others
- 5.6. Western Europe Natural Health Products Market Analysis, Opportunity and Forecast, By Distribution Channel, 2016-2032
- 5.6.1. Western Europe Natural Health Products Market Analysis by Distribution Channel: Introduction
- 5.6.2. Market Size Absolute $ Opportunity Analysis and Forecast, By Distribution Channel, 2016-2032
- 5.6.3. Health & Wellness Stores
- 5.6.4. Pharmacies/Drugstores
- 5.6.5. Supermarkets/Hypermarkets
- 5.6.6. Online Retailers
- 5.6.7. Direct Sales (MLM Companies)
- 5.6.8. Others
- 5.7. Western Europe Natural Health Products Market Analysis, Opportunity and Forecast, By Country , 2016-2032
- 5.7.1. Western Europe Natural Health Products Market Analysis by Country : Introduction
- 5.7.2. Market Size Absolute $ Opportunity Analysis and Forecast, Country , 2016-2032
- 5.7.2.1. Germany
- 5.7.2.2. France
- 5.7.2.3. The UK
- 5.7.2.4. Spain
- 5.7.2.5. Italy
- 5.7.2.6. Portugal
- 5.7.2.7. Ireland
- 5.7.2.8. Austria
- 5.7.2.9. Switzerland
- 5.7.2.10. Benelux
- 5.7.2.11. Nordic
- 5.7.2.12. Rest of Western Europe
- 6. Eastern Europe Natural Health Products Market Analysis, Opportunity and Forecast, 2016-2032
- 6.1. Eastern Europe Natural Health Products Market Analysis, 2016-2021
- 6.2. Eastern Europe Natural Health Products Market Opportunity and Forecast, 2023-2032
- 6.3. Eastern Europe Natural Health Products Market Analysis, Opportunity and Forecast, By Product Type, 2016-2032
- 6.3.1. Eastern Europe Natural Health Products Market Analysis by Product Type: Introduction
- 6.3.2. Market Size Absolute $ Opportunity Analysis and Forecast, By Product Type, 2016-2032
- 6.3.3. Herbal Supplements
- 6.3.4. Vitamins & Minerals
- 6.3.5. Probiotics & Prebiotics
- 6.3.6. Omega-3 Fatty Acids
- 6.3.7. Homeopathic Remedies
- 6.3.8. Traditional Chinese Medicine (TCM)
- 6.3.9. Ayurvedic Products
- 6.3.10. Other Natural Supplements
- 6.4. Eastern Europe Natural Health Products Market Analysis, Opportunity and Forecast, By Formulation, 2016-2032
- 6.4.1. Eastern Europe Natural Health Products Market Analysis by Formulation: Introduction
- 6.4.2. Market Size Absolute $ Opportunity Analysis and Forecast, By Formulation, 2016-2032
- 6.4.3. Capsules
- 6.4.4. Tablets
- 6.4.5. Softgels
- 6.4.6. Powders
- 6.4.7. Liquids
- 6.4.8. Teas
- 6.4.9. Topical Creams/Ointments
- 6.4.10. Others
- 6.5. Eastern Europe Natural Health Products Market Analysis, Opportunity and Forecast, By Health Benefit, 2016-2032
- 6.5.1. Eastern Europe Natural Health Products Market Analysis by Health Benefit: Introduction
- 6.5.2. Market Size Absolute $ Opportunity Analysis and Forecast, By Health Benefit, 2016-2032
- 6.5.3. Immune Support
- 6.5.4. Digestive Health
- 6.5.5. Bone & Joint Health
- 6.5.6. Heart Health
- 6.5.7. Weight Management
- 6.5.8. Skin & Hair Health
- 6.5.9. Mental Wellness
- 6.5.10. Energy & Vitality
- 6.5.11. Detoxification
- 6.5.12. Others
- 6.6. Eastern Europe Natural Health Products Market Analysis, Opportunity and Forecast, By Distribution Channel, 2016-2032
- 6.6.1. Eastern Europe Natural Health Products Market Analysis by Distribution Channel: Introduction
- 6.6.2. Market Size Absolute $ Opportunity Analysis and Forecast, By Distribution Channel, 2016-2032
- 6.6.3. Health & Wellness Stores
- 6.6.4. Pharmacies/Drugstores
- 6.6.5. Supermarkets/Hypermarkets
- 6.6.6. Online Retailers
- 6.6.7. Direct Sales (MLM Companies)
- 6.6.8. Others
- 6.7. Eastern Europe Natural Health Products Market Analysis, Opportunity and Forecast, By Country , 2016-2032
- 6.7.1. Eastern Europe Natural Health Products Market Analysis by Country : Introduction
- 6.7.2. Market Size Absolute $ Opportunity Analysis and Forecast, Country , 2016-2032
- 6.7.2.1. Russia
- 6.7.2.2. Poland
- 6.7.2.3. The Czech Republic
- 6.7.2.4. Greece
- 6.7.2.5. Rest of Eastern Europe
- 7. APAC Natural Health Products Market Analysis, Opportunity and Forecast, 2016-2032
- 7.1. APAC Natural Health Products Market Analysis, 2016-2021
- 7.2. APAC Natural Health Products Market Opportunity and Forecast, 2023-2032
- 7.3. APAC Natural Health Products Market Analysis, Opportunity and Forecast, By Product Type, 2016-2032
- 7.3.1. APAC Natural Health Products Market Analysis by Product Type: Introduction
- 7.3.2. Market Size Absolute $ Opportunity Analysis and Forecast, By Product Type, 2016-2032
- 7.3.3. Herbal Supplements
- 7.3.4. Vitamins & Minerals
- 7.3.5. Probiotics & Prebiotics
- 7.3.6. Omega-3 Fatty Acids
- 7.3.7. Homeopathic Remedies
- 7.3.8. Traditional Chinese Medicine (TCM)
- 7.3.9. Ayurvedic Products
- 7.3.10. Other Natural Supplements
- 7.4. APAC Natural Health Products Market Analysis, Opportunity and Forecast, By Formulation, 2016-2032
- 7.4.1. APAC Natural Health Products Market Analysis by Formulation: Introduction
- 7.4.2. Market Size Absolute $ Opportunity Analysis and Forecast, By Formulation, 2016-2032
- 7.4.3. Capsules
- 7.4.4. Tablets
- 7.4.5. Softgels
- 7.4.6. Powders
- 7.4.7. Liquids
- 7.4.8. Teas
- 7.4.9. Topical Creams/Ointments
- 7.4.10. Others
- 7.5. APAC Natural Health Products Market Analysis, Opportunity and Forecast, By Health Benefit, 2016-2032
- 7.5.1. APAC Natural Health Products Market Analysis by Health Benefit: Introduction
- 7.5.2. Market Size Absolute $ Opportunity Analysis and Forecast, By Health Benefit, 2016-2032
- 7.5.3. Immune Support
- 7.5.4. Digestive Health
- 7.5.5. Bone & Joint Health
- 7.5.6. Heart Health
- 7.5.7. Weight Management
- 7.5.8. Skin & Hair Health
- 7.5.9. Mental Wellness
- 7.5.10. Energy & Vitality
- 7.5.11. Detoxification
- 7.5.12. Others
- 7.6. APAC Natural Health Products Market Analysis, Opportunity and Forecast, By Distribution Channel, 2016-2032
- 7.6.1. APAC Natural Health Products Market Analysis by Distribution Channel: Introduction
- 7.6.2. Market Size Absolute $ Opportunity Analysis and Forecast, By Distribution Channel, 2016-2032
- 7.6.3. Health & Wellness Stores
- 7.6.4. Pharmacies/Drugstores
- 7.6.5. Supermarkets/Hypermarkets
- 7.6.6. Online Retailers
- 7.6.7. Direct Sales (MLM Companies)
- 7.6.8. Others
- 7.7. APAC Natural Health Products Market Analysis, Opportunity and Forecast, By Country , 2016-2032
- 7.7.1. APAC Natural Health Products Market Analysis by Country : Introduction
- 7.7.2. Market Size Absolute $ Opportunity Analysis and Forecast, Country , 2016-2032
- 7.7.2.1. China
- 7.7.2.2. Japan
- 7.7.2.3. South Korea
- 7.7.2.4. India
- 7.7.2.5. Australia & New Zeland
- 7.7.2.6. Indonesia
- 7.7.2.7. Malaysia
- 7.7.2.8. Philippines
- 7.7.2.9. Singapore
- 7.7.2.10. Thailand
- 7.7.2.11. Vietnam
- 7.7.2.12. Rest of APAC
- 8. Latin America Natural Health Products Market Analysis, Opportunity and Forecast, 2016-2032
- 8.1. Latin America Natural Health Products Market Analysis, 2016-2021
- 8.2. Latin America Natural Health Products Market Opportunity and Forecast, 2023-2032
- 8.3. Latin America Natural Health Products Market Analysis, Opportunity and Forecast, By Product Type, 2016-2032
- 8.3.1. Latin America Natural Health Products Market Analysis by Product Type: Introduction
- 8.3.2. Market Size Absolute $ Opportunity Analysis and Forecast, By Product Type, 2016-2032
- 8.3.3. Herbal Supplements
- 8.3.4. Vitamins & Minerals
- 8.3.5. Probiotics & Prebiotics
- 8.3.6. Omega-3 Fatty Acids
- 8.3.7. Homeopathic Remedies
- 8.3.8. Traditional Chinese Medicine (TCM)
- 8.3.9. Ayurvedic Products
- 8.3.10. Other Natural Supplements
- 8.4. Latin America Natural Health Products Market Analysis, Opportunity and Forecast, By Formulation, 2016-2032
- 8.4.1. Latin America Natural Health Products Market Analysis by Formulation: Introduction
- 8.4.2. Market Size Absolute $ Opportunity Analysis and Forecast, By Formulation, 2016-2032
- 8.4.3. Capsules
- 8.4.4. Tablets
- 8.4.5. Softgels
- 8.4.6. Powders
- 8.4.7. Liquids
- 8.4.8. Teas
- 8.4.9. Topical Creams/Ointments
- 8.4.10. Others
- 8.5. Latin America Natural Health Products Market Analysis, Opportunity and Forecast, By Health Benefit, 2016-2032
- 8.5.1. Latin America Natural Health Products Market Analysis by Health Benefit: Introduction
- 8.5.2. Market Size Absolute $ Opportunity Analysis and Forecast, By Health Benefit, 2016-2032
- 8.5.3. Immune Support
- 8.5.4. Digestive Health
- 8.5.5. Bone & Joint Health
- 8.5.6. Heart Health
- 8.5.7. Weight Management
- 8.5.8. Skin & Hair Health
- 8.5.9. Mental Wellness
- 8.5.10. Energy & Vitality
- 8.5.11. Detoxification
- 8.5.12. Others
- 8.6. Latin America Natural Health Products Market Analysis, Opportunity and Forecast, By Distribution Channel, 2016-2032
- 8.6.1. Latin America Natural Health Products Market Analysis by Distribution Channel: Introduction
- 8.6.2. Market Size Absolute $ Opportunity Analysis and Forecast, By Distribution Channel, 2016-2032
- 8.6.3. Health & Wellness Stores
- 8.6.4. Pharmacies/Drugstores
- 8.6.5. Supermarkets/Hypermarkets
- 8.6.6. Online Retailers
- 8.6.7. Direct Sales (MLM Companies)
- 8.6.8. Others
- 8.7. Latin America Natural Health Products Market Analysis, Opportunity and Forecast, By Country , 2016-2032
- 8.7.1. Latin America Natural Health Products Market Analysis by Country : Introduction
- 8.7.2. Market Size Absolute $ Opportunity Analysis and Forecast, Country , 2016-2032
- 8.7.2.1. Brazil
- 8.7.2.2. Colombia
- 8.7.2.3. Chile
- 8.7.2.4. Argentina
- 8.7.2.5. Costa Rica
- 8.7.2.6. Rest of Latin America
- 9. Middle East & Africa Natural Health Products Market Analysis, Opportunity and Forecast, 2016-2032
- 9.1. Middle East & Africa Natural Health Products Market Analysis, 2016-2021
- 9.2. Middle East & Africa Natural Health Products Market Opportunity and Forecast, 2023-2032
- 9.3. Middle East & Africa Natural Health Products Market Analysis, Opportunity and Forecast, By Product Type, 2016-2032
- 9.3.1. Middle East & Africa Natural Health Products Market Analysis by Product Type: Introduction
- 9.3.2. Market Size Absolute $ Opportunity Analysis and Forecast, By Product Type, 2016-2032
- 9.3.3. Herbal Supplements
- 9.3.4. Vitamins & Minerals
- 9.3.5. Probiotics & Prebiotics
- 9.3.6. Omega-3 Fatty Acids
- 9.3.7. Homeopathic Remedies
- 9.3.8. Traditional Chinese Medicine (TCM)
- 9.3.9. Ayurvedic Products
- 9.3.10. Other Natural Supplements
- 9.4. Middle East & Africa Natural Health Products Market Analysis, Opportunity and Forecast, By Formulation, 2016-2032
- 9.4.1. Middle East & Africa Natural Health Products Market Analysis by Formulation: Introduction
- 9.4.2. Market Size Absolute $ Opportunity Analysis and Forecast, By Formulation, 2016-2032
- 9.4.3. Capsules
- 9.4.4. Tablets
- 9.4.5. Softgels
- 9.4.6. Powders
- 9.4.7. Liquids
- 9.4.8. Teas
- 9.4.9. Topical Creams/Ointments
- 9.4.10. Others
- 9.5. Middle East & Africa Natural Health Products Market Analysis, Opportunity and Forecast, By Health Benefit, 2016-2032
- 9.5.1. Middle East & Africa Natural Health Products Market Analysis by Health Benefit: Introduction
- 9.5.2. Market Size Absolute $ Opportunity Analysis and Forecast, By Health Benefit, 2016-2032
- 9.5.3. Immune Support
- 9.5.4. Digestive Health
- 9.5.5. Bone & Joint Health
- 9.5.6. Heart Health
- 9.5.7. Weight Management
- 9.5.8. Skin & Hair Health
- 9.5.9. Mental Wellness
- 9.5.10. Energy & Vitality
- 9.5.11. Detoxification
- 9.5.12. Others
- 9.6. Middle East & Africa Natural Health Products Market Analysis, Opportunity and Forecast, By Distribution Channel, 2016-2032
- 9.6.1. Middle East & Africa Natural Health Products Market Analysis by Distribution Channel: Introduction
- 9.6.2. Market Size Absolute $ Opportunity Analysis and Forecast, By Distribution Channel, 2016-2032
- 9.6.3. Health & Wellness Stores
- 9.6.4. Pharmacies/Drugstores
- 9.6.5. Supermarkets/Hypermarkets
- 9.6.6. Online Retailers
- 9.6.7. Direct Sales (MLM Companies)
- 9.6.8. Others
- 9.7. Middle East & Africa Natural Health Products Market Analysis, Opportunity and Forecast, By Country , 2016-2032
- 9.7.1. Middle East & Africa Natural Health Products Market Analysis by Country : Introduction
- 9.7.2. Market Size Absolute $ Opportunity Analysis and Forecast, Country , 2016-2032
- 9.7.2.1. Algeria
- 9.7.2.2. Egypt
- 9.7.2.3. Israel
- 9.7.2.4. Kuwait
- 9.7.2.5. Nigeria
- 9.7.2.6. Saudi Arabia
- 9.7.2.7. South Africa
- 9.7.2.8. Turkey
- 9.7.2.9. The UAE
- 9.7.2.10. Rest of MEA
- 10. Global Natural Health Products Market Analysis, Opportunity and Forecast, By Region , 2016-2032
- 10.1. Global Natural Health Products Market Analysis by Region : Introduction
- 10.2. Market Size Absolute $ Opportunity Analysis and Forecast, By Region , 2016-2032
- 10.2.1. North America
- 10.2.2. Western Europe
- 10.2.3. Eastern Europe
- 10.2.4. APAC
- 10.2.5. Latin America
- 10.2.6. Middle East & Africa
- 11. Global Natural Health Products Market Competitive Landscape, Market Share Analysis, and Company Profiles
- 11.1. Market Share Analysis
- 11.2. Company Profiles
- 11.3. GFR Pharma
- 11.3.1. Company Overview
- 11.3.2. Financial Highlights
- 11.3.3. Product Portfolio
- 11.3.4. SWOT Analysis
- 11.3.5. Key Strategies and Developments
- 11.4. USANA Health Sciences, Inc.
- 11.4.1. Company Overview
- 11.4.2. Financial Highlights
- 11.4.3. Product Portfolio
- 11.4.4. SWOT Analysis
- 11.4.5. Key Strategies and Developments
- 11.5. Herbalife Nutrition
- 11.5.1. Company Overview
- 11.5.2. Financial Highlights
- 11.5.3. Product Portfolio
- 11.5.4. SWOT Analysis
- 11.5.5. Key Strategies and Developments
- 11.6. Nestlé Health Science
- 11.6.1. Company Overview
- 11.6.2. Financial Highlights
- 11.6.3. Product Portfolio
- 11.6.4. SWOT Analysis
- 11.6.5. Key Strategies and Developments
- 11.7. Blackmores
- 11.7.1. Company Overview
- 11.7.2. Financial Highlights
- 11.7.3. Product Portfolio
- 11.7.4. SWOT Analysis
- 11.7.5. Key Strategies and Developments
- 11.8. Nature's Bounty
- 11.8.1. Company Overview
- 11.8.2. Financial Highlights
- 11.8.3. Product Portfolio
- 11.8.4. SWOT Analysis
- 11.8.5. Key Strategies and Developments
- 11.9. NOW Foods
- 11.9.1. Company Overview
- 11.9.2. Financial Highlights
- 11.9.3. Product Portfolio
- 11.9.4. SWOT Analysis
- 11.9.5. Key Strategies and Developments
- 11.10. GNC (General Nutrition Centers)
- 11.10.1. Company Overview
- 11.10.2. Financial Highlights
- 11.10.3. Product Portfolio
- 11.10.4. SWOT Analysis
- 11.10.5. Key Strategies and Developments
- 11.11. Gaia Herbs
- 11.11.1. Company Overview
- 11.11.2. Financial Highlights
- 11.11.3. Product Portfolio
- 11.11.4. SWOT Analysis
- 11.11.5. Key Strategies and Developments
- 11.12. Swisse Wellness
- 11.12.1. Company Overview
- 11.12.2. Financial Highlights
- 11.12.3. Product Portfolio
- 11.12.4. SWOT Analysis
- 11.12.5. Key Strategies and Developments
- 11.13.1. Company Overview
- 11.13.2. Financial Highlights
- 11.13.3. Product Portfolio
- 11.13.4. SWOT Analysis
- 11.13.5. Key Strategies and Developments
- 11.14. The Himalaya Drug Company
- 11.14.1. Company Overview
- 11.14.2. Financial Highlights
- 11.14.3. Product Portfolio
- 11.14.4. SWOT Analysis
- 11.14.5. Key Strategies and Developments
- 12. Assumptions and Acronyms
- 13. Research Methodology
- 14. Contact
- List of Figures
- Figure 1: Global Natural Health Products Market Revenue (US$ Mn) Market Share by Product Type in 2022
- Figure 2: Global Natural Health Products Market Attractiveness Analysis by Product Type, 2016-2032
- Figure 3: Global Natural Health Products Market Revenue (US$ Mn) Market Share by Formulationin 2022
- Figure 4: Global Natural Health Products Market Attractiveness Analysis by Formulation, 2016-2032
- Figure 5: Global Natural Health Products Market Revenue (US$ Mn) Market Share by Health Benefitin 2022
- Figure 6: Global Natural Health Products Market Attractiveness Analysis by Health Benefit, 2016-2032
- Figure 7: Global Natural Health Products Market Revenue (US$ Mn) Market Share by Distribution Channelin 2022
- Figure 8: Global Natural Health Products Market Attractiveness Analysis by Distribution Channel, 2016-2032
- Figure 9: Global Natural Health Products Market Revenue (US$ Mn) Market Share by Region in 2022
- Figure 10: Global Natural Health Products Market Attractiveness Analysis by Region, 2016-2032
- Figure 11: Global Natural Health Products Market Revenue (US$ Mn) (2016-2032)
- Figure 12: Global Natural Health Products Market Revenue (US$ Mn) Comparison by Region (2016-2032)
- Figure 13: Global Natural Health Products Market Revenue (US$ Mn) Comparison by Product Type (2016-2032)
- Figure 14: Global Natural Health Products Market Revenue (US$ Mn) Comparison by Formulation (2016-2032)
- Figure 15: Global Natural Health Products Market Revenue (US$ Mn) Comparison by Health Benefit (2016-2032)
- Figure 16: Global Natural Health Products Market Revenue (US$ Mn) Comparison by Distribution Channel (2016-2032)
- Figure 17: Global Natural Health Products Market Y-o-Y Growth Rate Comparison by Region (2016-2032)
- Figure 18: Global Natural Health Products Market Y-o-Y Growth Rate Comparison by Product Type (2016-2032)
- Figure 19: Global Natural Health Products Market Y-o-Y Growth Rate Comparison by Formulation (2016-2032)
- Figure 20: Global Natural Health Products Market Y-o-Y Growth Rate Comparison by Health Benefit (2016-2032)
- Figure 21: Global Natural Health Products Market Y-o-Y Growth Rate Comparison by Distribution Channel (2016-2032)
- Figure 22: Global Natural Health Products Market Share Comparison by Region (2016-2032)
- Figure 23: Global Natural Health Products Market Share Comparison by Product Type (2016-2032)
- Figure 24: Global Natural Health Products Market Share Comparison by Formulation (2016-2032)
- Figure 25: Global Natural Health Products Market Share Comparison by Health Benefit (2016-2032)
- Figure 26: Global Natural Health Products Market Share Comparison by Distribution Channel (2016-2032)
- Figure 27: North America Natural Health Products Market Revenue (US$ Mn) Market Share by Product Typein 2022
- Figure 28: North America Natural Health Products Market Attractiveness Analysis by Product Type, 2016-2032
- Figure 29: North America Natural Health Products Market Revenue (US$ Mn) Market Share by Formulationin 2022
- Figure 30: North America Natural Health Products Market Attractiveness Analysis by Formulation, 2016-2032
- Figure 31: North America Natural Health Products Market Revenue (US$ Mn) Market Share by Health Benefitin 2022
- Figure 32: North America Natural Health Products Market Attractiveness Analysis by Health Benefit, 2016-2032
- Figure 33: North America Natural Health Products Market Revenue (US$ Mn) Market Share by Distribution Channelin 2022
- Figure 34: North America Natural Health Products Market Attractiveness Analysis by Distribution Channel, 2016-2032
- Figure 35: North America Natural Health Products Market Revenue (US$ Mn) Market Share by Country in 2022
- Figure 36: North America Natural Health Products Market Attractiveness Analysis by Country, 2016-2032
- Figure 37: North America Natural Health Products Market Revenue (US$ Mn) (2016-2032)
- Figure 38: North America Natural Health Products Market Revenue (US$ Mn) Comparison by Country (2016-2032)
- Figure 39: North America Natural Health Products Market Revenue (US$ Mn) Comparison by Product Type (2016-2032)
- Figure 40: North America Natural Health Products Market Revenue (US$ Mn) Comparison by Formulation (2016-2032)
- Figure 41: North America Natural Health Products Market Revenue (US$ Mn) Comparison by Health Benefit (2016-2032)
- Figure 42: North America Natural Health Products Market Revenue (US$ Mn) Comparison by Distribution Channel (2016-2032)
- Figure 43: North America Natural Health Products Market Y-o-Y Growth Rate Comparison by Country (2016-2032)
- Figure 44: North America Natural Health Products Market Y-o-Y Growth Rate Comparison by Product Type (2016-2032)
- Figure 45: North America Natural Health Products Market Y-o-Y Growth Rate Comparison by Formulation (2016-2032)
- Figure 46: North America Natural Health Products Market Y-o-Y Growth Rate Comparison by Health Benefit (2016-2032)
- Figure 47: North America Natural Health Products Market Y-o-Y Growth Rate Comparison by Distribution Channel (2016-2032)
- Figure 48: North America Natural Health Products Market Share Comparison by Country (2016-2032)
- Figure 49: North America Natural Health Products Market Share Comparison by Product Type (2016-2032)
- Figure 50: North America Natural Health Products Market Share Comparison by Formulation (2016-2032)
- Figure 51: North America Natural Health Products Market Share Comparison by Health Benefit (2016-2032)
- Figure 52: North America Natural Health Products Market Share Comparison by Distribution Channel (2016-2032)
- Figure 53: Western Europe Natural Health Products Market Revenue (US$ Mn) Market Share by Product Typein 2022
- Figure 54: Western Europe Natural Health Products Market Attractiveness Analysis by Product Type, 2016-2032
- Figure 55: Western Europe Natural Health Products Market Revenue (US$ Mn) Market Share by Formulationin 2022
- Figure 56: Western Europe Natural Health Products Market Attractiveness Analysis by Formulation, 2016-2032
- Figure 57: Western Europe Natural Health Products Market Revenue (US$ Mn) Market Share by Health Benefitin 2022
- Figure 58: Western Europe Natural Health Products Market Attractiveness Analysis by Health Benefit, 2016-2032
- Figure 59: Western Europe Natural Health Products Market Revenue (US$ Mn) Market Share by Distribution Channelin 2022
- Figure 60: Western Europe Natural Health Products Market Attractiveness Analysis by Distribution Channel, 2016-2032
- Figure 61: Western Europe Natural Health Products Market Revenue (US$ Mn) Market Share by Country in 2022
- Figure 62: Western Europe Natural Health Products Market Attractiveness Analysis by Country, 2016-2032
- Figure 63: Western Europe Natural Health Products Market Revenue (US$ Mn) (2016-2032)
- Figure 64: Western Europe Natural Health Products Market Revenue (US$ Mn) Comparison by Country (2016-2032)
- Figure 65: Western Europe Natural Health Products Market Revenue (US$ Mn) Comparison by Product Type (2016-2032)
- Figure 66: Western Europe Natural Health Products Market Revenue (US$ Mn) Comparison by Formulation (2016-2032)
- Figure 67: Western Europe Natural Health Products Market Revenue (US$ Mn) Comparison by Health Benefit (2016-2032)
- Figure 68: Western Europe Natural Health Products Market Revenue (US$ Mn) Comparison by Distribution Channel (2016-2032)
- Figure 69: Western Europe Natural Health Products Market Y-o-Y Growth Rate Comparison by Country (2016-2032)
- Figure 70: Western Europe Natural Health Products Market Y-o-Y Growth Rate Comparison by Product Type (2016-2032)
- Figure 71: Western Europe Natural Health Products Market Y-o-Y Growth Rate Comparison by Formulation (2016-2032)
- Figure 72: Western Europe Natural Health Products Market Y-o-Y Growth Rate Comparison by Health Benefit (2016-2032)
- Figure 73: Western Europe Natural Health Products Market Y-o-Y Growth Rate Comparison by Distribution Channel (2016-2032)
- Figure 74: Western Europe Natural Health Products Market Share Comparison by Country (2016-2032)
- Figure 75: Western Europe Natural Health Products Market Share Comparison by Product Type (2016-2032)
- Figure 76: Western Europe Natural Health Products Market Share Comparison by Formulation (2016-2032)
- Figure 77: Western Europe Natural Health Products Market Share Comparison by Health Benefit (2016-2032)
- Figure 78: Western Europe Natural Health Products Market Share Comparison by Distribution Channel (2016-2032)
- Figure 79: Eastern Europe Natural Health Products Market Revenue (US$ Mn) Market Share by Product Typein 2022
- Figure 80: Eastern Europe Natural Health Products Market Attractiveness Analysis by Product Type, 2016-2032
- Figure 81: Eastern Europe Natural Health Products Market Revenue (US$ Mn) Market Share by Formulationin 2022
- Figure 82: Eastern Europe Natural Health Products Market Attractiveness Analysis by Formulation, 2016-2032
- Figure 83: Eastern Europe Natural Health Products Market Revenue (US$ Mn) Market Share by Health Benefitin 2022
- Figure 84: Eastern Europe Natural Health Products Market Attractiveness Analysis by Health Benefit, 2016-2032
- Figure 85: Eastern Europe Natural Health Products Market Revenue (US$ Mn) Market Share by Distribution Channelin 2022
- Figure 86: Eastern Europe Natural Health Products Market Attractiveness Analysis by Distribution Channel, 2016-2032
- Figure 87: Eastern Europe Natural Health Products Market Revenue (US$ Mn) Market Share by Country in 2022
- Figure 88: Eastern Europe Natural Health Products Market Attractiveness Analysis by Country, 2016-2032
- Figure 89: Eastern Europe Natural Health Products Market Revenue (US$ Mn) (2016-2032)
- Figure 90: Eastern Europe Natural Health Products Market Revenue (US$ Mn) Comparison by Country (2016-2032)
- Figure 91: Eastern Europe Natural Health Products Market Revenue (US$ Mn) Comparison by Product Type (2016-2032)
- Figure 92: Eastern Europe Natural Health Products Market Revenue (US$ Mn) Comparison by Formulation (2016-2032)
- Figure 93: Eastern Europe Natural Health Products Market Revenue (US$ Mn) Comparison by Health Benefit (2016-2032)
- Figure 94: Eastern Europe Natural Health Products Market Revenue (US$ Mn) Comparison by Distribution Channel (2016-2032)
- Figure 95: Eastern Europe Natural Health Products Market Y-o-Y Growth Rate Comparison by Country (2016-2032)
- Figure 96: Eastern Europe Natural Health Products Market Y-o-Y Growth Rate Comparison by Product Type (2016-2032)
- Figure 97: Eastern Europe Natural Health Products Market Y-o-Y Growth Rate Comparison by Formulation (2016-2032)
- Figure 98: Eastern Europe Natural Health Products Market Y-o-Y Growth Rate Comparison by Health Benefit (2016-2032)
- Figure 99: Eastern Europe Natural Health Products Market Y-o-Y Growth Rate Comparison by Distribution Channel (2016-2032)
- Figure 100: Eastern Europe Natural Health Products Market Share Comparison by Country (2016-2032)
- Figure 101: Eastern Europe Natural Health Products Market Share Comparison by Product Type (2016-2032)
- Figure 102: Eastern Europe Natural Health Products Market Share Comparison by Formulation (2016-2032)
- Figure 103: Eastern Europe Natural Health Products Market Share Comparison by Health Benefit (2016-2032)
- Figure 104: Eastern Europe Natural Health Products Market Share Comparison by Distribution Channel (2016-2032)
- Figure 105: APAC Natural Health Products Market Revenue (US$ Mn) Market Share by Product Typein 2022
- Figure 106: APAC Natural Health Products Market Attractiveness Analysis by Product Type, 2016-2032
- Figure 107: APAC Natural Health Products Market Revenue (US$ Mn) Market Share by Formulationin 2022
- Figure 108: APAC Natural Health Products Market Attractiveness Analysis by Formulation, 2016-2032
- Figure 109: APAC Natural Health Products Market Revenue (US$ Mn) Market Share by Health Benefitin 2022
- Figure 110: APAC Natural Health Products Market Attractiveness Analysis by Health Benefit, 2016-2032
- Figure 111: APAC Natural Health Products Market Revenue (US$ Mn) Market Share by Distribution Channelin 2022
- Figure 112: APAC Natural Health Products Market Attractiveness Analysis by Distribution Channel, 2016-2032
- Figure 113: APAC Natural Health Products Market Revenue (US$ Mn) Market Share by Country in 2022
- Figure 114: APAC Natural Health Products Market Attractiveness Analysis by Country, 2016-2032
- Figure 115: APAC Natural Health Products Market Revenue (US$ Mn) (2016-2032)
- Figure 116: APAC Natural Health Products Market Revenue (US$ Mn) Comparison by Country (2016-2032)
- Figure 117: APAC Natural Health Products Market Revenue (US$ Mn) Comparison by Product Type (2016-2032)
- Figure 118: APAC Natural Health Products Market Revenue (US$ Mn) Comparison by Formulation (2016-2032)
- Figure 119: APAC Natural Health Products Market Revenue (US$ Mn) Comparison by Health Benefit (2016-2032)
- Figure 120: APAC Natural Health Products Market Revenue (US$ Mn) Comparison by Distribution Channel (2016-2032)
- Figure 121: APAC Natural Health Products Market Y-o-Y Growth Rate Comparison by Country (2016-2032)
- Figure 122: APAC Natural Health Products Market Y-o-Y Growth Rate Comparison by Product Type (2016-2032)
- Figure 123: APAC Natural Health Products Market Y-o-Y Growth Rate Comparison by Formulation (2016-2032)
- Figure 124: APAC Natural Health Products Market Y-o-Y Growth Rate Comparison by Health Benefit (2016-2032)
- Figure 125: APAC Natural Health Products Market Y-o-Y Growth Rate Comparison by Distribution Channel (2016-2032)
- Figure 126: APAC Natural Health Products Market Share Comparison by Country (2016-2032)
- Figure 127: APAC Natural Health Products Market Share Comparison by Product Type (2016-2032)
- Figure 128: APAC Natural Health Products Market Share Comparison by Formulation (2016-2032)
- Figure 129: APAC Natural Health Products Market Share Comparison by Health Benefit (2016-2032)
- Figure 130: APAC Natural Health Products Market Share Comparison by Distribution Channel (2016-2032)
- Figure 131: Latin America Natural Health Products Market Revenue (US$ Mn) Market Share by Product Typein 2022
- Figure 132: Latin America Natural Health Products Market Attractiveness Analysis by Product Type, 2016-2032
- Figure 133: Latin America Natural Health Products Market Revenue (US$ Mn) Market Share by Formulationin 2022
- Figure 134: Latin America Natural Health Products Market Attractiveness Analysis by Formulation, 2016-2032
- Figure 135: Latin America Natural Health Products Market Revenue (US$ Mn) Market Share by Health Benefitin 2022
- Figure 136: Latin America Natural Health Products Market Attractiveness Analysis by Health Benefit, 2016-2032
- Figure 137: Latin America Natural Health Products Market Revenue (US$ Mn) Market Share by Distribution Channelin 2022
- Figure 138: Latin America Natural Health Products Market Attractiveness Analysis by Distribution Channel, 2016-2032
- Figure 139: Latin America Natural Health Products Market Revenue (US$ Mn) Market Share by Country in 2022
- Figure 140: Latin America Natural Health Products Market Attractiveness Analysis by Country, 2016-2032
- Figure 141: Latin America Natural Health Products Market Revenue (US$ Mn) (2016-2032)
- Figure 142: Latin America Natural Health Products Market Revenue (US$ Mn) Comparison by Country (2016-2032)
- Figure 143: Latin America Natural Health Products Market Revenue (US$ Mn) Comparison by Product Type (2016-2032)
- Figure 144: Latin America Natural Health Products Market Revenue (US$ Mn) Comparison by Formulation (2016-2032)
- Figure 145: Latin America Natural Health Products Market Revenue (US$ Mn) Comparison by Health Benefit (2016-2032)
- Figure 146: Latin America Natural Health Products Market Revenue (US$ Mn) Comparison by Distribution Channel (2016-2032)
- Figure 147: Latin America Natural Health Products Market Y-o-Y Growth Rate Comparison by Country (2016-2032)
- Figure 148: Latin America Natural Health Products Market Y-o-Y Growth Rate Comparison by Product Type (2016-2032)
- Figure 149: Latin America Natural Health Products Market Y-o-Y Growth Rate Comparison by Formulation (2016-2032)
- Figure 150: Latin America Natural Health Products Market Y-o-Y Growth Rate Comparison by Health Benefit (2016-2032)
- Figure 151: Latin America Natural Health Products Market Y-o-Y Growth Rate Comparison by Distribution Channel (2016-2032)
- Figure 152: Latin America Natural Health Products Market Share Comparison by Country (2016-2032)
- Figure 153: Latin America Natural Health Products Market Share Comparison by Product Type (2016-2032)
- Figure 154: Latin America Natural Health Products Market Share Comparison by Formulation (2016-2032)
- Figure 155: Latin America Natural Health Products Market Share Comparison by Health Benefit (2016-2032)
- Figure 156: Latin America Natural Health Products Market Share Comparison by Distribution Channel (2016-2032)
- Figure 157: Middle East & Africa Natural Health Products Market Revenue (US$ Mn) Market Share by Product Typein 2022
- Figure 158: Middle East & Africa Natural Health Products Market Attractiveness Analysis by Product Type, 2016-2032
- Figure 159: Middle East & Africa Natural Health Products Market Revenue (US$ Mn) Market Share by Formulationin 2022
- Figure 160: Middle East & Africa Natural Health Products Market Attractiveness Analysis by Formulation, 2016-2032
- Figure 161: Middle East & Africa Natural Health Products Market Revenue (US$ Mn) Market Share by Health Benefitin 2022
- Figure 162: Middle East & Africa Natural Health Products Market Attractiveness Analysis by Health Benefit, 2016-2032
- Figure 163: Middle East & Africa Natural Health Products Market Revenue (US$ Mn) Market Share by Distribution Channelin 2022
- Figure 164: Middle East & Africa Natural Health Products Market Attractiveness Analysis by Distribution Channel, 2016-2032
- Figure 165: Middle East & Africa Natural Health Products Market Revenue (US$ Mn) Market Share by Country in 2022
- Figure 166: Middle East & Africa Natural Health Products Market Attractiveness Analysis by Country, 2016-2032
- Figure 167: Middle East & Africa Natural Health Products Market Revenue (US$ Mn) (2016-2032)
- Figure 168: Middle East & Africa Natural Health Products Market Revenue (US$ Mn) Comparison by Country (2016-2032)
- Figure 169: Middle East & Africa Natural Health Products Market Revenue (US$ Mn) Comparison by Product Type (2016-2032)
- Figure 170: Middle East & Africa Natural Health Products Market Revenue (US$ Mn) Comparison by Formulation (2016-2032)
- Figure 171: Middle East & Africa Natural Health Products Market Revenue (US$ Mn) Comparison by Health Benefit (2016-2032)
- Figure 172: Middle East & Africa Natural Health Products Market Revenue (US$ Mn) Comparison by Distribution Channel (2016-2032)
- Figure 173: Middle East & Africa Natural Health Products Market Y-o-Y Growth Rate Comparison by Country (2016-2032)
- Figure 174: Middle East & Africa Natural Health Products Market Y-o-Y Growth Rate Comparison by Product Type (2016-2032)
- Figure 175: Middle East & Africa Natural Health Products Market Y-o-Y Growth Rate Comparison by Formulation (2016-2032)
- Figure 176: Middle East & Africa Natural Health Products Market Y-o-Y Growth Rate Comparison by Health Benefit (2016-2032)
- Figure 177: Middle East & Africa Natural Health Products Market Y-o-Y Growth Rate Comparison by Distribution Channel (2016-2032)
- Figure 178: Middle East & Africa Natural Health Products Market Share Comparison by Country (2016-2032)
- Figure 179: Middle East & Africa Natural Health Products Market Share Comparison by Product Type (2016-2032)
- Figure 180: Middle East & Africa Natural Health Products Market Share Comparison by Formulation (2016-2032)
- Figure 181: Middle East & Africa Natural Health Products Market Share Comparison by Health Benefit (2016-2032)
- Figure 182: Middle East & Africa Natural Health Products Market Share Comparison by Distribution Channel (2016-2032)
- List of Tables
- Table 1: Global Natural Health Products Market Comparison by Product Type (2016-2032)
- Table 2: Global Natural Health Products Market Comparison by Formulation (2016-2032)
- Table 3: Global Natural Health Products Market Comparison by Health Benefit (2016-2032)
- Table 4: Global Natural Health Products Market Comparison by Distribution Channel (2016-2032)
- Table 5: Global Natural Health Products Market Revenue (US$ Mn) Comparison by Region (2016-2032)
- Table 6: Global Natural Health Products Market Revenue (US$ Mn) (2016-2032)
- Table 7: Global Natural Health Products Market Revenue (US$ Mn) Comparison by Region (2016-2032)
- Table 8: Global Natural Health Products Market Revenue (US$ Mn) Comparison by Product Type (2016-2032)
- Table 9: Global Natural Health Products Market Revenue (US$ Mn) Comparison by Formulation (2016-2032)
- Table 10: Global Natural Health Products Market Revenue (US$ Mn) Comparison by Health Benefit (2016-2032)
- Table 11: Global Natural Health Products Market Revenue (US$ Mn) Comparison by Distribution Channel (2016-2032)
- Table 12: Global Natural Health Products Market Y-o-Y Growth Rate Comparison by Region (2016-2032)
- Table 13: Global Natural Health Products Market Y-o-Y Growth Rate Comparison by Product Type (2016-2032)
- Table 14: Global Natural Health Products Market Y-o-Y Growth Rate Comparison by Formulation (2016-2032)
- Table 15: Global Natural Health Products Market Y-o-Y Growth Rate Comparison by Health Benefit (2016-2032)
- Table 16: Global Natural Health Products Market Y-o-Y Growth Rate Comparison by Distribution Channel (2016-2032)
- Table 17: Global Natural Health Products Market Share Comparison by Region (2016-2032)
- Table 18: Global Natural Health Products Market Share Comparison by Product Type (2016-2032)
- Table 19: Global Natural Health Products Market Share Comparison by Formulation (2016-2032)
- Table 20: Global Natural Health Products Market Share Comparison by Health Benefit (2016-2032)
- Table 21: Global Natural Health Products Market Share Comparison by Distribution Channel (2016-2032)
- Table 22: North America Natural Health Products Market Comparison by Formulation (2016-2032)
- Table 23: North America Natural Health Products Market Comparison by Health Benefit (2016-2032)
- Table 24: North America Natural Health Products Market Comparison by Distribution Channel (2016-2032)
- Table 25: North America Natural Health Products Market Revenue (US$ Mn) Comparison by Country (2016-2032)
- Table 26: North America Natural Health Products Market Revenue (US$ Mn) (2016-2032)
- Table 27: North America Natural Health Products Market Revenue (US$ Mn) Comparison by Country (2016-2032)
- Table 28: North America Natural Health Products Market Revenue (US$ Mn) Comparison by Product Type (2016-2032)
- Table 29: North America Natural Health Products Market Revenue (US$ Mn) Comparison by Formulation (2016-2032)
- Table 30: North America Natural Health Products Market Revenue (US$ Mn) Comparison by Health Benefit (2016-2032)
- Table 31: North America Natural Health Products Market Revenue (US$ Mn) Comparison by Distribution Channel (2016-2032)
- Table 32: North America Natural Health Products Market Y-o-Y Growth Rate Comparison by Country (2016-2032)
- Table 33: North America Natural Health Products Market Y-o-Y Growth Rate Comparison by Product Type (2016-2032)
- Table 34: North America Natural Health Products Market Y-o-Y Growth Rate Comparison by Formulation (2016-2032)
- Table 35: North America Natural Health Products Market Y-o-Y Growth Rate Comparison by Health Benefit (2016-2032)
- Table 36: North America Natural Health Products Market Y-o-Y Growth Rate Comparison by Distribution Channel (2016-2032)
- Table 37: North America Natural Health Products Market Share Comparison by Country (2016-2032)
- Table 38: North America Natural Health Products Market Share Comparison by Product Type (2016-2032)
- Table 39: North America Natural Health Products Market Share Comparison by Formulation (2016-2032)
- Table 40: North America Natural Health Products Market Share Comparison by Health Benefit (2016-2032)
- Table 41: North America Natural Health Products Market Share Comparison by Distribution Channel (2016-2032)
- Table 42: Western Europe Natural Health Products Market Comparison by Product Type (2016-2032)
- Table 43: Western Europe Natural Health Products Market Comparison by Formulation (2016-2032)
- Table 44: Western Europe Natural Health Products Market Comparison by Health Benefit (2016-2032)
- Table 45: Western Europe Natural Health Products Market Comparison by Distribution Channel (2016-2032)
- Table 46: Western Europe Natural Health Products Market Revenue (US$ Mn) Comparison by Country (2016-2032)
- Table 47: Western Europe Natural Health Products Market Revenue (US$ Mn) (2016-2032)
- Table 48: Western Europe Natural Health Products Market Revenue (US$ Mn) Comparison by Country (2016-2032)
- Table 49: Western Europe Natural Health Products Market Revenue (US$ Mn) Comparison by Product Type (2016-2032)
- Table 50: Western Europe Natural Health Products Market Revenue (US$ Mn) Comparison by Formulation (2016-2032)
- Table 51: Western Europe Natural Health Products Market Revenue (US$ Mn) Comparison by Health Benefit (2016-2032)
- Table 52: Western Europe Natural Health Products Market Revenue (US$ Mn) Comparison by Distribution Channel (2016-2032)
- Table 53: Western Europe Natural Health Products Market Y-o-Y Growth Rate Comparison by Country (2016-2032)
- Table 54: Western Europe Natural Health Products Market Y-o-Y Growth Rate Comparison by Product Type (2016-2032)
- Table 55: Western Europe Natural Health Products Market Y-o-Y Growth Rate Comparison by Formulation (2016-2032)
- Table 56: Western Europe Natural Health Products Market Y-o-Y Growth Rate Comparison by Health Benefit (2016-2032)
- Table 57: Western Europe Natural Health Products Market Y-o-Y Growth Rate Comparison by Distribution Channel (2016-2032)
- Table 58: Western Europe Natural Health Products Market Share Comparison by Country (2016-2032)
- Table 59: Western Europe Natural Health Products Market Share Comparison by Product Type (2016-2032)
- Table 60: Western Europe Natural Health Products Market Share Comparison by Formulation (2016-2032)
- Table 61: Western Europe Natural Health Products Market Share Comparison by Health Benefit (2016-2032)
- Table 62: Western Europe Natural Health Products Market Share Comparison by Distribution Channel (2016-2032)
- Table 63: Eastern Europe Natural Health Products Market Comparison by Product Type (2016-2032)
- Table 64: Eastern Europe Natural Health Products Market Comparison by Formulation (2016-2032)
- Table 65: Eastern Europe Natural Health Products Market Comparison by Health Benefit (2016-2032)
- Table 66: Eastern Europe Natural Health Products Market Comparison by Distribution Channel (2016-2032)
- Table 67: Eastern Europe Natural Health Products Market Revenue (US$ Mn) Comparison by Country (2016-2032)
- Table 68: Eastern Europe Natural Health Products Market Revenue (US$ Mn) (2016-2032)
- Table 69: Eastern Europe Natural Health Products Market Revenue (US$ Mn) Comparison by Country (2016-2032)
- Table 70: Eastern Europe Natural Health Products Market Revenue (US$ Mn) Comparison by Product Type (2016-2032)
- Table 71: Eastern Europe Natural Health Products Market Revenue (US$ Mn) Comparison by Formulation (2016-2032)
- Table 72: Eastern Europe Natural Health Products Market Revenue (US$ Mn) Comparison by Health Benefit (2016-2032)
- Table 73: Eastern Europe Natural Health Products Market Revenue (US$ Mn) Comparison by Distribution Channel (2016-2032)
- Table 74: Eastern Europe Natural Health Products Market Y-o-Y Growth Rate Comparison by Country (2016-2032)
- Table 75: Eastern Europe Natural Health Products Market Y-o-Y Growth Rate Comparison by Product Type (2016-2032)
- Table 76: Eastern Europe Natural Health Products Market Y-o-Y Growth Rate Comparison by Formulation (2016-2032)
- Table 77: Eastern Europe Natural Health Products Market Y-o-Y Growth Rate Comparison by Health Benefit (2016-2032)
- Table 78: Eastern Europe Natural Health Products Market Y-o-Y Growth Rate Comparison by Distribution Channel (2016-2032)
- Table 79: Eastern Europe Natural Health Products Market Share Comparison by Country (2016-2032)
- Table 80: Eastern Europe Natural Health Products Market Share Comparison by Product Type (2016-2032)
- Table 81: Eastern Europe Natural Health Products Market Share Comparison by Formulation (2016-2032)
- Table 82: Eastern Europe Natural Health Products Market Share Comparison by Health Benefit (2016-2032)
- Table 83: Eastern Europe Natural Health Products Market Share Comparison by Distribution Channel (2016-2032)
- Table 84: APAC Natural Health Products Market Comparison by Product Type (2016-2032)
- Table 85: APAC Natural Health Products Market Comparison by Formulation (2016-2032)
- Table 86: APAC Natural Health Products Market Comparison by Health Benefit (2016-2032)
- Table 87: APAC Natural Health Products Market Comparison by Distribution Channel (2016-2032)
- Table 88: APAC Natural Health Products Market Revenue (US$ Mn) Comparison by Country (2016-2032)
- Table 89: APAC Natural Health Products Market Revenue (US$ Mn) (2016-2032)
- Table 90: APAC Natural Health Products Market Revenue (US$ Mn) Comparison by Country (2016-2032)
- Table 91: APAC Natural Health Products Market Revenue (US$ Mn) Comparison by Product Type (2016-2032)
- Table 92: APAC Natural Health Products Market Revenue (US$ Mn) Comparison by Formulation (2016-2032)
- Table 93: APAC Natural Health Products Market Revenue (US$ Mn) Comparison by Health Benefit (2016-2032)
- Table 94: APAC Natural Health Products Market Revenue (US$ Mn) Comparison by Distribution Channel (2016-2032)
- Table 95: APAC Natural Health Products Market Y-o-Y Growth Rate Comparison by Country (2016-2032)
- Table 96: APAC Natural Health Products Market Y-o-Y Growth Rate Comparison by Product Type (2016-2032)
- Table 97: APAC Natural Health Products Market Y-o-Y Growth Rate Comparison by Formulation (2016-2032)
- Table 98: APAC Natural Health Products Market Y-o-Y Growth Rate Comparison by Health Benefit (2016-2032)
- Table 99: APAC Natural Health Products Market Y-o-Y Growth Rate Comparison by Distribution Channel (2016-2032)
- Table 100: APAC Natural Health Products Market Share Comparison by Country (2016-2032)
- Table 101: APAC Natural Health Products Market Share Comparison by Product Type (2016-2032)
- Table 102: APAC Natural Health Products Market Share Comparison by Formulation (2016-2032)
- Table 103: APAC Natural Health Products Market Share Comparison by Health Benefit (2016-2032)
- Table 104: APAC Natural Health Products Market Share Comparison by Distribution Channel (2016-2032)
- Table 105: Latin America Natural Health Products Market Comparison by Product Type (2016-2032)
- Table 106: Latin America Natural Health Products Market Comparison by Formulation (2016-2032)
- Table 107: Latin America Natural Health Products Market Comparison by Health Benefit (2016-2032)
- Table 108: Latin America Natural Health Products Market Comparison by Distribution Channel (2016-2032)
- Table 109: Latin America Natural Health Products Market Revenue (US$ Mn) Comparison by Country (2016-2032)
- Table 110: Latin America Natural Health Products Market Revenue (US$ Mn) (2016-2032)
- Table 111: Latin America Natural Health Products Market Revenue (US$ Mn) Comparison by Country (2016-2032)
- Table 112: Latin America Natural Health Products Market Revenue (US$ Mn) Comparison by Product Type (2016-2032)
- Table 113: Latin America Natural Health Products Market Revenue (US$ Mn) Comparison by Formulation (2016-2032)
- Table 114: Latin America Natural Health Products Market Revenue (US$ Mn) Comparison by Health Benefit (2016-2032)
- Table 115: Latin America Natural Health Products Market Revenue (US$ Mn) Comparison by Distribution Channel (2016-2032)
- Table 116: Latin America Natural Health Products Market Y-o-Y Growth Rate Comparison by Country (2016-2032)
- Table 117: Latin America Natural Health Products Market Y-o-Y Growth Rate Comparison by Product Type (2016-2032)
- Table 118: Latin America Natural Health Products Market Y-o-Y Growth Rate Comparison by Formulation (2016-2032)
- Table 119: Latin America Natural Health Products Market Y-o-Y Growth Rate Comparison by Health Benefit (2016-2032)
- Table 120: Latin America Natural Health Products Market Y-o-Y Growth Rate Comparison by Distribution Channel (2016-2032)
- Table 121: Latin America Natural Health Products Market Share Comparison by Country (2016-2032)
- Table 122: Latin America Natural Health Products Market Share Comparison by Product Type (2016-2032)
- Table 123: Latin America Natural Health Products Market Share Comparison by Formulation (2016-2032)
- Table 124: Latin America Natural Health Products Market Share Comparison by Health Benefit (2016-2032)
- Table 125: Latin America Natural Health Products Market Share Comparison by Distribution Channel (2016-2032)
- Table 126: Middle East & Africa Natural Health Products Market Comparison by Product Type (2016-2032)
- Table 127: Middle East & Africa Natural Health Products Market Comparison by Formulation (2016-2032)
- Table 128: Middle East & Africa Natural Health Products Market Comparison by Health Benefit (2016-2032)
- Table 129: Middle East & Africa Natural Health Products Market Comparison by Distribution Channel (2016-2032)
- Table 130: Middle East & Africa Natural Health Products Market Revenue (US$ Mn) Comparison by Country (2016-2032)
- Table 131: Middle East & Africa Natural Health Products Market Revenue (US$ Mn) (2016-2032)
- Table 132: Middle East & Africa Natural Health Products Market Revenue (US$ Mn) Comparison by Country (2016-2032)
- Table 133: Middle East & Africa Natural Health Products Market Revenue (US$ Mn) Comparison by Product Type (2016-2032)
- Table 134: Middle East & Africa Natural Health Products Market Revenue (US$ Mn) Comparison by Formulation (2016-2032)
- Table 135: Middle East & Africa Natural Health Products Market Revenue (US$ Mn) Comparison by Health Benefit (2016-2032)
- Table 136: Middle East & Africa Natural Health Products Market Revenue (US$ Mn) Comparison by Distribution Channel (2016-2032)
- Table 137: Middle East & Africa Natural Health Products Market Y-o-Y Growth Rate Comparison by Country (2016-2032)
- Table 138: Middle East & Africa Natural Health Products Market Y-o-Y Growth Rate Comparison by Product Type (2016-2032)
- Table 139: Middle East & Africa Natural Health Products Market Y-o-Y Growth Rate Comparison by Formulation (2016-2032)
- Table 140: Middle East & Africa Natural Health Products Market Y-o-Y Growth Rate Comparison by Health Benefit (2016-2032)
- Table 141: Middle East & Africa Natural Health Products Market Y-o-Y Growth Rate Comparison by Distribution Channel (2016-2032)
- Table 142: Middle East & Africa Natural Health Products Market Share Comparison by Country (2016-2032)
- Table 143: Middle East & Africa Natural Health Products Market Share Comparison by Product Type (2016-2032)
- Table 144: Middle East & Africa Natural Health Products Market Share Comparison by Formulation (2016-2032)
- Table 145: Middle East & Africa Natural Health Products Market Share Comparison by Health Benefit (2016-2032)
- Table 146: Middle East & Africa Natural Health Products Market Share Comparison by Distribution Channel (2016-2032)
- 1. Executive Summary
-
- GFR Pharma
- USANA Health Sciences, Inc.
- Herbalife Nutrition
- Nestlé Health Science
- Blackmores
- Nature's Bounty
- NOW Foods
- GNC (General Nutrition Centers)
- Gaia Herbs
- Swisse Wellness
- The Himalaya Drug Company
- Young Living
Our Clients


View Our Licence Options
