
Naphtha Market By Type (Light Naphtha, and Heavy Naphtha), End-User Industry (Petrochemical, Agriculture, Paints and Coatings, Aerospace, and Others), By Region and Companies - Industry Segment Outlook, Market Assessment, Competition Scenario, Trends, and Forecast 2023-2032
40254
July 2023
137
Report Overview
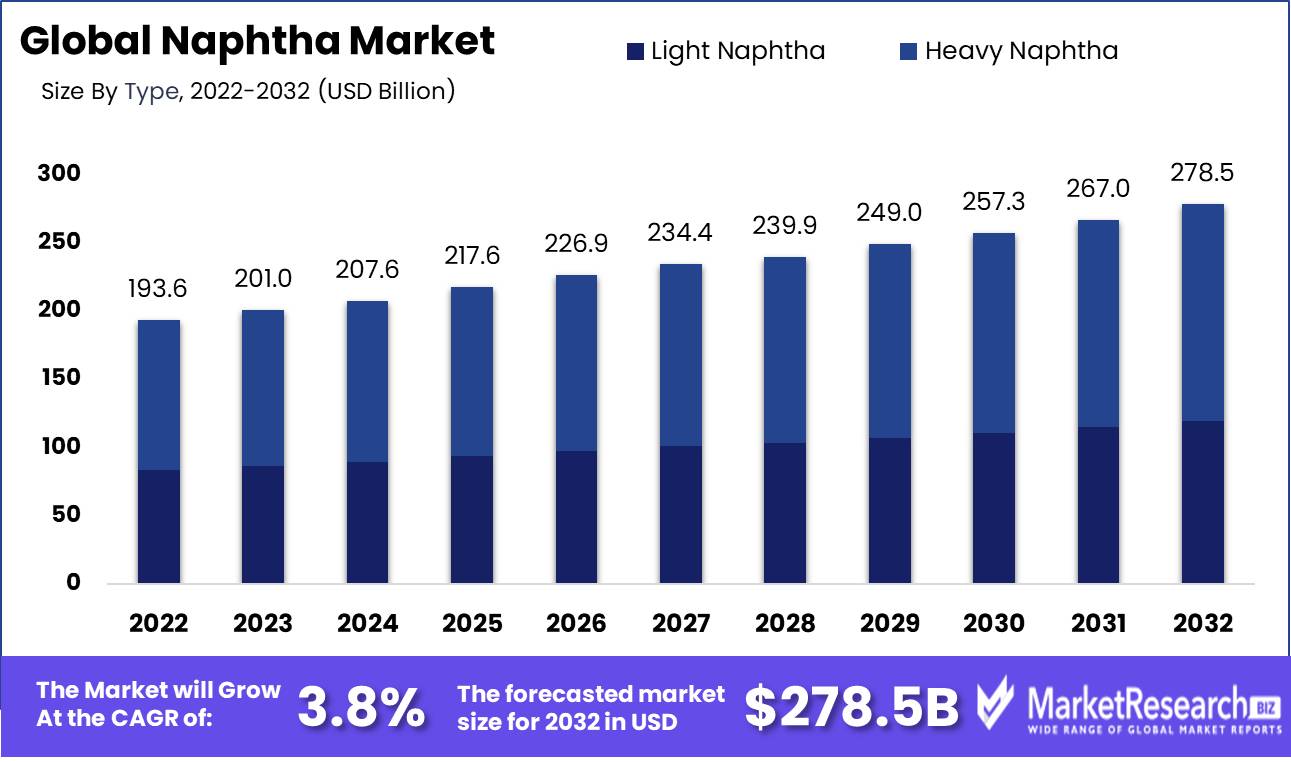
Naphtha Market size is expected to be worth around USD 278.5 Bn by 2032 from USD 193.6 Bn in 2022, growing at a CAGR of 3.8% during the forecast period from 2023 to 2032.
The increasing demand for naphtha in many industries, including transportation, construction, and plastic, is driving the global market. Naphtha is gaining popularity due to its high olefin content, which is widely used in the production of gasoline. The global naphtha market is also being driven by the increasing demand for petrochemicals like propylene and ethylene for plastic manufacturing. Hydro-pyrolysis, which is a more efficient and cost-effective method of producing the product, is another positive development. The global naphtha market is seeing positive signs due to the development of advanced furnace materials and distillation columns.
Driving factors
Rising Demand For Olefin-Rich Naphtha To Drive the Market Growth.
The olefin-rich naphtha, a naphtha derivative, is used primarily as a feedstock for the production of low-cost high-octane diesel. Naphtha use has increased in industrialized as well as developing countries due to an increase in population and rapid urbanization. Petroleum naphtha can also be used as a solvent. Petroleum naphtha can be found in many cleaning products. It can also be used to thin paint, varnish, and asphalt. Naphtha is also used in dry cleaning.
This increases the demand for naphtha, which is expected to drive the market's growth. Modern technology has led to novel furnace materials and improved distillation processes. Naphtha is being used more because of the growth in the chemical industry. Market drivers will include the development of new markets and strategic alliances, which will increase the chances that the naphtha market grows at an acceptable rate.
Restraining Factors
The Shift From the Low-Cost Alternative From Naphtha Due to the Fluctuation in the Crude Oil Prices Restraint the Market Growth.
Crude Oil is an important component of the global naphtha industry. The volatility and fluctuation in crude oil prices are significant limitations to the global naphtha industry's growth. The shift from naphtha use to low-cost alternatives such as liquefied petroleum gas (LPG) and natural gas liquid is expected to limit the market's growth over the forecast period.
Type Analysis
The Heavy Naphtha Segment Dominates the Market Globally.
Based on type, the market is segmented into Heavy Naphtha and Light Naphtha. In 2022, the largest share of the naphtha market data was held by the heavy naphtha segment. Light naphtha is often used in petrochemical steam crackers, in contrast to heavy naphtha which improves fuel efficiency in catalytic converters in refineries. In most cases, the impurities are removed by heavy naphtha hydrotreating before the hydrotreated naphtha is introduced to the catalytic reformer. The reformer's expensive platinum-based catalyst is susceptible to poisoning from such impurities.
End-User Analysis
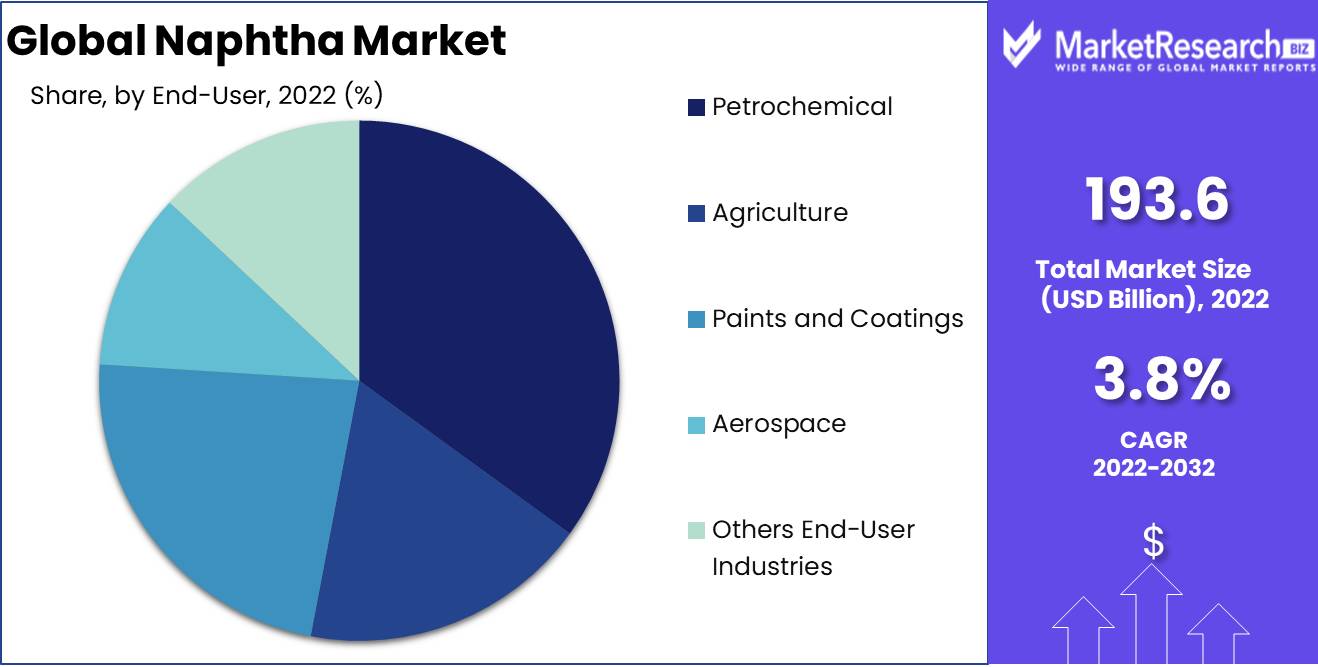
Petrochemical Industry Segment Dominates the Market Share Globally.
Based on End-User, the naphtha market is segmented into Petrochemical, Agriculture, Paints & Coatings, Aerospace, and Other End-Users. Over the course of the forecasted period, the market is anticipated to be bolstered by rising naphtha demand from the primary end-user petrochemical industry. The market is expected to expand further in the not-too-distant future as a result of the rapid urbanization and industrialization that are taking place in both large and emerging economies.
This is driving the demand for inexpensive fuel, which is expected to drive the enormous demand for naphtha. The well-intentioned plan to set up a number of chemical plants in the APAC region is expected to produce a variety of plastics and other petrochemical products, that are used in a variety of end-use industries, most likely the electronics automotive, paint, and electric vehicle battery industries, which are all expected to grow the naphtha market during the forecast period.
Key Market Segments
Based on Type
- Light Naphtha
- Heavy Naphtha
Based on End-User
- Petrochemical
- Agriculture
- Paints and Coatings
- Aerospace
- Others End-User Industries
Growth Opportunity
Increase Trade Activity to Rise the Demand of the Naphtha Market.
Naphtha demand is expected to rise due to increased trade activity by consumers in many regions. Technology advancements have led to improved distillation processes and the development of advanced furnace materials. Naphtha consumption is increasing due to the expansion of the chemical industry. Market drivers include the development of new markets and strategic partnerships that will increase market opportunities and increase naphtha market growth.
Latest Trends
Growing Of Petrochemical Industry Demand To Fuel The Market Growth.
Both light and heavy naphtha are used in many industries. Naphtha is the primary feedstock used in the petrochemical sector. About half of the naphtha produced is used by the petrochemical sector. The petrochemical sector uses about 50% of the produced naphtha for its production of aromatics and other olefins, including benzene, butadiene, and ethylene.
Because of its constant expansion, the industry is aggressive in ensuring that the naphtha market grows. Naphthalene rich in olefin is used primarily as a feedstock for low-cost, high-octane fuel diesel. Its consumption has increased in both developed and emerging economies due to a growing population and accelerated urbanization. Its production and demand are increasing in fast-growing countries like India, China.
Regional Analysis
North America Holds The Largest Market Share Globally.
The global naphtha market can be divided into North America and Europe, Asia Pacific, Latin America, Middle East & Africa, and Europe. The North America region is one of the largest producers of natural gas and oil. It is expected that the region will hold the largest share of the global oil well count. To meet the increasing demand for petrochemicals and other allied products, the region's petrochemical sector is expanding. In the next few years, the growth of the petrochemical sector is expected to increase the demand for naphtha.
Europe is a major producer of chemicals and allied products. In the next few years, the European chemical industry will continue to grow. The region of Latin America has a growing fertilizer industry. This has led to a rise in demand for naphtha feedstock. The growth of the Latin American fertilizer industry is expected to increase the growth rate of the naphtha marketplace over the forecast period.
The Asia Pacific region has a high potential for growth in the naphtha industry. Due to the high demand and low labor costs, countries such as India and China have seen steady growth in their agrochemical, paints & coatings, and petrochemical industries. These industries will increase the demand for naphtha in the Asia Pacific region, which is expected to lead to a rise in sales of raw materials. The Middle East and Africa have a moderately expanding chemical industry. This is why the forecast period will see steady growth in the demand for naphtha to be a feedstock.
Key Regions and Countries
North America
- US
- Canada
- Mexico
Western Europe
- Germany
- France
- The UK
- Spain
- Italy
- Portugal
- Ireland
- Austria
- Switzerland
- Benelux
- Nordic
- Rest of Western Europe
Eastern Europe
- Russia
- Poland
- The Czech Republic
- Greece
- Rest of Eastern Europe
APAC
- China
- Japan
- South Korea
- India
- Australia & New Zealand
- Indonesia
- Malaysia
- Philippines
- Singapore
- Thailand
- Vietnam
- Rest of APAC
Latin America
- Brazil
- Colombia
- Chile
- Argentina
- Costa Rica
- Rest of Latin America
Middle East & Africa
- Algeria
- Egypt
- Israel
- Kuwait
- Nigeria
- Saudi Arabia
- South Africa
- Turkey
- United Arab Emirates
- Rest of MEA
Key Players Analysis
To increase the number of their product lines, naphtha market leaders are investing a lot in R&D. This will allow them to grow even further. Market players are also taking key market initiatives to expand their global footprint. These include new product launches, contract agreements, increased investments, and mergers and acquisitions. To survive and expand in a highly competitive market, naphtha industry competitors must provide cost-effective products.
Top Key Players in Naphtha Market
- Chevron Corporation
- Reliance Industries Limited
- Shell Chemicals
- SABIC
- BP PLC
- Exxon Mobil Corporation
- China Petrochemical Corporation
- Indian Oil Corporation Ltd
- Novatek
- Other Key Players
Recent Development
- PDV LLC, an oil and gas company based in Venezuela, announced plans to build smaller pipes to address the shortage of imported naphtha. This has led to delays in heavy crude exports and production.
- Naphtha, which was imported via ships from Russia to Venezuela in July 2019, was shipped to the Venezuelan company PDV LLC. To meet the country's gasoline demand, the export quantity of naphtha was approximately 330,000t
- The Indian Government reduced the customs duties on naphtha to 4% from 5% in July 2019. This is expected to increase India's demand for naphtha.
Report Scope:
Report Features Description Market Value (2022) USD 193.6 Bn Forecast Revenue (2032) USD 278.5 Bn CAGR (2023-2032) 3.8% Base Year for Estimation 2022 Historic Period 2016-2022 Forecast Period 2023-2032 Report Coverage Revenue Forecast, Market Dynamics, COVID-19 Impact, Competitive Landscape, Recent Developments Segments Covered By Type: Light Naphtha, and Heavy Naphtha; End-User Industry: Petrochemical, Agriculture, Paints and Coatings, Aerospace, and Others End-User Industries. Regional Analysis North America – The US, Canada, & Mexico; Western Europe – Germany, France, The UK, Spain, Italy, Portugal, Ireland, Austria, Switzerland, Benelux, Nordic, & Rest of Western Europe; Eastern Europe – Russia, Poland, The Czech Republic, Greece, & Rest of Eastern Europe; APAC – China, Japan, South Korea, India, Australia & New Zealand, Indonesia, Malaysia, Philippines, Singapore, Thailand, Vietnam, & Rest of APAC; Latin America – Brazil, Colombia, Chile, Argentina, Costa Rica, & Rest of Latin America; Middle East & Africa – Algeria, Egypt, Israel, Kuwait, Nigeria, Saudi Arabia, South Africa, Turkey, United Arab Emirates, & Rest of MEA Competitive Landscape Chevron Corporation, Reliance Industries Limited, Shell Chemicals, SABIC, BP PLC, Exxon Mobil Corporation, China Petrochemical Corporation, Indian Oil Corporation Ltd, Novatek, and Other Key Players. Customization Scope Customization for segments, region/country-level will be provided. Moreover, additional customization can be done based on the requirements. Purchase Options We have three licenses to opt for: Single User License, Multi-User License (Up to 5 Users), Corporate Use License (Unlimited User and Printable PDF) - Chevron Corporation
- Reliance Industries Limited
- Shell Chemicals
- SABIC
- BP PLC
- Exxon Mobil Corporation
- China Petrochemical Corporation
- Indian Oil Corporation Ltd
- Novatek
- Other Key Players
- 1. Executive Summary
- 1.1. Definition
- 1.2. Taxonomy
- 1.3. Research Scope
- 1.4. Key Analysis
- 1.5. Key Findings by Major Segments
- 1.6. Top strategies by Major Players
- 2. Global Naphtha Market Overview
- 2.1. Naphtha Market Dynamics
- 2.1.1. Drivers
- 2.1.2. Opportunities
- 2.1.3. Restraints
- 2.1.4. Challenges
- 2.2. Macro-economic Factors
- 2.3. Regulatory Framework
- 2.4. Market Investment Feasibility Index
- 2.5. PEST Analysis
- 2.6. PORTER’S Five Force Analysis
- 2.7. Drivers & Restraints Impact Analysis
- 2.8. Industry Chain Analysis
- 2.9. Cost Structure Analysis
- 2.10. Marketing Strategy
- 2.11. Russia-Ukraine War Impact Analysis
- 2.12. Opportunity Map Analysis
- 2.13. Market Competition Scenario Analysis
- 2.14. Product Life Cycle Analysis
- 2.15. Opportunity Orbits
- 2.16. Manufacturer Intensity Map
- 2.17. Major Companies sales by Value & Volume
- 2.1. Naphtha Market Dynamics
- 3. Global Naphtha Market Analysis, Opportunity and Forecast, 2016-2032
- 3.1. Global Naphtha Market Analysis, 2016-2021
- 3.2. Global Naphtha Market Opportunity and Forecast, 2023-2032
- 3.3. Global Naphtha Market Analysis, Opportunity and Forecast, By Type, 2016-2032
- 3.3.1. Global Naphtha Market Analysis by Type: Introduction
- 3.3.2. Market Size Absolute $ Opportunity Analysis and Forecast, By Type, 2016-2032
- 3.3.3. Light Naphtha
- 3.3.4. Heavy Naphtha
- 3.4. Global Naphtha Market Analysis, Opportunity and Forecast, By End-User Industry, 2016-2032
- 3.4.1. Global Naphtha Market Analysis by End-User Industry: Introduction
- 3.4.2. Market Size Absolute $ Opportunity Analysis and Forecast, By End-User Industry, 2016-2032
- 3.4.3. Petrochemical
- 3.4.4. Agriculture
- 3.4.5. Paints and Coatings
- 3.4.6. Aerospace
- 3.4.7. Other End-user Industries
- 4. North America Naphtha Market Analysis, Opportunity and Forecast, 2016-2032
- 4.1. North America Naphtha Market Analysis, 2016-2021
- 4.2. North America Naphtha Market Opportunity and Forecast, 2023-2032
- 4.3. North America Naphtha Market Analysis, Opportunity and Forecast, By Type, 2016-2032
- 4.3.1. North America Naphtha Market Analysis by Type: Introduction
- 4.3.2. Market Size Absolute $ Opportunity Analysis and Forecast, By Type, 2016-2032
- 4.3.3. Light Naphtha
- 4.3.4. Heavy Naphtha
- 4.4. North America Naphtha Market Analysis, Opportunity and Forecast, By End-User Industry, 2016-2032
- 4.4.1. North America Naphtha Market Analysis by End-User Industry: Introduction
- 4.4.2. Market Size Absolute $ Opportunity Analysis and Forecast, By End-User Industry, 2016-2032
- 4.4.3. Petrochemical
- 4.4.4. Agriculture
- 4.4.5. Paints and Coatings
- 4.4.6. Aerospace
- 4.4.7. Other End-user Industries
- 4.5. North America Naphtha Market Analysis, Opportunity and Forecast, By Country , 2016-2032
- 4.5.1. North America Naphtha Market Analysis by Country : Introduction
- 4.5.2. Market Size Absolute $ Opportunity Analysis and Forecast, Country , 2016-2032
- 4.5.2.1. The US
- 4.5.2.2. Canada
- 4.5.2.3. Mexico
- 5. Western Europe Naphtha Market Analysis, Opportunity and Forecast, 2016-2032
- 5.1. Western Europe Naphtha Market Analysis, 2016-2021
- 5.2. Western Europe Naphtha Market Opportunity and Forecast, 2023-2032
- 5.3. Western Europe Naphtha Market Analysis, Opportunity and Forecast, By Type, 2016-2032
- 5.3.1. Western Europe Naphtha Market Analysis by Type: Introduction
- 5.3.2. Market Size Absolute $ Opportunity Analysis and Forecast, By Type, 2016-2032
- 5.3.3. Light Naphtha
- 5.3.4. Heavy Naphtha
- 5.4. Western Europe Naphtha Market Analysis, Opportunity and Forecast, By End-User Industry, 2016-2032
- 5.4.1. Western Europe Naphtha Market Analysis by End-User Industry: Introduction
- 5.4.2. Market Size Absolute $ Opportunity Analysis and Forecast, By End-User Industry, 2016-2032
- 5.4.3. Petrochemical
- 5.4.4. Agriculture
- 5.4.5. Paints and Coatings
- 5.4.6. Aerospace
- 5.4.7. Other End-user Industries
- 5.5. Western Europe Naphtha Market Analysis, Opportunity and Forecast, By Country , 2016-2032
- 5.5.1. Western Europe Naphtha Market Analysis by Country : Introduction
- 5.5.2. Market Size Absolute $ Opportunity Analysis and Forecast, Country , 2016-2032
- 5.5.2.1. Germany
- 5.5.2.2. France
- 5.5.2.3. The UK
- 5.5.2.4. Spain
- 5.5.2.5. Italy
- 5.5.2.6. Portugal
- 5.5.2.7. Ireland
- 5.5.2.8. Austria
- 5.5.2.9. Switzerland
- 5.5.2.10. Benelux
- 5.5.2.11. Nordic
- 5.5.2.12. Rest of Western Europe
- 6. Eastern Europe Naphtha Market Analysis, Opportunity and Forecast, 2016-2032
- 6.1. Eastern Europe Naphtha Market Analysis, 2016-2021
- 6.2. Eastern Europe Naphtha Market Opportunity and Forecast, 2023-2032
- 6.3. Eastern Europe Naphtha Market Analysis, Opportunity and Forecast, By Type, 2016-2032
- 6.3.1. Eastern Europe Naphtha Market Analysis by Type: Introduction
- 6.3.2. Market Size Absolute $ Opportunity Analysis and Forecast, By Type, 2016-2032
- 6.3.3. Light Naphtha
- 6.3.4. Heavy Naphtha
- 6.4. Eastern Europe Naphtha Market Analysis, Opportunity and Forecast, By End-User Industry, 2016-2032
- 6.4.1. Eastern Europe Naphtha Market Analysis by End-User Industry: Introduction
- 6.4.2. Market Size Absolute $ Opportunity Analysis and Forecast, By End-User Industry, 2016-2032
- 6.4.3. Petrochemical
- 6.4.4. Agriculture
- 6.4.5. Paints and Coatings
- 6.4.6. Aerospace
- 6.4.7. Other End-user Industries
- 6.5. Eastern Europe Naphtha Market Analysis, Opportunity and Forecast, By Country , 2016-2032
- 6.5.1. Eastern Europe Naphtha Market Analysis by Country : Introduction
- 6.5.2. Market Size Absolute $ Opportunity Analysis and Forecast, Country , 2016-2032
- 6.5.2.1. Russia
- 6.5.2.2. Poland
- 6.5.2.3. The Czech Republic
- 6.5.2.4. Greece
- 6.5.2.5. Rest of Eastern Europe
- 7. APAC Naphtha Market Analysis, Opportunity and Forecast, 2016-2032
- 7.1. APAC Naphtha Market Analysis, 2016-2021
- 7.2. APAC Naphtha Market Opportunity and Forecast, 2023-2032
- 7.3. APAC Naphtha Market Analysis, Opportunity and Forecast, By Type, 2016-2032
- 7.3.1. APAC Naphtha Market Analysis by Type: Introduction
- 7.3.2. Market Size Absolute $ Opportunity Analysis and Forecast, By Type, 2016-2032
- 7.3.3. Light Naphtha
- 7.3.4. Heavy Naphtha
- 7.4. APAC Naphtha Market Analysis, Opportunity and Forecast, By End-User Industry, 2016-2032
- 7.4.1. APAC Naphtha Market Analysis by End-User Industry: Introduction
- 7.4.2. Market Size Absolute $ Opportunity Analysis and Forecast, By End-User Industry, 2016-2032
- 7.4.3. Petrochemical
- 7.4.4. Agriculture
- 7.4.5. Paints and Coatings
- 7.4.6. Aerospace
- 7.4.7. Other End-user Industries
- 7.5. APAC Naphtha Market Analysis, Opportunity and Forecast, By Country , 2016-2032
- 7.5.1. APAC Naphtha Market Analysis by Country : Introduction
- 7.5.2. Market Size Absolute $ Opportunity Analysis and Forecast, Country , 2016-2032
- 7.5.2.1. China
- 7.5.2.2. Japan
- 7.5.2.3. South Korea
- 7.5.2.4. India
- 7.5.2.5. Australia & New Zeland
- 7.5.2.6. Indonesia
- 7.5.2.7. Malaysia
- 7.5.2.8. Philippines
- 7.5.2.9. Singapore
- 7.5.2.10. Thailand
- 7.5.2.11. Vietnam
- 7.5.2.12. Rest of APAC
- 8. Latin America Naphtha Market Analysis, Opportunity and Forecast, 2016-2032
- 8.1. Latin America Naphtha Market Analysis, 2016-2021
- 8.2. Latin America Naphtha Market Opportunity and Forecast, 2023-2032
- 8.3. Latin America Naphtha Market Analysis, Opportunity and Forecast, By Type, 2016-2032
- 8.3.1. Latin America Naphtha Market Analysis by Type: Introduction
- 8.3.2. Market Size Absolute $ Opportunity Analysis and Forecast, By Type, 2016-2032
- 8.3.3. Light Naphtha
- 8.3.4. Heavy Naphtha
- 8.4. Latin America Naphtha Market Analysis, Opportunity and Forecast, By End-User Industry, 2016-2032
- 8.4.1. Latin America Naphtha Market Analysis by End-User Industry: Introduction
- 8.4.2. Market Size Absolute $ Opportunity Analysis and Forecast, By End-User Industry, 2016-2032
- 8.4.3. Petrochemical
- 8.4.4. Agriculture
- 8.4.5. Paints and Coatings
- 8.4.6. Aerospace
- 8.4.7. Other End-user Industries
- 8.5. Latin America Naphtha Market Analysis, Opportunity and Forecast, By Country , 2016-2032
- 8.5.1. Latin America Naphtha Market Analysis by Country : Introduction
- 8.5.2. Market Size Absolute $ Opportunity Analysis and Forecast, Country , 2016-2032
- 8.5.2.1. Brazil
- 8.5.2.2. Colombia
- 8.5.2.3. Chile
- 8.5.2.4. Argentina
- 8.5.2.5. Costa Rica
- 8.5.2.6. Rest of Latin America
- 9. Middle East & Africa Naphtha Market Analysis, Opportunity and Forecast, 2016-2032
- 9.1. Middle East & Africa Naphtha Market Analysis, 2016-2021
- 9.2. Middle East & Africa Naphtha Market Opportunity and Forecast, 2023-2032
- 9.3. Middle East & Africa Naphtha Market Analysis, Opportunity and Forecast, By Type, 2016-2032
- 9.3.1. Middle East & Africa Naphtha Market Analysis by Type: Introduction
- 9.3.2. Market Size Absolute $ Opportunity Analysis and Forecast, By Type, 2016-2032
- 9.3.3. Light Naphtha
- 9.3.4. Heavy Naphtha
- 9.4. Middle East & Africa Naphtha Market Analysis, Opportunity and Forecast, By End-User Industry, 2016-2032
- 9.4.1. Middle East & Africa Naphtha Market Analysis by End-User Industry: Introduction
- 9.4.2. Market Size Absolute $ Opportunity Analysis and Forecast, By End-User Industry, 2016-2032
- 9.4.3. Petrochemical
- 9.4.4. Agriculture
- 9.4.5. Paints and Coatings
- 9.4.6. Aerospace
- 9.4.7. Other End-user Industries
- 9.5. Middle East & Africa Naphtha Market Analysis, Opportunity and Forecast, By Country , 2016-2032
- 9.5.1. Middle East & Africa Naphtha Market Analysis by Country : Introduction
- 9.5.2. Market Size Absolute $ Opportunity Analysis and Forecast, Country , 2016-2032
- 9.5.2.1. Algeria
- 9.5.2.2. Egypt
- 9.5.2.3. Israel
- 9.5.2.4. Kuwait
- 9.5.2.5. Nigeria
- 9.5.2.6. Saudi Arabia
- 9.5.2.7. South Africa
- 9.5.2.8. Turkey
- 9.5.2.9. The UAE
- 9.5.2.10. Rest of MEA
- 10. Global Naphtha Market Analysis, Opportunity and Forecast, By Region , 2016-2032
- 10.1. Global Naphtha Market Analysis by Region : Introduction
- 10.2. Market Size Absolute $ Opportunity Analysis and Forecast, By Region , 2016-2032
- 10.2.1. North America
- 10.2.2. Western Europe
- 10.2.3. Eastern Europe
- 10.2.4. APAC
- 10.2.5. Latin America
- 10.2.6. Middle East & Africa
- 11. Global Naphtha Market Competitive Landscape, Market Share Analysis, and Company Profiles
- 11.1. Market Share Analysis
- 11.2. Company Profiles
- 11.3. Chevron Corporation
- 11.3.1. Company Overview
- 11.3.2. Financial Highlights
- 11.3.3. Product Portfolio
- 11.3.4. SWOT Analysis
- 11.3.5. Key Strategies and Developments
- 11.4. Reliance Industries Limited
- 11.4.1. Company Overview
- 11.4.2. Financial Highlights
- 11.4.3. Product Portfolio
- 11.4.4. SWOT Analysis
- 11.4.5. Key Strategies and Developments
- 11.5. Shell Chemicals
- 11.5.1. Company Overview
- 11.5.2. Financial Highlights
- 11.5.3. Product Portfolio
- 11.5.4. SWOT Analysis
- 11.5.5. Key Strategies and Developments
- 11.6. SABIC
- 11.6.1. Company Overview
- 11.6.2. Financial Highlights
- 11.6.3. Product Portfolio
- 11.6.4. SWOT Analysis
- 11.6.5. Key Strategies and Developments
- 11.7. BP PLC
- 11.7.1. Company Overview
- 11.7.2. Financial Highlights
- 11.7.3. Product Portfolio
- 11.7.4. SWOT Analysis
- 11.7.5. Key Strategies and Developments
- 11.8. Exxon Mobil Corporation
- 11.8.1. Company Overview
- 11.8.2. Financial Highlights
- 11.8.3. Product Portfolio
- 11.8.4. SWOT Analysis
- 11.8.5. Key Strategies and Developments
- 11.9. China Petrochemical Corporation
- 11.9.1. Company Overview
- 11.9.2. Financial Highlights
- 11.9.3. Product Portfolio
- 11.9.4. SWOT Analysis
- 11.9.5. Key Strategies and Developments
- 11.10. Indian Oil Corporation Ltd
- 11.10.1. Company Overview
- 11.10.2. Financial Highlights
- 11.10.3. Product Portfolio
- 11.10.4. SWOT Analysis
- 11.10.5. Key Strategies and Developments
- 11.11. Novatek
- 11.11.1. Company Overview
- 11.11.2. Financial Highlights
- 11.11.3. Product Portfolio
- 11.11.4. SWOT Analysis
- 11.11.5. Key Strategies and Developments
- 11.12.1. Company Overview
- 11.12.2. Financial Highlights
- 11.12.3. Product Portfolio
- 11.12.4. SWOT Analysis
- 11.12.5. Key Strategies and Developments
- 11.14. Other Key Players
- 11.14.1. Company Overview
- 11.14.2. Financial Highlights
- 11.14.3. Product Portfolio
- 11.14.4. SWOT Analysis
- 11.14.5. Key Strategies and Developments
- 12. Assumptions and Acronyms
- 13. Research Methodology
- 14. Contact
- List of Figures
- Figure 1: Global Naphtha Market Revenue (US$ Mn) Market Share by Type in 2022
- Figure 2: Global Naphtha Market Attractiveness Analysis by Type, 2016-2032
- Figure 3: Global Naphtha Market Revenue (US$ Mn) Market Share by End-User Industryin 2022
- Figure 4: Global Naphtha Market Attractiveness Analysis by End-User Industry, 2016-2032
- Figure 5: Global Naphtha Market Revenue (US$ Mn) Market Share by Region in 2022
- Figure 6: Global Naphtha Market Attractiveness Analysis by Region, 2016-2032
- Figure 7: Global Naphtha Market Revenue (US$ Mn) (2016-2032)
- Figure 8: Global Naphtha Market Revenue (US$ Mn) Comparison by Region (2016-2032)
- Figure 9: Global Naphtha Market Revenue (US$ Mn) Comparison by Type (2016-2032)
- Figure 10: Global Naphtha Market Revenue (US$ Mn) Comparison by End-User Industry (2016-2032)
- Figure 11: Global Naphtha Market Y-o-Y Growth Rate Comparison by Region (2016-2032)
- Figure 12: Global Naphtha Market Y-o-Y Growth Rate Comparison by Type (2016-2032)
- Figure 13: Global Naphtha Market Y-o-Y Growth Rate Comparison by End-User Industry (2016-2032)
- Figure 14: Global Naphtha Market Share Comparison by Region (2016-2032)
- Figure 15: Global Naphtha Market Share Comparison by Type (2016-2032)
- Figure 16: Global Naphtha Market Share Comparison by End-User Industry (2016-2032)
- Figure 17: North America Naphtha Market Revenue (US$ Mn) Market Share by Typein 2022
- Figure 18: North America Naphtha Market Attractiveness Analysis by Type, 2016-2032
- Figure 19: North America Naphtha Market Revenue (US$ Mn) Market Share by End-User Industryin 2022
- Figure 20: North America Naphtha Market Attractiveness Analysis by End-User Industry, 2016-2032
- Figure 21: North America Naphtha Market Revenue (US$ Mn) Market Share by Country in 2022
- Figure 22: North America Naphtha Market Attractiveness Analysis by Country, 2016-2032
- Figure 23: North America Naphtha Market Revenue (US$ Mn) (2016-2032)
- Figure 24: North America Naphtha Market Revenue (US$ Mn) Comparison by Country (2016-2032)
- Figure 25: North America Naphtha Market Revenue (US$ Mn) Comparison by Type (2016-2032)
- Figure 26: North America Naphtha Market Revenue (US$ Mn) Comparison by End-User Industry (2016-2032)
- Figure 27: North America Naphtha Market Y-o-Y Growth Rate Comparison by Country (2016-2032)
- Figure 28: North America Naphtha Market Y-o-Y Growth Rate Comparison by Type (2016-2032)
- Figure 29: North America Naphtha Market Y-o-Y Growth Rate Comparison by End-User Industry (2016-2032)
- Figure 30: North America Naphtha Market Share Comparison by Country (2016-2032)
- Figure 31: North America Naphtha Market Share Comparison by Type (2016-2032)
- Figure 32: North America Naphtha Market Share Comparison by End-User Industry (2016-2032)
- Figure 33: Western Europe Naphtha Market Revenue (US$ Mn) Market Share by Typein 2022
- Figure 34: Western Europe Naphtha Market Attractiveness Analysis by Type, 2016-2032
- Figure 35: Western Europe Naphtha Market Revenue (US$ Mn) Market Share by End-User Industryin 2022
- Figure 36: Western Europe Naphtha Market Attractiveness Analysis by End-User Industry, 2016-2032
- Figure 37: Western Europe Naphtha Market Revenue (US$ Mn) Market Share by Country in 2022
- Figure 38: Western Europe Naphtha Market Attractiveness Analysis by Country, 2016-2032
- Figure 39: Western Europe Naphtha Market Revenue (US$ Mn) (2016-2032)
- Figure 40: Western Europe Naphtha Market Revenue (US$ Mn) Comparison by Country (2016-2032)
- Figure 41: Western Europe Naphtha Market Revenue (US$ Mn) Comparison by Type (2016-2032)
- Figure 42: Western Europe Naphtha Market Revenue (US$ Mn) Comparison by End-User Industry (2016-2032)
- Figure 43: Western Europe Naphtha Market Y-o-Y Growth Rate Comparison by Country (2016-2032)
- Figure 44: Western Europe Naphtha Market Y-o-Y Growth Rate Comparison by Type (2016-2032)
- Figure 45: Western Europe Naphtha Market Y-o-Y Growth Rate Comparison by End-User Industry (2016-2032)
- Figure 46: Western Europe Naphtha Market Share Comparison by Country (2016-2032)
- Figure 47: Western Europe Naphtha Market Share Comparison by Type (2016-2032)
- Figure 48: Western Europe Naphtha Market Share Comparison by End-User Industry (2016-2032)
- Figure 49: Eastern Europe Naphtha Market Revenue (US$ Mn) Market Share by Typein 2022
- Figure 50: Eastern Europe Naphtha Market Attractiveness Analysis by Type, 2016-2032
- Figure 51: Eastern Europe Naphtha Market Revenue (US$ Mn) Market Share by End-User Industryin 2022
- Figure 52: Eastern Europe Naphtha Market Attractiveness Analysis by End-User Industry, 2016-2032
- Figure 53: Eastern Europe Naphtha Market Revenue (US$ Mn) Market Share by Country in 2022
- Figure 54: Eastern Europe Naphtha Market Attractiveness Analysis by Country, 2016-2032
- Figure 55: Eastern Europe Naphtha Market Revenue (US$ Mn) (2016-2032)
- Figure 56: Eastern Europe Naphtha Market Revenue (US$ Mn) Comparison by Country (2016-2032)
- Figure 57: Eastern Europe Naphtha Market Revenue (US$ Mn) Comparison by Type (2016-2032)
- Figure 58: Eastern Europe Naphtha Market Revenue (US$ Mn) Comparison by End-User Industry (2016-2032)
- Figure 59: Eastern Europe Naphtha Market Y-o-Y Growth Rate Comparison by Country (2016-2032)
- Figure 60: Eastern Europe Naphtha Market Y-o-Y Growth Rate Comparison by Type (2016-2032)
- Figure 61: Eastern Europe Naphtha Market Y-o-Y Growth Rate Comparison by End-User Industry (2016-2032)
- Figure 62: Eastern Europe Naphtha Market Share Comparison by Country (2016-2032)
- Figure 63: Eastern Europe Naphtha Market Share Comparison by Type (2016-2032)
- Figure 64: Eastern Europe Naphtha Market Share Comparison by End-User Industry (2016-2032)
- Figure 65: APAC Naphtha Market Revenue (US$ Mn) Market Share by Typein 2022
- Figure 66: APAC Naphtha Market Attractiveness Analysis by Type, 2016-2032
- Figure 67: APAC Naphtha Market Revenue (US$ Mn) Market Share by End-User Industryin 2022
- Figure 68: APAC Naphtha Market Attractiveness Analysis by End-User Industry, 2016-2032
- Figure 69: APAC Naphtha Market Revenue (US$ Mn) Market Share by Country in 2022
- Figure 70: APAC Naphtha Market Attractiveness Analysis by Country, 2016-2032
- Figure 71: APAC Naphtha Market Revenue (US$ Mn) (2016-2032)
- Figure 72: APAC Naphtha Market Revenue (US$ Mn) Comparison by Country (2016-2032)
- Figure 73: APAC Naphtha Market Revenue (US$ Mn) Comparison by Type (2016-2032)
- Figure 74: APAC Naphtha Market Revenue (US$ Mn) Comparison by End-User Industry (2016-2032)
- Figure 75: APAC Naphtha Market Y-o-Y Growth Rate Comparison by Country (2016-2032)
- Figure 76: APAC Naphtha Market Y-o-Y Growth Rate Comparison by Type (2016-2032)
- Figure 77: APAC Naphtha Market Y-o-Y Growth Rate Comparison by End-User Industry (2016-2032)
- Figure 78: APAC Naphtha Market Share Comparison by Country (2016-2032)
- Figure 79: APAC Naphtha Market Share Comparison by Type (2016-2032)
- Figure 80: APAC Naphtha Market Share Comparison by End-User Industry (2016-2032)
- Figure 81: Latin America Naphtha Market Revenue (US$ Mn) Market Share by Typein 2022
- Figure 82: Latin America Naphtha Market Attractiveness Analysis by Type, 2016-2032
- Figure 83: Latin America Naphtha Market Revenue (US$ Mn) Market Share by End-User Industryin 2022
- Figure 84: Latin America Naphtha Market Attractiveness Analysis by End-User Industry, 2016-2032
- Figure 85: Latin America Naphtha Market Revenue (US$ Mn) Market Share by Country in 2022
- Figure 86: Latin America Naphtha Market Attractiveness Analysis by Country, 2016-2032
- Figure 87: Latin America Naphtha Market Revenue (US$ Mn) (2016-2032)
- Figure 88: Latin America Naphtha Market Revenue (US$ Mn) Comparison by Country (2016-2032)
- Figure 89: Latin America Naphtha Market Revenue (US$ Mn) Comparison by Type (2016-2032)
- Figure 90: Latin America Naphtha Market Revenue (US$ Mn) Comparison by End-User Industry (2016-2032)
- Figure 91: Latin America Naphtha Market Y-o-Y Growth Rate Comparison by Country (2016-2032)
- Figure 92: Latin America Naphtha Market Y-o-Y Growth Rate Comparison by Type (2016-2032)
- Figure 93: Latin America Naphtha Market Y-o-Y Growth Rate Comparison by End-User Industry (2016-2032)
- Figure 94: Latin America Naphtha Market Share Comparison by Country (2016-2032)
- Figure 95: Latin America Naphtha Market Share Comparison by Type (2016-2032)
- Figure 96: Latin America Naphtha Market Share Comparison by End-User Industry (2016-2032)
- Figure 97: Middle East & Africa Naphtha Market Revenue (US$ Mn) Market Share by Typein 2022
- Figure 98: Middle East & Africa Naphtha Market Attractiveness Analysis by Type, 2016-2032
- Figure 99: Middle East & Africa Naphtha Market Revenue (US$ Mn) Market Share by End-User Industryin 2022
- Figure 100: Middle East & Africa Naphtha Market Attractiveness Analysis by End-User Industry, 2016-2032
- Figure 101: Middle East & Africa Naphtha Market Revenue (US$ Mn) Market Share by Country in 2022
- Figure 102: Middle East & Africa Naphtha Market Attractiveness Analysis by Country, 2016-2032
- Figure 103: Middle East & Africa Naphtha Market Revenue (US$ Mn) (2016-2032)
- Figure 104: Middle East & Africa Naphtha Market Revenue (US$ Mn) Comparison by Country (2016-2032)
- Figure 105: Middle East & Africa Naphtha Market Revenue (US$ Mn) Comparison by Type (2016-2032)
- Figure 106: Middle East & Africa Naphtha Market Revenue (US$ Mn) Comparison by End-User Industry (2016-2032)
- Figure 107: Middle East & Africa Naphtha Market Y-o-Y Growth Rate Comparison by Country (2016-2032)
- Figure 108: Middle East & Africa Naphtha Market Y-o-Y Growth Rate Comparison by Type (2016-2032)
- Figure 109: Middle East & Africa Naphtha Market Y-o-Y Growth Rate Comparison by End-User Industry (2016-2032)
- Figure 110: Middle East & Africa Naphtha Market Share Comparison by Country (2016-2032)
- Figure 111: Middle East & Africa Naphtha Market Share Comparison by Type (2016-2032)
- Figure 112: Middle East & Africa Naphtha Market Share Comparison by End-User Industry (2016-2032)
- List of Tables
- Table 1: Global Naphtha Market Comparison by Type (2016-2032)
- Table 2: Global Naphtha Market Comparison by End-User Industry (2016-2032)
- Table 3: Global Naphtha Market Revenue (US$ Mn) Comparison by Region (2016-2032)
- Table 4: Global Naphtha Market Revenue (US$ Mn) (2016-2032)
- Table 5: Global Naphtha Market Revenue (US$ Mn) Comparison by Region (2016-2032)
- Table 6: Global Naphtha Market Revenue (US$ Mn) Comparison by Type (2016-2032)
- Table 7: Global Naphtha Market Revenue (US$ Mn) Comparison by End-User Industry (2016-2032)
- Table 8: Global Naphtha Market Y-o-Y Growth Rate Comparison by Region (2016-2032)
- Table 9: Global Naphtha Market Y-o-Y Growth Rate Comparison by Type (2016-2032)
- Table 10: Global Naphtha Market Y-o-Y Growth Rate Comparison by End-User Industry (2016-2032)
- Table 11: Global Naphtha Market Share Comparison by Region (2016-2032)
- Table 12: Global Naphtha Market Share Comparison by Type (2016-2032)
- Table 13: Global Naphtha Market Share Comparison by End-User Industry (2016-2032)
- Table 14: North America Naphtha Market Comparison by End-User Industry (2016-2032)
- Table 15: North America Naphtha Market Revenue (US$ Mn) Comparison by Country (2016-2032)
- Table 16: North America Naphtha Market Revenue (US$ Mn) (2016-2032)
- Table 17: North America Naphtha Market Revenue (US$ Mn) Comparison by Country (2016-2032)
- Table 18: North America Naphtha Market Revenue (US$ Mn) Comparison by Type (2016-2032)
- Table 19: North America Naphtha Market Revenue (US$ Mn) Comparison by End-User Industry (2016-2032)
- Table 20: North America Naphtha Market Y-o-Y Growth Rate Comparison by Country (2016-2032)
- Table 21: North America Naphtha Market Y-o-Y Growth Rate Comparison by Type (2016-2032)
- Table 22: North America Naphtha Market Y-o-Y Growth Rate Comparison by End-User Industry (2016-2032)
- Table 23: North America Naphtha Market Share Comparison by Country (2016-2032)
- Table 24: North America Naphtha Market Share Comparison by Type (2016-2032)
- Table 25: North America Naphtha Market Share Comparison by End-User Industry (2016-2032)
- Table 26: Western Europe Naphtha Market Comparison by Type (2016-2032)
- Table 27: Western Europe Naphtha Market Comparison by End-User Industry (2016-2032)
- Table 28: Western Europe Naphtha Market Revenue (US$ Mn) Comparison by Country (2016-2032)
- Table 29: Western Europe Naphtha Market Revenue (US$ Mn) (2016-2032)
- Table 30: Western Europe Naphtha Market Revenue (US$ Mn) Comparison by Country (2016-2032)
- Table 31: Western Europe Naphtha Market Revenue (US$ Mn) Comparison by Type (2016-2032)
- Table 32: Western Europe Naphtha Market Revenue (US$ Mn) Comparison by End-User Industry (2016-2032)
- Table 33: Western Europe Naphtha Market Y-o-Y Growth Rate Comparison by Country (2016-2032)
- Table 34: Western Europe Naphtha Market Y-o-Y Growth Rate Comparison by Type (2016-2032)
- Table 35: Western Europe Naphtha Market Y-o-Y Growth Rate Comparison by End-User Industry (2016-2032)
- Table 36: Western Europe Naphtha Market Share Comparison by Country (2016-2032)
- Table 37: Western Europe Naphtha Market Share Comparison by Type (2016-2032)
- Table 38: Western Europe Naphtha Market Share Comparison by End-User Industry (2016-2032)
- Table 39: Eastern Europe Naphtha Market Comparison by Type (2016-2032)
- Table 40: Eastern Europe Naphtha Market Comparison by End-User Industry (2016-2032)
- Table 41: Eastern Europe Naphtha Market Revenue (US$ Mn) Comparison by Country (2016-2032)
- Table 42: Eastern Europe Naphtha Market Revenue (US$ Mn) (2016-2032)
- Table 43: Eastern Europe Naphtha Market Revenue (US$ Mn) Comparison by Country (2016-2032)
- Table 44: Eastern Europe Naphtha Market Revenue (US$ Mn) Comparison by Type (2016-2032)
- Table 45: Eastern Europe Naphtha Market Revenue (US$ Mn) Comparison by End-User Industry (2016-2032)
- Table 46: Eastern Europe Naphtha Market Y-o-Y Growth Rate Comparison by Country (2016-2032)
- Table 47: Eastern Europe Naphtha Market Y-o-Y Growth Rate Comparison by Type (2016-2032)
- Table 48: Eastern Europe Naphtha Market Y-o-Y Growth Rate Comparison by End-User Industry (2016-2032)
- Table 49: Eastern Europe Naphtha Market Share Comparison by Country (2016-2032)
- Table 50: Eastern Europe Naphtha Market Share Comparison by Type (2016-2032)
- Table 51: Eastern Europe Naphtha Market Share Comparison by End-User Industry (2016-2032)
- Table 52: APAC Naphtha Market Comparison by Type (2016-2032)
- Table 53: APAC Naphtha Market Comparison by End-User Industry (2016-2032)
- Table 54: APAC Naphtha Market Revenue (US$ Mn) Comparison by Country (2016-2032)
- Table 55: APAC Naphtha Market Revenue (US$ Mn) (2016-2032)
- Table 56: APAC Naphtha Market Revenue (US$ Mn) Comparison by Country (2016-2032)
- Table 57: APAC Naphtha Market Revenue (US$ Mn) Comparison by Type (2016-2032)
- Table 58: APAC Naphtha Market Revenue (US$ Mn) Comparison by End-User Industry (2016-2032)
- Table 59: APAC Naphtha Market Y-o-Y Growth Rate Comparison by Country (2016-2032)
- Table 60: APAC Naphtha Market Y-o-Y Growth Rate Comparison by Type (2016-2032)
- Table 61: APAC Naphtha Market Y-o-Y Growth Rate Comparison by End-User Industry (2016-2032)
- Table 62: APAC Naphtha Market Share Comparison by Country (2016-2032)
- Table 63: APAC Naphtha Market Share Comparison by Type (2016-2032)
- Table 64: APAC Naphtha Market Share Comparison by End-User Industry (2016-2032)
- Table 65: Latin America Naphtha Market Comparison by Type (2016-2032)
- Table 66: Latin America Naphtha Market Comparison by End-User Industry (2016-2032)
- Table 67: Latin America Naphtha Market Revenue (US$ Mn) Comparison by Country (2016-2032)
- Table 68: Latin America Naphtha Market Revenue (US$ Mn) (2016-2032)
- Table 69: Latin America Naphtha Market Revenue (US$ Mn) Comparison by Country (2016-2032)
- Table 70: Latin America Naphtha Market Revenue (US$ Mn) Comparison by Type (2016-2032)
- Table 71: Latin America Naphtha Market Revenue (US$ Mn) Comparison by End-User Industry (2016-2032)
- Table 72: Latin America Naphtha Market Y-o-Y Growth Rate Comparison by Country (2016-2032)
- Table 73: Latin America Naphtha Market Y-o-Y Growth Rate Comparison by Type (2016-2032)
- Table 74: Latin America Naphtha Market Y-o-Y Growth Rate Comparison by End-User Industry (2016-2032)
- Table 75: Latin America Naphtha Market Share Comparison by Country (2016-2032)
- Table 76: Latin America Naphtha Market Share Comparison by Type (2016-2032)
- Table 77: Latin America Naphtha Market Share Comparison by End-User Industry (2016-2032)
- Table 78: Middle East & Africa Naphtha Market Comparison by Type (2016-2032)
- Table 79: Middle East & Africa Naphtha Market Comparison by End-User Industry (2016-2032)
- Table 80: Middle East & Africa Naphtha Market Revenue (US$ Mn) Comparison by Country (2016-2032)
- Table 81: Middle East & Africa Naphtha Market Revenue (US$ Mn) (2016-2032)
- Table 82: Middle East & Africa Naphtha Market Revenue (US$ Mn) Comparison by Country (2016-2032)
- Table 83: Middle East & Africa Naphtha Market Revenue (US$ Mn) Comparison by Type (2016-2032)
- Table 84: Middle East & Africa Naphtha Market Revenue (US$ Mn) Comparison by End-User Industry (2016-2032)
- Table 85: Middle East & Africa Naphtha Market Y-o-Y Growth Rate Comparison by Country (2016-2032)
- Table 86: Middle East & Africa Naphtha Market Y-o-Y Growth Rate Comparison by Type (2016-2032)
- Table 87: Middle East & Africa Naphtha Market Y-o-Y Growth Rate Comparison by End-User Industry (2016-2032)
- Table 88: Middle East & Africa Naphtha Market Share Comparison by Country (2016-2032)
- Table 89: Middle East & Africa Naphtha Market Share Comparison by Type (2016-2032)
- Table 90: Middle East & Africa Naphtha Market Share Comparison by End-User Industry (2016-2032)
- 1. Executive Summary
Inquiry Form
Why Choose Us
- 360 Degree Approach
- Growth Consulting
- 24/7 Research Support
- Comprehensive-Level of Customization
- Competitive Intelligence
- Single-Country/ Region Intelligence
- Post-Sale Service Assistance
- Access to Lead Analysts
- Available in PDF, Excel, Word/ PPT
Request for Customization
OUR CLIENTS
Don't just take our word. We are trusted by these great companies!