
Medical Morphine Market Report By Route of Administration (Oral, Parenteral, Other Routes of Administration), By Application (Arthritis, Cancer, Myocardial Infarction, Kidney Stones, Diarrhea, Other Applications), By Distribution Channel (Hospital Pharmacies, Retail Pharmacies, Online Pharmacies), By Region and Companies - Industry Segment Outlook, Market Assessment, Competition Scenario, Trends and Forecast 2024-2033
-
45123
-
April 2024
-
285
-


-
This report was compiled by Trishita Deb Trishita Deb is an experienced market research and consulting professional with over 7 years of expertise across healthcare, consumer goods, and materials, contributing to over 400 healthcare-related reports. Correspondence Team Lead- Healthcare Linkedin | Detailed Market research Methodology Our methodology involves a mix of primary research, including interviews with leading mental health experts, and secondary research from reputable medical journals and databases. View Detailed Methodology Page
-
Quick Navigation
Report Overview
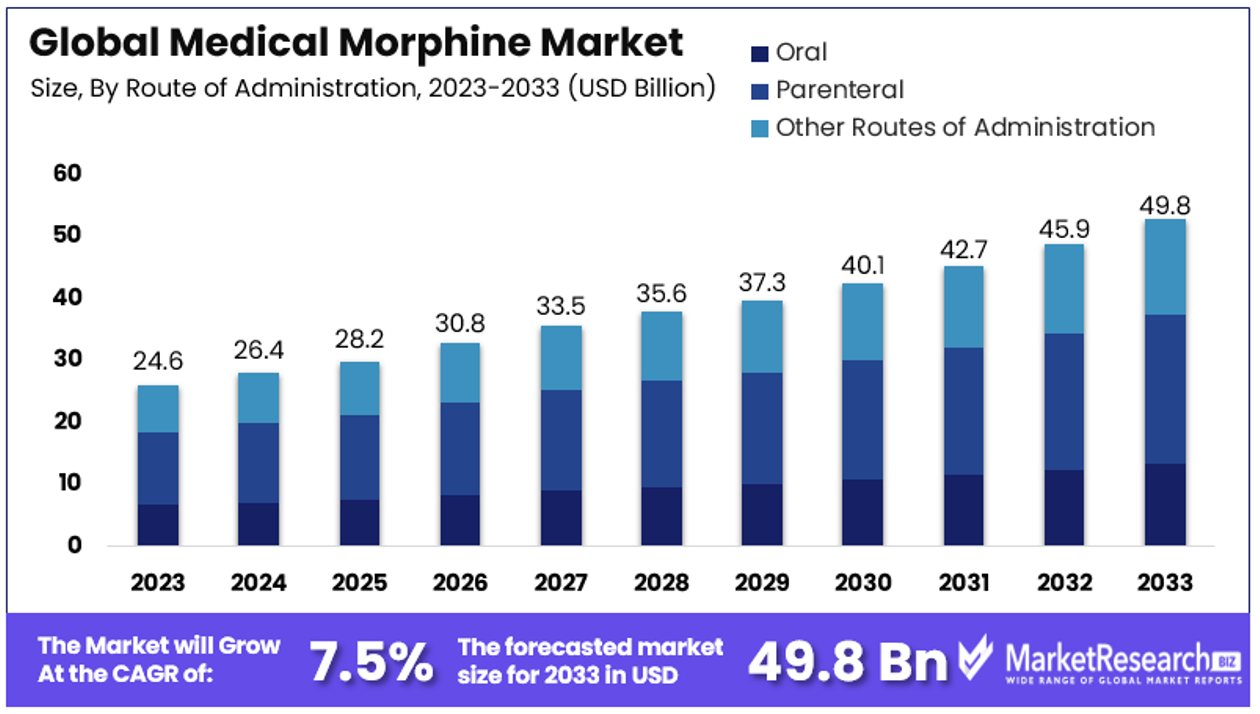
The Global Medical Morphine Market size is expected to be worth around USD 49.8 Billion by 2033, from USD 24.6 Billion in 2023, growing at a CAGR of 7.50% during the forecast period from 2024 to 2033.
The Medical Morphine Market encompasses the production, distribution, and sale of morphine for medical applications. This market is primarily driven by the increasing demand for pain management solutions across healthcare settings, particularly in surgical procedures and chronic pain management.
Key stakeholders include pharmaceutical companies, healthcare providers, and regulatory bodies, which ensure the safe and controlled use of this potent opioid. The market's growth is influenced by advancements in pain management practices and the stringent regulations governing opioid distribution.
The Medical Morphine Market is poised for significant growth, driven primarily by the escalating need for effective pain management solutions in the healthcare sector. Chronic pain remains a pervasive issue, impacting approximately 20.9% of U.S. adults, which translates to 51.6 million individuals.
Additionally, 6.9% of adults experience high-impact chronic pain that severely limits daily activities, according to the Centers for Disease Control and Prevention (CDC). These statistics underline the critical demand for potent pain relief medications, where morphine plays a fundamental role.
Moreover, a study by the University of Arizona Health Sciences underscores the complex interplay between chronic pain and mental health issues, revealing that nearly 5% of U.S. adults suffer from both chronic pain and mental health disorders such as anxiety or depression. This dual burden often results in significant functional impairments, further emphasizing the need for effective pharmacological interventions like morphine.
Given these dynamics, the market for medical morphine is expected to expand as healthcare providers increasingly seek potent, reliable solutions for pain management that can improve quality of life for patients with severe and chronic pain conditions. Pharmaceutical companies and healthcare professionals must navigate the stringent regulatory landscape that governs opioid distribution, which is designed to mitigate the risk of abuse while ensuring accessibility for those in need.
Staying informed about regulatory changes and market trends is crucial. It is anticipated that continued research into pain management and mental health will potentially open new avenues for morphine applications, thus influencing future market trajectories.
Key Takeaways
- Market Value Projection: The Global Medical Morphine Market is projected to reach USD 49.8 Billion by 2033, with a notable CAGR of 7.50% during the forecast period from 2024 to 2033.
- Route of Administration: Parenteral administration holds the largest market share at 47.8%, attributed to its rapid pain relief effectiveness, particularly crucial for severe pain conditions.
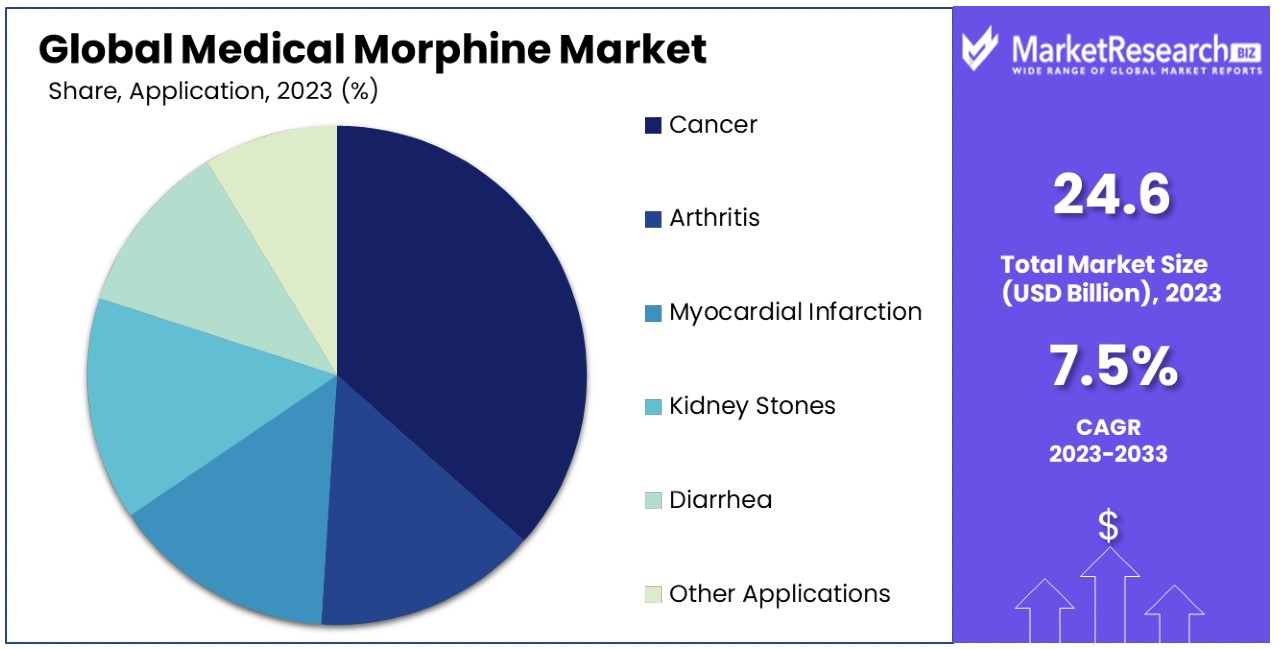
- Application: Cancer pain management dominates with 42.8% market share, reflecting the high prevalence and severity of pain in cancer patients.
- Distribution Channel: Hospital pharmacies lead with a 40% share, ensuring controlled and immediate distribution of morphine, especially for in-patient care.
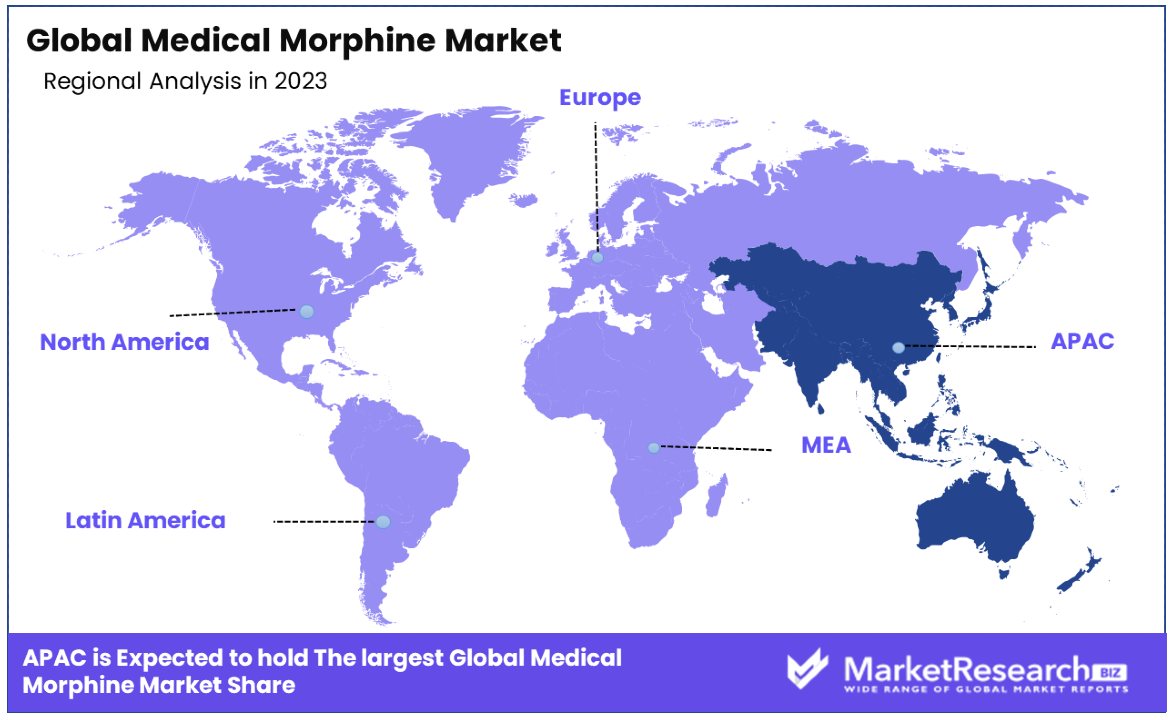
- APAC Dominance: The Asia Pacific region commands a significant 40% market share, indicating substantial demand and usage of medical morphine.
- North America Presence: North America holds approximately 30% of the market, showcasing its considerable market influence and consumption.
- Players: Key players in the Medical Morphine Market include Mallinckrodt Pharmaceuticals, Verve Health Care Ltd., Purdue Pharma L.P., and others, each contributing to the market's growth and innovation.
- Growth Opportunities: Exploring innovative routes of administration beyond parenteral and oral methods presents growth opportunities to improve bioavailability and patient compliance. With the rising acceptance and regulatory approval of online pharmacies, there's potential for growth in morphine distribution, especially through convenient online channels.
Driving Factors
Increasing Prevalence of Chronic Pain Drives Market Growth
The escalating prevalence of chronic pain is a primary driver of the Medical Morphine Market. Chronic diseases and pain affects approximately 20.9% of U.S. adults, equating to 51.6 million people, with 6.9% or 17.1 million experiencing debilitating high-impact chronic pain that limits daily activities.
Conditions such as cancer-related pain, neuropathic pain, and musculoskeletal disorders necessitate robust pain management solutions. Morphine, known for its potent analgesic properties, remains a staple in treating these severe pain conditions, thus propelling market growth. This increasing demand for effective pain relief directly correlates with rising chronic pain incidences, pushing healthcare providers to prioritize access to morphine as a critical therapeutic option.
Palliative Care and End-of-Life Care Boosts Market Expansion
Morphine's integral role in palliative care and end-of-life care significantly contributes to its market growth. As populations age, the incidence of terminal illnesses increases, heightening the need for compassionate and effective pain management.
Morphine helps improve the quality of life for patients suffering from severe, life-limiting conditions. This growing demand is fueled further by global demographic shifts towards older populations, which expands the patient base requiring palliative treatments, thereby boosting morphine consumption and market growth.
Surgical Procedures and Post-Operative Pain Management Fuel Market Demand
The extensive use of morphine for managing post-operative pain following various surgical procedures is a key growth factor for its market. With millions of surgeries performed annually, including orthopedic, cardiovascular, and abdominal surgeries, the need for effective post-operative pain management is crucial.
As surgical techniques evolve and the number of procedures grows, so does the demand for morphine to ensure patient comfort and aid in the recovery process. This trend underscores the dependency of the healthcare sector on reliable and effective analgesic solutions like morphine, driving continuous market growth.
Advancements in Delivery Systems Propel Market Innovation
Innovation in morphine delivery systems significantly drives market growth by enhancing the way pain management is administered. Developments such as transdermal patches, extended-release formulations, and patient-controlled analgesia (PCA) devices have revolutionized morphine administration.
These advancements not only improve patient compliance by providing more consistent pain relief but also minimize the potential for abuse and side effects. By enhancing the efficacy and safety of morphine use, these innovative delivery systems meet the growing patient and healthcare provider demands for more effective and manageable pain relief options, further stimulating market growth.
Restraining Factors
Stringent Regulatory Controls Restrains Market Growth
Stringent regulatory controls significantly restrain the growth of the Medical Morphine Market. As a controlled substance with a high potential for abuse and addiction, morphine is subject to rigorous regulatory frameworks. These regulations govern its manufacturing, distribution, and prescription, creating hurdles that are both time-consuming and resource-intensive for companies.
Navigating these complex regulations requires significant legal and compliance efforts, which can delay product launches and limit market access. Such regulatory barriers not only increase operational costs but also slow the responsiveness of companies to market demands, directly impacting the growth and scalability of morphine-related business operations.
Concerns Over Opioid Addiction and Abuse Limit Market Expansion
The opioid epidemic has heightened concerns over addiction and abuse, leading to increased scrutiny and tighter regulations on opioid medications, including morphine. This public health crisis has influenced prescribing behaviors, with healthcare professionals now more cautious and increasingly considering alternative pain management strategies.
The resulting shift can limit the use of morphine, as prescribers weigh the risks of addiction against the benefits of morphine's potent pain relief. These factors combine to form a significant barrier to the expansion of the Medical Morphine Market, as the demand for safer, non-opioid pain management solutions grows.
Route of Administration Analysis
Parenteral sub-segment dominates with 47.8% due to its effectiveness in rapid pain relief.
The Medical Morphine Market is segmented by the route of administration, which includes oral, parenteral, and other routes. Among these, the parenteral route is the most dominant, capturing 47.8% of the market share. This dominance is attributed to the immediate onset of pain relief that parenteral administration offers, which is crucial for severe pain conditions where quick action is necessary. In contrast, oral administration, while widely used for its convenience, typically has a slower onset of action and may not be suitable for acute pain scenarios or patients who are unable to swallow. Other routes of administration, such as intraspinal or rectal, play niche roles in specific clinical settings where traditional routes are not feasible.
Parenteral morphine is primarily used in hospitals and emergency care settings, where rapid pain control is essential. This method bypasses the digestive system, providing faster and more predictable pain relief. This is particularly important in emergency medical situations, such as in the treatment of post-operative pain or severe injury, where immediate pain management is critical. The preference for parenteral administration in these settings supports its substantial share of the market.
Despite the dominance of parenteral morphine, the oral and other routes continue to be important. Oral morphine remains a mainstay in managing chronic pain, where patients require long-term, steady pain control that parenteral routes cannot conveniently offer. Other innovative routes of administration are being explored to improve bioavailability and patient compliance, further driving the diversification and growth of the market beyond the parenteral segment.
By Application Analysis
Cancer sub-segment dominates with 42.8% due to the high prevalence of cancer-related pain.
Morphine's application in the management of pain related to various medical conditions segments the market, with cancer pain management being the most significant, accounting for 42.8% of its use. This prevalence is driven by the severity and persistence of pain experienced by cancer patients, which often requires the potent analgesic effect of morphine. The efficacy of morphine in controlling moderate to severe pain, which is common in cancer patients, particularly in terminal stages, underscores its critical role in oncology.
Other applications of morphine include arthritis, myocardial infarction, kidney stones, and diarrhea, each addressing different pain management needs. While these segments contribute to the market's diversity, none command as significant a share as cancer pain management. In arthritis, morphine is used less frequently due to the chronic nature of the disease and concerns over long-term opioid use. For acute conditions like myocardial infarction and kidney stones, morphine provides essential relief, supporting its secondary role in these segments.
The substantial share held by the cancer application reflects the ongoing need for effective palliative care in oncology, which remains a priority in healthcare. As cancer prevalence continues to rise globally, the demand for effective pain management solutions like morphine is expected to grow, ensuring the sustained dominance of this segment.
By Distribution Channel Analysis
Hospital Pharmacies sub-segment dominates with 40% due to the controlled and immediate distribution of morphine.
Distribution channels for morphine include hospital pharmacies, retail pharmacies, and online pharmacies, with hospital pharmacies leading at 40%. This dominance is due to the critical role hospital pharmacies play in the immediate dispensation of morphine for in-patient care, especially in acute and palliative care settings where morphine's use is most urgent. Hospital pharmacies' proximity to patient care areas facilitates the prompt administration of morphine, essential for rapid pain management.
Retail pharmacies serve the outpatient market, providing morphine for home use under strict prescription guidelines. This segment is essential for continued pain management after discharge from medical facilities. However, the stringent regulations governing opioid dispensation limit its growth compared to hospital pharmacies. Online pharmacies are emerging as a convenient alternative, offering potential growth in morphine distribution with increasing acceptance and regulatory approval of online drug sales.
Hospital pharmacies' dominance is reinforced by the necessity for controlled environments to administer and monitor morphine use, given its potent nature and potential for abuse. This need ensures their pivotal role in the morphine distribution network, maintaining their status as the largest distribution channel.
Key Market Segments
By Route of Administration
- Oral
- Parenteral
- Other Routes of Administration
By Application
- Arthritis
- Cancer
- Myocardial Infarction
- Kidney Stones
- Diarrhea
- Other Applications
By Distribution Channel
- Hospital Pharmacies
- Retail Pharmacies
- Online Pharmacies
Growth Opportunities
Development of Abuse-Deterrent Formulations Offers Growth Opportunity
The development of abuse-deterrent formulations represents a significant growth opportunity within the Medical Morphine Market. Pharmaceutical companies, such as Endo Pharmaceuticals with their Morphine Sulfate Extended-Release Tablets, are innovating to create products that are harder to misuse. These formulations incorporate physical and chemical barriers that prevent tampering, such as crushing or dissolving, thus reducing the risk of abuse.
This innovation addresses key regulatory and safety concerns, making these products more appealing to regulators and safer for patients. By mitigating the risks associated with opioid abuse, these formulations can help maintain morphine's status as a critical pain management tool while expanding its market reach. This strategic development not only enhances patient safety but also aligns with growing regulatory demands, potentially increasing market acceptance and driving growth.
Expansion into Emerging Markets Offers Growth Opportunity
The expansion into emerging markets such as Asia-Pacific and Latin America offers a compelling growth opportunity for the Medical Morphine Market. As these regions experience improvements in healthcare infrastructure and an increase in access to medical services, the demand for effective pain management solutions like morphine is set to rise.
Entering these markets provides pharmaceutical companies with access to new patient populations that have previously been underserved. By addressing the specific needs and regulatory environments of these regions, companies can tap into a significant new source of revenue. This strategic move not only diversifies the geographical footprint of these companies but also supports global health initiatives by improving the quality of pain management available in emerging markets, thereby driving overall market expansion.
Trending Factors
Personalized Pain Management Are Trending Factors
Personalized pain management is becoming a significant trend in the Medical Morphine Market as healthcare shifts towards individualized treatment approaches. This trend is driven by the recognition that pain perception and treatment response vary widely among individuals due to factors like genetic differences, comorbidities, and personal health history.
Pharmaceutical companies are now focusing on developing personalized morphine dosing regimens and specialized formulations. By tailoring morphine treatments to meet specific patient needs, companies can significantly improve treatment effectiveness and patient satisfaction. This not only enhances clinical outcomes but also positions these companies as innovators in a competitive market, making personalized pain management a key trend driving the future of pain therapy.
Combination Therapy Approaches Are Trending Factors
The trend towards combination therapy in pain management is gaining momentum. This approach integrates morphine with other pain relief strategies, including non-opioid analgesics, interventional therapies, and complementary treatments such as acupuncture or chiropractic care. The goal is to enhance pain relief while reducing the dependency on opioids, addressing the growing concerns over opioid abuse and side effects.
By developing combination products or forming partnerships with providers of alternative therapies, pharmaceutical companies can offer more comprehensive pain management solutions. This holistic approach not only meets the increasing demand for safer pain management options but also broadens the market reach of these companies, marking combination therapy as a trending factor with substantial impact on market dynamics.
Telemedicine and Remote Monitoring Are Trending Factors
The adoption of telemedicine and remote monitoring technologies is a trending factor reshaping the Medical Morphine Market. These technologies facilitate better access to pain management services, especially in remote or underserved areas, by allowing virtual consultations and remote prescription management.
For morphine, this means improved monitoring of patient compliance and treatment outcomes, which is crucial for a drug with high abuse potential. Pharmaceutical companies leveraging these technologies can optimize prescribing practices and enhance patient care. This trend not only improves healthcare delivery but also opens new avenues for market expansion, positioning companies that embrace telemedicine and remote monitoring at the forefront of innovation in pain management.
Regional Analysis
APAC Dominates with 40% Market Share
The Asia Pacific (APAC) region holds a dominant 40% share of the Medical Morphine Market, largely driven by its large population base and increasing healthcare infrastructure developments. This region has seen significant investments in hospital and clinical facilities, enhancing access to medical care and pain management solutions. Additionally, the rising prevalence of chronic diseases and conditions requiring pain management, such as cancer and post-surgical recovery, contributes to the high demand for morphine.
APAC's diverse regulatory landscape and economic growth also play crucial roles in shaping the morphine market. Countries like China and India, with their burgeoning middle classes and increasing healthcare spending, are pivotal in this dominance. Moreover, the region's growing elderly population, which is more susceptible to chronic conditions, further propels the demand for effective pain management options like morphine.
APAC's influence on the global Medical Morphine Market is expected to grow. Continued economic development, coupled with healthcare sector advancements and an aging population, suggest that the demand for morphine will continue to rise. Companies looking to capitalize on this growth will likely increase their investments in the region, potentially leading to localized production and tailored pain management solutions.
Regional Market Share and Dynamics:
North America:
North America holds approximately 30% of the Medical Morphine Market. The region's well-established healthcare infrastructure and the ongoing opioid crisis have led to stringent regulations, impacting morphine's use and prescription practices. However, efforts to provide controlled yet effective pain management support sustained demand.Europe:
Europe accounts for around 20% of the market share. The region's strong regulatory framework and healthcare policies ensure that morphine is used responsibly and effectively. Increasing elderly populations and high standards of palliative care are significant contributors to the market.Middle East & Africa:
This region captures about 5% of the market, hindered by variable access to healthcare and regulatory challenges. However, growing healthcare infrastructure and increasing awareness about pain management could boost market growth in the future.Latin America:
Latin America holds a smaller share of around 5%. While the region faces economic variability and healthcare access issues, improving healthcare systems and increasing chronic disease prevalence are expected to drive growth in morphine demand.Key Regions and Countries
- North America
- The US
- Canada
- Mexico
- Western Europe
- Germany
- France
- The UK
- Spain
- Italy
- Portugal
- Ireland
- Austria
- Switzerland
- Benelux
- Nordic
- Rest of Western Europe
- Eastern Europe
- Russia
- Poland
- The Czech Republic
- Greece
- Rest of Eastern Europe
- APAC
- China
- Japan
- South Korea
- India
- Australia & New Zealand
- Indonesia
- Malaysia
- Philippines
- Singapore
- Thailand
- Vietnam
- Rest of APAC
- Latin America
- Brazil
- Colombia
- Chile
- Argentina
- Costa Rica
- Rest of Latin America
- Middle East & Africa
- Algeria
- Egypt
- Israel
- Kuwait
- Nigeria
- Saudi Arabia
- South Africa
- Turkey
- United Arab Emirates
- Rest of MEA
Key Players Analysis
In the Medical Morphine Market, companies like Mallinckrodt Pharmaceuticals, Verve Health Care Ltd., Purdue Pharma L.P., Taj Pharmaceuticals Limited, Sun Pharmaceutical Industries Ltd, Teva Pharmaceutical Industries Ltd, Northeast Pharmaceutical Group Co., Ltd, Amphastar Pharmaceuticals, Mayne Pharma Group Limited, Manus Aktteva Biopharma LLP, Fresenius Kabi USA, Tris Pharma, Inc, Alcaliber S.A, Pfizer Inc., and AbbVie Inc. are instrumental in defining the market's trajectory and dynamics.
These companies hold significant market influence through their strategic positioning in the production and distribution of morphine, a critical pain management medication widely used in healthcare. Their roles are pivotal in addressing the growing demand for effective pain management solutions globally. Each company contributes to the market's development by adhering to stringent regulatory standards and engaging in research and development to enhance the efficacy and safety of morphine products.
The impact of these market players is also seen in their ability to navigate the competitive landscape, where they strive to maintain a balance between regulatory compliance and meeting the medical needs of a diverse patient population. Their market influence is further underscored by their commitment to ethical marketing and distribution practices, which is crucial in a market as sensitive as that of opioid medications.
In the forecast period, these companies are expected to continue their focus on innovation by exploring new delivery methods and formulations that can reduce potential dependency risks and improve patient outcomes. Their ongoing engagement with healthcare professionals and industry experts helps them align their product offerings with market needs and patient safety requirements.
Market Key Players
- Mallinckrodt Pharmaceuticals
- Verve Health Care Ltd.
- Purdue Pharma L.P.
- Taj Pharmaceuticals Limited
- Sun Pharmaceutical Industries Ltd
- Teva Pharmaceutical Industries Ltd
- Northeast Pharmaceutical Group Co., Ltd
- Amphastar Pharmaceuticals
- Mayne Pharma Group Limited
- Manus Aktteva Biopharma LLP
- Fresenius Kabi USA
- Tris Pharma, Inc
- Alcaliber S.A
- Pfizer Inc.
- AbbVie Inc.
Recent Developments
- On April 2024, a study found that morphine has the potential to be an effective cough therapy for pulmonary fibrosis, shedding light on new possibilities for treatment in this medical condition.
- On April 2024, an oral morphine substitute was approved in Australia, providing an alternative to the discontinued Ordine 10 oral liquid. This substitute, Morphini HCl Streuli oral drops, is now available on the PBS, offering a solution to the supply issues faced in the country.
- On July 2023, the World Health Organization highlighted the unequal distribution of morphine globally, with disparities in access to this vital pain medication, particularly affecting lower-income countries due to irregular supply, local policies, and stigma.
Report Scope
Report Features Description Market Value (2023) USD 24.6 Billion Forecast Revenue (2033) USD 49.8 Billion CAGR (2024-2033) 7.50% Base Year for Estimation 2023 Historic Period 2018-2023 Forecast Period 2024-2033 Report Coverage Revenue Forecast, Market Dynamics, Competitive Landscape, Recent Developments Segments Covered By Route of Administration (Oral, Parenteral, Other Routes of Administration), By Application (Arthritis, Cancer, Myocardial Infarction, Kidney Stones, Diarrhea, Other Applications), By Distribution Channel (Hospital Pharmacies, Retail Pharmacies, Online Pharmacies) Regional Analysis North America - The US, Canada, & Mexico; Western Europe - Germany, France, The UK, Spain, Italy, Portugal, Ireland, Austria, Switzerland, Benelux, Nordic, & Rest of Western Europe; Eastern Europe - Russia, Poland, The Czech Republic, Greece, & Rest of Eastern Europe; APAC - China, Japan, South Korea, India, Australia & New Zealand, Indonesia, Malaysia, Philippines, Singapore, Thailand, Vietnam, & Rest of APAC; Latin America - Brazil, Colombia, Chile, Argentina, Costa Rica, & Rest of Latin America; Middle East & Africa - Algeria, Egypt, Israel, Kuwait, Nigeria, Saudi Arabia, South Africa, Turkey, United Arab Emirates, & Rest of MEA Competitive Landscape Mallinckrodt Pharmaceuticals, Verve Health Care Ltd., Purdue Pharma L.P., Taj Pharmaceuticals Limited, Sun Pharmaceutical Industries Ltd, Teva Pharmaceutical Industries Ltd, Northeast Pharmaceutical Group Co., Ltd, Amphastar Pharmaceuticals, Mayne Pharma Group Limited, Manus Aktteva Biopharma LLP, Fresenius Kabi USA, Tris Pharma, Inc, Alcaliber S.A, Pfizer Inc., AbbVie Inc. Customization Scope Customization for segments, region/country-level will be provided. Moreover, additional customization can be done based on the requirements. Purchase Options We have three licenses to opt for: Single User License, Multi-User License (Up to 5 Users), Corporate Use License (Unlimited User and Printable PDF) -
- 1. Executive Summary
- 1.1. Definition
- 1.2. Taxonomy
- 1.3. Research Scope
- 1.4. Key Analysis
- 1.5. Key Findings by Major Segments
- 1.6. Top strategies by Major Players
- 2. Global Medical Morphine Market Overview
- 2.1. Medical Morphine Market Dynamics
- 2.1.1. Drivers
- 2.1.2. Opportunities
- 2.1.3. Restraints
- 2.1.4. Challenges
- 2.2. Macro-economic Factors
- 2.3. Regulatory Framework
- 2.4. Market Investment Feasibility Index
- 2.5. PEST Analysis
- 2.6. PORTER’S Five Force Analysis
- 2.7. Drivers & Restraints Impact Analysis
- 2.8. Industry Chain Analysis
- 2.9. Cost Structure Analysis
- 2.10. Marketing Strategy
- 2.11. Russia-Ukraine War Impact Analysis
- 2.12. Opportunity Map Analysis
- 2.13. Market Competition Scenario Analysis
- 2.14. Product Life Cycle Analysis
- 2.15. Opportunity Orbits
- 2.16. Manufacturer Intensity Map
- 2.17. Major Companies sales by Value & Volume
- 2.1. Medical Morphine Market Dynamics
- 3. Global Medical Morphine Market Analysis, Opportunity and Forecast, 2016-2032
- 3.1. Global Medical Morphine Market Analysis, 2016-2021
- 3.2. Global Medical Morphine Market Opportunity and Forecast, 2023-2032
- 3.3. Global Medical Morphine Market Analysis, Opportunity and Forecast, By Route of Administration, 2016-2032
- 3.3.1. Global Medical Morphine Market Analysis by Route of Administration: Introduction
- 3.3.2. Market Size Absolute $ Opportunity Analysis and Forecast, By Route of Administration, 2016-2032
- 3.3.3. Oral
- 3.3.4. Parenteral
- 3.3.5. Other Routes of Administration
- 3.4. Global Medical Morphine Market Analysis, Opportunity and Forecast, By Application, 2016-2032
- 3.4.1. Global Medical Morphine Market Analysis by Application: Introduction
- 3.4.2. Market Size Absolute $ Opportunity Analysis and Forecast, By Application, 2016-2032
- 3.4.3. Arthritis
- 3.4.4. Cancer
- 3.4.5. Myocardial Infarction
- 3.4.6. Kidney Stones
- 3.4.7. Diarrhea
- 3.4.8. Other Applications
- 3.5. Global Medical Morphine Market Analysis, Opportunity and Forecast, By Distribution Channel, 2016-2032
- 3.5.1. Global Medical Morphine Market Analysis by Distribution Channel: Introduction
- 3.5.2. Market Size Absolute $ Opportunity Analysis and Forecast, By Distribution Channel, 2016-2032
- 3.5.3. Hospital Pharmacies
- 3.5.4. Retail Pharmacies
- 3.5.5. Online Pharmacies
- 4. North America Medical Morphine Market Analysis, Opportunity and Forecast, 2016-2032
- 4.1. North America Medical Morphine Market Analysis, 2016-2021
- 4.2. North America Medical Morphine Market Opportunity and Forecast, 2023-2032
- 4.3. North America Medical Morphine Market Analysis, Opportunity and Forecast, By Route of Administration, 2016-2032
- 4.3.1. North America Medical Morphine Market Analysis by Route of Administration: Introduction
- 4.3.2. Market Size Absolute $ Opportunity Analysis and Forecast, By Route of Administration, 2016-2032
- 4.3.3. Oral
- 4.3.4. Parenteral
- 4.3.5. Other Routes of Administration
- 4.4. North America Medical Morphine Market Analysis, Opportunity and Forecast, By Application, 2016-2032
- 4.4.1. North America Medical Morphine Market Analysis by Application: Introduction
- 4.4.2. Market Size Absolute $ Opportunity Analysis and Forecast, By Application, 2016-2032
- 4.4.3. Arthritis
- 4.4.4. Cancer
- 4.4.5. Myocardial Infarction
- 4.4.6. Kidney Stones
- 4.4.7. Diarrhea
- 4.4.8. Other Applications
- 4.5. North America Medical Morphine Market Analysis, Opportunity and Forecast, By Distribution Channel, 2016-2032
- 4.5.1. North America Medical Morphine Market Analysis by Distribution Channel: Introduction
- 4.5.2. Market Size Absolute $ Opportunity Analysis and Forecast, By Distribution Channel, 2016-2032
- 4.5.3. Hospital Pharmacies
- 4.5.4. Retail Pharmacies
- 4.5.5. Online Pharmacies
- 4.6. North America Medical Morphine Market Analysis, Opportunity and Forecast, By Country , 2016-2032
- 4.6.1. North America Medical Morphine Market Analysis by Country : Introduction
- 4.6.2. Market Size Absolute $ Opportunity Analysis and Forecast, Country , 2016-2032
- 4.6.2.1. The US
- 4.6.2.2. Canada
- 4.6.2.3. Mexico
- 5. Western Europe Medical Morphine Market Analysis, Opportunity and Forecast, 2016-2032
- 5.1. Western Europe Medical Morphine Market Analysis, 2016-2021
- 5.2. Western Europe Medical Morphine Market Opportunity and Forecast, 2023-2032
- 5.3. Western Europe Medical Morphine Market Analysis, Opportunity and Forecast, By Route of Administration, 2016-2032
- 5.3.1. Western Europe Medical Morphine Market Analysis by Route of Administration: Introduction
- 5.3.2. Market Size Absolute $ Opportunity Analysis and Forecast, By Route of Administration, 2016-2032
- 5.3.3. Oral
- 5.3.4. Parenteral
- 5.3.5. Other Routes of Administration
- 5.4. Western Europe Medical Morphine Market Analysis, Opportunity and Forecast, By Application, 2016-2032
- 5.4.1. Western Europe Medical Morphine Market Analysis by Application: Introduction
- 5.4.2. Market Size Absolute $ Opportunity Analysis and Forecast, By Application, 2016-2032
- 5.4.3. Arthritis
- 5.4.4. Cancer
- 5.4.5. Myocardial Infarction
- 5.4.6. Kidney Stones
- 5.4.7. Diarrhea
- 5.4.8. Other Applications
- 5.5. Western Europe Medical Morphine Market Analysis, Opportunity and Forecast, By Distribution Channel, 2016-2032
- 5.5.1. Western Europe Medical Morphine Market Analysis by Distribution Channel: Introduction
- 5.5.2. Market Size Absolute $ Opportunity Analysis and Forecast, By Distribution Channel, 2016-2032
- 5.5.3. Hospital Pharmacies
- 5.5.4. Retail Pharmacies
- 5.5.5. Online Pharmacies
- 5.6. Western Europe Medical Morphine Market Analysis, Opportunity and Forecast, By Country , 2016-2032
- 5.6.1. Western Europe Medical Morphine Market Analysis by Country : Introduction
- 5.6.2. Market Size Absolute $ Opportunity Analysis and Forecast, Country , 2016-2032
- 5.6.2.1. Germany
- 5.6.2.2. France
- 5.6.2.3. The UK
- 5.6.2.4. Spain
- 5.6.2.5. Italy
- 5.6.2.6. Portugal
- 5.6.2.7. Ireland
- 5.6.2.8. Austria
- 5.6.2.9. Switzerland
- 5.6.2.10. Benelux
- 5.6.2.11. Nordic
- 5.6.2.12. Rest of Western Europe
- 6. Eastern Europe Medical Morphine Market Analysis, Opportunity and Forecast, 2016-2032
- 6.1. Eastern Europe Medical Morphine Market Analysis, 2016-2021
- 6.2. Eastern Europe Medical Morphine Market Opportunity and Forecast, 2023-2032
- 6.3. Eastern Europe Medical Morphine Market Analysis, Opportunity and Forecast, By Route of Administration, 2016-2032
- 6.3.1. Eastern Europe Medical Morphine Market Analysis by Route of Administration: Introduction
- 6.3.2. Market Size Absolute $ Opportunity Analysis and Forecast, By Route of Administration, 2016-2032
- 6.3.3. Oral
- 6.3.4. Parenteral
- 6.3.5. Other Routes of Administration
- 6.4. Eastern Europe Medical Morphine Market Analysis, Opportunity and Forecast, By Application, 2016-2032
- 6.4.1. Eastern Europe Medical Morphine Market Analysis by Application: Introduction
- 6.4.2. Market Size Absolute $ Opportunity Analysis and Forecast, By Application, 2016-2032
- 6.4.3. Arthritis
- 6.4.4. Cancer
- 6.4.5. Myocardial Infarction
- 6.4.6. Kidney Stones
- 6.4.7. Diarrhea
- 6.4.8. Other Applications
- 6.5. Eastern Europe Medical Morphine Market Analysis, Opportunity and Forecast, By Distribution Channel, 2016-2032
- 6.5.1. Eastern Europe Medical Morphine Market Analysis by Distribution Channel: Introduction
- 6.5.2. Market Size Absolute $ Opportunity Analysis and Forecast, By Distribution Channel, 2016-2032
- 6.5.3. Hospital Pharmacies
- 6.5.4. Retail Pharmacies
- 6.5.5. Online Pharmacies
- 6.6. Eastern Europe Medical Morphine Market Analysis, Opportunity and Forecast, By Country , 2016-2032
- 6.6.1. Eastern Europe Medical Morphine Market Analysis by Country : Introduction
- 6.6.2. Market Size Absolute $ Opportunity Analysis and Forecast, Country , 2016-2032
- 6.6.2.1. Russia
- 6.6.2.2. Poland
- 6.6.2.3. The Czech Republic
- 6.6.2.4. Greece
- 6.6.2.5. Rest of Eastern Europe
- 7. APAC Medical Morphine Market Analysis, Opportunity and Forecast, 2016-2032
- 7.1. APAC Medical Morphine Market Analysis, 2016-2021
- 7.2. APAC Medical Morphine Market Opportunity and Forecast, 2023-2032
- 7.3. APAC Medical Morphine Market Analysis, Opportunity and Forecast, By Route of Administration, 2016-2032
- 7.3.1. APAC Medical Morphine Market Analysis by Route of Administration: Introduction
- 7.3.2. Market Size Absolute $ Opportunity Analysis and Forecast, By Route of Administration, 2016-2032
- 7.3.3. Oral
- 7.3.4. Parenteral
- 7.3.5. Other Routes of Administration
- 7.4. APAC Medical Morphine Market Analysis, Opportunity and Forecast, By Application, 2016-2032
- 7.4.1. APAC Medical Morphine Market Analysis by Application: Introduction
- 7.4.2. Market Size Absolute $ Opportunity Analysis and Forecast, By Application, 2016-2032
- 7.4.3. Arthritis
- 7.4.4. Cancer
- 7.4.5. Myocardial Infarction
- 7.4.6. Kidney Stones
- 7.4.7. Diarrhea
- 7.4.8. Other Applications
- 7.5. APAC Medical Morphine Market Analysis, Opportunity and Forecast, By Distribution Channel, 2016-2032
- 7.5.1. APAC Medical Morphine Market Analysis by Distribution Channel: Introduction
- 7.5.2. Market Size Absolute $ Opportunity Analysis and Forecast, By Distribution Channel, 2016-2032
- 7.5.3. Hospital Pharmacies
- 7.5.4. Retail Pharmacies
- 7.5.5. Online Pharmacies
- 7.6. APAC Medical Morphine Market Analysis, Opportunity and Forecast, By Country , 2016-2032
- 7.6.1. APAC Medical Morphine Market Analysis by Country : Introduction
- 7.6.2. Market Size Absolute $ Opportunity Analysis and Forecast, Country , 2016-2032
- 7.6.2.1. China
- 7.6.2.2. Japan
- 7.6.2.3. South Korea
- 7.6.2.4. India
- 7.6.2.5. Australia & New Zeland
- 7.6.2.6. Indonesia
- 7.6.2.7. Malaysia
- 7.6.2.8. Philippines
- 7.6.2.9. Singapore
- 7.6.2.10. Thailand
- 7.6.2.11. Vietnam
- 7.6.2.12. Rest of APAC
- 8. Latin America Medical Morphine Market Analysis, Opportunity and Forecast, 2016-2032
- 8.1. Latin America Medical Morphine Market Analysis, 2016-2021
- 8.2. Latin America Medical Morphine Market Opportunity and Forecast, 2023-2032
- 8.3. Latin America Medical Morphine Market Analysis, Opportunity and Forecast, By Route of Administration, 2016-2032
- 8.3.1. Latin America Medical Morphine Market Analysis by Route of Administration: Introduction
- 8.3.2. Market Size Absolute $ Opportunity Analysis and Forecast, By Route of Administration, 2016-2032
- 8.3.3. Oral
- 8.3.4. Parenteral
- 8.3.5. Other Routes of Administration
- 8.4. Latin America Medical Morphine Market Analysis, Opportunity and Forecast, By Application, 2016-2032
- 8.4.1. Latin America Medical Morphine Market Analysis by Application: Introduction
- 8.4.2. Market Size Absolute $ Opportunity Analysis and Forecast, By Application, 2016-2032
- 8.4.3. Arthritis
- 8.4.4. Cancer
- 8.4.5. Myocardial Infarction
- 8.4.6. Kidney Stones
- 8.4.7. Diarrhea
- 8.4.8. Other Applications
- 8.5. Latin America Medical Morphine Market Analysis, Opportunity and Forecast, By Distribution Channel, 2016-2032
- 8.5.1. Latin America Medical Morphine Market Analysis by Distribution Channel: Introduction
- 8.5.2. Market Size Absolute $ Opportunity Analysis and Forecast, By Distribution Channel, 2016-2032
- 8.5.3. Hospital Pharmacies
- 8.5.4. Retail Pharmacies
- 8.5.5. Online Pharmacies
- 8.6. Latin America Medical Morphine Market Analysis, Opportunity and Forecast, By Country , 2016-2032
- 8.6.1. Latin America Medical Morphine Market Analysis by Country : Introduction
- 8.6.2. Market Size Absolute $ Opportunity Analysis and Forecast, Country , 2016-2032
- 8.6.2.1. Brazil
- 8.6.2.2. Colombia
- 8.6.2.3. Chile
- 8.6.2.4. Argentina
- 8.6.2.5. Costa Rica
- 8.6.2.6. Rest of Latin America
- 9. Middle East & Africa Medical Morphine Market Analysis, Opportunity and Forecast, 2016-2032
- 9.1. Middle East & Africa Medical Morphine Market Analysis, 2016-2021
- 9.2. Middle East & Africa Medical Morphine Market Opportunity and Forecast, 2023-2032
- 9.3. Middle East & Africa Medical Morphine Market Analysis, Opportunity and Forecast, By Route of Administration, 2016-2032
- 9.3.1. Middle East & Africa Medical Morphine Market Analysis by Route of Administration: Introduction
- 9.3.2. Market Size Absolute $ Opportunity Analysis and Forecast, By Route of Administration, 2016-2032
- 9.3.3. Oral
- 9.3.4. Parenteral
- 9.3.5. Other Routes of Administration
- 9.4. Middle East & Africa Medical Morphine Market Analysis, Opportunity and Forecast, By Application, 2016-2032
- 9.4.1. Middle East & Africa Medical Morphine Market Analysis by Application: Introduction
- 9.4.2. Market Size Absolute $ Opportunity Analysis and Forecast, By Application, 2016-2032
- 9.4.3. Arthritis
- 9.4.4. Cancer
- 9.4.5. Myocardial Infarction
- 9.4.6. Kidney Stones
- 9.4.7. Diarrhea
- 9.4.8. Other Applications
- 9.5. Middle East & Africa Medical Morphine Market Analysis, Opportunity and Forecast, By Distribution Channel, 2016-2032
- 9.5.1. Middle East & Africa Medical Morphine Market Analysis by Distribution Channel: Introduction
- 9.5.2. Market Size Absolute $ Opportunity Analysis and Forecast, By Distribution Channel, 2016-2032
- 9.5.3. Hospital Pharmacies
- 9.5.4. Retail Pharmacies
- 9.5.5. Online Pharmacies
- 9.6. Middle East & Africa Medical Morphine Market Analysis, Opportunity and Forecast, By Country , 2016-2032
- 9.6.1. Middle East & Africa Medical Morphine Market Analysis by Country : Introduction
- 9.6.2. Market Size Absolute $ Opportunity Analysis and Forecast, Country , 2016-2032
- 9.6.2.1. Algeria
- 9.6.2.2. Egypt
- 9.6.2.3. Israel
- 9.6.2.4. Kuwait
- 9.6.2.5. Nigeria
- 9.6.2.6. Saudi Arabia
- 9.6.2.7. South Africa
- 9.6.2.8. Turkey
- 9.6.2.9. The UAE
- 9.6.2.10. Rest of MEA
- 10. Global Medical Morphine Market Analysis, Opportunity and Forecast, By Region , 2016-2032
- 10.1. Global Medical Morphine Market Analysis by Region : Introduction
- 10.2. Market Size Absolute $ Opportunity Analysis and Forecast, By Region , 2016-2032
- 10.2.1. North America
- 10.2.2. Western Europe
- 10.2.3. Eastern Europe
- 10.2.4. APAC
- 10.2.5. Latin America
- 10.2.6. Middle East & Africa
- 11. Global Medical Morphine Market Competitive Landscape, Market Share Analysis, and Company Profiles
- 11.1. Market Share Analysis
- 11.2. Company Profiles
- 11.3. Mallinckrodt Pharmaceuticals
- 11.3.1. Company Overview
- 11.3.2. Financial Highlights
- 11.3.3. Product Portfolio
- 11.3.4. SWOT Analysis
- 11.3.5. Key Strategies and Developments
- 11.4. Verve Health Care Ltd.
- 11.4.1. Company Overview
- 11.4.2. Financial Highlights
- 11.4.3. Product Portfolio
- 11.4.4. SWOT Analysis
- 11.4.5. Key Strategies and Developments
- 11.5. Purdue Pharma L.P.
- 11.5.1. Company Overview
- 11.5.2. Financial Highlights
- 11.5.3. Product Portfolio
- 11.5.4. SWOT Analysis
- 11.5.5. Key Strategies and Developments
- 11.6. Taj Pharmaceuticals Limited
- 11.6.1. Company Overview
- 11.6.2. Financial Highlights
- 11.6.3. Product Portfolio
- 11.6.4. SWOT Analysis
- 11.6.5. Key Strategies and Developments
- 11.7. Sun Pharmaceutical Industries Ltd
- 11.7.1. Company Overview
- 11.7.2. Financial Highlights
- 11.7.3. Product Portfolio
- 11.7.4. SWOT Analysis
- 11.7.5. Key Strategies and Developments
- 11.8. Teva Pharmaceutical Industries Ltd
- 11.8.1. Company Overview
- 11.8.2. Financial Highlights
- 11.8.3. Product Portfolio
- 11.8.4. SWOT Analysis
- 11.8.5. Key Strategies and Developments
- 11.9. Northeast Pharmaceutical Group Co., Ltd
- 11.9.1. Company Overview
- 11.9.2. Financial Highlights
- 11.9.3. Product Portfolio
- 11.9.4. SWOT Analysis
- 11.9.5. Key Strategies and Developments
- 11.10. Amphastar Pharmaceuticals
- 11.10.1. Company Overview
- 11.10.2. Financial Highlights
- 11.10.3. Product Portfolio
- 11.10.4. SWOT Analysis
- 11.10.5. Key Strategies and Developments
- 11.11. Mayne Pharma Group Limited
- 11.11.1. Company Overview
- 11.11.2. Financial Highlights
- 11.11.3. Product Portfolio
- 11.11.4. SWOT Analysis
- 11.11.5. Key Strategies and Developments
- 11.12. Manus Aktteva Biopharma LLP
- 11.12.1. Company Overview
- 11.12.2. Financial Highlights
- 11.12.3. Product Portfolio
- 11.12.4. SWOT Analysis
- 11.12.5. Key Strategies and Developments
- 11.13.1. Company Overview
- 11.13.2. Financial Highlights
- 11.13.3. Product Portfolio
- 11.13.4. SWOT Analysis
- 11.13.5. Key Strategies and Developments
- 11.14. Fresenius Kabi USA
- 11.14.1. Company Overview
- 11.14.2. Financial Highlights
- 11.14.3. Product Portfolio
- 11.14.4. SWOT Analysis
- 11.14.5. Key Strategies and Developments
- 11.15. Alcaliber S.A
- 11.15.1. Company Overview
- 11.15.2. Financial Highlights
- 11.15.3. Product Portfolio
- 11.15.4. SWOT Analysis
- 11.15.5. Key Strategies and Developments
- 11.16. Pfizer Inc.
- 11.16.1. Company Overview
- 11.16.2. Financial Highlights
- 11.16.3. Product Portfolio
- 11.16.4. SWOT Analysis
- 11.16.5. Key Strategies and Developments
- 11.17. AbbVie Inc.
- 11.17.1. Company Overview
- 11.17.2. Financial Highlights
- 11.17.3. Product Portfolio
- 11.17.4. SWOT Analysis
- 11.17.5. Key Strategies and Developments
- 12. Assumptions and Acronyms
- 13. Research Methodology
- 14. Contact
- List of Figures
- Figure 1: Global Medical Morphine Market Revenue (US$ Mn) Market Share by Route of Administration in 2022
- Figure 2: Global Medical Morphine Market Attractiveness Analysis by Route of Administration, 2016-2032
- Figure 3: Global Medical Morphine Market Revenue (US$ Mn) Market Share by Applicationin 2022
- Figure 4: Global Medical Morphine Market Attractiveness Analysis by Application, 2016-2032
- Figure 5: Global Medical Morphine Market Revenue (US$ Mn) Market Share by Distribution Channelin 2022
- Figure 6: Global Medical Morphine Market Attractiveness Analysis by Distribution Channel, 2016-2032
- Figure 7: Global Medical Morphine Market Revenue (US$ Mn) Market Share by Region in 2022
- Figure 8: Global Medical Morphine Market Attractiveness Analysis by Region, 2016-2032
- Figure 9: Global Medical Morphine Market Revenue (US$ Mn) (2016-2032)
- Figure 10: Global Medical Morphine Market Revenue (US$ Mn) Comparison by Region (2016-2032)
- Figure 11: Global Medical Morphine Market Revenue (US$ Mn) Comparison by Route of Administration (2016-2032)
- Figure 12: Global Medical Morphine Market Revenue (US$ Mn) Comparison by Application (2016-2032)
- Figure 13: Global Medical Morphine Market Revenue (US$ Mn) Comparison by Distribution Channel (2016-2032)
- Figure 14: Global Medical Morphine Market Y-o-Y Growth Rate Comparison by Region (2016-2032)
- Figure 15: Global Medical Morphine Market Y-o-Y Growth Rate Comparison by Route of Administration (2016-2032)
- Figure 16: Global Medical Morphine Market Y-o-Y Growth Rate Comparison by Application (2016-2032)
- Figure 17: Global Medical Morphine Market Y-o-Y Growth Rate Comparison by Distribution Channel (2016-2032)
- Figure 18: Global Medical Morphine Market Share Comparison by Region (2016-2032)
- Figure 19: Global Medical Morphine Market Share Comparison by Route of Administration (2016-2032)
- Figure 20: Global Medical Morphine Market Share Comparison by Application (2016-2032)
- Figure 21: Global Medical Morphine Market Share Comparison by Distribution Channel (2016-2032)
- Figure 22: North America Medical Morphine Market Revenue (US$ Mn) Market Share by Route of Administrationin 2022
- Figure 23: North America Medical Morphine Market Attractiveness Analysis by Route of Administration, 2016-2032
- Figure 24: North America Medical Morphine Market Revenue (US$ Mn) Market Share by Applicationin 2022
- Figure 25: North America Medical Morphine Market Attractiveness Analysis by Application, 2016-2032
- Figure 26: North America Medical Morphine Market Revenue (US$ Mn) Market Share by Distribution Channelin 2022
- Figure 27: North America Medical Morphine Market Attractiveness Analysis by Distribution Channel, 2016-2032
- Figure 28: North America Medical Morphine Market Revenue (US$ Mn) Market Share by Country in 2022
- Figure 29: North America Medical Morphine Market Attractiveness Analysis by Country, 2016-2032
- Figure 30: North America Medical Morphine Market Revenue (US$ Mn) (2016-2032)
- Figure 31: North America Medical Morphine Market Revenue (US$ Mn) Comparison by Country (2016-2032)
- Figure 32: North America Medical Morphine Market Revenue (US$ Mn) Comparison by Route of Administration (2016-2032)
- Figure 33: North America Medical Morphine Market Revenue (US$ Mn) Comparison by Application (2016-2032)
- Figure 34: North America Medical Morphine Market Revenue (US$ Mn) Comparison by Distribution Channel (2016-2032)
- Figure 35: North America Medical Morphine Market Y-o-Y Growth Rate Comparison by Country (2016-2032)
- Figure 36: North America Medical Morphine Market Y-o-Y Growth Rate Comparison by Route of Administration (2016-2032)
- Figure 37: North America Medical Morphine Market Y-o-Y Growth Rate Comparison by Application (2016-2032)
- Figure 38: North America Medical Morphine Market Y-o-Y Growth Rate Comparison by Distribution Channel (2016-2032)
- Figure 39: North America Medical Morphine Market Share Comparison by Country (2016-2032)
- Figure 40: North America Medical Morphine Market Share Comparison by Route of Administration (2016-2032)
- Figure 41: North America Medical Morphine Market Share Comparison by Application (2016-2032)
- Figure 42: North America Medical Morphine Market Share Comparison by Distribution Channel (2016-2032)
- Figure 43: Western Europe Medical Morphine Market Revenue (US$ Mn) Market Share by Route of Administrationin 2022
- Figure 44: Western Europe Medical Morphine Market Attractiveness Analysis by Route of Administration, 2016-2032
- Figure 45: Western Europe Medical Morphine Market Revenue (US$ Mn) Market Share by Applicationin 2022
- Figure 46: Western Europe Medical Morphine Market Attractiveness Analysis by Application, 2016-2032
- Figure 47: Western Europe Medical Morphine Market Revenue (US$ Mn) Market Share by Distribution Channelin 2022
- Figure 48: Western Europe Medical Morphine Market Attractiveness Analysis by Distribution Channel, 2016-2032
- Figure 49: Western Europe Medical Morphine Market Revenue (US$ Mn) Market Share by Country in 2022
- Figure 50: Western Europe Medical Morphine Market Attractiveness Analysis by Country, 2016-2032
- Figure 51: Western Europe Medical Morphine Market Revenue (US$ Mn) (2016-2032)
- Figure 52: Western Europe Medical Morphine Market Revenue (US$ Mn) Comparison by Country (2016-2032)
- Figure 53: Western Europe Medical Morphine Market Revenue (US$ Mn) Comparison by Route of Administration (2016-2032)
- Figure 54: Western Europe Medical Morphine Market Revenue (US$ Mn) Comparison by Application (2016-2032)
- Figure 55: Western Europe Medical Morphine Market Revenue (US$ Mn) Comparison by Distribution Channel (2016-2032)
- Figure 56: Western Europe Medical Morphine Market Y-o-Y Growth Rate Comparison by Country (2016-2032)
- Figure 57: Western Europe Medical Morphine Market Y-o-Y Growth Rate Comparison by Route of Administration (2016-2032)
- Figure 58: Western Europe Medical Morphine Market Y-o-Y Growth Rate Comparison by Application (2016-2032)
- Figure 59: Western Europe Medical Morphine Market Y-o-Y Growth Rate Comparison by Distribution Channel (2016-2032)
- Figure 60: Western Europe Medical Morphine Market Share Comparison by Country (2016-2032)
- Figure 61: Western Europe Medical Morphine Market Share Comparison by Route of Administration (2016-2032)
- Figure 62: Western Europe Medical Morphine Market Share Comparison by Application (2016-2032)
- Figure 63: Western Europe Medical Morphine Market Share Comparison by Distribution Channel (2016-2032)
- Figure 64: Eastern Europe Medical Morphine Market Revenue (US$ Mn) Market Share by Route of Administrationin 2022
- Figure 65: Eastern Europe Medical Morphine Market Attractiveness Analysis by Route of Administration, 2016-2032
- Figure 66: Eastern Europe Medical Morphine Market Revenue (US$ Mn) Market Share by Applicationin 2022
- Figure 67: Eastern Europe Medical Morphine Market Attractiveness Analysis by Application, 2016-2032
- Figure 68: Eastern Europe Medical Morphine Market Revenue (US$ Mn) Market Share by Distribution Channelin 2022
- Figure 69: Eastern Europe Medical Morphine Market Attractiveness Analysis by Distribution Channel, 2016-2032
- Figure 70: Eastern Europe Medical Morphine Market Revenue (US$ Mn) Market Share by Country in 2022
- Figure 71: Eastern Europe Medical Morphine Market Attractiveness Analysis by Country, 2016-2032
- Figure 72: Eastern Europe Medical Morphine Market Revenue (US$ Mn) (2016-2032)
- Figure 73: Eastern Europe Medical Morphine Market Revenue (US$ Mn) Comparison by Country (2016-2032)
- Figure 74: Eastern Europe Medical Morphine Market Revenue (US$ Mn) Comparison by Route of Administration (2016-2032)
- Figure 75: Eastern Europe Medical Morphine Market Revenue (US$ Mn) Comparison by Application (2016-2032)
- Figure 76: Eastern Europe Medical Morphine Market Revenue (US$ Mn) Comparison by Distribution Channel (2016-2032)
- Figure 77: Eastern Europe Medical Morphine Market Y-o-Y Growth Rate Comparison by Country (2016-2032)
- Figure 78: Eastern Europe Medical Morphine Market Y-o-Y Growth Rate Comparison by Route of Administration (2016-2032)
- Figure 79: Eastern Europe Medical Morphine Market Y-o-Y Growth Rate Comparison by Application (2016-2032)
- Figure 80: Eastern Europe Medical Morphine Market Y-o-Y Growth Rate Comparison by Distribution Channel (2016-2032)
- Figure 81: Eastern Europe Medical Morphine Market Share Comparison by Country (2016-2032)
- Figure 82: Eastern Europe Medical Morphine Market Share Comparison by Route of Administration (2016-2032)
- Figure 83: Eastern Europe Medical Morphine Market Share Comparison by Application (2016-2032)
- Figure 84: Eastern Europe Medical Morphine Market Share Comparison by Distribution Channel (2016-2032)
- Figure 85: APAC Medical Morphine Market Revenue (US$ Mn) Market Share by Route of Administrationin 2022
- Figure 86: APAC Medical Morphine Market Attractiveness Analysis by Route of Administration, 2016-2032
- Figure 87: APAC Medical Morphine Market Revenue (US$ Mn) Market Share by Applicationin 2022
- Figure 88: APAC Medical Morphine Market Attractiveness Analysis by Application, 2016-2032
- Figure 89: APAC Medical Morphine Market Revenue (US$ Mn) Market Share by Distribution Channelin 2022
- Figure 90: APAC Medical Morphine Market Attractiveness Analysis by Distribution Channel, 2016-2032
- Figure 91: APAC Medical Morphine Market Revenue (US$ Mn) Market Share by Country in 2022
- Figure 92: APAC Medical Morphine Market Attractiveness Analysis by Country, 2016-2032
- Figure 93: APAC Medical Morphine Market Revenue (US$ Mn) (2016-2032)
- Figure 94: APAC Medical Morphine Market Revenue (US$ Mn) Comparison by Country (2016-2032)
- Figure 95: APAC Medical Morphine Market Revenue (US$ Mn) Comparison by Route of Administration (2016-2032)
- Figure 96: APAC Medical Morphine Market Revenue (US$ Mn) Comparison by Application (2016-2032)
- Figure 97: APAC Medical Morphine Market Revenue (US$ Mn) Comparison by Distribution Channel (2016-2032)
- Figure 98: APAC Medical Morphine Market Y-o-Y Growth Rate Comparison by Country (2016-2032)
- Figure 99: APAC Medical Morphine Market Y-o-Y Growth Rate Comparison by Route of Administration (2016-2032)
- Figure 100: APAC Medical Morphine Market Y-o-Y Growth Rate Comparison by Application (2016-2032)
- Figure 101: APAC Medical Morphine Market Y-o-Y Growth Rate Comparison by Distribution Channel (2016-2032)
- Figure 102: APAC Medical Morphine Market Share Comparison by Country (2016-2032)
- Figure 103: APAC Medical Morphine Market Share Comparison by Route of Administration (2016-2032)
- Figure 104: APAC Medical Morphine Market Share Comparison by Application (2016-2032)
- Figure 105: APAC Medical Morphine Market Share Comparison by Distribution Channel (2016-2032)
- Figure 106: Latin America Medical Morphine Market Revenue (US$ Mn) Market Share by Route of Administrationin 2022
- Figure 107: Latin America Medical Morphine Market Attractiveness Analysis by Route of Administration, 2016-2032
- Figure 108: Latin America Medical Morphine Market Revenue (US$ Mn) Market Share by Applicationin 2022
- Figure 109: Latin America Medical Morphine Market Attractiveness Analysis by Application, 2016-2032
- Figure 110: Latin America Medical Morphine Market Revenue (US$ Mn) Market Share by Distribution Channelin 2022
- Figure 111: Latin America Medical Morphine Market Attractiveness Analysis by Distribution Channel, 2016-2032
- Figure 112: Latin America Medical Morphine Market Revenue (US$ Mn) Market Share by Country in 2022
- Figure 113: Latin America Medical Morphine Market Attractiveness Analysis by Country, 2016-2032
- Figure 114: Latin America Medical Morphine Market Revenue (US$ Mn) (2016-2032)
- Figure 115: Latin America Medical Morphine Market Revenue (US$ Mn) Comparison by Country (2016-2032)
- Figure 116: Latin America Medical Morphine Market Revenue (US$ Mn) Comparison by Route of Administration (2016-2032)
- Figure 117: Latin America Medical Morphine Market Revenue (US$ Mn) Comparison by Application (2016-2032)
- Figure 118: Latin America Medical Morphine Market Revenue (US$ Mn) Comparison by Distribution Channel (2016-2032)
- Figure 119: Latin America Medical Morphine Market Y-o-Y Growth Rate Comparison by Country (2016-2032)
- Figure 120: Latin America Medical Morphine Market Y-o-Y Growth Rate Comparison by Route of Administration (2016-2032)
- Figure 121: Latin America Medical Morphine Market Y-o-Y Growth Rate Comparison by Application (2016-2032)
- Figure 122: Latin America Medical Morphine Market Y-o-Y Growth Rate Comparison by Distribution Channel (2016-2032)
- Figure 123: Latin America Medical Morphine Market Share Comparison by Country (2016-2032)
- Figure 124: Latin America Medical Morphine Market Share Comparison by Route of Administration (2016-2032)
- Figure 125: Latin America Medical Morphine Market Share Comparison by Application (2016-2032)
- Figure 126: Latin America Medical Morphine Market Share Comparison by Distribution Channel (2016-2032)
- Figure 127: Middle East & Africa Medical Morphine Market Revenue (US$ Mn) Market Share by Route of Administrationin 2022
- Figure 128: Middle East & Africa Medical Morphine Market Attractiveness Analysis by Route of Administration, 2016-2032
- Figure 129: Middle East & Africa Medical Morphine Market Revenue (US$ Mn) Market Share by Applicationin 2022
- Figure 130: Middle East & Africa Medical Morphine Market Attractiveness Analysis by Application, 2016-2032
- Figure 131: Middle East & Africa Medical Morphine Market Revenue (US$ Mn) Market Share by Distribution Channelin 2022
- Figure 132: Middle East & Africa Medical Morphine Market Attractiveness Analysis by Distribution Channel, 2016-2032
- Figure 133: Middle East & Africa Medical Morphine Market Revenue (US$ Mn) Market Share by Country in 2022
- Figure 134: Middle East & Africa Medical Morphine Market Attractiveness Analysis by Country, 2016-2032
- Figure 135: Middle East & Africa Medical Morphine Market Revenue (US$ Mn) (2016-2032)
- Figure 136: Middle East & Africa Medical Morphine Market Revenue (US$ Mn) Comparison by Country (2016-2032)
- Figure 137: Middle East & Africa Medical Morphine Market Revenue (US$ Mn) Comparison by Route of Administration (2016-2032)
- Figure 138: Middle East & Africa Medical Morphine Market Revenue (US$ Mn) Comparison by Application (2016-2032)
- Figure 139: Middle East & Africa Medical Morphine Market Revenue (US$ Mn) Comparison by Distribution Channel (2016-2032)
- Figure 140: Middle East & Africa Medical Morphine Market Y-o-Y Growth Rate Comparison by Country (2016-2032)
- Figure 141: Middle East & Africa Medical Morphine Market Y-o-Y Growth Rate Comparison by Route of Administration (2016-2032)
- Figure 142: Middle East & Africa Medical Morphine Market Y-o-Y Growth Rate Comparison by Application (2016-2032)
- Figure 143: Middle East & Africa Medical Morphine Market Y-o-Y Growth Rate Comparison by Distribution Channel (2016-2032)
- Figure 144: Middle East & Africa Medical Morphine Market Share Comparison by Country (2016-2032)
- Figure 145: Middle East & Africa Medical Morphine Market Share Comparison by Route of Administration (2016-2032)
- Figure 146: Middle East & Africa Medical Morphine Market Share Comparison by Application (2016-2032)
- Figure 147: Middle East & Africa Medical Morphine Market Share Comparison by Distribution Channel (2016-2032)
- List of Tables
- Table 1: Global Medical Morphine Market Comparison by Route of Administration (2016-2032)
- Table 2: Global Medical Morphine Market Comparison by Application (2016-2032)
- Table 3: Global Medical Morphine Market Comparison by Distribution Channel (2016-2032)
- Table 4: Global Medical Morphine Market Revenue (US$ Mn) Comparison by Region (2016-2032)
- Table 5: Global Medical Morphine Market Revenue (US$ Mn) (2016-2032)
- Table 6: Global Medical Morphine Market Revenue (US$ Mn) Comparison by Region (2016-2032)
- Table 7: Global Medical Morphine Market Revenue (US$ Mn) Comparison by Route of Administration (2016-2032)
- Table 8: Global Medical Morphine Market Revenue (US$ Mn) Comparison by Application (2016-2032)
- Table 9: Global Medical Morphine Market Revenue (US$ Mn) Comparison by Distribution Channel (2016-2032)
- Table 10: Global Medical Morphine Market Y-o-Y Growth Rate Comparison by Region (2016-2032)
- Table 11: Global Medical Morphine Market Y-o-Y Growth Rate Comparison by Route of Administration (2016-2032)
- Table 12: Global Medical Morphine Market Y-o-Y Growth Rate Comparison by Application (2016-2032)
- Table 13: Global Medical Morphine Market Y-o-Y Growth Rate Comparison by Distribution Channel (2016-2032)
- Table 14: Global Medical Morphine Market Share Comparison by Region (2016-2032)
- Table 15: Global Medical Morphine Market Share Comparison by Route of Administration (2016-2032)
- Table 16: Global Medical Morphine Market Share Comparison by Application (2016-2032)
- Table 17: Global Medical Morphine Market Share Comparison by Distribution Channel (2016-2032)
- Table 18: North America Medical Morphine Market Comparison by Application (2016-2032)
- Table 19: North America Medical Morphine Market Comparison by Distribution Channel (2016-2032)
- Table 20: North America Medical Morphine Market Revenue (US$ Mn) Comparison by Country (2016-2032)
- Table 21: North America Medical Morphine Market Revenue (US$ Mn) (2016-2032)
- Table 22: North America Medical Morphine Market Revenue (US$ Mn) Comparison by Country (2016-2032)
- Table 23: North America Medical Morphine Market Revenue (US$ Mn) Comparison by Route of Administration (2016-2032)
- Table 24: North America Medical Morphine Market Revenue (US$ Mn) Comparison by Application (2016-2032)
- Table 25: North America Medical Morphine Market Revenue (US$ Mn) Comparison by Distribution Channel (2016-2032)
- Table 26: North America Medical Morphine Market Y-o-Y Growth Rate Comparison by Country (2016-2032)
- Table 27: North America Medical Morphine Market Y-o-Y Growth Rate Comparison by Route of Administration (2016-2032)
- Table 28: North America Medical Morphine Market Y-o-Y Growth Rate Comparison by Application (2016-2032)
- Table 29: North America Medical Morphine Market Y-o-Y Growth Rate Comparison by Distribution Channel (2016-2032)
- Table 30: North America Medical Morphine Market Share Comparison by Country (2016-2032)
- Table 31: North America Medical Morphine Market Share Comparison by Route of Administration (2016-2032)
- Table 32: North America Medical Morphine Market Share Comparison by Application (2016-2032)
- Table 33: North America Medical Morphine Market Share Comparison by Distribution Channel (2016-2032)
- Table 34: Western Europe Medical Morphine Market Comparison by Route of Administration (2016-2032)
- Table 35: Western Europe Medical Morphine Market Comparison by Application (2016-2032)
- Table 36: Western Europe Medical Morphine Market Comparison by Distribution Channel (2016-2032)
- Table 37: Western Europe Medical Morphine Market Revenue (US$ Mn) Comparison by Country (2016-2032)
- Table 38: Western Europe Medical Morphine Market Revenue (US$ Mn) (2016-2032)
- Table 39: Western Europe Medical Morphine Market Revenue (US$ Mn) Comparison by Country (2016-2032)
- Table 40: Western Europe Medical Morphine Market Revenue (US$ Mn) Comparison by Route of Administration (2016-2032)
- Table 41: Western Europe Medical Morphine Market Revenue (US$ Mn) Comparison by Application (2016-2032)
- Table 42: Western Europe Medical Morphine Market Revenue (US$ Mn) Comparison by Distribution Channel (2016-2032)
- Table 43: Western Europe Medical Morphine Market Y-o-Y Growth Rate Comparison by Country (2016-2032)
- Table 44: Western Europe Medical Morphine Market Y-o-Y Growth Rate Comparison by Route of Administration (2016-2032)
- Table 45: Western Europe Medical Morphine Market Y-o-Y Growth Rate Comparison by Application (2016-2032)
- Table 46: Western Europe Medical Morphine Market Y-o-Y Growth Rate Comparison by Distribution Channel (2016-2032)
- Table 47: Western Europe Medical Morphine Market Share Comparison by Country (2016-2032)
- Table 48: Western Europe Medical Morphine Market Share Comparison by Route of Administration (2016-2032)
- Table 49: Western Europe Medical Morphine Market Share Comparison by Application (2016-2032)
- Table 50: Western Europe Medical Morphine Market Share Comparison by Distribution Channel (2016-2032)
- Table 51: Eastern Europe Medical Morphine Market Comparison by Route of Administration (2016-2032)
- Table 52: Eastern Europe Medical Morphine Market Comparison by Application (2016-2032)
- Table 53: Eastern Europe Medical Morphine Market Comparison by Distribution Channel (2016-2032)
- Table 54: Eastern Europe Medical Morphine Market Revenue (US$ Mn) Comparison by Country (2016-2032)
- Table 55: Eastern Europe Medical Morphine Market Revenue (US$ Mn) (2016-2032)
- Table 56: Eastern Europe Medical Morphine Market Revenue (US$ Mn) Comparison by Country (2016-2032)
- Table 57: Eastern Europe Medical Morphine Market Revenue (US$ Mn) Comparison by Route of Administration (2016-2032)
- Table 58: Eastern Europe Medical Morphine Market Revenue (US$ Mn) Comparison by Application (2016-2032)
- Table 59: Eastern Europe Medical Morphine Market Revenue (US$ Mn) Comparison by Distribution Channel (2016-2032)
- Table 60: Eastern Europe Medical Morphine Market Y-o-Y Growth Rate Comparison by Country (2016-2032)
- Table 61: Eastern Europe Medical Morphine Market Y-o-Y Growth Rate Comparison by Route of Administration (2016-2032)
- Table 62: Eastern Europe Medical Morphine Market Y-o-Y Growth Rate Comparison by Application (2016-2032)
- Table 63: Eastern Europe Medical Morphine Market Y-o-Y Growth Rate Comparison by Distribution Channel (2016-2032)
- Table 64: Eastern Europe Medical Morphine Market Share Comparison by Country (2016-2032)
- Table 65: Eastern Europe Medical Morphine Market Share Comparison by Route of Administration (2016-2032)
- Table 66: Eastern Europe Medical Morphine Market Share Comparison by Application (2016-2032)
- Table 67: Eastern Europe Medical Morphine Market Share Comparison by Distribution Channel (2016-2032)
- Table 68: APAC Medical Morphine Market Comparison by Route of Administration (2016-2032)
- Table 69: APAC Medical Morphine Market Comparison by Application (2016-2032)
- Table 70: APAC Medical Morphine Market Comparison by Distribution Channel (2016-2032)
- Table 71: APAC Medical Morphine Market Revenue (US$ Mn) Comparison by Country (2016-2032)
- Table 72: APAC Medical Morphine Market Revenue (US$ Mn) (2016-2032)
- Table 73: APAC Medical Morphine Market Revenue (US$ Mn) Comparison by Country (2016-2032)
- Table 74: APAC Medical Morphine Market Revenue (US$ Mn) Comparison by Route of Administration (2016-2032)
- Table 75: APAC Medical Morphine Market Revenue (US$ Mn) Comparison by Application (2016-2032)
- Table 76: APAC Medical Morphine Market Revenue (US$ Mn) Comparison by Distribution Channel (2016-2032)
- Table 77: APAC Medical Morphine Market Y-o-Y Growth Rate Comparison by Country (2016-2032)
- Table 78: APAC Medical Morphine Market Y-o-Y Growth Rate Comparison by Route of Administration (2016-2032)
- Table 79: APAC Medical Morphine Market Y-o-Y Growth Rate Comparison by Application (2016-2032)
- Table 80: APAC Medical Morphine Market Y-o-Y Growth Rate Comparison by Distribution Channel (2016-2032)
- Table 81: APAC Medical Morphine Market Share Comparison by Country (2016-2032)
- Table 82: APAC Medical Morphine Market Share Comparison by Route of Administration (2016-2032)
- Table 83: APAC Medical Morphine Market Share Comparison by Application (2016-2032)
- Table 84: APAC Medical Morphine Market Share Comparison by Distribution Channel (2016-2032)
- Table 85: Latin America Medical Morphine Market Comparison by Route of Administration (2016-2032)
- Table 86: Latin America Medical Morphine Market Comparison by Application (2016-2032)
- Table 87: Latin America Medical Morphine Market Comparison by Distribution Channel (2016-2032)
- Table 88: Latin America Medical Morphine Market Revenue (US$ Mn) Comparison by Country (2016-2032)
- Table 89: Latin America Medical Morphine Market Revenue (US$ Mn) (2016-2032)
- Table 90: Latin America Medical Morphine Market Revenue (US$ Mn) Comparison by Country (2016-2032)
- Table 91: Latin America Medical Morphine Market Revenue (US$ Mn) Comparison by Route of Administration (2016-2032)
- Table 92: Latin America Medical Morphine Market Revenue (US$ Mn) Comparison by Application (2016-2032)
- Table 93: Latin America Medical Morphine Market Revenue (US$ Mn) Comparison by Distribution Channel (2016-2032)
- Table 94: Latin America Medical Morphine Market Y-o-Y Growth Rate Comparison by Country (2016-2032)
- Table 95: Latin America Medical Morphine Market Y-o-Y Growth Rate Comparison by Route of Administration (2016-2032)
- Table 96: Latin America Medical Morphine Market Y-o-Y Growth Rate Comparison by Application (2016-2032)
- Table 97: Latin America Medical Morphine Market Y-o-Y Growth Rate Comparison by Distribution Channel (2016-2032)
- Table 98: Latin America Medical Morphine Market Share Comparison by Country (2016-2032)
- Table 99: Latin America Medical Morphine Market Share Comparison by Route of Administration (2016-2032)
- Table 100: Latin America Medical Morphine Market Share Comparison by Application (2016-2032)
- Table 101: Latin America Medical Morphine Market Share Comparison by Distribution Channel (2016-2032)
- Table 102: Middle East & Africa Medical Morphine Market Comparison by Route of Administration (2016-2032)
- Table 103: Middle East & Africa Medical Morphine Market Comparison by Application (2016-2032)
- Table 104: Middle East & Africa Medical Morphine Market Comparison by Distribution Channel (2016-2032)
- Table 105: Middle East & Africa Medical Morphine Market Revenue (US$ Mn) Comparison by Country (2016-2032)
- Table 106: Middle East & Africa Medical Morphine Market Revenue (US$ Mn) (2016-2032)
- Table 107: Middle East & Africa Medical Morphine Market Revenue (US$ Mn) Comparison by Country (2016-2032)
- Table 108: Middle East & Africa Medical Morphine Market Revenue (US$ Mn) Comparison by Route of Administration (2016-2032)
- Table 109: Middle East & Africa Medical Morphine Market Revenue (US$ Mn) Comparison by Application (2016-2032)
- Table 110: Middle East & Africa Medical Morphine Market Revenue (US$ Mn) Comparison by Distribution Channel (2016-2032)
- Table 111: Middle East & Africa Medical Morphine Market Y-o-Y Growth Rate Comparison by Country (2016-2032)
- Table 112: Middle East & Africa Medical Morphine Market Y-o-Y Growth Rate Comparison by Route of Administration (2016-2032)
- Table 113: Middle East & Africa Medical Morphine Market Y-o-Y Growth Rate Comparison by Application (2016-2032)
- Table 114: Middle East & Africa Medical Morphine Market Y-o-Y Growth Rate Comparison by Distribution Channel (2016-2032)
- Table 115: Middle East & Africa Medical Morphine Market Share Comparison by Country (2016-2032)
- Table 116: Middle East & Africa Medical Morphine Market Share Comparison by Route of Administration (2016-2032)
- Table 117: Middle East & Africa Medical Morphine Market Share Comparison by Application (2016-2032)
- Table 118: Middle East & Africa Medical Morphine Market Share Comparison by Distribution Channel (2016-2032)
- 1. Executive Summary
-
- Mallinckrodt Pharmaceuticals
- Verve Health Care Ltd.
- Purdue Pharma L.P.
- Taj Pharmaceuticals Limited
- Sun Pharmaceutical Industries Ltd
- Teva Pharmaceutical Industries Ltd
- Northeast Pharmaceutical Group Co., Ltd
- Amphastar Pharmaceuticals
- Mayne Pharma Group Limited
- Manus Aktteva Biopharma LLP
- Fresenius Kabi USA
- Tris Pharma, Inc
- Alcaliber S.A
- Pfizer Inc.
- AbbVie Inc.
Our Clients


View Our Licence Options
