
Marine Renewable Energy Market By Type(Wave energy, Tidal energy, Ocean thermal energy conversion (OTEC), Salinity gradient power (SGP)), By Application(Power generation, Desalination, Hydrogen production, Other), By Region And Companies - Industry Segment Outlook, Market Assessment, Competition Scenario, Trends, And Forecast 2023-2032
-
42468
-
Dec 2023
-
152
-


-
This report was compiled by Shreyas Rokade Shreyas Rokade is a seasoned Research Analyst with CMFE, bringing extensive expertise in market research and consulting, with a strong background in Chemical Engineering. Correspondence Team Lead-CMFE Linkedin | Detailed Market research Methodology Our methodology involves a mix of primary research, including interviews with leading mental health experts, and secondary research from reputable medical journals and databases. View Detailed Methodology Page
-
Quick Navigation
- Marine Renewable Energy Market Size, Share, Trends Analysis
- Marine Renewable Energy Market Dynamics
- Government Support Accelerates Marine Renewable Energy Development
- Technological Advancements Propel Marine Energy Innovation
- Marine Renewable Energy Market Segmentation Analysis
- Marine Renewable Energy Industry Segments
- Marine Renewable Energy Market Regional Analysis
- Marine Renewable Energy Industry By Region
- Marine Renewable Energy Market Share Analysis
- Marine Renewable Energy Industry Key Players
- Marine Renewable Energy Market Recent Development
- Report Scope
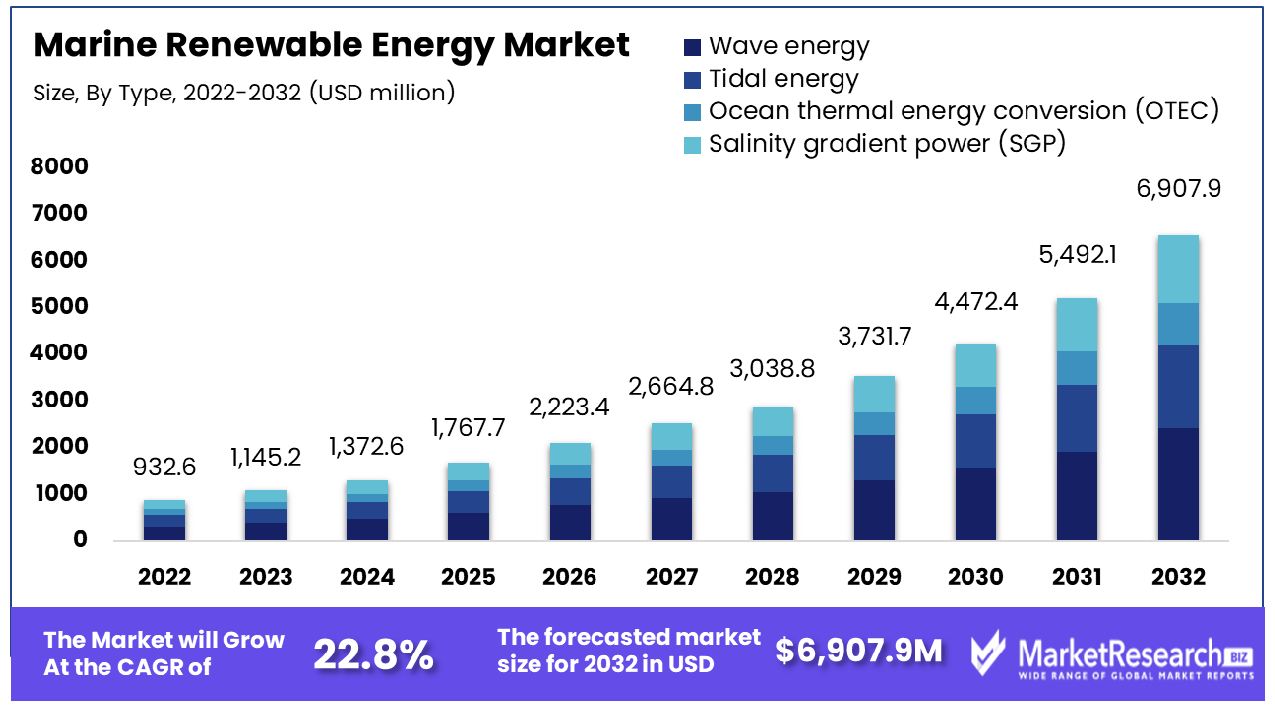
Marine Renewable Energy Market size is expected to be worth around USD 6,907.9 Mn by 2032 from USD 932.6 Mn in 2022, growing at a CAGR of 22.8% during the forecast period from 2023 to 2032.
Marine renewable energy encompasses various technologies that harness ocean energy from oceanic sources, including waves, tides, ocean currents, and thermal gradients. These sources are an abundant, untapped source of renewable force with great potential to meet global vigor demands. Wave energy converters, tidal turbines, and Ocean Thermal Energy Conversion (OTEC) systems are among the key technologies utilized.
Marine renewable development is essential to combating climate change by decreasing fossil fuel dependence and combating climate change. Unfortunately, however, marine renewables face challenges related to technological maturity, environmental impacts, and high deployment costs, necessitating increased research funding as well as supportive policies to make their presence felt within the vigor mix.
The projection that the global market potential of ocean energy force will reach 350 GW by 2050 presents significant growth opportunities. This expansion is critical to providing clean, predictable electricity to coastal nations and islands, aligning with global decarbonization goals.
The marine renewables industry, in response to the European Commission's strategy, must upscale dramatically—by 5 times by 2030 and 25 times by 2050—to replace fossil fuels with offshore renewables. This scale of growth indicates immense opportunities for investment, innovation, and development in the sector, offering a substantial market for new technologies and infrastructure development.
OTEC, which leverages temperature differences in ocean waters at varying depths, offers avenues for technological advancement and strength production. This method is particularly promising in tropical regions where temperature gradients are significant.
Moreover, the development of hybrid platforms combining wind, wave, and solar power extraction methods signifies a holistic approach to harnessing marine renewable potency. Such integrated systems can maximize vigor output and efficiency, offering a more consistent and reliable vigor supply.
Implementing floating solar panels on oceans and lakes opens new territories for solar intensity generation. This approach is particularly advantageous in areas with limited land availability. Companies specializing in the design, installation, and maintenance of these floating solar structures can tap into a unique segment of the renewable vigor market, benefiting from the increasing demand for innovative and space-efficient solar vigor solutions.
Marine Renewable Energy Market Dynamics
Rising Demand for Renewables Fuels Marine Energy Market
As concerns over climate change and fossil fuel depletion increase, and as society looks for sustainable force solutions. Renewable marine energy sectors like wave power and tidal power offer vast untapped resources that could produce clean power.
The rising desire to tap the ocean's potential is not simply driven by environmental concerns but is also part of an intense strategy shift, diversification, and security consideration. By 2022, renewable energies such as wind, solar power, geothermal hydro, and the ocean had increased by 8.8% which represented a 0.4 percentage point rise in their share in the total world intensity supply which stood at 5.5%.
In addition, The International Energy Agency (IEA) predicts that renewable power generation capacity is predicted to increase by 2,400 gigawatts from 2022-2027; reflecting their growing and steady demand.
Government Support Accelerates Marine Renewable Energy Development
Government support for renewable energies, including wave and tidal power, is evident through various financial incentives and programs. The Database of State Incentives for Renewables and Efficiency (DSIRE) tracks the availability of incentives offered by state and federal government tax credits, grants, and loan programs for qualifying renewable potency technologies and projects.
The increasing governmental support reflects a broader commitment to renewable force and sustainability, indicating a market that is likely to grow as more governments and international bodies prioritize and invest in renewable.
Technological Advancements Propel Marine Energy Innovation
Continuous innovation in the field has led to more efficient, reliable, and cost-effective technologies for harnessing wave and tidal energy. These advancements are essential in making marine renewable energies more competitive with traditional potency sources and other renewables.
Improvements in areas such as intensity conversion efficiency, durability, and maintenance of marine potency systems are making these sources more attractive to investors and intensity companies. The ongoing technological progress in marine renewable energies suggests a market evolving rapidly, with the potential for significant growth as these technologies become more advanced and commercially viable.
Stringent Regulations and Environmental Concerns Limit Marine Renewable Energy Market Growth
Developing marine power projects, such as offshore wind farms or tidal systems, involves navigating complex regulatory frameworks designed to protect marine ecosystems. Compliance with these regulations often requires extensive environmental impact assessments, which can be time-consuming and costly.
Additionally, the potential ecological impacts of these projects, such as disruption to marine habitats and wildlife, can lead to opposition from environmental groups. These key factors collectively slow down project approvals and implementation, limiting the market's ability to rapidly expand and capitalize on the growing demand for renewable sources.
Socioeconomic Challenges Restrain Marine Renewable Energy Market Growth
The development of marine potency infrastructure can impact local communities in various ways, including changes in property values, alterations to traditional livelihoods (like fishing), and concerns over shipping safety and navigation.
For instance, the installation of offshore wind turbines or tidal barrages can lead to apprehensions among residents and stakeholders about visual impact, noise, and potential disruptions to marine traffic. These socioeconomic factors can result in public resistance and legal challenges, hindering the market's growth. Addressing these concerns effectively is crucial for gaining community support and ensuring the sustainable development of marine renewable projects.
Marine Renewable Energy Market Segmentation Analysis
By Type Analysis
The wave energy segment, constituting 41% of the marine renewable energy market, is the dominant segment. Its prominence stems from the vast potential and consistent availability of wave power as a renewable energy source. Technological advancements in wave converters have significantly improved the efficiency and feasibility of harnessing wave power. This technology's growth is propelled by global investment in renewable energy, favorable government policies, and innovations aimed at optimizing intensity capture from ocean waves.
Tidal energy, another significant segment, leverages the predictability of tidal movements to generate power, though it is limited by geographical constraints. Ocean Thermal Energy Conversion (OTEC) exploits the temperature difference between surface and deep ocean energy waters, primarily suitable for tropical regions. Salinity Gradient Power (SGP) is an emerging technology that generates electricity supply from the salinity difference between seawater and freshwater, water column, offering a novel approach to renewable power.
By Application Analysis
Power generation segment, accounting for 61% of applications in the marine renewable energy market, is the dominant segment. The push for sustainable, clean sources drives this sector, with marine renewable technologies increasingly integrated into power grids. The reliability and scalability of marine renewable, especially from wave and tidal sources, make them attractive for electricity generation. According to the Pacific Northwest National Laboratory, marine intensity has the potential to generate 1,250 to 1,850 terawatt-hours of demand for electricity supply from river currents and the ocean's wave, current, and tidal energy.
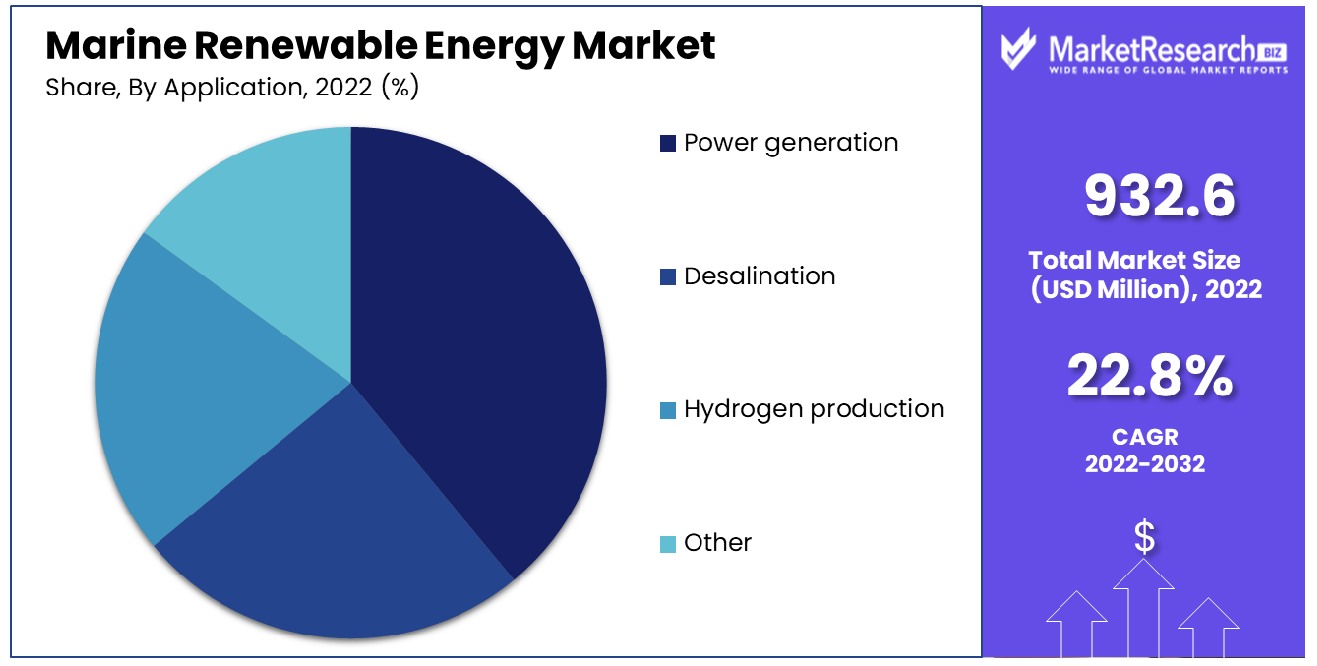
Other applications include desalination, which uses marine renewable force to power plants for sustainable freshwater production. Hydrogen production via electrolysis powered by renewable energy is a promising area, particularly for developing green hydrogen. Additional applications encompass areas such as seawater cooling, aquaculture, and maritime navigation support, each tapping into the unique potential of marine renewable potency sources. Marine Port Services are increasingly adopting Marine Renewable Energy solutions to power their operations, reducing environmental impact and promoting sustainable practices.
Marine Renewable Energy Industry Segments
By Type
- Wave energy
- Tidal energy
- Ocean thermal energy conversion (OTEC)
- Salinity gradient power (SGP)
By Application
- Power generation
- Desalination
- Hydrogen production
- Other
Marine Renewable Energy Market Regional Analysis
Asia Pacific Dominates with 41% Market Share
Asia Pacific's significant 41% share in the marine renewable market segments is driven by the region's vast coastal areas and a strong emphasis on sustainable vitality development. Countries like China, Japan, and South Korea are leading in harnessing marine power resources, including wave, tidal, and ocean energy thermal vitality. The region’s focus on reducing reliance on fossil fuels and combating climate change contributes to the market's growth. Additionally, technological advancements in marine vitality harvesting and supportive government policies, including incentives and investments in renewable resources projects, play crucial roles.
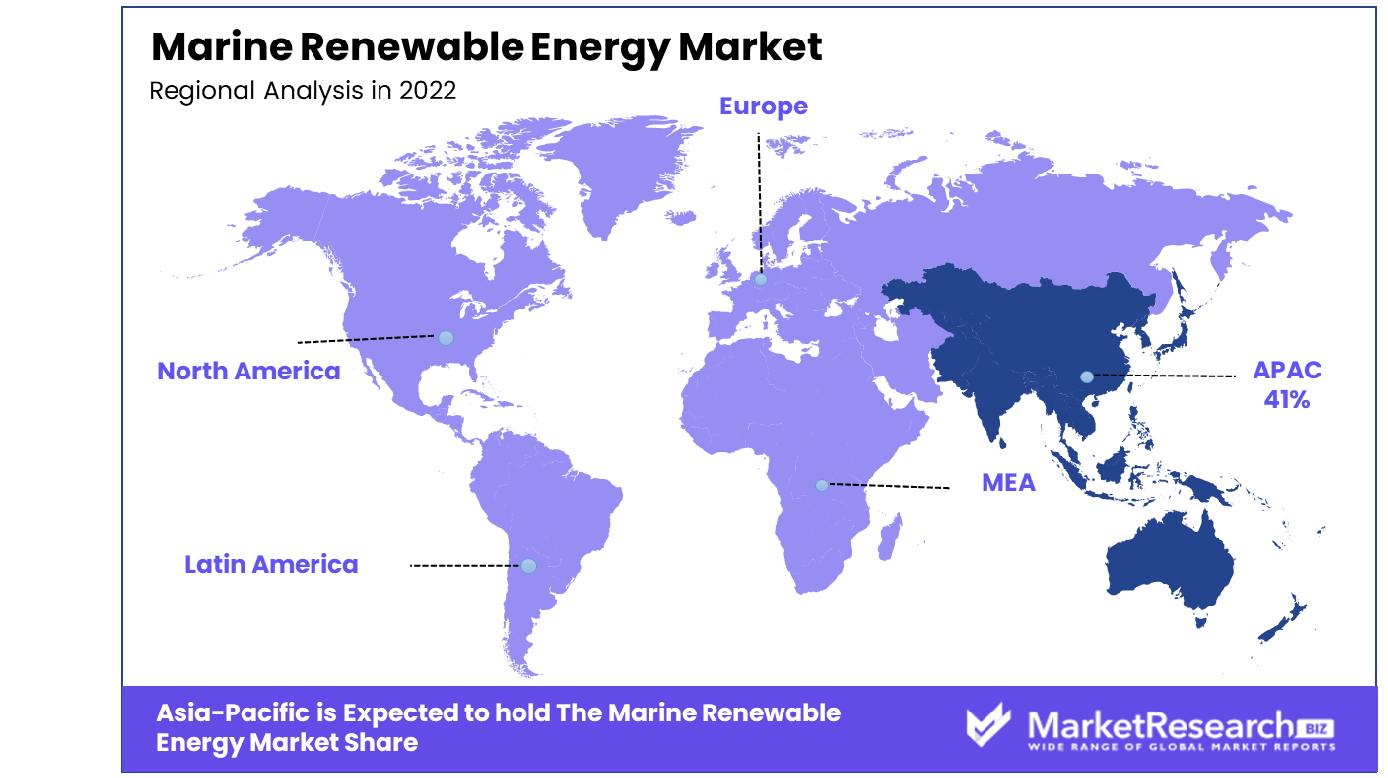
The market dynamics in Asia Pacific are influenced by the increasing power demand due to rapid industrialization and urbanization. The region’s rich marine biodiversity and geographical advantages offer significant potential for marine vitality development. The growing public and private sector collaboration for research and development in marine renewable force technologies enhances market prospects.
Europe's Pioneering in Marine Renewable Energy Technologies
Europe has been a frontrunner in adopting marine power projects, especially in countries like the United Kingdom and Norway. Europe's emphasis on reducing carbon emissions and achieving power independence underpins the market's growth. According to Ocean Europe, ocean energy vitality can provide 10% of Europe's current electricity needs and 500,000 jobs and is all set to become a new European industry. Additionally, the European Marine Centre (EMEC) is the world's pioneer facility for testing wave and tidal power to facilitate the transition to clean energy sources to help ensure our planet's sustainability in the years to come.
North America's Emerging Market with Significant Potential
In North America, the marine renewable energy market is emerging, with significant potential due to its extensive coastlines and technological capabilities. The United States and Canada are increasingly exploring marine vitality as part of their renewable power sector. Additionally, the National Renewable Sources Laboratory and Mystic Aquarium have teamed up to create a series of marine energy industry technologies and power resources that are highly predictable, making them promising contributors to a stable, reliable clean power grid.
Marine Renewable Energy Industry By Region
North America
- The US
- Canada
- Rest of North America
Europe
- Germany
- France
- The UK
- Spain
- Italy
- Russia
- Netherlands
- Rest of Europe
Asia-Pacific
- China
- Japan
- South Korea
- India
- New Zealand
- Singapore
- Thailand
- Vietnam
- Rest of Asia Pacific
Latin America
- Brazil
- Mexico
- Rest of Latin America
Middle East & Africa
- South Africa
- Saudi Arabia
- UAE
- Rest of Middle East & Africa
In the marine renewable energy market, a segment crucial for the global transition to sustainable power, the companies listed are at the forefront of harnessing ocean power. Ocean Power Technologies and Carnegie Clean Vitality are key players in developing innovative wave force technologies, reflecting the market's focus on capturing the vast, untapped potential of ocean waves for electricity generation.
Minesto AB and CorPower Ocean, specializing in tidal and ocean current power, contribute significantly to the market with their advanced underwater turbines, demonstrating the industry's shift towards exploiting a variety of marine power sectors. Atlantis Resources and SIMEC Atlantis Energy, with their large-scale projects and expertise in both tidal and wave energy, underscore the importance of scalability and versatility in marine renewable solutions.
Wello and Ocean Renewable Power Company, though smaller in scale, make substantial contributions with unique technologies like floating wave energy converters, showcasing the industry's innovation in adapting to different marine industry environments. Aquamarine Power and Seabased, focusing on wave energy technologies, offer solutions that are both eco-friendly and efficient, catering to the growing demand for sustainable power security production.
Collectively, these companies drive the marine renewable vitality sector growth, representing a range of strategies from developing advanced wave and tidal technologies to scaling up projects for global power transition, essential for tapping into the ocean's vast renewable power potential.
Marine Renewable Energy Industry Key Players
- Ocean Power Technologies
- Minesto AB
- Atlantis Resources
- Carnegie Clean Energy
- Hello
- CorPower Ocean
- Ocean Renewable Power Company
- Aquamarine Power
- Sea-based
- BioPower Systems
- AW-Energy
- Magallanes Renovables
- Orbital Marine Power
- SIMEC Atlantis Energy
- Oscilla Power, Inc.
- Aqua-Magnetics, Inc.
- Carnegie Wave Energy Ltd.
- D.E. Energy Ltd.
- Atargis Energy Corporation
- Blue Energy Canada, Inc.
Marine Renewable Energy Market Recent Development
- In November 2023, Orsted, a renewable energy firm, announced the halt in the development of two U.S. offshore wind projects, Ocean Wind 1 and 2, in New Jersey. This decision was driven by supply chain delays and higher costs, resulting in impairments exceeding $5 billion. Orsted, the world's largest offshore wind developer, faced a significant setback as its stock plunged by as much as 22% to a six-year low of 265 Danish crowns.
- In July 2023, The Irish government announced the establishment of the Maritime Area Regulatory Authority (MARA) to regulate offshore developments such as wind farms and manage marine resources. MARA will issue licenses and assess renewable energy applications for Maritime Area Consents. Wind Power Ireland emphasized the need for adequate resources for MARA to fulfill its role effectively.
- In December 2022, the Ministry for the Ecological Transition and the Demographic Challenge (MITECO) of Spain published a regulatory document outlining the allocation of state grants for the development of marine renewable energy pilot projects and related infrastructure.
- In October 2022, SIMEC Atlantis Energy agreed to sell a majority stake in its Advanced Tidal Engineering and Services division (ATES), resulting in the creation of Proteus Marine Renewables through a management buyout. This move allowed Proteus Marine Renewables to expand its product and services offering in marine renewables while maintaining a focus on tidal energy.
Report Scope
Report Features Description Market Value (2022) USD 932.6 Million Forecast Revenue (2032) USD 6,907.9 Million CAGR (2023-2032) 22.8% Base Year for Estimation 2022 Historic Period 2016-2022 Forecast Period 2023-2032 Report Coverage Revenue Forecast, Market Dynamics, COVID-19 Impact, Competitive Landscape, Recent Developments Segments Covered By Type(Wave energy, Tidal energy, Ocean thermal energy conversion (OTEC), Salinity gradient power (SGP)), By Application(Power generation, Desalination, Hydrogen production, Other) Regional Analysis North America - The US, Canada, Rest of North America, Europe - Germany, France, The UK, Spain, Italy, Russia, Netherlands, Rest of Europe, Asia-Pacific - China, Japan, South Korea, India, New Zealand, Singapore, Thailand, Vietnam, Rest of Asia Pacific, Latin America - Brazil, Mexico, Rest of Latin America, Middle East & Africa - South Africa, Saudi Arabia, UAE, Rest of Middle East & Africa Competitive Landscape Ocean Power Technologies, Minesto AB, Atlantis Resources, Carnegie Clean Energy, Wello, CorPower Ocean, Ocean Renewable Power Company, Aquamarine Power, Seabased, BioPower Systems, AW-Energy, Magallanes Renovables, Orbital Marine Power, SIMEC Atlantis Energy, Oscilla Power, Inc., Aqua-Magnetics, Inc., Carnegie Wave Energy Ltd., D.E. Energy Ltd., Atargis Energy Corporation, Blue Energy Canada, Inc. Customization Scope Customization for segments, region/country-level will be provided. Moreover, additional customization can be done based on the requirements. Purchase Options We have three licenses to opt for Single User License, Multi-User License (Up to 5 Users), Corporate Use License (Unlimited User and Printable PDF) -
- 1. Executive Summary
- 1.1. Definition
- 1.2. Taxonomy
- 1.3. Research Scope
- 1.4. Key Analysis
- 1.5. Key Findings by Major Segments
- 1.6. Top strategies by Major Players
- 2. Global Marine Renewable Energy Market Overview
- 2.1. Marine Renewable Energy Market Dynamics
- 2.1.1. Drivers
- 2.1.2. Opportunities
- 2.1.3. Restraints
- 2.1.4. Challenges
- 2.2. Macro-economic Factors
- 2.3. Regulatory Framework
- 2.4. Market Investment Feasibility Index
- 2.5. PEST Analysis
- 2.6. PORTER’S Five Force Analysis
- 2.7. Drivers & Restraints Impact Analysis
- 2.8. Industry Chain Analysis
- 2.9. Cost Structure Analysis
- 2.10. Marketing Strategy
- 2.11. Russia-Ukraine War Impact Analysis
- 2.12. Opportunity Map Analysis
- 2.13. Market Competition Scenario Analysis
- 2.14. Product Life Cycle Analysis
- 2.15. Opportunity Orbits
- 2.16. Manufacturer Intensity Map
- 2.17. Major Companies sales by Value & Volume
- 2.1. Marine Renewable Energy Market Dynamics
- 3. Global Marine Renewable Energy Market Analysis, Opportunity and Forecast, 2016-2032
- 3.1. Global Marine Renewable Energy Market Analysis, 2016-2021
- 3.2. Global Marine Renewable Energy Market Opportunity and Forecast, 2023-2032
- 3.3. Global Marine Renewable Energy Market Analysis, Opportunity and Forecast, By By Type, 2016-2032
- 3.3.1. Global Marine Renewable Energy Market Analysis by By Type: Introduction
- 3.3.2. Market Size Absolute $ Opportunity Analysis and Forecast, By By Type, 2016-2032
- 3.3.3. Wave energy
- 3.3.4. Tidal energy
- 3.3.5. Ocean thermal energy conversion (OTEC)
- 3.3.6. Salinity gradient power (SGP)
- 3.4. Global Marine Renewable Energy Market Analysis, Opportunity and Forecast, By By Application, 2016-2032
- 3.4.1. Global Marine Renewable Energy Market Analysis by By Application: Introduction
- 3.4.2. Market Size Absolute $ Opportunity Analysis and Forecast, By By Application, 2016-2032
- 3.4.3. Power generation
- 3.4.4. Desalination
- 3.4.5. Hydrogen production
- 3.4.6. Other
- 4. North America Marine Renewable Energy Market Analysis, Opportunity and Forecast, 2016-2032
- 4.1. North America Marine Renewable Energy Market Analysis, 2016-2021
- 4.2. North America Marine Renewable Energy Market Opportunity and Forecast, 2023-2032
- 4.3. North America Marine Renewable Energy Market Analysis, Opportunity and Forecast, By By Type, 2016-2032
- 4.3.1. North America Marine Renewable Energy Market Analysis by By Type: Introduction
- 4.3.2. Market Size Absolute $ Opportunity Analysis and Forecast, By By Type, 2016-2032
- 4.3.3. Wave energy
- 4.3.4. Tidal energy
- 4.3.5. Ocean thermal energy conversion (OTEC)
- 4.3.6. Salinity gradient power (SGP)
- 4.4. North America Marine Renewable Energy Market Analysis, Opportunity and Forecast, By By Application, 2016-2032
- 4.4.1. North America Marine Renewable Energy Market Analysis by By Application: Introduction
- 4.4.2. Market Size Absolute $ Opportunity Analysis and Forecast, By By Application, 2016-2032
- 4.4.3. Power generation
- 4.4.4. Desalination
- 4.4.5. Hydrogen production
- 4.4.6. Other
- 4.5. North America Marine Renewable Energy Market Analysis, Opportunity and Forecast, By Country , 2016-2032
- 4.5.1. North America Marine Renewable Energy Market Analysis by Country : Introduction
- 4.5.2. Market Size Absolute $ Opportunity Analysis and Forecast, Country , 2016-2032
- 4.5.2.1. The US
- 4.5.2.2. Canada
- 4.5.2.3. Mexico
- 5. Western Europe Marine Renewable Energy Market Analysis, Opportunity and Forecast, 2016-2032
- 5.1. Western Europe Marine Renewable Energy Market Analysis, 2016-2021
- 5.2. Western Europe Marine Renewable Energy Market Opportunity and Forecast, 2023-2032
- 5.3. Western Europe Marine Renewable Energy Market Analysis, Opportunity and Forecast, By By Type, 2016-2032
- 5.3.1. Western Europe Marine Renewable Energy Market Analysis by By Type: Introduction
- 5.3.2. Market Size Absolute $ Opportunity Analysis and Forecast, By By Type, 2016-2032
- 5.3.3. Wave energy
- 5.3.4. Tidal energy
- 5.3.5. Ocean thermal energy conversion (OTEC)
- 5.3.6. Salinity gradient power (SGP)
- 5.4. Western Europe Marine Renewable Energy Market Analysis, Opportunity and Forecast, By By Application, 2016-2032
- 5.4.1. Western Europe Marine Renewable Energy Market Analysis by By Application: Introduction
- 5.4.2. Market Size Absolute $ Opportunity Analysis and Forecast, By By Application, 2016-2032
- 5.4.3. Power generation
- 5.4.4. Desalination
- 5.4.5. Hydrogen production
- 5.4.6. Other
- 5.5. Western Europe Marine Renewable Energy Market Analysis, Opportunity and Forecast, By Country , 2016-2032
- 5.5.1. Western Europe Marine Renewable Energy Market Analysis by Country : Introduction
- 5.5.2. Market Size Absolute $ Opportunity Analysis and Forecast, Country , 2016-2032
- 5.5.2.1. Germany
- 5.5.2.2. France
- 5.5.2.3. The UK
- 5.5.2.4. Spain
- 5.5.2.5. Italy
- 5.5.2.6. Portugal
- 5.5.2.7. Ireland
- 5.5.2.8. Austria
- 5.5.2.9. Switzerland
- 5.5.2.10. Benelux
- 5.5.2.11. Nordic
- 5.5.2.12. Rest of Western Europe
- 6. Eastern Europe Marine Renewable Energy Market Analysis, Opportunity and Forecast, 2016-2032
- 6.1. Eastern Europe Marine Renewable Energy Market Analysis, 2016-2021
- 6.2. Eastern Europe Marine Renewable Energy Market Opportunity and Forecast, 2023-2032
- 6.3. Eastern Europe Marine Renewable Energy Market Analysis, Opportunity and Forecast, By By Type, 2016-2032
- 6.3.1. Eastern Europe Marine Renewable Energy Market Analysis by By Type: Introduction
- 6.3.2. Market Size Absolute $ Opportunity Analysis and Forecast, By By Type, 2016-2032
- 6.3.3. Wave energy
- 6.3.4. Tidal energy
- 6.3.5. Ocean thermal energy conversion (OTEC)
- 6.3.6. Salinity gradient power (SGP)
- 6.4. Eastern Europe Marine Renewable Energy Market Analysis, Opportunity and Forecast, By By Application, 2016-2032
- 6.4.1. Eastern Europe Marine Renewable Energy Market Analysis by By Application: Introduction
- 6.4.2. Market Size Absolute $ Opportunity Analysis and Forecast, By By Application, 2016-2032
- 6.4.3. Power generation
- 6.4.4. Desalination
- 6.4.5. Hydrogen production
- 6.4.6. Other
- 6.5. Eastern Europe Marine Renewable Energy Market Analysis, Opportunity and Forecast, By Country , 2016-2032
- 6.5.1. Eastern Europe Marine Renewable Energy Market Analysis by Country : Introduction
- 6.5.2. Market Size Absolute $ Opportunity Analysis and Forecast, Country , 2016-2032
- 6.5.2.1. Russia
- 6.5.2.2. Poland
- 6.5.2.3. The Czech Republic
- 6.5.2.4. Greece
- 6.5.2.5. Rest of Eastern Europe
- 7. APAC Marine Renewable Energy Market Analysis, Opportunity and Forecast, 2016-2032
- 7.1. APAC Marine Renewable Energy Market Analysis, 2016-2021
- 7.2. APAC Marine Renewable Energy Market Opportunity and Forecast, 2023-2032
- 7.3. APAC Marine Renewable Energy Market Analysis, Opportunity and Forecast, By By Type, 2016-2032
- 7.3.1. APAC Marine Renewable Energy Market Analysis by By Type: Introduction
- 7.3.2. Market Size Absolute $ Opportunity Analysis and Forecast, By By Type, 2016-2032
- 7.3.3. Wave energy
- 7.3.4. Tidal energy
- 7.3.5. Ocean thermal energy conversion (OTEC)
- 7.3.6. Salinity gradient power (SGP)
- 7.4. APAC Marine Renewable Energy Market Analysis, Opportunity and Forecast, By By Application, 2016-2032
- 7.4.1. APAC Marine Renewable Energy Market Analysis by By Application: Introduction
- 7.4.2. Market Size Absolute $ Opportunity Analysis and Forecast, By By Application, 2016-2032
- 7.4.3. Power generation
- 7.4.4. Desalination
- 7.4.5. Hydrogen production
- 7.4.6. Other
- 7.5. APAC Marine Renewable Energy Market Analysis, Opportunity and Forecast, By Country , 2016-2032
- 7.5.1. APAC Marine Renewable Energy Market Analysis by Country : Introduction
- 7.5.2. Market Size Absolute $ Opportunity Analysis and Forecast, Country , 2016-2032
- 7.5.2.1. China
- 7.5.2.2. Japan
- 7.5.2.3. South Korea
- 7.5.2.4. India
- 7.5.2.5. Australia & New Zeland
- 7.5.2.6. Indonesia
- 7.5.2.7. Malaysia
- 7.5.2.8. Philippines
- 7.5.2.9. Singapore
- 7.5.2.10. Thailand
- 7.5.2.11. Vietnam
- 7.5.2.12. Rest of APAC
- 8. Latin America Marine Renewable Energy Market Analysis, Opportunity and Forecast, 2016-2032
- 8.1. Latin America Marine Renewable Energy Market Analysis, 2016-2021
- 8.2. Latin America Marine Renewable Energy Market Opportunity and Forecast, 2023-2032
- 8.3. Latin America Marine Renewable Energy Market Analysis, Opportunity and Forecast, By By Type, 2016-2032
- 8.3.1. Latin America Marine Renewable Energy Market Analysis by By Type: Introduction
- 8.3.2. Market Size Absolute $ Opportunity Analysis and Forecast, By By Type, 2016-2032
- 8.3.3. Wave energy
- 8.3.4. Tidal energy
- 8.3.5. Ocean thermal energy conversion (OTEC)
- 8.3.6. Salinity gradient power (SGP)
- 8.4. Latin America Marine Renewable Energy Market Analysis, Opportunity and Forecast, By By Application, 2016-2032
- 8.4.1. Latin America Marine Renewable Energy Market Analysis by By Application: Introduction
- 8.4.2. Market Size Absolute $ Opportunity Analysis and Forecast, By By Application, 2016-2032
- 8.4.3. Power generation
- 8.4.4. Desalination
- 8.4.5. Hydrogen production
- 8.4.6. Other
- 8.5. Latin America Marine Renewable Energy Market Analysis, Opportunity and Forecast, By Country , 2016-2032
- 8.5.1. Latin America Marine Renewable Energy Market Analysis by Country : Introduction
- 8.5.2. Market Size Absolute $ Opportunity Analysis and Forecast, Country , 2016-2032
- 8.5.2.1. Brazil
- 8.5.2.2. Colombia
- 8.5.2.3. Chile
- 8.5.2.4. Argentina
- 8.5.2.5. Costa Rica
- 8.5.2.6. Rest of Latin America
- 9. Middle East & Africa Marine Renewable Energy Market Analysis, Opportunity and Forecast, 2016-2032
- 9.1. Middle East & Africa Marine Renewable Energy Market Analysis, 2016-2021
- 9.2. Middle East & Africa Marine Renewable Energy Market Opportunity and Forecast, 2023-2032
- 9.3. Middle East & Africa Marine Renewable Energy Market Analysis, Opportunity and Forecast, By By Type, 2016-2032
- 9.3.1. Middle East & Africa Marine Renewable Energy Market Analysis by By Type: Introduction
- 9.3.2. Market Size Absolute $ Opportunity Analysis and Forecast, By By Type, 2016-2032
- 9.3.3. Wave energy
- 9.3.4. Tidal energy
- 9.3.5. Ocean thermal energy conversion (OTEC)
- 9.3.6. Salinity gradient power (SGP)
- 9.4. Middle East & Africa Marine Renewable Energy Market Analysis, Opportunity and Forecast, By By Application, 2016-2032
- 9.4.1. Middle East & Africa Marine Renewable Energy Market Analysis by By Application: Introduction
- 9.4.2. Market Size Absolute $ Opportunity Analysis and Forecast, By By Application, 2016-2032
- 9.4.3. Power generation
- 9.4.4. Desalination
- 9.4.5. Hydrogen production
- 9.4.6. Other
- 9.5. Middle East & Africa Marine Renewable Energy Market Analysis, Opportunity and Forecast, By Country , 2016-2032
- 9.5.1. Middle East & Africa Marine Renewable Energy Market Analysis by Country : Introduction
- 9.5.2. Market Size Absolute $ Opportunity Analysis and Forecast, Country , 2016-2032
- 9.5.2.1. Algeria
- 9.5.2.2. Egypt
- 9.5.2.3. Israel
- 9.5.2.4. Kuwait
- 9.5.2.5. Nigeria
- 9.5.2.6. Saudi Arabia
- 9.5.2.7. South Africa
- 9.5.2.8. Turkey
- 9.5.2.9. The UAE
- 9.5.2.10. Rest of MEA
- 10. Global Marine Renewable Energy Market Analysis, Opportunity and Forecast, By Region , 2016-2032
- 10.1. Global Marine Renewable Energy Market Analysis by Region : Introduction
- 10.2. Market Size Absolute $ Opportunity Analysis and Forecast, By Region , 2016-2032
- 10.2.1. North America
- 10.2.2. Western Europe
- 10.2.3. Eastern Europe
- 10.2.4. APAC
- 10.2.5. Latin America
- 10.2.6. Middle East & Africa
- 11. Global Marine Renewable Energy Market Competitive Landscape, Market Share Analysis, and Company Profiles
- 11.1. Market Share Analysis
- 11.2. Company Profiles
- 11.3. Ocean Power Technologies
- 11.3.1. Company Overview
- 11.3.2. Financial Highlights
- 11.3.3. Product Portfolio
- 11.3.4. SWOT Analysis
- 11.3.5. Key Strategies and Developments
- 11.4. Minesto AB
- 11.4.1. Company Overview
- 11.4.2. Financial Highlights
- 11.4.3. Product Portfolio
- 11.4.4. SWOT Analysis
- 11.4.5. Key Strategies and Developments
- 11.5. Atlantis Resources
- 11.5.1. Company Overview
- 11.5.2. Financial Highlights
- 11.5.3. Product Portfolio
- 11.5.4. SWOT Analysis
- 11.5.5. Key Strategies and Developments
- 11.6. Carnegie Clean Energy
- 11.6.1. Company Overview
- 11.6.2. Financial Highlights
- 11.6.3. Product Portfolio
- 11.6.4. SWOT Analysis
- 11.6.5. Key Strategies and Developments
- 11.7. Wello
- 11.7.1. Company Overview
- 11.7.2. Financial Highlights
- 11.7.3. Product Portfolio
- 11.7.4. SWOT Analysis
- 11.7.5. Key Strategies and Developments
- 11.8. CorPower Ocean
- 11.8.1. Company Overview
- 11.8.2. Financial Highlights
- 11.8.3. Product Portfolio
- 11.8.4. SWOT Analysis
- 11.8.5. Key Strategies and Developments
- 11.9. Ocean Renewable Power Company
- 11.9.1. Company Overview
- 11.9.2. Financial Highlights
- 11.9.3. Product Portfolio
- 11.9.4. SWOT Analysis
- 11.9.5. Key Strategies and Developments
- 11.10. Aquamarine Power
- 11.10.1. Company Overview
- 11.10.2. Financial Highlights
- 11.10.3. Product Portfolio
- 11.10.4. SWOT Analysis
- 11.10.5. Key Strategies and Developments
- 11.11. Seabased
- 11.11.1. Company Overview
- 11.11.2. Financial Highlights
- 11.11.3. Product Portfolio
- 11.11.4. SWOT Analysis
- 11.11.5. Key Strategies and Developments
- 11.12. BioPower Systems
- 11.12.1. Company Overview
- 11.12.2. Financial Highlights
- 11.12.3. Product Portfolio
- 11.12.4. SWOT Analysis
- 11.12.5. Key Strategies and Developments
- 11.13.1. Company Overview
- 11.13.2. Financial Highlights
- 11.13.3. Product Portfolio
- 11.13.4. SWOT Analysis
- 11.13.5. Key Strategies and Developments
- 11.14. AW-Energy
- 11.14.1. Company Overview
- 11.14.2. Financial Highlights
- 11.14.3. Product Portfolio
- 11.14.4. SWOT Analysis
- 11.14.5. Key Strategies and Developments
- 11.15. Orbital Marine Power
- 11.15.1. Company Overview
- 11.15.2. Financial Highlights
- 11.15.3. Product Portfolio
- 11.15.4. SWOT Analysis
- 11.15.5. Key Strategies and Developments
- 11.16. SIMEC Atlantis Energy
- 11.16.1. Company Overview
- 11.16.2. Financial Highlights
- 11.16.3. Product Portfolio
- 11.16.4. SWOT Analysis
- 11.16.5. Key Strategies and Developments
- 11.17. Oscilla Power, Inc.
- 11.17.1. Company Overview
- 11.17.2. Financial Highlights
- 11.17.3. Product Portfolio
- 11.17.4. SWOT Analysis
- 11.17.5. Key Strategies and Developments
- 11.18. Aqua-Magnetics, Inc.
- 11.18.1. Company Overview
- 11.18.2. Financial Highlights
- 11.18.3. Product Portfolio
- 11.18.4. SWOT Analysis
- 11.18.5. Key Strategies and Developments
- 11.19. Carnegie Wave Energy Ltd.
- 11.19.1. Company Overview
- 11.19.2. Financial Highlights
- 11.19.3. Product Portfolio
- 11.19.4. SWOT Analysis
- 11.19.5. Key Strategies and Developments
- 11.20. D.E. Energy Ltd.
- 11.20.1. Company Overview
- 11.20.2. Financial Highlights
- 11.20.3. Product Portfolio
- 11.20.4. SWOT Analysis
- 11.20.5. Key Strategies and Developments
- 11.21. Atargis Energy Corporation
- 11.21.1. Company Overview
- 11.21.2. Financial Highlights
- 11.21.3. Product Portfolio
- 11.21.4. SWOT Analysis
- 11.21.5. Key Strategies and Developments
- 11.22. Blue Energy Canada, Inc.
- 11.22.1. Company Overview
- 11.22.2. Financial Highlights
- 11.22.3. Product Portfolio
- 11.22.4. SWOT Analysis
- 11.22.5. Key Strategies and Developments
- 12. Assumptions and Acronyms
- 13. Research Methodology
- 14. Contact
"
- List of Figures
- "
- Figure 1: Global Marine Renewable Energy Market Revenue (US$ Mn) Market Share by By Type in 2022
- Figure 2: Global Marine Renewable Energy Market Market Attractiveness Analysis by By Type, 2016-2032
- Figure 3: Global Marine Renewable Energy Market Revenue (US$ Mn) Market Share by By Applicationin 2022
- Figure 4: Global Marine Renewable Energy Market Market Attractiveness Analysis by By Application, 2016-2032
- Figure 5: Global Marine Renewable Energy Market Revenue (US$ Mn) Market Share by Region in 2022
- Figure 6: Global Marine Renewable Energy Market Market Attractiveness Analysis by Region, 2016-2032
- Figure 7: Global Marine Renewable Energy Market Market Revenue (US$ Mn) (2016-2032)
- Figure 8: Global Marine Renewable Energy Market Market Revenue (US$ Mn) Comparison by Region (2016-2032)
- Figure 9: Global Marine Renewable Energy Market Market Revenue (US$ Mn) Comparison by By Type (2016-2032)
- Figure 10: Global Marine Renewable Energy Market Market Revenue (US$ Mn) Comparison by By Application (2016-2032)
- Figure 11: Global Marine Renewable Energy Market Market Y-o-Y Growth Rate Comparison by Region (2016-2032)
- Figure 12: Global Marine Renewable Energy Market Market Y-o-Y Growth Rate Comparison by By Type (2016-2032)
- Figure 13: Global Marine Renewable Energy Market Market Y-o-Y Growth Rate Comparison by By Application (2016-2032)
- Figure 14: Global Marine Renewable Energy Market Market Share Comparison by Region (2016-2032)
- Figure 15: Global Marine Renewable Energy Market Market Share Comparison by By Type (2016-2032)
- Figure 16: Global Marine Renewable Energy Market Market Share Comparison by By Application (2016-2032)
- Figure 17: North America Marine Renewable Energy Market Revenue (US$ Mn) Market Share by By Typein 2022
- Figure 18: North America Marine Renewable Energy Market Market Attractiveness Analysis by By Type, 2016-2032
- Figure 19: North America Marine Renewable Energy Market Revenue (US$ Mn) Market Share by By Applicationin 2022
- Figure 20: North America Marine Renewable Energy Market Market Attractiveness Analysis by By Application, 2016-2032
- Figure 21: North America Marine Renewable Energy Market Revenue (US$ Mn) Market Share by Country in 2022
- Figure 22: North America Marine Renewable Energy Market Market Attractiveness Analysis by Country, 2016-2032
- Figure 23: North America Marine Renewable Energy Market Market Revenue (US$ Mn) (2016-2032)
- Figure 24: North America Marine Renewable Energy Market Market Revenue (US$ Mn) Comparison by Country (2016-2032)
- Figure 25: North America Marine Renewable Energy Market Market Revenue (US$ Mn) Comparison by By Type (2016-2032)
- Figure 26: North America Marine Renewable Energy Market Market Revenue (US$ Mn) Comparison by By Application (2016-2032)
- Figure 27: North America Marine Renewable Energy Market Market Y-o-Y Growth Rate Comparison by Country (2016-2032)
- Figure 28: North America Marine Renewable Energy Market Market Y-o-Y Growth Rate Comparison by By Type (2016-2032)
- Figure 29: North America Marine Renewable Energy Market Market Y-o-Y Growth Rate Comparison by By Application (2016-2032)
- Figure 30: North America Marine Renewable Energy Market Market Share Comparison by Country (2016-2032)
- Figure 31: North America Marine Renewable Energy Market Market Share Comparison by By Type (2016-2032)
- Figure 32: North America Marine Renewable Energy Market Market Share Comparison by By Application (2016-2032)
- Figure 33: Western Europe Marine Renewable Energy Market Revenue (US$ Mn) Market Share by By Typein 2022
- Figure 34: Western Europe Marine Renewable Energy Market Market Attractiveness Analysis by By Type, 2016-2032
- Figure 35: Western Europe Marine Renewable Energy Market Revenue (US$ Mn) Market Share by By Applicationin 2022
- Figure 36: Western Europe Marine Renewable Energy Market Market Attractiveness Analysis by By Application, 2016-2032
- Figure 37: Western Europe Marine Renewable Energy Market Revenue (US$ Mn) Market Share by Country in 2022
- Figure 38: Western Europe Marine Renewable Energy Market Market Attractiveness Analysis by Country, 2016-2032
- Figure 39: Western Europe Marine Renewable Energy Market Market Revenue (US$ Mn) (2016-2032)
- Figure 40: Western Europe Marine Renewable Energy Market Market Revenue (US$ Mn) Comparison by Country (2016-2032)
- Figure 41: Western Europe Marine Renewable Energy Market Market Revenue (US$ Mn) Comparison by By Type (2016-2032)
- Figure 42: Western Europe Marine Renewable Energy Market Market Revenue (US$ Mn) Comparison by By Application (2016-2032)
- Figure 43: Western Europe Marine Renewable Energy Market Market Y-o-Y Growth Rate Comparison by Country (2016-2032)
- Figure 44: Western Europe Marine Renewable Energy Market Market Y-o-Y Growth Rate Comparison by By Type (2016-2032)
- Figure 45: Western Europe Marine Renewable Energy Market Market Y-o-Y Growth Rate Comparison by By Application (2016-2032)
- Figure 46: Western Europe Marine Renewable Energy Market Market Share Comparison by Country (2016-2032)
- Figure 47: Western Europe Marine Renewable Energy Market Market Share Comparison by By Type (2016-2032)
- Figure 48: Western Europe Marine Renewable Energy Market Market Share Comparison by By Application (2016-2032)
- Figure 49: Eastern Europe Marine Renewable Energy Market Revenue (US$ Mn) Market Share by By Typein 2022
- Figure 50: Eastern Europe Marine Renewable Energy Market Market Attractiveness Analysis by By Type, 2016-2032
- Figure 51: Eastern Europe Marine Renewable Energy Market Revenue (US$ Mn) Market Share by By Applicationin 2022
- Figure 52: Eastern Europe Marine Renewable Energy Market Market Attractiveness Analysis by By Application, 2016-2032
- Figure 53: Eastern Europe Marine Renewable Energy Market Revenue (US$ Mn) Market Share by Country in 2022
- Figure 54: Eastern Europe Marine Renewable Energy Market Market Attractiveness Analysis by Country, 2016-2032
- Figure 55: Eastern Europe Marine Renewable Energy Market Market Revenue (US$ Mn) (2016-2032)
- Figure 56: Eastern Europe Marine Renewable Energy Market Market Revenue (US$ Mn) Comparison by Country (2016-2032)
- Figure 57: Eastern Europe Marine Renewable Energy Market Market Revenue (US$ Mn) Comparison by By Type (2016-2032)
- Figure 58: Eastern Europe Marine Renewable Energy Market Market Revenue (US$ Mn) Comparison by By Application (2016-2032)
- Figure 59: Eastern Europe Marine Renewable Energy Market Market Y-o-Y Growth Rate Comparison by Country (2016-2032)
- Figure 60: Eastern Europe Marine Renewable Energy Market Market Y-o-Y Growth Rate Comparison by By Type (2016-2032)
- Figure 61: Eastern Europe Marine Renewable Energy Market Market Y-o-Y Growth Rate Comparison by By Application (2016-2032)
- Figure 62: Eastern Europe Marine Renewable Energy Market Market Share Comparison by Country (2016-2032)
- Figure 63: Eastern Europe Marine Renewable Energy Market Market Share Comparison by By Type (2016-2032)
- Figure 64: Eastern Europe Marine Renewable Energy Market Market Share Comparison by By Application (2016-2032)
- Figure 65: APAC Marine Renewable Energy Market Revenue (US$ Mn) Market Share by By Typein 2022
- Figure 66: APAC Marine Renewable Energy Market Market Attractiveness Analysis by By Type, 2016-2032
- Figure 67: APAC Marine Renewable Energy Market Revenue (US$ Mn) Market Share by By Applicationin 2022
- Figure 68: APAC Marine Renewable Energy Market Market Attractiveness Analysis by By Application, 2016-2032
- Figure 69: APAC Marine Renewable Energy Market Revenue (US$ Mn) Market Share by Country in 2022
- Figure 70: APAC Marine Renewable Energy Market Market Attractiveness Analysis by Country, 2016-2032
- Figure 71: APAC Marine Renewable Energy Market Market Revenue (US$ Mn) (2016-2032)
- Figure 72: APAC Marine Renewable Energy Market Market Revenue (US$ Mn) Comparison by Country (2016-2032)
- Figure 73: APAC Marine Renewable Energy Market Market Revenue (US$ Mn) Comparison by By Type (2016-2032)
- Figure 74: APAC Marine Renewable Energy Market Market Revenue (US$ Mn) Comparison by By Application (2016-2032)
- Figure 75: APAC Marine Renewable Energy Market Market Y-o-Y Growth Rate Comparison by Country (2016-2032)
- Figure 76: APAC Marine Renewable Energy Market Market Y-o-Y Growth Rate Comparison by By Type (2016-2032)
- Figure 77: APAC Marine Renewable Energy Market Market Y-o-Y Growth Rate Comparison by By Application (2016-2032)
- Figure 78: APAC Marine Renewable Energy Market Market Share Comparison by Country (2016-2032)
- Figure 79: APAC Marine Renewable Energy Market Market Share Comparison by By Type (2016-2032)
- Figure 80: APAC Marine Renewable Energy Market Market Share Comparison by By Application (2016-2032)
- Figure 81: Latin America Marine Renewable Energy Market Revenue (US$ Mn) Market Share by By Typein 2022
- Figure 82: Latin America Marine Renewable Energy Market Market Attractiveness Analysis by By Type, 2016-2032
- Figure 83: Latin America Marine Renewable Energy Market Revenue (US$ Mn) Market Share by By Applicationin 2022
- Figure 84: Latin America Marine Renewable Energy Market Market Attractiveness Analysis by By Application, 2016-2032
- Figure 85: Latin America Marine Renewable Energy Market Revenue (US$ Mn) Market Share by Country in 2022
- Figure 86: Latin America Marine Renewable Energy Market Market Attractiveness Analysis by Country, 2016-2032
- Figure 87: Latin America Marine Renewable Energy Market Market Revenue (US$ Mn) (2016-2032)
- Figure 88: Latin America Marine Renewable Energy Market Market Revenue (US$ Mn) Comparison by Country (2016-2032)
- Figure 89: Latin America Marine Renewable Energy Market Market Revenue (US$ Mn) Comparison by By Type (2016-2032)
- Figure 90: Latin America Marine Renewable Energy Market Market Revenue (US$ Mn) Comparison by By Application (2016-2032)
- Figure 91: Latin America Marine Renewable Energy Market Market Y-o-Y Growth Rate Comparison by Country (2016-2032)
- Figure 92: Latin America Marine Renewable Energy Market Market Y-o-Y Growth Rate Comparison by By Type (2016-2032)
- Figure 93: Latin America Marine Renewable Energy Market Market Y-o-Y Growth Rate Comparison by By Application (2016-2032)
- Figure 94: Latin America Marine Renewable Energy Market Market Share Comparison by Country (2016-2032)
- Figure 95: Latin America Marine Renewable Energy Market Market Share Comparison by By Type (2016-2032)
- Figure 96: Latin America Marine Renewable Energy Market Market Share Comparison by By Application (2016-2032)
- Figure 97: Middle East & Africa Marine Renewable Energy Market Revenue (US$ Mn) Market Share by By Typein 2022
- Figure 98: Middle East & Africa Marine Renewable Energy Market Market Attractiveness Analysis by By Type, 2016-2032
- Figure 99: Middle East & Africa Marine Renewable Energy Market Revenue (US$ Mn) Market Share by By Applicationin 2022
- Figure 100: Middle East & Africa Marine Renewable Energy Market Market Attractiveness Analysis by By Application, 2016-2032
- Figure 101: Middle East & Africa Marine Renewable Energy Market Revenue (US$ Mn) Market Share by Country in 2022
- Figure 102: Middle East & Africa Marine Renewable Energy Market Market Attractiveness Analysis by Country, 2016-2032
- Figure 103: Middle East & Africa Marine Renewable Energy Market Market Revenue (US$ Mn) (2016-2032)
- Figure 104: Middle East & Africa Marine Renewable Energy Market Market Revenue (US$ Mn) Comparison by Country (2016-2032)
- Figure 105: Middle East & Africa Marine Renewable Energy Market Market Revenue (US$ Mn) Comparison by By Type (2016-2032)
- Figure 106: Middle East & Africa Marine Renewable Energy Market Market Revenue (US$ Mn) Comparison by By Application (2016-2032)
- Figure 107: Middle East & Africa Marine Renewable Energy Market Market Y-o-Y Growth Rate Comparison by Country (2016-2032)
- Figure 108: Middle East & Africa Marine Renewable Energy Market Market Y-o-Y Growth Rate Comparison by By Type (2016-2032)
- Figure 109: Middle East & Africa Marine Renewable Energy Market Market Y-o-Y Growth Rate Comparison by By Application (2016-2032)
- Figure 110: Middle East & Africa Marine Renewable Energy Market Market Share Comparison by Country (2016-2032)
- Figure 111: Middle East & Africa Marine Renewable Energy Market Market Share Comparison by By Type (2016-2032)
- Figure 112: Middle East & Africa Marine Renewable Energy Market Market Share Comparison by By Application (2016-2032)
"
- List of Tables
- "
- Table 1: Global Marine Renewable Energy Market Market Comparison by By Type (2016-2032)
- Table 2: Global Marine Renewable Energy Market Market Comparison by By Application (2016-2032)
- Table 3: Global Marine Renewable Energy Market Revenue (US$ Mn) Comparison by Region (2016-2032)
- Table 4: Global Marine Renewable Energy Market Market Revenue (US$ Mn) (2016-2032)
- Table 5: Global Marine Renewable Energy Market Market Revenue (US$ Mn) Comparison by Region (2016-2032)
- Table 6: Global Marine Renewable Energy Market Market Revenue (US$ Mn) Comparison by By Type (2016-2032)
- Table 7: Global Marine Renewable Energy Market Market Revenue (US$ Mn) Comparison by By Application (2016-2032)
- Table 8: Global Marine Renewable Energy Market Market Y-o-Y Growth Rate Comparison by Region (2016-2032)
- Table 9: Global Marine Renewable Energy Market Market Y-o-Y Growth Rate Comparison by By Type (2016-2032)
- Table 10: Global Marine Renewable Energy Market Market Y-o-Y Growth Rate Comparison by By Application (2016-2032)
- Table 11: Global Marine Renewable Energy Market Market Share Comparison by Region (2016-2032)
- Table 12: Global Marine Renewable Energy Market Market Share Comparison by By Type (2016-2032)
- Table 13: Global Marine Renewable Energy Market Market Share Comparison by By Application (2016-2032)
- Table 14: North America Marine Renewable Energy Market Market Comparison by By Application (2016-2032)
- Table 15: North America Marine Renewable Energy Market Revenue (US$ Mn) Comparison by Country (2016-2032)
- Table 16: North America Marine Renewable Energy Market Market Revenue (US$ Mn) (2016-2032)
- Table 17: North America Marine Renewable Energy Market Market Revenue (US$ Mn) Comparison by Country (2016-2032)
- Table 18: North America Marine Renewable Energy Market Market Revenue (US$ Mn) Comparison by By Type (2016-2032)
- Table 19: North America Marine Renewable Energy Market Market Revenue (US$ Mn) Comparison by By Application (2016-2032)
- Table 20: North America Marine Renewable Energy Market Market Y-o-Y Growth Rate Comparison by Country (2016-2032)
- Table 21: North America Marine Renewable Energy Market Market Y-o-Y Growth Rate Comparison by By Type (2016-2032)
- Table 22: North America Marine Renewable Energy Market Market Y-o-Y Growth Rate Comparison by By Application (2016-2032)
- Table 23: North America Marine Renewable Energy Market Market Share Comparison by Country (2016-2032)
- Table 24: North America Marine Renewable Energy Market Market Share Comparison by By Type (2016-2032)
- Table 25: North America Marine Renewable Energy Market Market Share Comparison by By Application (2016-2032)
- Table 26: Western Europe Marine Renewable Energy Market Market Comparison by By Type (2016-2032)
- Table 27: Western Europe Marine Renewable Energy Market Market Comparison by By Application (2016-2032)
- Table 28: Western Europe Marine Renewable Energy Market Revenue (US$ Mn) Comparison by Country (2016-2032)
- Table 29: Western Europe Marine Renewable Energy Market Market Revenue (US$ Mn) (2016-2032)
- Table 30: Western Europe Marine Renewable Energy Market Market Revenue (US$ Mn) Comparison by Country (2016-2032)
- Table 31: Western Europe Marine Renewable Energy Market Market Revenue (US$ Mn) Comparison by By Type (2016-2032)
- Table 32: Western Europe Marine Renewable Energy Market Market Revenue (US$ Mn) Comparison by By Application (2016-2032)
- Table 33: Western Europe Marine Renewable Energy Market Market Y-o-Y Growth Rate Comparison by Country (2016-2032)
- Table 34: Western Europe Marine Renewable Energy Market Market Y-o-Y Growth Rate Comparison by By Type (2016-2032)
- Table 35: Western Europe Marine Renewable Energy Market Market Y-o-Y Growth Rate Comparison by By Application (2016-2032)
- Table 36: Western Europe Marine Renewable Energy Market Market Share Comparison by Country (2016-2032)
- Table 37: Western Europe Marine Renewable Energy Market Market Share Comparison by By Type (2016-2032)
- Table 38: Western Europe Marine Renewable Energy Market Market Share Comparison by By Application (2016-2032)
- Table 39: Eastern Europe Marine Renewable Energy Market Market Comparison by By Type (2016-2032)
- Table 40: Eastern Europe Marine Renewable Energy Market Market Comparison by By Application (2016-2032)
- Table 41: Eastern Europe Marine Renewable Energy Market Revenue (US$ Mn) Comparison by Country (2016-2032)
- Table 42: Eastern Europe Marine Renewable Energy Market Market Revenue (US$ Mn) (2016-2032)
- Table 43: Eastern Europe Marine Renewable Energy Market Market Revenue (US$ Mn) Comparison by Country (2016-2032)
- Table 44: Eastern Europe Marine Renewable Energy Market Market Revenue (US$ Mn) Comparison by By Type (2016-2032)
- Table 45: Eastern Europe Marine Renewable Energy Market Market Revenue (US$ Mn) Comparison by By Application (2016-2032)
- Table 46: Eastern Europe Marine Renewable Energy Market Market Y-o-Y Growth Rate Comparison by Country (2016-2032)
- Table 47: Eastern Europe Marine Renewable Energy Market Market Y-o-Y Growth Rate Comparison by By Type (2016-2032)
- Table 48: Eastern Europe Marine Renewable Energy Market Market Y-o-Y Growth Rate Comparison by By Application (2016-2032)
- Table 49: Eastern Europe Marine Renewable Energy Market Market Share Comparison by Country (2016-2032)
- Table 50: Eastern Europe Marine Renewable Energy Market Market Share Comparison by By Type (2016-2032)
- Table 51: Eastern Europe Marine Renewable Energy Market Market Share Comparison by By Application (2016-2032)
- Table 52: APAC Marine Renewable Energy Market Market Comparison by By Type (2016-2032)
- Table 53: APAC Marine Renewable Energy Market Market Comparison by By Application (2016-2032)
- Table 54: APAC Marine Renewable Energy Market Revenue (US$ Mn) Comparison by Country (2016-2032)
- Table 55: APAC Marine Renewable Energy Market Market Revenue (US$ Mn) (2016-2032)
- Table 56: APAC Marine Renewable Energy Market Market Revenue (US$ Mn) Comparison by Country (2016-2032)
- Table 57: APAC Marine Renewable Energy Market Market Revenue (US$ Mn) Comparison by By Type (2016-2032)
- Table 58: APAC Marine Renewable Energy Market Market Revenue (US$ Mn) Comparison by By Application (2016-2032)
- Table 59: APAC Marine Renewable Energy Market Market Y-o-Y Growth Rate Comparison by Country (2016-2032)
- Table 60: APAC Marine Renewable Energy Market Market Y-o-Y Growth Rate Comparison by By Type (2016-2032)
- Table 61: APAC Marine Renewable Energy Market Market Y-o-Y Growth Rate Comparison by By Application (2016-2032)
- Table 62: APAC Marine Renewable Energy Market Market Share Comparison by Country (2016-2032)
- Table 63: APAC Marine Renewable Energy Market Market Share Comparison by By Type (2016-2032)
- Table 64: APAC Marine Renewable Energy Market Market Share Comparison by By Application (2016-2032)
- Table 65: Latin America Marine Renewable Energy Market Market Comparison by By Type (2016-2032)
- Table 66: Latin America Marine Renewable Energy Market Market Comparison by By Application (2016-2032)
- Table 67: Latin America Marine Renewable Energy Market Revenue (US$ Mn) Comparison by Country (2016-2032)
- Table 68: Latin America Marine Renewable Energy Market Market Revenue (US$ Mn) (2016-2032)
- Table 69: Latin America Marine Renewable Energy Market Market Revenue (US$ Mn) Comparison by Country (2016-2032)
- Table 70: Latin America Marine Renewable Energy Market Market Revenue (US$ Mn) Comparison by By Type (2016-2032)
- Table 71: Latin America Marine Renewable Energy Market Market Revenue (US$ Mn) Comparison by By Application (2016-2032)
- Table 72: Latin America Marine Renewable Energy Market Market Y-o-Y Growth Rate Comparison by Country (2016-2032)
- Table 73: Latin America Marine Renewable Energy Market Market Y-o-Y Growth Rate Comparison by By Type (2016-2032)
- Table 74: Latin America Marine Renewable Energy Market Market Y-o-Y Growth Rate Comparison by By Application (2016-2032)
- Table 75: Latin America Marine Renewable Energy Market Market Share Comparison by Country (2016-2032)
- Table 76: Latin America Marine Renewable Energy Market Market Share Comparison by By Type (2016-2032)
- Table 77: Latin America Marine Renewable Energy Market Market Share Comparison by By Application (2016-2032)
- Table 78: Middle East & Africa Marine Renewable Energy Market Market Comparison by By Type (2016-2032)
- Table 79: Middle East & Africa Marine Renewable Energy Market Market Comparison by By Application (2016-2032)
- Table 80: Middle East & Africa Marine Renewable Energy Market Revenue (US$ Mn) Comparison by Country (2016-2032)
- Table 81: Middle East & Africa Marine Renewable Energy Market Market Revenue (US$ Mn) (2016-2032)
- Table 82: Middle East & Africa Marine Renewable Energy Market Market Revenue (US$ Mn) Comparison by Country (2016-2032)
- Table 83: Middle East & Africa Marine Renewable Energy Market Market Revenue (US$ Mn) Comparison by By Type (2016-2032)
- Table 84: Middle East & Africa Marine Renewable Energy Market Market Revenue (US$ Mn) Comparison by By Application (2016-2032)
- Table 85: Middle East & Africa Marine Renewable Energy Market Market Y-o-Y Growth Rate Comparison by Country (2016-2032)
- Table 86: Middle East & Africa Marine Renewable Energy Market Market Y-o-Y Growth Rate Comparison by By Type (2016-2032)
- Table 87: Middle East & Africa Marine Renewable Energy Market Market Y-o-Y Growth Rate Comparison by By Application (2016-2032)
- Table 88: Middle East & Africa Marine Renewable Energy Market Market Share Comparison by Country (2016-2032)
- Table 89: Middle East & Africa Marine Renewable Energy Market Market Share Comparison by By Type (2016-2032)
- Table 90: Middle East & Africa Marine Renewable Energy Market Market Share Comparison by By Application (2016-2032)
- 1. Executive Summary
-
- Ocean Power Technologies
- Minesto AB
- Atlantis Resources
- Carnegie Clean Energy
- Hello
- CorPower Ocean
- Ocean Renewable Power Company
- Aquamarine Power
- Sea-based
- BioPower Systems
- AW-Energy
- Magallanes Renovables
- Orbital Marine Power
- SIMEC Atlantis Energy
- Oscilla Power, Inc.
- Aqua-Magnetics, Inc.
- Carnegie Wave Energy Ltd.
- D.E. Energy Ltd.
- Atargis Energy Corporation
- Blue Energy Canada, Inc.
Our Clients


View Our Licence Options
