
Industry 5.0 Market By End-User(Manufacturing, Healthcare, Others), By Technology(Artificial Intelligence, Internet of Things (IoT), Others), By Size of Enterprise(Small and Medium Enterprises (SMEs), Large Enterprises, Others), By Region And Companies - Industry Segment Outlook, Market Assessment, Competition Scenario, Trends, And Forecast 2023-2032
-
40674
-
Aug 2023
-
180
-


-
This report was compiled by Vishwa Gaul Vishwa is an experienced market research and consulting professional with over 8 years of expertise in the ICT industry, contributing to over 700 reports across telecommunications, software, hardware, and digital solutions. Correspondence Team Lead- ICT Linkedin | Detailed Market research Methodology Our methodology involves a mix of primary research, including interviews with leading mental health experts, and secondary research from reputable medical journals and databases. View Detailed Methodology Page
-
Quick Navigation
Report Overview
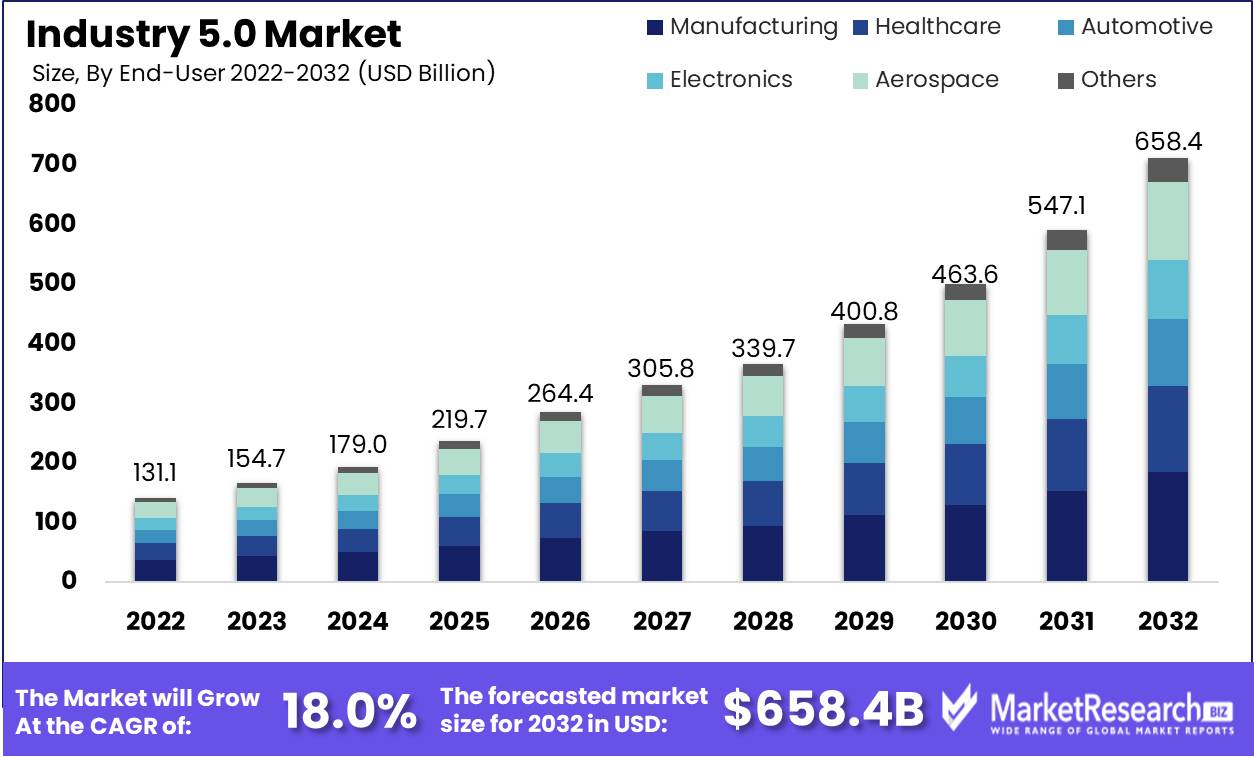
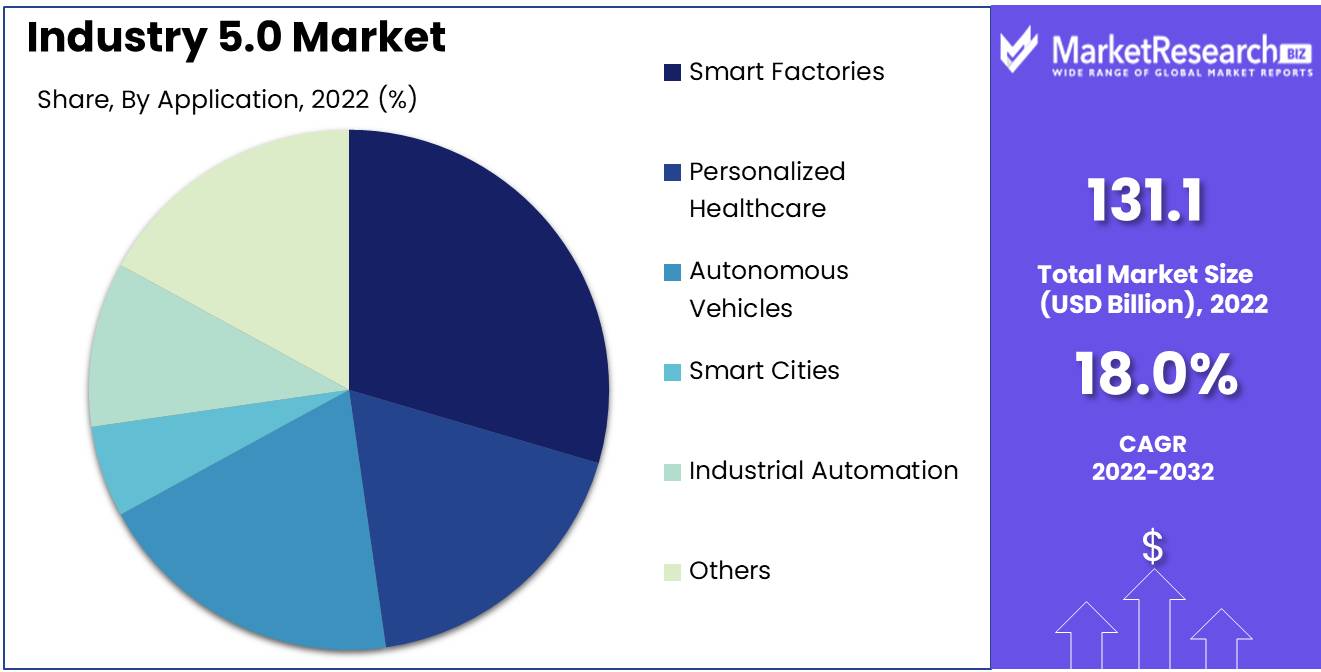
Industry 5.0 Market size is expected to be worth around USD 658.4 Bn by 2032 from USD 131.13 Bn in 2022, growing at a CAGR of 18.0% during the forecast period from 2023 to 2032.
Industry 5.0 refers to the Fifth Industrial Revolution focused on creating a smarter, more customized and service-oriented manufacturing framework. While past industrial revolutions were centered on mechanization, mass production, and automation, Industry 5.0 aims to enhance productivity and economic growth through the convergence of cutting-edge technologies like artificial intelligence, big data analytics, cloud computing, robotics, augmented reality, additive manufacturing, and the Internet of Things (IoT).
The core pillars of Industry 5.0 are interconnectivity, information transparency, technical assistance and on-demand production. Interconnectivity via 5G and the IoT allows all machines, parts and systems to seamlessly communicate with each other in real-time. Information transparency means all relevant data is visible to every stakeholder across the value chain, enabling data-driven decision-making. Technical assistance from AI and advanced robotics gives human workers augmented capabilities. On-demand production via flexible, intelligent, and distributed manufacturing networks allows for mass customization aligned with customer needs.
Industry 5.0 enables the transition from mass production to lot size one, where every customer can get personalized products and services. It will lead to digitalized, self-optimizing smart factories that continuously improve processes through machine learning. Production will shift from centralized facilities to distributed nodes close to the end user. The human role will evolve from active operator to supervisor, with technologies assisting people. Work will focus on creative tasks rather than repetitive activities.
Driving factors
Advances in artificial intelligence and machine learning
Recent breakthroughs in AI and ML algorithms allow manufacturing systems to continuously optimize processes by identifying patterns in vast datasets. Machine vision enables automated quality inspection. Predictive maintenance reduces downtime via condition monitoring. smart robots can adapt to new tasks. AI is making production more efficient, flexible, and autonomous.
Growth of the Industrial Internet of Things
The IIoT allows all devices, smart machines, and assets on the factory floor to be interconnected via sensors, actuators and data communication technology. This creates a smart manufacturing environment with ubiquitous connectivity for data sharing. Real-time asset monitoring, remote control, and system-wide visibility enable faster data-driven decisions and process improvements.
Demand for mass customization
Customer expectations are shifting towards personalized products versus one-size-fits-all. Modular product designs, flexible manufacturing cells and additive techniques allow the production of customized products at scale. With lot size one manufacturing enabled by Industry 5.0, companies can align production directly with individual customer needs and on-demand orders. This allows new business models based on customization.
Restraining Factors
Data Security Concerns
In today's data-driven world, organizations adopting Industry 5.0 face security risks. Interconnected systems produce exponential data growth. Ensuring confidentiality and integrity is critical yet challenging. Potential breaches endanger finances, reputation, and legal standing. Comprehensive security like encryption, firewalls, and audits is essential. Regular assessments and training will also help secure data as organizations embrace Industry 5.0.
Lack of Skilled Workers
The talent shortage hinders Industry 5.0 adoption. Advanced technologies require workers able to operate, manage and optimize complex systems. But qualified labor able to leverage Industry 5.0 is scarce. Collaboration between educators, industry, and government can help. Educational institutes must update curricula to develop relevant skills. Specialized training programs, apprenticeships and certifications can also help fill the gap. Attractive packages and stimulating work environments will aid recruitment and retention. With coordinated efforts to build skilled workforces, the immense potential of Industry 5.0 can be realized.
End-User Analysis
The manufacturing segment drives Industry 5.0 adoption through integrating advanced technologies to enhance productivity, efficiency and processes. Manufacturing industries like automotive, electronics and aerospace are embracing Industry 5.0. Key factors propelling this include emerging market industrialization and technological advancement. These economies are investing heavily in Industry 5.0 to stay competitive globally.
Consumer awareness and demand for quality, customization and sustainability also boost manufacturing adoption of Industry 5.0. Technologies like robotics, IoT and big data allow manufacturers to meet consumer expectations. The manufacturing segment will see the fastest Industry 5.0 growth due to increased operational efficiency and productivity from technologies like automation. AI integration also optimizes processes through predictive maintenance and real-time monitoring. The rise of smart factories leveraging IoT, cloud computing and cyber-physical systems will further drive manufacturing Industry 5.0 growth.
Technology Analysis
AI drives Industry 5.0 transformation by automating tasks, analyzing data and enabling intelligent decisions. This includes machine learning, natural language processing and computer vision. Economic growth in emerging markets also propels AI adoption to enhance productivity, customer experience and competitiveness. Increasing data availability, computing power and R&D investments further fuel AI Industry 5.0 growth.
Evolving consumer demand for personalized, intelligent experiences across sectors also spurs AI adoption. AI analysis of customer data provides customized offerings and automated interactions for improved satisfaction. The AI segment will see the fastest Industry 5.0 growth given its potential to optimize processes, identify insights in big data and integrate with other technologies for interconnected, intelligent systems.
Application Analysis
Smart factories are revolutionizing manufacturing through advanced technologies enabling a connected, intelligent ecosystem. Applications span automotive, electronics, pharmaceuticals and food production. Economic growth in emerging markets drives smart factory adoption to boost industrial capabilities and global competitiveness.
Consumer demand for quick delivery, customization and sustainability also influences smart factory Industry 5.0 growth. Advanced technologies meet customer expectations through real-time monitoring, efficient allocation and optimized production. Smart factory growth will be fastest given factors like predictive maintenance from IoT devices, enhanced efficiency from automation, and optimized processes from AI and advanced analytics.
Key Market Segments
By End-User
- Manufacturing
- Healthcare
- Automotive
- Electronics
- Aerospace
- Others
By Technology
- Artificial Intelligence
- Internet of Things (IoT)
- Robotics
- Virtual Reality (VR) and Augmented Reality (AR)
- 3D Printing
- Others
By Size of Enterprise
- Small and Medium Enterprises (SMEs)
- Large Enterprises
By Application
- Smart Factories
- Personalized Healthcare
- Autonomous Vehicles
- Smart Cities
- Industrial Automation
- Others
By Industry Vertical
- Manufacturing and Production
- Healthcare and Life Sciences
- Transportation and Logistics
- Retail and Consumer Goods
- Energy and Utilities
- Others
Growth Opportunity
Advanced Robotics and Automation
One major growth opportunity in the Industry 5.0 market is advanced robotics and automation. As manufacturing and supply chains become more complex, there will be increasing demand for robotic systems that can work collaboratively with human workers to improve productivity and quality. Key areas of innovation include human-robot collaboration, autonomous mobile robots, modular robotics, and the use of AI to enable more flexible and intelligent automation. Market growth will be driven by the need for mass customization, faster changeovers, and the ability to automate complex tasks. Companies that provide advanced robotic solutions tailored for smart factories, along with associated software, will see substantial opportunities in this market.
AI and Big Data Analytics
The application of AI and advanced data analytics will be a crucial enabler of the autonomous, self-optimizing production systems that define Industry 5.0. There will be strong demand for AI solutions applied to areas like predictive maintenance, supply chain optimization, industrial IoT, and the modeling of complex manufacturing processes. Big data platforms that can gather, analyze, and translate vast amounts of real-time data from smart factories into actionable insights will provide companies with competitive advantages. Firms that provide robust industrial IoT solutions combined with AI and analytics capabilities will be well-positioned to benefit from this market growth. Data-driven AI and analytics solutions will become an indispensable part of the smart, connected factories of the future.
AR/VR for Next-Gen Interfaces
Another major growth area is AR/VR technology for immersive, next-generation human-machine interfaces. Industry 5.0 production environments will rely on AR/VR to provide workers with real-time operational data in context. This technology can also facilitate remote collaboration and training. Demand will rise for AR/VR interfaces that are ergonomic, intuitive, and tailored to complex industrial use cases. Companies that leverage AR/VR to improve human productivity and efficiency in smart factories will reap significant benefits. With advances in wearables and connectivity, AR/VR-enabled smart interfaces for humans working alongside intelligent machines will become a vital component of the Industry 5.0 ecosystem.
Latest Trends
Transition to Service-Based Business Models
There will be a major shift from traditional machinery sales to "Machinery-as-a-Service" business models. Rather than selling equipment, manufacturers will retain ownership and charge usage fees. This aligns incentives for suppliers to provide predictive maintenance and optimize performance over the lifetime of machinery. It also reduces capital expenditures for manufacturers. More flexible, service-centric business models will be a defining trend.
Democratization of Advanced Manufacturing
Maker spaces, fablabs, cloud manufacturing, and production-as-a-service will democratize access to advanced manufacturing capabilities. Small businesses will be able to leverage networked manufacturing platforms to rapidly prototype, test, and scale production. This will disrupt traditional economies of scale in manufacturing and open up opportunities for micro-factories. Democratized production will be a key trend.
Sustainable Manufacturing Focus
With concerns about climate change growing, manufacturers will be under pressure to dramatically improve sustainability. The focus will be on innovations that optimize energy, reduce waste, and create circular production systems. Life cycle analysis and meeting evolving sustainability regulations will also become more prominent. The trend toward environmentally sound manufacturing practices will only accelerate.
Regional Analysis
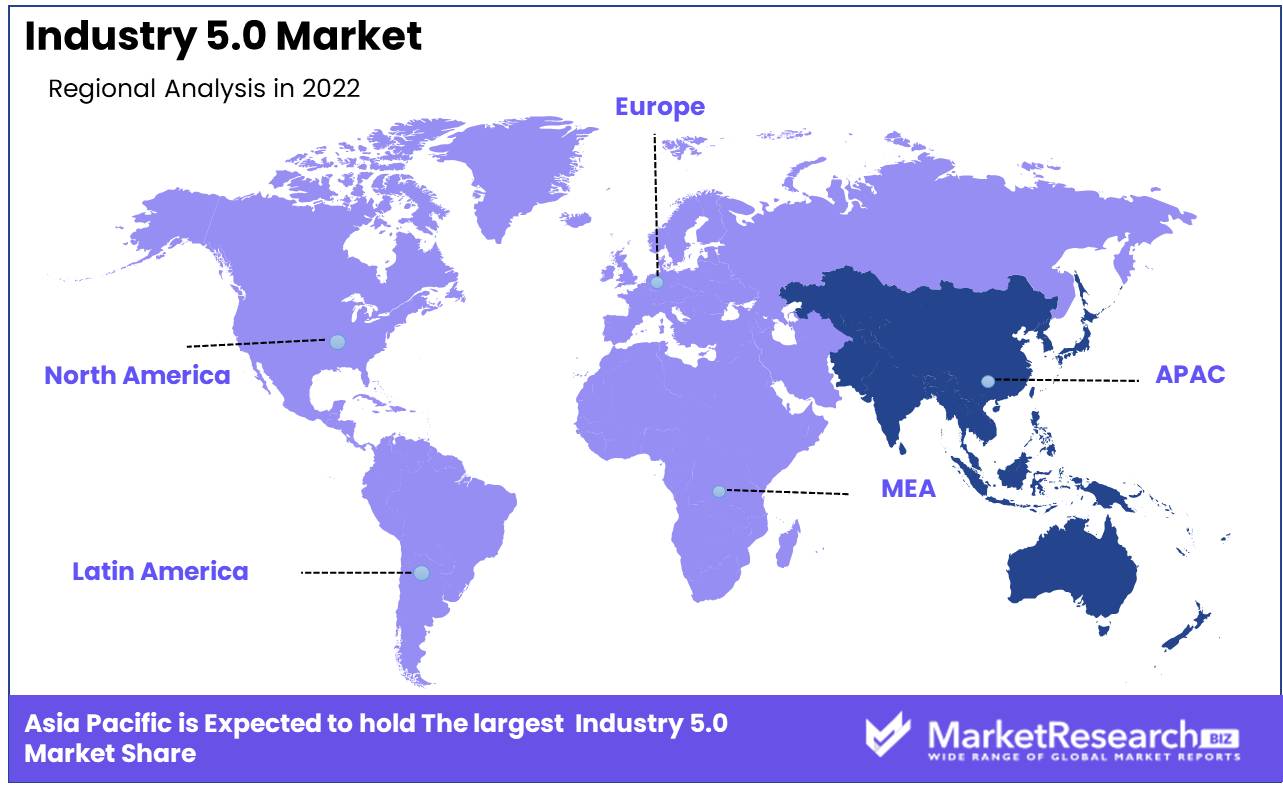
The Asia-Pacific region Dominates the Industry 5.0 Market, driven by its economic might, manufacturing capabilities, technological leadership, government initiatives, and collaborative ecosystems. Major economies like China, Japan, India, and South Korea possess immense market potential and extensive infrastructures to support Industry 5.0. Their strengths in technologies like robotics, AI, and automation strategically position them as pioneers.
The region has been at the forefront of groundbreaking R&D and innovations in 5G, IoT, big data, and machine learning. Such technological advancements enable the connectivity and automation that are central to Industry 5.0. Governments have implemented policies and programs like "Made in China 2025" and "Society 5.0" to catalyze Industry 5.0 adoption. These demonstrate the region's commitment to fostering supportive ecosystems.
Collaborative partnerships between businesses, academia, and research institutions drive innovation and knowledge exchange. This collaborative culture enhances the region's competitive edge globally. Surging demand for digitization across manufacturing, healthcare, logistics, and finance sectors is fueling Industry 5.0 market.
Key Regions and Countries
North America
- US
- Canada
- Mexico
Western Europe
- Germany
- France
- The UK
- Spain
- Italy
- Portugal
- Ireland
- Austria
- Switzerland
- Benelux
- Nordic
- Rest of Western Europe
Eastern Europe
- Russia
- Poland
- The Czech Republic
- Greece
- Rest of Eastern Europe
APAC
- China
- Japan
- South Korea
- India
- Australia & New Zealand
- Indonesia
- Malaysia
- Philippines
- Singapore
- Thailand
- Vietnam
- Rest of APAC
Latin America
- Brazil
- Colombia
- Chile
- Argentina
- Costa Rica
- Rest of Latin America
Middle East & Africa
- Algeria
- Egypt
- Israel
- Kuwait
- Nigeria
- Saudi Arabia
- South Africa
- Turkey
- United Arab Emirates
- Rest of MEA
Key Players Analysis
Siemens is a leading company in Industry 5.0, renowned for its expertise in electrification, automation, and digitization. Siemens offers innovative solutions that enable human-machine collaboration and help businesses unlock their full potential. The company's extensive experience and global presence make it a prominent player in shaping the Industry 5.0 landscape.
ABB is another key player, a leading technology company specializing in robotics, power, and automation solutions. ABB combines human and machine capabilities to boost productivity and empower workers in various industries. With its strong focus on collaboration and sustainable development, ABB is well-positioned to drive Industry 5.0's growth.
General Electric (GE) is also a significant player in this market, offering advanced industrial technologies that blend automation and human expertise seamlessly. GE's range of solutions, from renewable energy to digital industrial transformation, contributes to the development of Industry 5.0. The company's commitment to innovation and its diverse portfolio solidify its position as a key player in the market.
Top Key Players in Industry 5.0 Market
- Siemens AG
- ABB Ltd.
- Fanuc Corporation
- Mitsubishi Electric Corporation
- Schneider Electric SE
- IBM Corporation
- Cisco Systems, Inc.
- General Electric (GE) Company
- Rockwell Automation, Inc.
- Microsoft Corporation
Recent Development
- In 2021, Rockwell Automation unveiled its much-anticipated Industry 5.0 platform, which aims to optimize manufacturing operations by harnessing Industrial Internet of Things (IIoT), artificial intelligence, and machine learning. By integrating real-time data analytics with automation and human-robot collaboration, Rockwell Automation seeks to enhance productivity and minimize downtime. This groundbreaking platform cements their position as a frontrunner in Industry 5.0.
- In 2019, ABB announced the development of a flexible and adaptable robot explicitly designed for Industry 5.0 applications. This collaborative robot allows humans and machines to work in harmony, unlocking immense productivity gains. With its advanced capabilities and safety mechanisms, ABB's robot signifies a paradigm shift in industrial workflows, establishing them as a key Industry 5.0 contributor.
- In 2019, GE Digital launched an ambitious Industry 5.0 initiative to bridge physical and digital realms through sensor data, algorithms, and analytics. By enabling data-driven decisions, GE Digital aims to empower sustainable, efficient operations. Their technology-focused approach highlights their role in maximizing Industry 5.0's potential.
Report Scope
Report Features Description Market Value (2022) USD 131.1 Bn Forecast Revenue (2032) USD 658.4 Bn CAGR (2023-2032) 18.0% Base Year for Estimation 2022 Historic Period 2016-2022 Forecast Period 2023-2032 Report Coverage Revenue Forecast, Market Dynamics, COVID-19 Impact, Competitive Landscape, Recent Developments Segments Covered By End-User(Manufacturing, Healthcare, Others), By Technology(Artificial Intelligence, Internet of Things (IoT), Others), By Size of Enterprise(Small and Medium Enterprises (SMEs), Large Enterprises, Others) Regional Analysis North America – The US, Canada, & Mexico; Western Europe – Germany, France, The UK, Spain, Italy, Portugal, Ireland, Austria, Switzerland, Benelux, Nordic, & Rest of Western Europe; Eastern Europe – Russia, Poland, The Czech Republic, Greece, & Rest of Eastern Europe; APAC – China, Japan, South Korea, India, Australia & New Zealand, Indonesia, Malaysia, Philippines, Singapore, Thailand, Vietnam, & Rest of APAC; Latin America – Brazil, Colombia, Chile, Argentina, Costa Rica, & Rest of Latin America; Middle East & Africa – Algeria, Egypt, Israel, Kuwait, Nigeria, Saudi Arabia, South Africa, Turkey, United Arab Emirates, & Rest of MEA Competitive Landscape Siemens AG, ABB Ltd., Fanuc Corporation, Mitsubishi Electric Corporation, Schneider Electric SE, IBM Corporation, Cisco Systems, Inc., General Electric (GE) Company, Rockwell Automation, Inc., Microsoft Corporation Customization Scope Customization for segments, region/country-level will be provided. Moreover, additional customization can be done based on the requirements. Purchase Options We have three licenses to opt for: Single User License, Multi-User License (Up to 5 Users), Corporate Use License (Unlimited User and Printable PDF) -
- 1. Executive Summary
- 1.1. Definition
- 1.2. Taxonomy
- 1.3. Research Scope
- 1.4. Key Analysis
- 1.5. Key Findings by Major Segments
- 1.6. Top strategies by Major Players
- 2. Global Industry 5.0 Market Overview
- 2.1. Industry 5.0 Market Dynamics
- 2.1.1. Drivers
- 2.1.2. Opportunities
- 2.1.3. Restraints
- 2.1.4. Challenges
- 2.2. Macro-economic Factors
- 2.3. Regulatory Framework
- 2.4. Market Investment Feasibility Index
- 2.5. PEST Analysis
- 2.6. PORTER’S Five Force Analysis
- 2.7. Drivers & Restraints Impact Analysis
- 2.8. Industry Chain Analysis
- 2.9. Cost Structure Analysis
- 2.10. Marketing Strategy
- 2.11. Russia-Ukraine War Impact Analysis
- 2.12. Opportunity Map Analysis
- 2.13. Market Competition Scenario Analysis
- 2.14. Product Life Cycle Analysis
- 2.15. Opportunity Orbits
- 2.16. Manufacturer Intensity Map
- 2.17. Major Companies sales by Value & Volume
- 2.1. Industry 5.0 Market Dynamics
- 3. Global Industry 5.0 Market Analysis, Opportunity and Forecast, 2016-2032
- 3.1. Global Industry 5.0 Market Analysis, 2016-2021
- 3.2. Global Industry 5.0 Market Opportunity and Forecast, 2023-2032
- 3.3. Global Industry 5.0 Market Analysis, Opportunity and Forecast, By By End-User , 2016-2032
- 3.3.1. Global Industry 5.0 Market Analysis by By End-User : Introduction
- 3.3.2. Market Size Absolute $ Opportunity Analysis and Forecast, By By End-User , 2016-2032
- 3.3.3. Manufacturing
- 3.3.4. Healthcare
- 3.3.5. Automotive
- 3.3.6. Electronics
- 3.3.7. Aerospace
- 3.3.8. Others
- 3.4. Global Industry 5.0 Market Analysis, Opportunity and Forecast, By By Technology, 2016-2032
- 3.4.1. Global Industry 5.0 Market Analysis by By Technology: Introduction
- 3.4.2. Market Size Absolute $ Opportunity Analysis and Forecast, By By Technology, 2016-2032
- 3.4.3. Artificial Intelligence
- 3.4.4. Internet of Things (IoT)
- 3.4.5. Robotics
- 3.4.6. Virtual Reality (VR) and Augmented Reality (AR)
- 3.4.7. 3D Printing
- 3.4.8. Others
- 3.5. Global Industry 5.0 Market Analysis, Opportunity and Forecast, By By Size of Enterprise, 2016-2032
- 3.5.1. Global Industry 5.0 Market Analysis by By Size of Enterprise: Introduction
- 3.5.2. Market Size Absolute $ Opportunity Analysis and Forecast, By By Size of Enterprise, 2016-2032
- 3.5.3. Small and Medium Enterprises (SMEs)
- 3.5.4. Large Enterprises
- 3.6. Global Industry 5.0 Market Analysis, Opportunity and Forecast, By By Application , 2016-2032
- 3.6.1. Global Industry 5.0 Market Analysis by By Application : Introduction
- 3.6.2. Market Size Absolute $ Opportunity Analysis and Forecast, By By Application , 2016-2032
- 3.6.3. Smart Factories
- 3.6.4. Personalized Healthcare
- 3.6.5. Autonomous Vehicles
- 3.6.6. Smart Cities
- 3.6.7. Industrial Automation
- 3.6.8. Others
- 3.7. Global Industry 5.0 Market Analysis, Opportunity and Forecast, By By Industry Vertical , 2016-2032
- 3.7.1. Global Industry 5.0 Market Analysis by By Industry Vertical : Introduction
- 3.7.2. Market Size Absolute $ Opportunity Analysis and Forecast, By By Industry Vertical , 2016-2032
- 3.7.3. Manufacturing and Production
- 3.7.4. Healthcare and Life Sciences
- 3.7.5. Transportation and Logistics
- 3.7.6. Retail and Consumer Goods
- 3.7.7. Energy and Utilities
- 3.7.8. Others
- 4. North America Industry 5.0 Market Analysis, Opportunity and Forecast, 2016-2032
- 4.1. North America Industry 5.0 Market Analysis, 2016-2021
- 4.2. North America Industry 5.0 Market Opportunity and Forecast, 2023-2032
- 4.3. North America Industry 5.0 Market Analysis, Opportunity and Forecast, By By End-User , 2016-2032
- 4.3.1. North America Industry 5.0 Market Analysis by By End-User : Introduction
- 4.3.2. Market Size Absolute $ Opportunity Analysis and Forecast, By By End-User , 2016-2032
- 4.3.3. Manufacturing
- 4.3.4. Healthcare
- 4.3.5. Automotive
- 4.3.6. Electronics
- 4.3.7. Aerospace
- 4.3.8. Others
- 4.4. North America Industry 5.0 Market Analysis, Opportunity and Forecast, By By Technology, 2016-2032
- 4.4.1. North America Industry 5.0 Market Analysis by By Technology: Introduction
- 4.4.2. Market Size Absolute $ Opportunity Analysis and Forecast, By By Technology, 2016-2032
- 4.4.3. Artificial Intelligence
- 4.4.4. Internet of Things (IoT)
- 4.4.5. Robotics
- 4.4.6. Virtual Reality (VR) and Augmented Reality (AR)
- 4.4.7. 3D Printing
- 4.4.8. Others
- 4.5. North America Industry 5.0 Market Analysis, Opportunity and Forecast, By By Size of Enterprise, 2016-2032
- 4.5.1. North America Industry 5.0 Market Analysis by By Size of Enterprise: Introduction
- 4.5.2. Market Size Absolute $ Opportunity Analysis and Forecast, By By Size of Enterprise, 2016-2032
- 4.5.3. Small and Medium Enterprises (SMEs)
- 4.5.4. Large Enterprises
- 4.6. North America Industry 5.0 Market Analysis, Opportunity and Forecast, By By Application , 2016-2032
- 4.6.1. North America Industry 5.0 Market Analysis by By Application : Introduction
- 4.6.2. Market Size Absolute $ Opportunity Analysis and Forecast, By By Application , 2016-2032
- 4.6.3. Smart Factories
- 4.6.4. Personalized Healthcare
- 4.6.5. Autonomous Vehicles
- 4.6.6. Smart Cities
- 4.6.7. Industrial Automation
- 4.6.8. Others
- 4.7. North America Industry 5.0 Market Analysis, Opportunity and Forecast, By By Industry Vertical , 2016-2032
- 4.7.1. North America Industry 5.0 Market Analysis by By Industry Vertical : Introduction
- 4.7.2. Market Size Absolute $ Opportunity Analysis and Forecast, By By Industry Vertical , 2016-2032
- 4.7.3. Manufacturing and Production
- 4.7.4. Healthcare and Life Sciences
- 4.7.5. Transportation and Logistics
- 4.7.6. Retail and Consumer Goods
- 4.7.7. Energy and Utilities
- 4.7.8. Others
- 4.8. North America Industry 5.0 Market Analysis, Opportunity and Forecast, By Country , 2016-2032
- 4.8.1. North America Industry 5.0 Market Analysis by Country : Introduction
- 4.8.2. Market Size Absolute $ Opportunity Analysis and Forecast, Country , 2016-2032
- 4.8.2.1. The US
- 4.8.2.2. Canada
- 4.8.2.3. Mexico
- 5. Western Europe Industry 5.0 Market Analysis, Opportunity and Forecast, 2016-2032
- 5.1. Western Europe Industry 5.0 Market Analysis, 2016-2021
- 5.2. Western Europe Industry 5.0 Market Opportunity and Forecast, 2023-2032
- 5.3. Western Europe Industry 5.0 Market Analysis, Opportunity and Forecast, By By End-User , 2016-2032
- 5.3.1. Western Europe Industry 5.0 Market Analysis by By End-User : Introduction
- 5.3.2. Market Size Absolute $ Opportunity Analysis and Forecast, By By End-User , 2016-2032
- 5.3.3. Manufacturing
- 5.3.4. Healthcare
- 5.3.5. Automotive
- 5.3.6. Electronics
- 5.3.7. Aerospace
- 5.3.8. Others
- 5.4. Western Europe Industry 5.0 Market Analysis, Opportunity and Forecast, By By Technology, 2016-2032
- 5.4.1. Western Europe Industry 5.0 Market Analysis by By Technology: Introduction
- 5.4.2. Market Size Absolute $ Opportunity Analysis and Forecast, By By Technology, 2016-2032
- 5.4.3. Artificial Intelligence
- 5.4.4. Internet of Things (IoT)
- 5.4.5. Robotics
- 5.4.6. Virtual Reality (VR) and Augmented Reality (AR)
- 5.4.7. 3D Printing
- 5.4.8. Others
- 5.5. Western Europe Industry 5.0 Market Analysis, Opportunity and Forecast, By By Size of Enterprise, 2016-2032
- 5.5.1. Western Europe Industry 5.0 Market Analysis by By Size of Enterprise: Introduction
- 5.5.2. Market Size Absolute $ Opportunity Analysis and Forecast, By By Size of Enterprise, 2016-2032
- 5.5.3. Small and Medium Enterprises (SMEs)
- 5.5.4. Large Enterprises
- 5.6. Western Europe Industry 5.0 Market Analysis, Opportunity and Forecast, By By Application , 2016-2032
- 5.6.1. Western Europe Industry 5.0 Market Analysis by By Application : Introduction
- 5.6.2. Market Size Absolute $ Opportunity Analysis and Forecast, By By Application , 2016-2032
- 5.6.3. Smart Factories
- 5.6.4. Personalized Healthcare
- 5.6.5. Autonomous Vehicles
- 5.6.6. Smart Cities
- 5.6.7. Industrial Automation
- 5.6.8. Others
- 5.7. Western Europe Industry 5.0 Market Analysis, Opportunity and Forecast, By By Industry Vertical , 2016-2032
- 5.7.1. Western Europe Industry 5.0 Market Analysis by By Industry Vertical : Introduction
- 5.7.2. Market Size Absolute $ Opportunity Analysis and Forecast, By By Industry Vertical , 2016-2032
- 5.7.3. Manufacturing and Production
- 5.7.4. Healthcare and Life Sciences
- 5.7.5. Transportation and Logistics
- 5.7.6. Retail and Consumer Goods
- 5.7.7. Energy and Utilities
- 5.7.8. Others
- 5.8. Western Europe Industry 5.0 Market Analysis, Opportunity and Forecast, By Country , 2016-2032
- 5.8.1. Western Europe Industry 5.0 Market Analysis by Country : Introduction
- 5.8.2. Market Size Absolute $ Opportunity Analysis and Forecast, Country , 2016-2032
- 5.8.2.1. Germany
- 5.8.2.2. France
- 5.8.2.3. The UK
- 5.8.2.4. Spain
- 5.8.2.5. Italy
- 5.8.2.6. Portugal
- 5.8.2.7. Ireland
- 5.8.2.8. Austria
- 5.8.2.9. Switzerland
- 5.8.2.10. Benelux
- 5.8.2.11. Nordic
- 5.8.2.12. Rest of Western Europe
- 6. Eastern Europe Industry 5.0 Market Analysis, Opportunity and Forecast, 2016-2032
- 6.1. Eastern Europe Industry 5.0 Market Analysis, 2016-2021
- 6.2. Eastern Europe Industry 5.0 Market Opportunity and Forecast, 2023-2032
- 6.3. Eastern Europe Industry 5.0 Market Analysis, Opportunity and Forecast, By By End-User , 2016-2032
- 6.3.1. Eastern Europe Industry 5.0 Market Analysis by By End-User : Introduction
- 6.3.2. Market Size Absolute $ Opportunity Analysis and Forecast, By By End-User , 2016-2032
- 6.3.3. Manufacturing
- 6.3.4. Healthcare
- 6.3.5. Automotive
- 6.3.6. Electronics
- 6.3.7. Aerospace
- 6.3.8. Others
- 6.4. Eastern Europe Industry 5.0 Market Analysis, Opportunity and Forecast, By By Technology, 2016-2032
- 6.4.1. Eastern Europe Industry 5.0 Market Analysis by By Technology: Introduction
- 6.4.2. Market Size Absolute $ Opportunity Analysis and Forecast, By By Technology, 2016-2032
- 6.4.3. Artificial Intelligence
- 6.4.4. Internet of Things (IoT)
- 6.4.5. Robotics
- 6.4.6. Virtual Reality (VR) and Augmented Reality (AR)
- 6.4.7. 3D Printing
- 6.4.8. Others
- 6.5. Eastern Europe Industry 5.0 Market Analysis, Opportunity and Forecast, By By Size of Enterprise, 2016-2032
- 6.5.1. Eastern Europe Industry 5.0 Market Analysis by By Size of Enterprise: Introduction
- 6.5.2. Market Size Absolute $ Opportunity Analysis and Forecast, By By Size of Enterprise, 2016-2032
- 6.5.3. Small and Medium Enterprises (SMEs)
- 6.5.4. Large Enterprises
- 6.6. Eastern Europe Industry 5.0 Market Analysis, Opportunity and Forecast, By By Application , 2016-2032
- 6.6.1. Eastern Europe Industry 5.0 Market Analysis by By Application : Introduction
- 6.6.2. Market Size Absolute $ Opportunity Analysis and Forecast, By By Application , 2016-2032
- 6.6.3. Smart Factories
- 6.6.4. Personalized Healthcare
- 6.6.5. Autonomous Vehicles
- 6.6.6. Smart Cities
- 6.6.7. Industrial Automation
- 6.6.8. Others
- 6.7. Eastern Europe Industry 5.0 Market Analysis, Opportunity and Forecast, By By Industry Vertical , 2016-2032
- 6.7.1. Eastern Europe Industry 5.0 Market Analysis by By Industry Vertical : Introduction
- 6.7.2. Market Size Absolute $ Opportunity Analysis and Forecast, By By Industry Vertical , 2016-2032
- 6.7.3. Manufacturing and Production
- 6.7.4. Healthcare and Life Sciences
- 6.7.5. Transportation and Logistics
- 6.7.6. Retail and Consumer Goods
- 6.7.7. Energy and Utilities
- 6.7.8. Others
- 6.8. Eastern Europe Industry 5.0 Market Analysis, Opportunity and Forecast, By Country , 2016-2032
- 6.8.1. Eastern Europe Industry 5.0 Market Analysis by Country : Introduction
- 6.8.2. Market Size Absolute $ Opportunity Analysis and Forecast, Country , 2016-2032
- 6.8.2.1. Russia
- 6.8.2.2. Poland
- 6.8.2.3. The Czech Republic
- 6.8.2.4. Greece
- 6.8.2.5. Rest of Eastern Europe
- 7. APAC Industry 5.0 Market Analysis, Opportunity and Forecast, 2016-2032
- 7.1. APAC Industry 5.0 Market Analysis, 2016-2021
- 7.2. APAC Industry 5.0 Market Opportunity and Forecast, 2023-2032
- 7.3. APAC Industry 5.0 Market Analysis, Opportunity and Forecast, By By End-User , 2016-2032
- 7.3.1. APAC Industry 5.0 Market Analysis by By End-User : Introduction
- 7.3.2. Market Size Absolute $ Opportunity Analysis and Forecast, By By End-User , 2016-2032
- 7.3.3. Manufacturing
- 7.3.4. Healthcare
- 7.3.5. Automotive
- 7.3.6. Electronics
- 7.3.7. Aerospace
- 7.3.8. Others
- 7.4. APAC Industry 5.0 Market Analysis, Opportunity and Forecast, By By Technology, 2016-2032
- 7.4.1. APAC Industry 5.0 Market Analysis by By Technology: Introduction
- 7.4.2. Market Size Absolute $ Opportunity Analysis and Forecast, By By Technology, 2016-2032
- 7.4.3. Artificial Intelligence
- 7.4.4. Internet of Things (IoT)
- 7.4.5. Robotics
- 7.4.6. Virtual Reality (VR) and Augmented Reality (AR)
- 7.4.7. 3D Printing
- 7.4.8. Others
- 7.5. APAC Industry 5.0 Market Analysis, Opportunity and Forecast, By By Size of Enterprise, 2016-2032
- 7.5.1. APAC Industry 5.0 Market Analysis by By Size of Enterprise: Introduction
- 7.5.2. Market Size Absolute $ Opportunity Analysis and Forecast, By By Size of Enterprise, 2016-2032
- 7.5.3. Small and Medium Enterprises (SMEs)
- 7.5.4. Large Enterprises
- 7.6. APAC Industry 5.0 Market Analysis, Opportunity and Forecast, By By Application , 2016-2032
- 7.6.1. APAC Industry 5.0 Market Analysis by By Application : Introduction
- 7.6.2. Market Size Absolute $ Opportunity Analysis and Forecast, By By Application , 2016-2032
- 7.6.3. Smart Factories
- 7.6.4. Personalized Healthcare
- 7.6.5. Autonomous Vehicles
- 7.6.6. Smart Cities
- 7.6.7. Industrial Automation
- 7.6.8. Others
- 7.7. APAC Industry 5.0 Market Analysis, Opportunity and Forecast, By By Industry Vertical , 2016-2032
- 7.7.1. APAC Industry 5.0 Market Analysis by By Industry Vertical : Introduction
- 7.7.2. Market Size Absolute $ Opportunity Analysis and Forecast, By By Industry Vertical , 2016-2032
- 7.7.3. Manufacturing and Production
- 7.7.4. Healthcare and Life Sciences
- 7.7.5. Transportation and Logistics
- 7.7.6. Retail and Consumer Goods
- 7.7.7. Energy and Utilities
- 7.7.8. Others
- 7.8. APAC Industry 5.0 Market Analysis, Opportunity and Forecast, By Country , 2016-2032
- 7.8.1. APAC Industry 5.0 Market Analysis by Country : Introduction
- 7.8.2. Market Size Absolute $ Opportunity Analysis and Forecast, Country , 2016-2032
- 7.8.2.1. China
- 7.8.2.2. Japan
- 7.8.2.3. South Korea
- 7.8.2.4. India
- 7.8.2.5. Australia & New Zeland
- 7.8.2.6. Indonesia
- 7.8.2.7. Malaysia
- 7.8.2.8. Philippines
- 7.8.2.9. Singapore
- 7.8.2.10. Thailand
- 7.8.2.11. Vietnam
- 7.8.2.12. Rest of APAC
- 8. Latin America Industry 5.0 Market Analysis, Opportunity and Forecast, 2016-2032
- 8.1. Latin America Industry 5.0 Market Analysis, 2016-2021
- 8.2. Latin America Industry 5.0 Market Opportunity and Forecast, 2023-2032
- 8.3. Latin America Industry 5.0 Market Analysis, Opportunity and Forecast, By By End-User , 2016-2032
- 8.3.1. Latin America Industry 5.0 Market Analysis by By End-User : Introduction
- 8.3.2. Market Size Absolute $ Opportunity Analysis and Forecast, By By End-User , 2016-2032
- 8.3.3. Manufacturing
- 8.3.4. Healthcare
- 8.3.5. Automotive
- 8.3.6. Electronics
- 8.3.7. Aerospace
- 8.3.8. Others
- 8.4. Latin America Industry 5.0 Market Analysis, Opportunity and Forecast, By By Technology, 2016-2032
- 8.4.1. Latin America Industry 5.0 Market Analysis by By Technology: Introduction
- 8.4.2. Market Size Absolute $ Opportunity Analysis and Forecast, By By Technology, 2016-2032
- 8.4.3. Artificial Intelligence
- 8.4.4. Internet of Things (IoT)
- 8.4.5. Robotics
- 8.4.6. Virtual Reality (VR) and Augmented Reality (AR)
- 8.4.7. 3D Printing
- 8.4.8. Others
- 8.5. Latin America Industry 5.0 Market Analysis, Opportunity and Forecast, By By Size of Enterprise, 2016-2032
- 8.5.1. Latin America Industry 5.0 Market Analysis by By Size of Enterprise: Introduction
- 8.5.2. Market Size Absolute $ Opportunity Analysis and Forecast, By By Size of Enterprise, 2016-2032
- 8.5.3. Small and Medium Enterprises (SMEs)
- 8.5.4. Large Enterprises
- 8.6. Latin America Industry 5.0 Market Analysis, Opportunity and Forecast, By By Application , 2016-2032
- 8.6.1. Latin America Industry 5.0 Market Analysis by By Application : Introduction
- 8.6.2. Market Size Absolute $ Opportunity Analysis and Forecast, By By Application , 2016-2032
- 8.6.3. Smart Factories
- 8.6.4. Personalized Healthcare
- 8.6.5. Autonomous Vehicles
- 8.6.6. Smart Cities
- 8.6.7. Industrial Automation
- 8.6.8. Others
- 8.7. Latin America Industry 5.0 Market Analysis, Opportunity and Forecast, By By Industry Vertical , 2016-2032
- 8.7.1. Latin America Industry 5.0 Market Analysis by By Industry Vertical : Introduction
- 8.7.2. Market Size Absolute $ Opportunity Analysis and Forecast, By By Industry Vertical , 2016-2032
- 8.7.3. Manufacturing and Production
- 8.7.4. Healthcare and Life Sciences
- 8.7.5. Transportation and Logistics
- 8.7.6. Retail and Consumer Goods
- 8.7.7. Energy and Utilities
- 8.7.8. Others
- 8.8. Latin America Industry 5.0 Market Analysis, Opportunity and Forecast, By Country , 2016-2032
- 8.8.1. Latin America Industry 5.0 Market Analysis by Country : Introduction
- 8.8.2. Market Size Absolute $ Opportunity Analysis and Forecast, Country , 2016-2032
- 8.8.2.1. Brazil
- 8.8.2.2. Colombia
- 8.8.2.3. Chile
- 8.8.2.4. Argentina
- 8.8.2.5. Costa Rica
- 8.8.2.6. Rest of Latin America
- 9. Middle East & Africa Industry 5.0 Market Analysis, Opportunity and Forecast, 2016-2032
- 9.1. Middle East & Africa Industry 5.0 Market Analysis, 2016-2021
- 9.2. Middle East & Africa Industry 5.0 Market Opportunity and Forecast, 2023-2032
- 9.3. Middle East & Africa Industry 5.0 Market Analysis, Opportunity and Forecast, By By End-User , 2016-2032
- 9.3.1. Middle East & Africa Industry 5.0 Market Analysis by By End-User : Introduction
- 9.3.2. Market Size Absolute $ Opportunity Analysis and Forecast, By By End-User , 2016-2032
- 9.3.3. Manufacturing
- 9.3.4. Healthcare
- 9.3.5. Automotive
- 9.3.6. Electronics
- 9.3.7. Aerospace
- 9.3.8. Others
- 9.4. Middle East & Africa Industry 5.0 Market Analysis, Opportunity and Forecast, By By Technology, 2016-2032
- 9.4.1. Middle East & Africa Industry 5.0 Market Analysis by By Technology: Introduction
- 9.4.2. Market Size Absolute $ Opportunity Analysis and Forecast, By By Technology, 2016-2032
- 9.4.3. Artificial Intelligence
- 9.4.4. Internet of Things (IoT)
- 9.4.5. Robotics
- 9.4.6. Virtual Reality (VR) and Augmented Reality (AR)
- 9.4.7. 3D Printing
- 9.4.8. Others
- 9.5. Middle East & Africa Industry 5.0 Market Analysis, Opportunity and Forecast, By By Size of Enterprise, 2016-2032
- 9.5.1. Middle East & Africa Industry 5.0 Market Analysis by By Size of Enterprise: Introduction
- 9.5.2. Market Size Absolute $ Opportunity Analysis and Forecast, By By Size of Enterprise, 2016-2032
- 9.5.3. Small and Medium Enterprises (SMEs)
- 9.5.4. Large Enterprises
- 9.6. Middle East & Africa Industry 5.0 Market Analysis, Opportunity and Forecast, By By Application , 2016-2032
- 9.6.1. Middle East & Africa Industry 5.0 Market Analysis by By Application : Introduction
- 9.6.2. Market Size Absolute $ Opportunity Analysis and Forecast, By By Application , 2016-2032
- 9.6.3. Smart Factories
- 9.6.4. Personalized Healthcare
- 9.6.5. Autonomous Vehicles
- 9.6.6. Smart Cities
- 9.6.7. Industrial Automation
- 9.6.8. Others
- 9.7. Middle East & Africa Industry 5.0 Market Analysis, Opportunity and Forecast, By By Industry Vertical , 2016-2032
- 9.7.1. Middle East & Africa Industry 5.0 Market Analysis by By Industry Vertical : Introduction
- 9.7.2. Market Size Absolute $ Opportunity Analysis and Forecast, By By Industry Vertical , 2016-2032
- 9.7.3. Manufacturing and Production
- 9.7.4. Healthcare and Life Sciences
- 9.7.5. Transportation and Logistics
- 9.7.6. Retail and Consumer Goods
- 9.7.7. Energy and Utilities
- 9.7.8. Others
- 9.8. Middle East & Africa Industry 5.0 Market Analysis, Opportunity and Forecast, By Country , 2016-2032
- 9.8.1. Middle East & Africa Industry 5.0 Market Analysis by Country : Introduction
- 9.8.2. Market Size Absolute $ Opportunity Analysis and Forecast, Country , 2016-2032
- 9.8.2.1. Algeria
- 9.8.2.2. Egypt
- 9.8.2.3. Israel
- 9.8.2.4. Kuwait
- 9.8.2.5. Nigeria
- 9.8.2.6. Saudi Arabia
- 9.8.2.7. South Africa
- 9.8.2.8. Turkey
- 9.8.2.9. The UAE
- 9.8.2.10. Rest of MEA
- 10. Global Industry 5.0 Market Analysis, Opportunity and Forecast, By Region , 2016-2032
- 10.1. Global Industry 5.0 Market Analysis by Region : Introduction
- 10.2. Market Size Absolute $ Opportunity Analysis and Forecast, By Region , 2016-2032
- 10.2.1. North America
- 10.2.2. Western Europe
- 10.2.3. Eastern Europe
- 10.2.4. APAC
- 10.2.5. Latin America
- 10.2.6. Middle East & Africa
- 11. Global Industry 5.0 Market Competitive Landscape, Market Share Analysis, and Company Profiles
- 11.1. Market Share Analysis
- 11.2. Company Profiles
- 11.3. Siemens AG
- 11.3.1. Company Overview
- 11.3.2. Financial Highlights
- 11.3.3. Product Portfolio
- 11.3.4. SWOT Analysis
- 11.3.5. Key Strategies and Developments
- 11.4. ABB Ltd.
- 11.4.1. Company Overview
- 11.4.2. Financial Highlights
- 11.4.3. Product Portfolio
- 11.4.4. SWOT Analysis
- 11.4.5. Key Strategies and Developments
- 11.5. Fanuc Corporation
- 11.5.1. Company Overview
- 11.5.2. Financial Highlights
- 11.5.3. Product Portfolio
- 11.5.4. SWOT Analysis
- 11.5.5. Key Strategies and Developments
- 11.6. Mitsubishi Electric Corporation
- 11.6.1. Company Overview
- 11.6.2. Financial Highlights
- 11.6.3. Product Portfolio
- 11.6.4. SWOT Analysis
- 11.6.5. Key Strategies and Developments
- 11.7. Schneider Electric SE
- 11.7.1. Company Overview
- 11.7.2. Financial Highlights
- 11.7.3. Product Portfolio
- 11.7.4. SWOT Analysis
- 11.7.5. Key Strategies and Developments
- 11.8. IBM Corporation
- 11.8.1. Company Overview
- 11.8.2. Financial Highlights
- 11.8.3. Product Portfolio
- 11.8.4. SWOT Analysis
- 11.8.5. Key Strategies and Developments
- 11.9. Cisco Systems, Inc.
- 11.9.1. Company Overview
- 11.9.2. Financial Highlights
- 11.9.3. Product Portfolio
- 11.9.4. SWOT Analysis
- 11.9.5. Key Strategies and Developments
- 11.10. General Electric (GE) Company
- 11.10.1. Company Overview
- 11.10.2. Financial Highlights
- 11.10.3. Product Portfolio
- 11.10.4. SWOT Analysis
- 11.10.5. Key Strategies and Developments
- 11.11. Rockwell Automation, Inc.
- 11.11.1. Company Overview
- 11.11.2. Financial Highlights
- 11.11.3. Product Portfolio
- 11.11.4. SWOT Analysis
- 11.11.5. Key Strategies and Developments
- 11.12. Microsoft Corporation
- 11.12.1. Company Overview
- 11.12.2. Financial Highlights
- 11.12.3. Product Portfolio
- 11.12.4. SWOT Analysis
- 11.12.5. Key Strategies and Developments
- 12. Assumptions and Acronyms
- 13. Research Methodology
- 14. Contact
- List of Figures
- Figure 1: Global Industry 5.0 Market Revenue (US$ Mn) Market Share by End-User in 2022
- Figure 2: Global Industry 5.0 Market Attractiveness Analysis by End-User , 2016-2032
- Figure 3: Global Industry 5.0 Market Revenue (US$ Mn) Market Share by Technologyin 2022
- Figure 4: Global Industry 5.0 Market Attractiveness Analysis by Technology, 2016-2032
- Figure 5: Global Industry 5.0 Market Revenue (US$ Mn) Market Share by Size of Enterprisein 2022
- Figure 6: Global Industry 5.0 Market Attractiveness Analysis by Size of Enterprise, 2016-2032
- Figure 7: Global Industry 5.0 Market Revenue (US$ Mn) Market Share by Application in 2022
- Figure 8: Global Industry 5.0 Market Attractiveness Analysis by Application , 2016-2032
- Figure 9: Global Industry 5.0 Market Revenue (US$ Mn) Market Share by Industry Vertical in 2022
- Figure 10: Global Industry 5.0 Market Attractiveness Analysis by Industry Vertical , 2016-2032
- Figure 11: Global Industry 5.0 Market Revenue (US$ Mn) Market Share by Region in 2022
- Figure 12: Global Industry 5.0 Market Attractiveness Analysis by Region, 2016-2032
- Figure 13: Global Industry 5.0 Market Revenue (US$ Mn) (2016-2032)
- Figure 14: Global Industry 5.0 Market Revenue (US$ Mn) Comparison by Region (2016-2032)
- Figure 15: Global Industry 5.0 Market Revenue (US$ Mn) Comparison by End-User (2016-2032)
- Figure 16: Global Industry 5.0 Market Revenue (US$ Mn) Comparison by Technology (2016-2032)
- Figure 17: Global Industry 5.0 Market Revenue (US$ Mn) Comparison by Size of Enterprise (2016-2032)
- Figure 18: Global Industry 5.0 Market Revenue (US$ Mn) Comparison by Application (2016-2032)
- Figure 19: Global Industry 5.0 Market Revenue (US$ Mn) Comparison by Industry Vertical (2016-2032)
- Figure 20: Global Industry 5.0 Market Y-o-Y Growth Rate Comparison by Region (2016-2032)
- Figure 21: Global Industry 5.0 Market Y-o-Y Growth Rate Comparison by End-User (2016-2032)
- Figure 22: Global Industry 5.0 Market Y-o-Y Growth Rate Comparison by Technology (2016-2032)
- Figure 23: Global Industry 5.0 Market Y-o-Y Growth Rate Comparison by Size of Enterprise (2016-2032)
- Figure 24: Global Industry 5.0 Market Y-o-Y Growth Rate Comparison by Application (2016-2032)
- Figure 25: Global Industry 5.0 Market Y-o-Y Growth Rate Comparison by Industry Vertical (2016-2032)
- Figure 26: Global Industry 5.0 Market Share Comparison by Region (2016-2032)
- Figure 27: Global Industry 5.0 Market Share Comparison by End-User (2016-2032)
- Figure 28: Global Industry 5.0 Market Share Comparison by Technology (2016-2032)
- Figure 29: Global Industry 5.0 Market Share Comparison by Size of Enterprise (2016-2032)
- Figure 30: Global Industry 5.0 Market Share Comparison by Application (2016-2032)
- Figure 31: Global Industry 5.0 Market Share Comparison by Industry Vertical (2016-2032)
- Figure 32: North America Industry 5.0 Market Revenue (US$ Mn) Market Share by End-User in 2022
- Figure 33: North America Industry 5.0 Market Attractiveness Analysis by End-User , 2016-2032
- Figure 34: North America Industry 5.0 Market Revenue (US$ Mn) Market Share by Technologyin 2022
- Figure 35: North America Industry 5.0 Market Attractiveness Analysis by Technology, 2016-2032
- Figure 36: North America Industry 5.0 Market Revenue (US$ Mn) Market Share by Size of Enterprisein 2022
- Figure 37: North America Industry 5.0 Market Attractiveness Analysis by Size of Enterprise, 2016-2032
- Figure 38: North America Industry 5.0 Market Revenue (US$ Mn) Market Share by Application in 2022
- Figure 39: North America Industry 5.0 Market Attractiveness Analysis by Application , 2016-2032
- Figure 40: North America Industry 5.0 Market Revenue (US$ Mn) Market Share by Industry Vertical in 2022
- Figure 41: North America Industry 5.0 Market Attractiveness Analysis by Industry Vertical , 2016-2032
- Figure 42: North America Industry 5.0 Market Revenue (US$ Mn) Market Share by Country in 2022
- Figure 43: North America Industry 5.0 Market Attractiveness Analysis by Country, 2016-2032
- Figure 44: North America Industry 5.0 Market Revenue (US$ Mn) (2016-2032)
- Figure 45: North America Industry 5.0 Market Revenue (US$ Mn) Comparison by Country (2016-2032)
- Figure 46: North America Industry 5.0 Market Revenue (US$ Mn) Comparison by End-User (2016-2032)
- Figure 47: North America Industry 5.0 Market Revenue (US$ Mn) Comparison by Technology (2016-2032)
- Figure 48: North America Industry 5.0 Market Revenue (US$ Mn) Comparison by Size of Enterprise (2016-2032)
- Figure 49: North America Industry 5.0 Market Revenue (US$ Mn) Comparison by Application (2016-2032)
- Figure 50: North America Industry 5.0 Market Revenue (US$ Mn) Comparison by Industry Vertical (2016-2032)
- Figure 51: North America Industry 5.0 Market Y-o-Y Growth Rate Comparison by Country (2016-2032)
- Figure 52: North America Industry 5.0 Market Y-o-Y Growth Rate Comparison by End-User (2016-2032)
- Figure 53: North America Industry 5.0 Market Y-o-Y Growth Rate Comparison by Technology (2016-2032)
- Figure 54: North America Industry 5.0 Market Y-o-Y Growth Rate Comparison by Size of Enterprise (2016-2032)
- Figure 55: North America Industry 5.0 Market Y-o-Y Growth Rate Comparison by Application (2016-2032)
- Figure 56: North America Industry 5.0 Market Y-o-Y Growth Rate Comparison by Industry Vertical (2016-2032)
- Figure 57: North America Industry 5.0 Market Share Comparison by Country (2016-2032)
- Figure 58: North America Industry 5.0 Market Share Comparison by End-User (2016-2032)
- Figure 59: North America Industry 5.0 Market Share Comparison by Technology (2016-2032)
- Figure 60: North America Industry 5.0 Market Share Comparison by Size of Enterprise (2016-2032)
- Figure 61: North America Industry 5.0 Market Share Comparison by Application (2016-2032)
- Figure 62: North America Industry 5.0 Market Share Comparison by Industry Vertical (2016-2032)
- Figure 63: Western Europe Industry 5.0 Market Revenue (US$ Mn) Market Share by End-User in 2022
- Figure 64: Western Europe Industry 5.0 Market Attractiveness Analysis by End-User , 2016-2032
- Figure 65: Western Europe Industry 5.0 Market Revenue (US$ Mn) Market Share by Technologyin 2022
- Figure 66: Western Europe Industry 5.0 Market Attractiveness Analysis by Technology, 2016-2032
- Figure 67: Western Europe Industry 5.0 Market Revenue (US$ Mn) Market Share by Size of Enterprisein 2022
- Figure 68: Western Europe Industry 5.0 Market Attractiveness Analysis by Size of Enterprise, 2016-2032
- Figure 69: Western Europe Industry 5.0 Market Revenue (US$ Mn) Market Share by Application in 2022
- Figure 70: Western Europe Industry 5.0 Market Attractiveness Analysis by Application , 2016-2032
- Figure 71: Western Europe Industry 5.0 Market Revenue (US$ Mn) Market Share by Industry Vertical in 2022
- Figure 72: Western Europe Industry 5.0 Market Attractiveness Analysis by Industry Vertical , 2016-2032
- Figure 73: Western Europe Industry 5.0 Market Revenue (US$ Mn) Market Share by Country in 2022
- Figure 74: Western Europe Industry 5.0 Market Attractiveness Analysis by Country, 2016-2032
- Figure 75: Western Europe Industry 5.0 Market Revenue (US$ Mn) (2016-2032)
- Figure 76: Western Europe Industry 5.0 Market Revenue (US$ Mn) Comparison by Country (2016-2032)
- Figure 77: Western Europe Industry 5.0 Market Revenue (US$ Mn) Comparison by End-User (2016-2032)
- Figure 78: Western Europe Industry 5.0 Market Revenue (US$ Mn) Comparison by Technology (2016-2032)
- Figure 79: Western Europe Industry 5.0 Market Revenue (US$ Mn) Comparison by Size of Enterprise (2016-2032)
- Figure 80: Western Europe Industry 5.0 Market Revenue (US$ Mn) Comparison by Application (2016-2032)
- Figure 81: Western Europe Industry 5.0 Market Revenue (US$ Mn) Comparison by Industry Vertical (2016-2032)
- Figure 82: Western Europe Industry 5.0 Market Y-o-Y Growth Rate Comparison by Country (2016-2032)
- Figure 83: Western Europe Industry 5.0 Market Y-o-Y Growth Rate Comparison by End-User (2016-2032)
- Figure 84: Western Europe Industry 5.0 Market Y-o-Y Growth Rate Comparison by Technology (2016-2032)
- Figure 85: Western Europe Industry 5.0 Market Y-o-Y Growth Rate Comparison by Size of Enterprise (2016-2032)
- Figure 86: Western Europe Industry 5.0 Market Y-o-Y Growth Rate Comparison by Application (2016-2032)
- Figure 87: Western Europe Industry 5.0 Market Y-o-Y Growth Rate Comparison by Industry Vertical (2016-2032)
- Figure 88: Western Europe Industry 5.0 Market Share Comparison by Country (2016-2032)
- Figure 89: Western Europe Industry 5.0 Market Share Comparison by End-User (2016-2032)
- Figure 90: Western Europe Industry 5.0 Market Share Comparison by Technology (2016-2032)
- Figure 91: Western Europe Industry 5.0 Market Share Comparison by Size of Enterprise (2016-2032)
- Figure 92: Western Europe Industry 5.0 Market Share Comparison by Application (2016-2032)
- Figure 93: Western Europe Industry 5.0 Market Share Comparison by Industry Vertical (2016-2032)
- Figure 94: Eastern Europe Industry 5.0 Market Revenue (US$ Mn) Market Share by End-User in 2022
- Figure 95: Eastern Europe Industry 5.0 Market Attractiveness Analysis by End-User , 2016-2032
- Figure 96: Eastern Europe Industry 5.0 Market Revenue (US$ Mn) Market Share by Technologyin 2022
- Figure 97: Eastern Europe Industry 5.0 Market Attractiveness Analysis by Technology, 2016-2032
- Figure 98: Eastern Europe Industry 5.0 Market Revenue (US$ Mn) Market Share by Size of Enterprisein 2022
- Figure 99: Eastern Europe Industry 5.0 Market Attractiveness Analysis by Size of Enterprise, 2016-2032
- Figure 100: Eastern Europe Industry 5.0 Market Revenue (US$ Mn) Market Share by Application in 2022
- Figure 101: Eastern Europe Industry 5.0 Market Attractiveness Analysis by Application , 2016-2032
- Figure 102: Eastern Europe Industry 5.0 Market Revenue (US$ Mn) Market Share by Industry Vertical in 2022
- Figure 103: Eastern Europe Industry 5.0 Market Attractiveness Analysis by Industry Vertical , 2016-2032
- Figure 104: Eastern Europe Industry 5.0 Market Revenue (US$ Mn) Market Share by Country in 2022
- Figure 105: Eastern Europe Industry 5.0 Market Attractiveness Analysis by Country, 2016-2032
- Figure 106: Eastern Europe Industry 5.0 Market Revenue (US$ Mn) (2016-2032)
- Figure 107: Eastern Europe Industry 5.0 Market Revenue (US$ Mn) Comparison by Country (2016-2032)
- Figure 108: Eastern Europe Industry 5.0 Market Revenue (US$ Mn) Comparison by End-User (2016-2032)
- Figure 109: Eastern Europe Industry 5.0 Market Revenue (US$ Mn) Comparison by Technology (2016-2032)
- Figure 110: Eastern Europe Industry 5.0 Market Revenue (US$ Mn) Comparison by Size of Enterprise (2016-2032)
- Figure 111: Eastern Europe Industry 5.0 Market Revenue (US$ Mn) Comparison by Application (2016-2032)
- Figure 112: Eastern Europe Industry 5.0 Market Revenue (US$ Mn) Comparison by Industry Vertical (2016-2032)
- Figure 113: Eastern Europe Industry 5.0 Market Y-o-Y Growth Rate Comparison by Country (2016-2032)
- Figure 114: Eastern Europe Industry 5.0 Market Y-o-Y Growth Rate Comparison by End-User (2016-2032)
- Figure 115: Eastern Europe Industry 5.0 Market Y-o-Y Growth Rate Comparison by Technology (2016-2032)
- Figure 116: Eastern Europe Industry 5.0 Market Y-o-Y Growth Rate Comparison by Size of Enterprise (2016-2032)
- Figure 117: Eastern Europe Industry 5.0 Market Y-o-Y Growth Rate Comparison by Application (2016-2032)
- Figure 118: Eastern Europe Industry 5.0 Market Y-o-Y Growth Rate Comparison by Industry Vertical (2016-2032)
- Figure 119: Eastern Europe Industry 5.0 Market Share Comparison by Country (2016-2032)
- Figure 120: Eastern Europe Industry 5.0 Market Share Comparison by End-User (2016-2032)
- Figure 121: Eastern Europe Industry 5.0 Market Share Comparison by Technology (2016-2032)
- Figure 122: Eastern Europe Industry 5.0 Market Share Comparison by Size of Enterprise (2016-2032)
- Figure 123: Eastern Europe Industry 5.0 Market Share Comparison by Application (2016-2032)
- Figure 124: Eastern Europe Industry 5.0 Market Share Comparison by Industry Vertical (2016-2032)
- Figure 125: APAC Industry 5.0 Market Revenue (US$ Mn) Market Share by End-User in 2022
- Figure 126: APAC Industry 5.0 Market Attractiveness Analysis by End-User , 2016-2032
- Figure 127: APAC Industry 5.0 Market Revenue (US$ Mn) Market Share by Technologyin 2022
- Figure 128: APAC Industry 5.0 Market Attractiveness Analysis by Technology, 2016-2032
- Figure 129: APAC Industry 5.0 Market Revenue (US$ Mn) Market Share by Size of Enterprisein 2022
- Figure 130: APAC Industry 5.0 Market Attractiveness Analysis by Size of Enterprise, 2016-2032
- Figure 131: APAC Industry 5.0 Market Revenue (US$ Mn) Market Share by Application in 2022
- Figure 132: APAC Industry 5.0 Market Attractiveness Analysis by Application , 2016-2032
- Figure 133: APAC Industry 5.0 Market Revenue (US$ Mn) Market Share by Industry Vertical in 2022
- Figure 134: APAC Industry 5.0 Market Attractiveness Analysis by Industry Vertical , 2016-2032
- Figure 135: APAC Industry 5.0 Market Revenue (US$ Mn) Market Share by Country in 2022
- Figure 136: APAC Industry 5.0 Market Attractiveness Analysis by Country, 2016-2032
- Figure 137: APAC Industry 5.0 Market Revenue (US$ Mn) (2016-2032)
- Figure 138: APAC Industry 5.0 Market Revenue (US$ Mn) Comparison by Country (2016-2032)
- Figure 139: APAC Industry 5.0 Market Revenue (US$ Mn) Comparison by End-User (2016-2032)
- Figure 140: APAC Industry 5.0 Market Revenue (US$ Mn) Comparison by Technology (2016-2032)
- Figure 141: APAC Industry 5.0 Market Revenue (US$ Mn) Comparison by Size of Enterprise (2016-2032)
- Figure 142: APAC Industry 5.0 Market Revenue (US$ Mn) Comparison by Application (2016-2032)
- Figure 143: APAC Industry 5.0 Market Revenue (US$ Mn) Comparison by Industry Vertical (2016-2032)
- Figure 144: APAC Industry 5.0 Market Y-o-Y Growth Rate Comparison by Country (2016-2032)
- Figure 145: APAC Industry 5.0 Market Y-o-Y Growth Rate Comparison by End-User (2016-2032)
- Figure 146: APAC Industry 5.0 Market Y-o-Y Growth Rate Comparison by Technology (2016-2032)
- Figure 147: APAC Industry 5.0 Market Y-o-Y Growth Rate Comparison by Size of Enterprise (2016-2032)
- Figure 148: APAC Industry 5.0 Market Y-o-Y Growth Rate Comparison by Application (2016-2032)
- Figure 149: APAC Industry 5.0 Market Y-o-Y Growth Rate Comparison by Industry Vertical (2016-2032)
- Figure 150: APAC Industry 5.0 Market Share Comparison by Country (2016-2032)
- Figure 151: APAC Industry 5.0 Market Share Comparison by End-User (2016-2032)
- Figure 152: APAC Industry 5.0 Market Share Comparison by Technology (2016-2032)
- Figure 153: APAC Industry 5.0 Market Share Comparison by Size of Enterprise (2016-2032)
- Figure 154: APAC Industry 5.0 Market Share Comparison by Application (2016-2032)
- Figure 155: APAC Industry 5.0 Market Share Comparison by Industry Vertical (2016-2032)
- Figure 156: Latin America Industry 5.0 Market Revenue (US$ Mn) Market Share by End-User in 2022
- Figure 157: Latin America Industry 5.0 Market Attractiveness Analysis by End-User , 2016-2032
- Figure 158: Latin America Industry 5.0 Market Revenue (US$ Mn) Market Share by Technologyin 2022
- Figure 159: Latin America Industry 5.0 Market Attractiveness Analysis by Technology, 2016-2032
- Figure 160: Latin America Industry 5.0 Market Revenue (US$ Mn) Market Share by Size of Enterprisein 2022
- Figure 161: Latin America Industry 5.0 Market Attractiveness Analysis by Size of Enterprise, 2016-2032
- Figure 162: Latin America Industry 5.0 Market Revenue (US$ Mn) Market Share by Application in 2022
- Figure 163: Latin America Industry 5.0 Market Attractiveness Analysis by Application , 2016-2032
- Figure 164: Latin America Industry 5.0 Market Revenue (US$ Mn) Market Share by Industry Vertical in 2022
- Figure 165: Latin America Industry 5.0 Market Attractiveness Analysis by Industry Vertical , 2016-2032
- Figure 166: Latin America Industry 5.0 Market Revenue (US$ Mn) Market Share by Country in 2022
- Figure 167: Latin America Industry 5.0 Market Attractiveness Analysis by Country, 2016-2032
- Figure 168: Latin America Industry 5.0 Market Revenue (US$ Mn) (2016-2032)
- Figure 169: Latin America Industry 5.0 Market Revenue (US$ Mn) Comparison by Country (2016-2032)
- Figure 170: Latin America Industry 5.0 Market Revenue (US$ Mn) Comparison by End-User (2016-2032)
- Figure 171: Latin America Industry 5.0 Market Revenue (US$ Mn) Comparison by Technology (2016-2032)
- Figure 172: Latin America Industry 5.0 Market Revenue (US$ Mn) Comparison by Size of Enterprise (2016-2032)
- Figure 173: Latin America Industry 5.0 Market Revenue (US$ Mn) Comparison by Application (2016-2032)
- Figure 174: Latin America Industry 5.0 Market Revenue (US$ Mn) Comparison by Industry Vertical (2016-2032)
- Figure 175: Latin America Industry 5.0 Market Y-o-Y Growth Rate Comparison by Country (2016-2032)
- Figure 176: Latin America Industry 5.0 Market Y-o-Y Growth Rate Comparison by End-User (2016-2032)
- Figure 177: Latin America Industry 5.0 Market Y-o-Y Growth Rate Comparison by Technology (2016-2032)
- Figure 178: Latin America Industry 5.0 Market Y-o-Y Growth Rate Comparison by Size of Enterprise (2016-2032)
- Figure 179: Latin America Industry 5.0 Market Y-o-Y Growth Rate Comparison by Application (2016-2032)
- Figure 180: Latin America Industry 5.0 Market Y-o-Y Growth Rate Comparison by Industry Vertical (2016-2032)
- Figure 181: Latin America Industry 5.0 Market Share Comparison by Country (2016-2032)
- Figure 182: Latin America Industry 5.0 Market Share Comparison by End-User (2016-2032)
- Figure 183: Latin America Industry 5.0 Market Share Comparison by Technology (2016-2032)
- Figure 184: Latin America Industry 5.0 Market Share Comparison by Size of Enterprise (2016-2032)
- Figure 185: Latin America Industry 5.0 Market Share Comparison by Application (2016-2032)
- Figure 186: Latin America Industry 5.0 Market Share Comparison by Industry Vertical (2016-2032)
- Figure 187: Middle East & Africa Industry 5.0 Market Revenue (US$ Mn) Market Share by End-User in 2022
- Figure 188: Middle East & Africa Industry 5.0 Market Attractiveness Analysis by End-User , 2016-2032
- Figure 189: Middle East & Africa Industry 5.0 Market Revenue (US$ Mn) Market Share by Technologyin 2022
- Figure 190: Middle East & Africa Industry 5.0 Market Attractiveness Analysis by Technology, 2016-2032
- Figure 191: Middle East & Africa Industry 5.0 Market Revenue (US$ Mn) Market Share by Size of Enterprisein 2022
- Figure 192: Middle East & Africa Industry 5.0 Market Attractiveness Analysis by Size of Enterprise, 2016-2032
- Figure 193: Middle East & Africa Industry 5.0 Market Revenue (US$ Mn) Market Share by Application in 2022
- Figure 194: Middle East & Africa Industry 5.0 Market Attractiveness Analysis by Application , 2016-2032
- Figure 195: Middle East & Africa Industry 5.0 Market Revenue (US$ Mn) Market Share by Industry Vertical in 2022
- Figure 196: Middle East & Africa Industry 5.0 Market Attractiveness Analysis by Industry Vertical , 2016-2032
- Figure 197: Middle East & Africa Industry 5.0 Market Revenue (US$ Mn) Market Share by Country in 2022
- Figure 198: Middle East & Africa Industry 5.0 Market Attractiveness Analysis by Country, 2016-2032
- Figure 199: Middle East & Africa Industry 5.0 Market Revenue (US$ Mn) (2016-2032)
- Figure 200: Middle East & Africa Industry 5.0 Market Revenue (US$ Mn) Comparison by Country (2016-2032)
- Figure 201: Middle East & Africa Industry 5.0 Market Revenue (US$ Mn) Comparison by End-User (2016-2032)
- Figure 202: Middle East & Africa Industry 5.0 Market Revenue (US$ Mn) Comparison by Technology (2016-2032)
- Figure 203: Middle East & Africa Industry 5.0 Market Revenue (US$ Mn) Comparison by Size of Enterprise (2016-2032)
- Figure 204: Middle East & Africa Industry 5.0 Market Revenue (US$ Mn) Comparison by Application (2016-2032)
- Figure 205: Middle East & Africa Industry 5.0 Market Revenue (US$ Mn) Comparison by Industry Vertical (2016-2032)
- Figure 206: Middle East & Africa Industry 5.0 Market Y-o-Y Growth Rate Comparison by Country (2016-2032)
- Figure 207: Middle East & Africa Industry 5.0 Market Y-o-Y Growth Rate Comparison by End-User (2016-2032)
- Figure 208: Middle East & Africa Industry 5.0 Market Y-o-Y Growth Rate Comparison by Technology (2016-2032)
- Figure 209: Middle East & Africa Industry 5.0 Market Y-o-Y Growth Rate Comparison by Size of Enterprise (2016-2032)
- Figure 210: Middle East & Africa Industry 5.0 Market Y-o-Y Growth Rate Comparison by Application (2016-2032)
- Figure 211: Middle East & Africa Industry 5.0 Market Y-o-Y Growth Rate Comparison by Industry Vertical (2016-2032)
- Figure 212: Middle East & Africa Industry 5.0 Market Share Comparison by Country (2016-2032)
- Figure 213: Middle East & Africa Industry 5.0 Market Share Comparison by End-User (2016-2032)
- Figure 214: Middle East & Africa Industry 5.0 Market Share Comparison by Technology (2016-2032)
- Figure 215: Middle East & Africa Industry 5.0 Market Share Comparison by Size of Enterprise (2016-2032)
- Figure 216: Middle East & Africa Industry 5.0 Market Share Comparison by Application (2016-2032)
- Figure 217: Middle East & Africa Industry 5.0 Market Share Comparison by Industry Vertical (2016-2032)
List of Tables
- Table 1: Global Industry 5.0 Market Comparison by End-User (2016-2032)
- Table 2: Global Industry 5.0 Market Comparison by Technology (2016-2032)
- Table 3: Global Industry 5.0 Market Comparison by Size of Enterprise (2016-2032)
- Table 4: Global Industry 5.0 Market Comparison by Application (2016-2032)
- Table 5: Global Industry 5.0 Market Comparison by Industry Vertical (2016-2032)
- Table 6: Global Industry 5.0 Market Revenue (US$ Mn) Comparison by Region (2016-2032)
- Table 7: Global Industry 5.0 Market Revenue (US$ Mn) (2016-2032)
- Table 8: Global Industry 5.0 Market Revenue (US$ Mn) Comparison by Region (2016-2032)
- Table 9: Global Industry 5.0 Market Revenue (US$ Mn) Comparison by End-User (2016-2032)
- Table 10: Global Industry 5.0 Market Revenue (US$ Mn) Comparison by Technology (2016-2032)
- Table 11: Global Industry 5.0 Market Revenue (US$ Mn) Comparison by Size of Enterprise (2016-2032)
- Table 12: Global Industry 5.0 Market Revenue (US$ Mn) Comparison by Application (2016-2032)
- Table 13: Global Industry 5.0 Market Revenue (US$ Mn) Comparison by Industry Vertical (2016-2032)
- Table 14: Global Industry 5.0 Market Y-o-Y Growth Rate Comparison by Region (2016-2032)
- Table 15: Global Industry 5.0 Market Y-o-Y Growth Rate Comparison by End-User (2016-2032)
- Table 16: Global Industry 5.0 Market Y-o-Y Growth Rate Comparison by Technology (2016-2032)
- Table 17: Global Industry 5.0 Market Y-o-Y Growth Rate Comparison by Size of Enterprise (2016-2032)
- Table 18: Global Industry 5.0 Market Y-o-Y Growth Rate Comparison by Application (2016-2032)
- Table 19: Global Industry 5.0 Market Y-o-Y Growth Rate Comparison by Industry Vertical (2016-2032)
- Table 20: Global Industry 5.0 Market Share Comparison by Region (2016-2032)
- Table 21: Global Industry 5.0 Market Share Comparison by End-User (2016-2032)
- Table 22: Global Industry 5.0 Market Share Comparison by Technology (2016-2032)
- Table 23: Global Industry 5.0 Market Share Comparison by Size of Enterprise (2016-2032)
- Table 24: Global Industry 5.0 Market Share Comparison by Application (2016-2032)
- Table 25: Global Industry 5.0 Market Share Comparison by Industry Vertical (2016-2032)
- Table 26: North America Industry 5.0 Market Comparison by Technology (2016-2032)
- Table 27: North America Industry 5.0 Market Comparison by Size of Enterprise (2016-2032)
- Table 28: North America Industry 5.0 Market Comparison by Application (2016-2032)
- Table 29: North America Industry 5.0 Market Comparison by Industry Vertical (2016-2032)
- Table 30: North America Industry 5.0 Market Revenue (US$ Mn) Comparison by Country (2016-2032)
- Table 31: North America Industry 5.0 Market Revenue (US$ Mn) (2016-2032)
- Table 32: North America Industry 5.0 Market Revenue (US$ Mn) Comparison by Country (2016-2032)
- Table 33: North America Industry 5.0 Market Revenue (US$ Mn) Comparison by End-User (2016-2032)
- Table 34: North America Industry 5.0 Market Revenue (US$ Mn) Comparison by Technology (2016-2032)
- Table 35: North America Industry 5.0 Market Revenue (US$ Mn) Comparison by Size of Enterprise (2016-2032)
- Table 36: North America Industry 5.0 Market Revenue (US$ Mn) Comparison by Application (2016-2032)
- Table 37: North America Industry 5.0 Market Revenue (US$ Mn) Comparison by Industry Vertical (2016-2032)
- Table 38: North America Industry 5.0 Market Y-o-Y Growth Rate Comparison by Country (2016-2032)
- Table 39: North America Industry 5.0 Market Y-o-Y Growth Rate Comparison by End-User (2016-2032)
- Table 40: North America Industry 5.0 Market Y-o-Y Growth Rate Comparison by Technology (2016-2032)
- Table 41: North America Industry 5.0 Market Y-o-Y Growth Rate Comparison by Size of Enterprise (2016-2032)
- Table 42: North America Industry 5.0 Market Y-o-Y Growth Rate Comparison by Application (2016-2032)
- Table 43: North America Industry 5.0 Market Y-o-Y Growth Rate Comparison by Industry Vertical (2016-2032)
- Table 44: North America Industry 5.0 Market Share Comparison by Country (2016-2032)
- Table 45: North America Industry 5.0 Market Share Comparison by End-User (2016-2032)
- Table 46: North America Industry 5.0 Market Share Comparison by Technology (2016-2032)
- Table 47: North America Industry 5.0 Market Share Comparison by Size of Enterprise (2016-2032)
- Table 48: North America Industry 5.0 Market Share Comparison by Application (2016-2032)
- Table 49: North America Industry 5.0 Market Share Comparison by Industry Vertical (2016-2032)
- Table 50: Western Europe Industry 5.0 Market Comparison by End-User (2016-2032)
- Table 51: Western Europe Industry 5.0 Market Comparison by Technology (2016-2032)
- Table 52: Western Europe Industry 5.0 Market Comparison by Size of Enterprise (2016-2032)
- Table 53: Western Europe Industry 5.0 Market Comparison by Application (2016-2032)
- Table 54: Western Europe Industry 5.0 Market Comparison by Industry Vertical (2016-2032)
- Table 55: Western Europe Industry 5.0 Market Revenue (US$ Mn) Comparison by Country (2016-2032)
- Table 56: Western Europe Industry 5.0 Market Revenue (US$ Mn) (2016-2032)
- Table 57: Western Europe Industry 5.0 Market Revenue (US$ Mn) Comparison by Country (2016-2032)
- Table 58: Western Europe Industry 5.0 Market Revenue (US$ Mn) Comparison by End-User (2016-2032)
- Table 59: Western Europe Industry 5.0 Market Revenue (US$ Mn) Comparison by Technology (2016-2032)
- Table 60: Western Europe Industry 5.0 Market Revenue (US$ Mn) Comparison by Size of Enterprise (2016-2032)
- Table 61: Western Europe Industry 5.0 Market Revenue (US$ Mn) Comparison by Application (2016-2032)
- Table 62: Western Europe Industry 5.0 Market Revenue (US$ Mn) Comparison by Industry Vertical (2016-2032)
- Table 63: Western Europe Industry 5.0 Market Y-o-Y Growth Rate Comparison by Country (2016-2032)
- Table 64: Western Europe Industry 5.0 Market Y-o-Y Growth Rate Comparison by End-User (2016-2032)
- Table 65: Western Europe Industry 5.0 Market Y-o-Y Growth Rate Comparison by Technology (2016-2032)
- Table 66: Western Europe Industry 5.0 Market Y-o-Y Growth Rate Comparison by Size of Enterprise (2016-2032)
- Table 67: Western Europe Industry 5.0 Market Y-o-Y Growth Rate Comparison by Application (2016-2032)
- Table 68: Western Europe Industry 5.0 Market Y-o-Y Growth Rate Comparison by Industry Vertical (2016-2032)
- Table 69: Western Europe Industry 5.0 Market Share Comparison by Country (2016-2032)
- Table 70: Western Europe Industry 5.0 Market Share Comparison by End-User (2016-2032)
- Table 71: Western Europe Industry 5.0 Market Share Comparison by Technology (2016-2032)
- Table 72: Western Europe Industry 5.0 Market Share Comparison by Size of Enterprise (2016-2032)
- Table 73: Western Europe Industry 5.0 Market Share Comparison by Application (2016-2032)
- Table 74: Western Europe Industry 5.0 Market Share Comparison by Industry Vertical (2016-2032)
- Table 75: Eastern Europe Industry 5.0 Market Comparison by End-User (2016-2032)
- Table 76: Eastern Europe Industry 5.0 Market Comparison by Technology (2016-2032)
- Table 77: Eastern Europe Industry 5.0 Market Comparison by Size of Enterprise (2016-2032)
- Table 78: Eastern Europe Industry 5.0 Market Comparison by Application (2016-2032)
- Table 79: Eastern Europe Industry 5.0 Market Comparison by Industry Vertical (2016-2032)
- Table 80: Eastern Europe Industry 5.0 Market Revenue (US$ Mn) Comparison by Country (2016-2032)
- Table 81: Eastern Europe Industry 5.0 Market Revenue (US$ Mn) (2016-2032)
- Table 82: Eastern Europe Industry 5.0 Market Revenue (US$ Mn) Comparison by Country (2016-2032)
- Table 83: Eastern Europe Industry 5.0 Market Revenue (US$ Mn) Comparison by End-User (2016-2032)
- Table 84: Eastern Europe Industry 5.0 Market Revenue (US$ Mn) Comparison by Technology (2016-2032)
- Table 85: Eastern Europe Industry 5.0 Market Revenue (US$ Mn) Comparison by Size of Enterprise (2016-2032)
- Table 86: Eastern Europe Industry 5.0 Market Revenue (US$ Mn) Comparison by Application (2016-2032)
- Table 87: Eastern Europe Industry 5.0 Market Revenue (US$ Mn) Comparison by Industry Vertical (2016-2032)
- Table 88: Eastern Europe Industry 5.0 Market Y-o-Y Growth Rate Comparison by Country (2016-2032)
- Table 89: Eastern Europe Industry 5.0 Market Y-o-Y Growth Rate Comparison by End-User (2016-2032)
- Table 90: Eastern Europe Industry 5.0 Market Y-o-Y Growth Rate Comparison by Technology (2016-2032)
- Table 91: Eastern Europe Industry 5.0 Market Y-o-Y Growth Rate Comparison by Size of Enterprise (2016-2032)
- Table 92: Eastern Europe Industry 5.0 Market Y-o-Y Growth Rate Comparison by Application (2016-2032)
- Table 93: Eastern Europe Industry 5.0 Market Y-o-Y Growth Rate Comparison by Industry Vertical (2016-2032)
- Table 94: Eastern Europe Industry 5.0 Market Share Comparison by Country (2016-2032)
- Table 95: Eastern Europe Industry 5.0 Market Share Comparison by End-User (2016-2032)
- Table 96: Eastern Europe Industry 5.0 Market Share Comparison by Technology (2016-2032)
- Table 97: Eastern Europe Industry 5.0 Market Share Comparison by Size of Enterprise (2016-2032)
- Table 98: Eastern Europe Industry 5.0 Market Share Comparison by Application (2016-2032)
- Table 99: Eastern Europe Industry 5.0 Market Share Comparison by Industry Vertical (2016-2032)
- Table 100: APAC Industry 5.0 Market Comparison by End-User (2016-2032)
- Table 101: APAC Industry 5.0 Market Comparison by Technology (2016-2032)
- Table 102: APAC Industry 5.0 Market Comparison by Size of Enterprise (2016-2032)
- Table 103: APAC Industry 5.0 Market Comparison by Application (2016-2032)
- Table 104: APAC Industry 5.0 Market Comparison by Industry Vertical (2016-2032)
- Table 105: APAC Industry 5.0 Market Revenue (US$ Mn) Comparison by Country (2016-2032)
- Table 106: APAC Industry 5.0 Market Revenue (US$ Mn) (2016-2032)
- Table 107: APAC Industry 5.0 Market Revenue (US$ Mn) Comparison by Country (2016-2032)
- Table 108: APAC Industry 5.0 Market Revenue (US$ Mn) Comparison by End-User (2016-2032)
- Table 109: APAC Industry 5.0 Market Revenue (US$ Mn) Comparison by Technology (2016-2032)
- Table 110: APAC Industry 5.0 Market Revenue (US$ Mn) Comparison by Size of Enterprise (2016-2032)
- Table 111: APAC Industry 5.0 Market Revenue (US$ Mn) Comparison by Application (2016-2032)
- Table 112: APAC Industry 5.0 Market Revenue (US$ Mn) Comparison by Industry Vertical (2016-2032)
- Table 113: APAC Industry 5.0 Market Y-o-Y Growth Rate Comparison by Country (2016-2032)
- Table 114: APAC Industry 5.0 Market Y-o-Y Growth Rate Comparison by End-User (2016-2032)
- Table 115: APAC Industry 5.0 Market Y-o-Y Growth Rate Comparison by Technology (2016-2032)
- Table 116: APAC Industry 5.0 Market Y-o-Y Growth Rate Comparison by Size of Enterprise (2016-2032)
- Table 117: APAC Industry 5.0 Market Y-o-Y Growth Rate Comparison by Application (2016-2032)
- Table 118: APAC Industry 5.0 Market Y-o-Y Growth Rate Comparison by Industry Vertical (2016-2032)
- Table 119: APAC Industry 5.0 Market Share Comparison by Country (2016-2032)
- Table 120: APAC Industry 5.0 Market Share Comparison by End-User (2016-2032)
- Table 121: APAC Industry 5.0 Market Share Comparison by Technology (2016-2032)
- Table 122: APAC Industry 5.0 Market Share Comparison by Size of Enterprise (2016-2032)
- Table 123: APAC Industry 5.0 Market Share Comparison by Application (2016-2032)
- Table 124: APAC Industry 5.0 Market Share Comparison by Industry Vertical (2016-2032)
- Table 125: Latin America Industry 5.0 Market Comparison by End-User (2016-2032)
- Table 126: Latin America Industry 5.0 Market Comparison by Technology (2016-2032)
- Table 127: Latin America Industry 5.0 Market Comparison by Size of Enterprise (2016-2032)
- Table 128: Latin America Industry 5.0 Market Comparison by Application (2016-2032)
- Table 129: Latin America Industry 5.0 Market Comparison by Industry Vertical (2016-2032)
- Table 130: Latin America Industry 5.0 Market Revenue (US$ Mn) Comparison by Country (2016-2032)
- Table 131: Latin America Industry 5.0 Market Revenue (US$ Mn) (2016-2032)
- Table 132: Latin America Industry 5.0 Market Revenue (US$ Mn) Comparison by Country (2016-2032)
- Table 133: Latin America Industry 5.0 Market Revenue (US$ Mn) Comparison by End-User (2016-2032)
- Table 134: Latin America Industry 5.0 Market Revenue (US$ Mn) Comparison by Technology (2016-2032)
- Table 135: Latin America Industry 5.0 Market Revenue (US$ Mn) Comparison by Size of Enterprise (2016-2032)
- Table 136: Latin America Industry 5.0 Market Revenue (US$ Mn) Comparison by Application (2016-2032)
- Table 137: Latin America Industry 5.0 Market Revenue (US$ Mn) Comparison by Industry Vertical (2016-2032)
- Table 138: Latin America Industry 5.0 Market Y-o-Y Growth Rate Comparison by Country (2016-2032)
- Table 139: Latin America Industry 5.0 Market Y-o-Y Growth Rate Comparison by End-User (2016-2032)
- Table 140: Latin America Industry 5.0 Market Y-o-Y Growth Rate Comparison by Technology (2016-2032)
- Table 141: Latin America Industry 5.0 Market Y-o-Y Growth Rate Comparison by Size of Enterprise (2016-2032)
- Table 142: Latin America Industry 5.0 Market Y-o-Y Growth Rate Comparison by Application (2016-2032)
- Table 143: Latin America Industry 5.0 Market Y-o-Y Growth Rate Comparison by Industry Vertical (2016-2032)
- Table 144: Latin America Industry 5.0 Market Share Comparison by Country (2016-2032)
- Table 145: Latin America Industry 5.0 Market Share Comparison by End-User (2016-2032)
- Table 146: Latin America Industry 5.0 Market Share Comparison by Technology (2016-2032)
- Table 147: Latin America Industry 5.0 Market Share Comparison by Size of Enterprise (2016-2032)
- Table 148: Latin America Industry 5.0 Market Share Comparison by Application (2016-2032)
- Table 149: Latin America Industry 5.0 Market Share Comparison by Industry Vertical (2016-2032)
- Table 150: Middle East & Africa Industry 5.0 Market Comparison by End-User (2016-2032)
- Table 151: Middle East & Africa Industry 5.0 Market Comparison by Technology (2016-2032)
- Table 152: Middle East & Africa Industry 5.0 Market Comparison by Size of Enterprise (2016-2032)
- Table 153: Middle East & Africa Industry 5.0 Market Comparison by Application (2016-2032)
- Table 154: Middle East & Africa Industry 5.0 Market Comparison by Industry Vertical (2016-2032)
- Table 155: Middle East & Africa Industry 5.0 Market Revenue (US$ Mn) Comparison by Country (2016-2032)
- Table 156: Middle East & Africa Industry 5.0 Market Revenue (US$ Mn) (2016-2032)
- Table 157: Middle East & Africa Industry 5.0 Market Revenue (US$ Mn) Comparison by Country (2016-2032)
- Table 158: Middle East & Africa Industry 5.0 Market Revenue (US$ Mn) Comparison by End-User (2016-2032)
- Table 159: Middle East & Africa Industry 5.0 Market Revenue (US$ Mn) Comparison by Technology (2016-2032)
- Table 160: Middle East & Africa Industry 5.0 Market Revenue (US$ Mn) Comparison by Size of Enterprise (2016-2032)
- Table 161: Middle East & Africa Industry 5.0 Market Revenue (US$ Mn) Comparison by Application (2016-2032)
- Table 162: Middle East & Africa Industry 5.0 Market Revenue (US$ Mn) Comparison by Industry Vertical (2016-2032)
- Table 163: Middle East & Africa Industry 5.0 Market Y-o-Y Growth Rate Comparison by Country (2016-2032)
- Table 164: Middle East & Africa Industry 5.0 Market Y-o-Y Growth Rate Comparison by End-User (2016-2032)
- Table 165: Middle East & Africa Industry 5.0 Market Y-o-Y Growth Rate Comparison by Technology (2016-2032)
- Table 166: Middle East & Africa Industry 5.0 Market Y-o-Y Growth Rate Comparison by Size of Enterprise (2016-2032)
- Table 167: Middle East & Africa Industry 5.0 Market Y-o-Y Growth Rate Comparison by Application (2016-2032)
- Table 168: Middle East & Africa Industry 5.0 Market Y-o-Y Growth Rate Comparison by Industry Vertical (2016-2032)
- Table 169: Middle East & Africa Industry 5.0 Market Share Comparison by Country (2016-2032)
- Table 170: Middle East & Africa Industry 5.0 Market Share Comparison by End-User (2016-2032)
- Table 171: Middle East & Africa Industry 5.0 Market Share Comparison by Technology (2016-2032)
- Table 172: Middle East & Africa Industry 5.0 Market Share Comparison by Size of Enterprise (2016-2032)
- Table 173: Middle East & Africa Industry 5.0 Market Share Comparison by Application (2016-2032)
- Table 174: Middle East & Africa Industry 5.0 Market Share Comparison by Industry Vertical (2016-2032)
- 1. Executive Summary
-
- Siemens AG
- ABB Ltd.
- Fanuc Corporation
- Mitsubishi Electric Corporation
- Schneider Electric SE
- IBM Corporation
- Cisco Systems, Inc.
- General Electric (GE) Company
- Rockwell Automation, Inc.
- Microsoft Corporation
Our Clients


View Our Licence Options
