Hydrogen Stations Market By Size (Small Station, Medium Station, Large Station), By Type (Onsite, Reforming, Electrolysis, Offsite (By Pressure (Low Pressure, High Pressure), By Mobility (Fixed Hydrogen Station, Mobile Hydrogen Station), By End-Use (Marine, Railways, Commercial Vehicles, Aviation), By Region And Companies - Industry Segment Outlook, Market Assessment, Competition Scenario, Trends, And Forecast 2023-2032
-
42242
-
Dec 2023
-
130
-


-
This report was compiled by Shreyas Rokade Shreyas Rokade is a seasoned Research Analyst with CMFE, bringing extensive expertise in market research and consulting, with a strong background in Chemical Engineering. Correspondence Team Lead-CMFE Linkedin | Detailed Market research Methodology Our methodology involves a mix of primary research, including interviews with leading mental health experts, and secondary research from reputable medical journals and databases. View Detailed Methodology Page
-
Quick Navigation
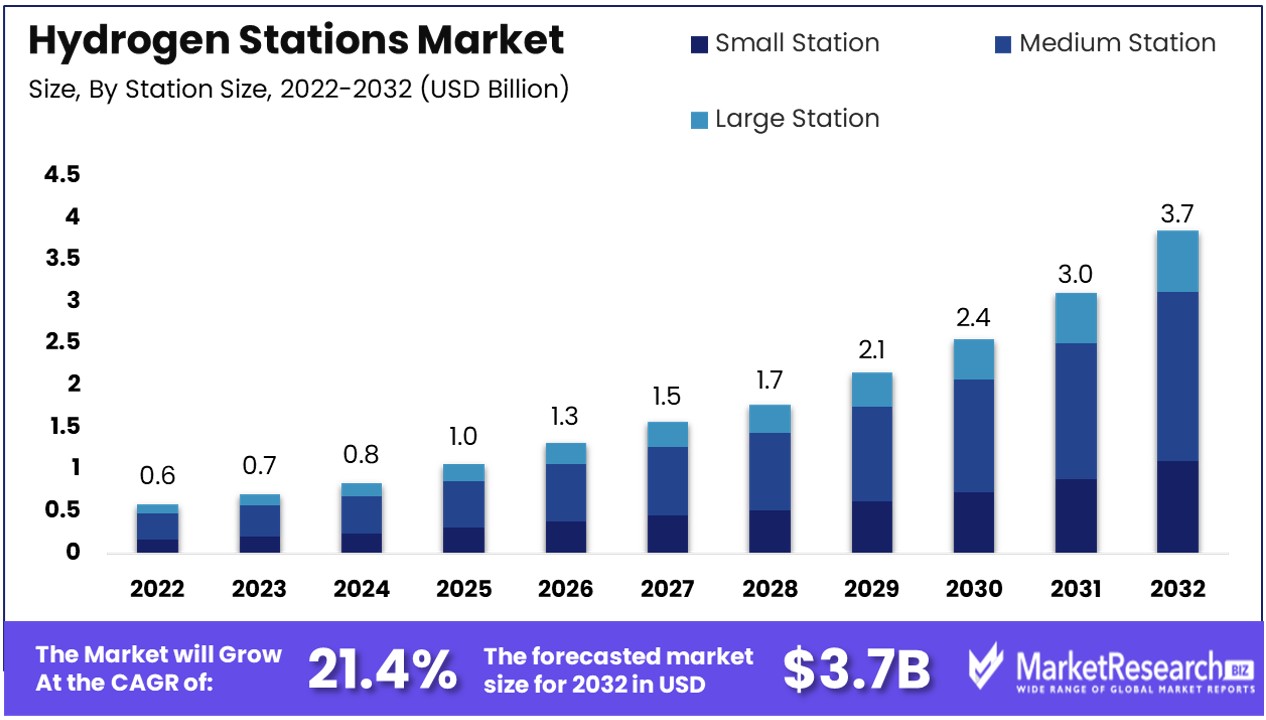
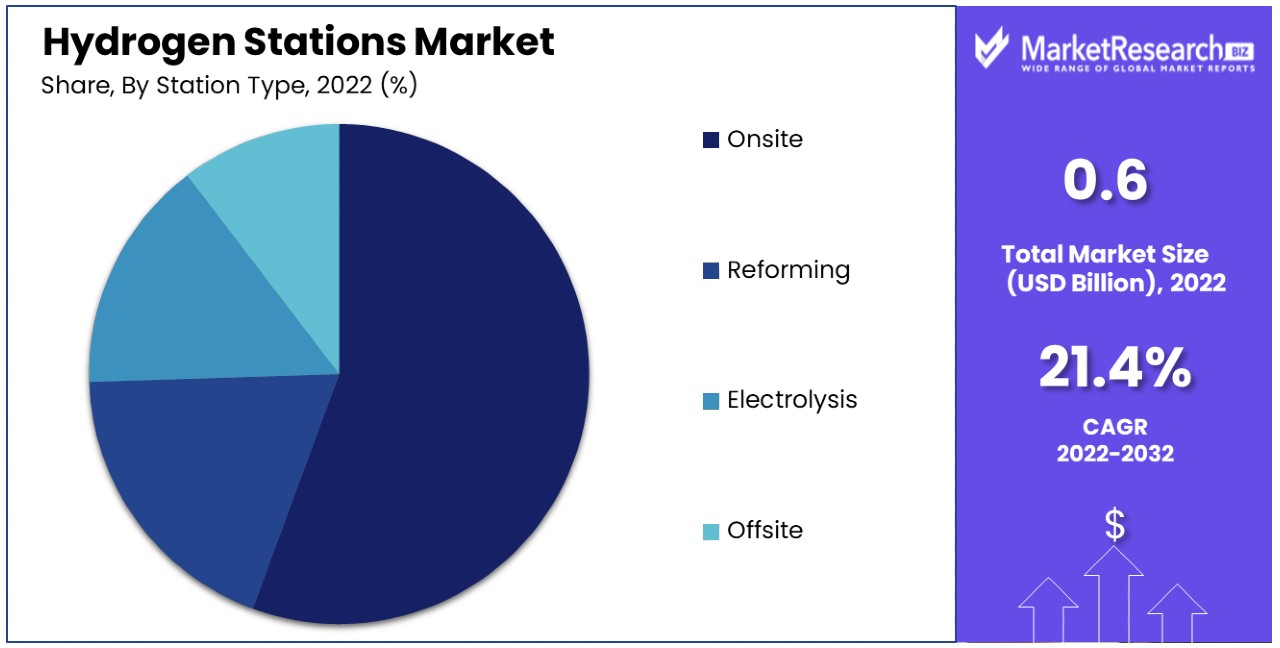
Hydrogen Stations Market size is predicted to reach approximately USD 3.7 Bn by 2032, from a valuation of USD 0.6 Bn in 2022, growing at a CAGR of 21.4% during the forecast period from 2023 to 2032.
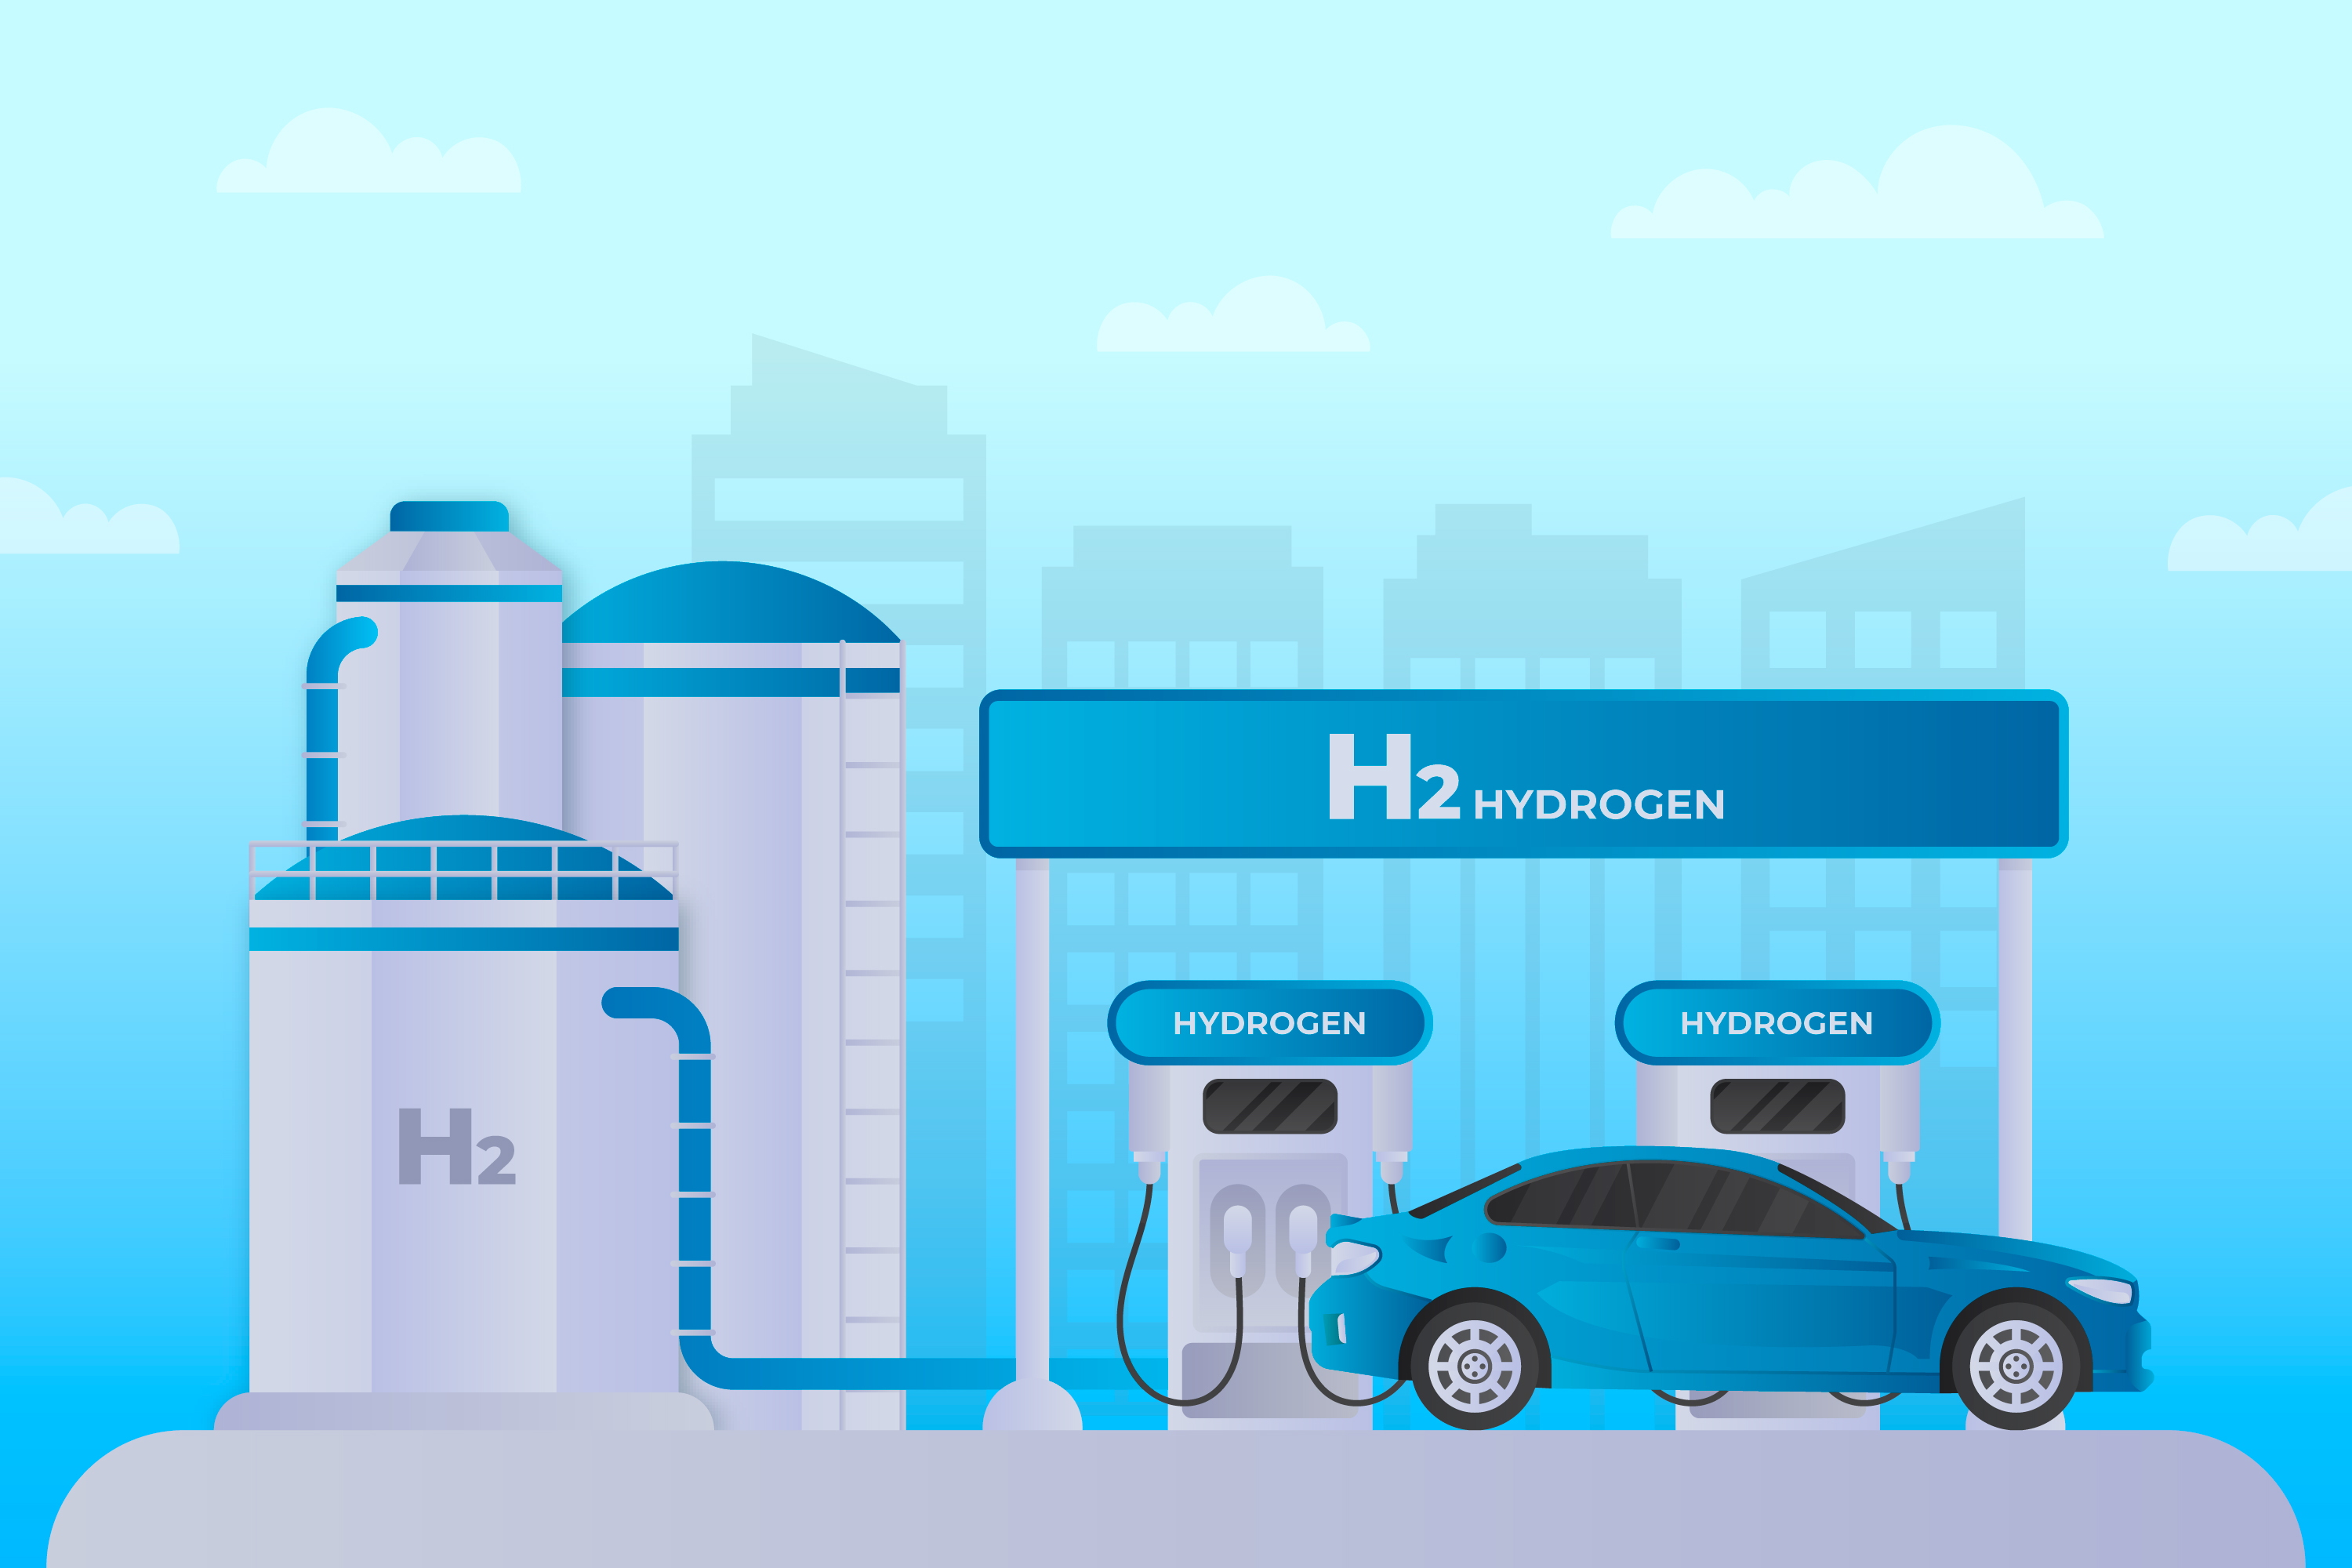
Hydrogen stations are fueling sites designed to service hydrogen-powered vehicles such as cars, buses, and trucks. They function similarly to gas stations, allowing drivers to refuel their vehicles. The stations use electrolyzers to produce high-purity hydrogen onsite from water, or get deliveries of hydrogen from industrial plants.
The hydrogen is compressed and stored in tanks at high pressures before being dispensed into vehicles through specialized pumps and hose assemblies. Building out networks of public hydrogen stations is a crucial step to support the adoption of hydrogen fuel cell electric vehicles. As production methods shift to green hydrogen made via renewable energy, hydrogen stations can enable carbon-free transportation powered by a sustainable fuel made from water.
As of 2022, the number of hydrogen fuel cell electric vehicles (FCEVs) on the world's roads increased by 40% compared to 2021, totaling more than 72,000 vehicles, with China having the most, followed by South Korea, Japan, Germany, and the United States. This has showed positive signs for the growth of the Hydrogen Stations Market.
The Hydrogen Stations Market is positioned for robust growth in the coming decade fueled by several key drivers. As more automakers launch hydrogen fuel cell electric vehicles, there is increasing demand for hydrogen refueling infrastructure to support consumer adoption. Government initiatives and policies aimed at building out hydrogen station networks are providing funding and incentives to spur station development.
Regions like Europe, China, South Korea and Japan have set ambitious hydrogen infrastructure targets, which will necessitate rapid growth of the Hydrogen Stations Market. The establishment of regional hydrogen hubs, commitments from major vehicle manufacturers like Toyota, BMW, and Hyundai, and initiatives by international organizations underscore the global push for hydrogen fuel cell technology.
Additionally, advancements that lower capital costs for stations as well as new modular station designs can accelerate market expansion. Partnerships between gas and oil companies, industrial gas providers and station developers are helping establish viable commercial station business models.
As more stations provide green or renewable hydrogen from solar, wind or other low carbon production methods, this can boost consumer demand and support faster market growth. With fuel cell electric heavy trucks starting commercialization as well, the addressable markets for hydrogen stations are growing.
Moreover as adoption of hydrogen-powered electric vehicles ramps up, ample profitable openings exist for companies to establish hydrogen refueling infrastructure. Automakers project over 40 models of FCEVs by 2025, underscoring the need for extensive hydrogen stations networks.
Companies can pursue product innovations like reduced refueling time, cost-efficiencies and scaling up renewable hydrogen production. Investing in modular station designs allows tapping unserved areas. Partnerships between energy majors, mobility providers and governments could accelerate R&D around safe storage and transportation. Standardization of refueling protocols and financial incentives will further widen consumer access.
Developing this backbone for clean mobility allows stakeholders to reap economic and environmental gains. This is because hydrogen energy storage in hydrogen stations facilitates a sustainable and efficient means of storing renewable energy for later use, offering a crucial solution for balancing the intermittent nature of renewable power sources.
Hydrogen Stations Market Dynamics
Zero-Emission Goals Boost Hydrogen Station Development
The push for zero-emission vehicles, particularly hydrogen fuel cell electric vehicles (FCEVs) that produce no tailpipe emissions other than water vapor, is a significant driver for the development of hydrogen stations. As the automotive industry shifts towards sustainable solutions, FCEVs are gaining attention for their environmental benefits. This shift is driving the demand for a robust hydrogen fueling infrastructure, as the viability and attractiveness of FCEVs are directly linked to the availability of hydrogen refueling options.
The expansion of hydrogen stations is crucial for supporting the growing FCEV market, which is seen as a key component in reducing transportation-related emissions. This trend suggests a long-term market growth for hydrogen stations, aligned with global efforts to transition to cleaner transportation technologies.
Green Hydrogen Production from Renewables Propels Infrastructure Growth
The utilization of excess renewable energy from sources like wind and solar to produce green hydrogen via electrolysis is driving the development of hydrogen infrastructure. This approach to hydrogen production is environmentally sustainable and aligns with the broader trend of increasing renewable energy utilization.
The ability to store surplus renewable energy as hydrogen addresses the intermittency issue of renewable sources and enhances the overall efficiency of the energy system. The growing focus on green hydrogen production is thus a key factor in the expansion of hydrogen stations, providing a sustainable and scalable solution for hydrogen fueling infrastructure. This trend is likely to continue, reinforcing the role of hydrogen stations in a renewable energy-powered future.
Government Decarbonization Targets Fuel Hydrogen Infrastructure Expansion
Ambitious decarbonization and zero emissions targets set by many governments are critical in scaling up hydrogen vehicles and infrastructure. Governments worldwide are recognizing hydrogen as a pivotal element in achieving climate goals, particularly in sectors that are challenging to decarbonize, such as transportation and heavy industry.
This governmental support is manifesting in the form of policies, subsidies, and investments aimed at promoting hydrogen technologies and infrastructure. The development of hydrogen stations is essential in this context, providing the necessary fueling infrastructure to support a growing fleet of hydrogen vehicles. This governmental commitment to hydrogen as a key component of climate strategies indicates a sustained expansion of the hydrogen stations market, playing a central role in global efforts to transition to a low-carbon economy.
Limited Scale and Lack of Standardization Challenge Hydrogen Stations Market Growth
The hydrogen stations market faces significant growth challenges due to its limited scale and lack of standardization, particularly in fuelling protocols. With approximately 500 hydrogen stations globally, the infrastructure is not yet widespread, which can deter the adoption of hydrogen fuel cell vehicles.
This scarcity of stations leads to a 'chicken-and-egg' dilemma, where consumers are hesitant to purchase hydrogen vehicles due to insufficient refueling infrastructure, and vice versa. Additionally, the lack of standardization in areas such as fuelling protocols and connector types adds complexity and hinders the harmonization of global hydrogen infrastructure development.
Complex Refueling Process and R&D Hurdles Limit Hydrogen Stations Market Growth
The complexity of refueling hydrogen, coupled with research and development (R&D) challenges, also limits the growth of the hydrogen stations market. Issues encompass the entire chain from production to delivery, including storing hydrogen at high pressures, transporting it safely, and ensuring its delivery at adequate purity levels for mobility use. These challenges demand ongoing R&D to develop more efficient and cost-effective solutions.
The complexity and cost of building and operating hydrogen stations, which require advanced technologies for storage and dispensing, make it a less attractive investment compared to conventional fuel stations or electric vehicle charging infrastructures. This complexity in refueling infrastructure development hampers the market's growth potential.
Hydrogen Stations Market Segmentation Analysis
By Size Analysis
Medium hydrogen stations, holding a market share of 55.6%, are the dominant size segment. These stations offer a balanced solution between capacity and cost, making them ideal for urban settings and fleet operations. They can service a significant number of vehicles, supporting both private and commercial hydrogen fuel cell vehicles. Medium stations are often preferred for their ability to meet the needs of growing hydrogen fuel cell adoption without the extensive space and investment requirements of large stations.
Small stations are suited for areas with limited space or lower demand. Large stations cater to high-demand areas and are essential for industrial applications, offering substantial fueling capacities.
By Station Type Analysis
Onsite hydrogen stations, with a 58.6% Hydrogen Stations Market share, lead this segment. These stations produce hydrogen directly at the point of dispensing, usually through electrolysis or reforming processes. Onsite production is advantageous for ensuring a consistent hydrogen supply and reducing transportation and storage costs. They are particularly suitable for urban areas and locations with accessible renewable energy sources for green hydrogen production.
Reforming and electrolysis are key methods for onsite hydrogen production, with electrolysis gaining traction for green energy. Offsite stations rely on transported hydrogen and are important for areas where onsite production is not feasible.
By Pressure Analysis
High-pressure hydrogen stations dominate the Hydrogen Stations Market with a 76.3% share. These stations compress hydrogen to high pressures, typically around 700 bar, facilitating faster refueling and higher storage efficiency, which is crucial for meeting the demands of modern fuel cell vehicles.
As the automotive industry continues to shift towards hydrogen fuel cell technology, the dominance of high-pressure hydrogen stations underscores their pivotal role in supporting the infrastructure necessary for a sustainable and efficient hydrogen-based transportation system.
Low-pressure stations are used in specific applications where high-pressure storage is not required, such as in certain industrial uses. While their market share is comparatively smaller, the importance of low-pressure stations should not be overlooked, as they cater to specialized needs within the broader hydrogen ecosystem.
By Mobility Analysis
Fixed hydrogen stations, accounting for 65.2% of the market, form the backbone of hydrogen refueling infrastructure. They provide a permanent solution for hydrogen fueling, essential for establishing a reliable network for hydrogen fuel cell vehicles.
Mobile stations offer flexibility and are used in areas with temporary or emerging demand for hydrogen fueling. They also serve demonstration and emergency purposes. While their market share is comparatively smaller, the importance of low-pressure stations should not be overlooked, as they cater to specialized needs within the broader hydrogen ecosystem.
By End-Use Analysis
Commercial vehicles, including buses and trucks, represent the largest end-use segment at 44.6%. The segment’s dominance is driven by the growing adoption of hydrogen fuel cell vehicles in public transportation and logistics, emphasizing the need for reliable refueling infrastructure. The reliability and accessibility of hydrogen stations play a pivotal role in supporting the expanding fleet of hydrogen-powered buses and trucks, ensuring the feasibility and viability of hydrogen as a clean energy solution in the realm of commercial transportation
Beyond road transportation, the hydrogen stations market is witnessing an exploration of hydrogen fuel solutions in the marine, railway, and aviation sectors, marking a strategic move toward decarbonization. Although these segments currently represent smaller shares of the market, they hold substantial potential for future growth. The environmental concerns and regulatory pressures in these sectors are pushing for sustainable alternatives, and hydrogen is emerging as a promising candidate.
Hydrogen Stations Industry Key Segments
By Size
- Small Station
- Medium Station
- Large Station
By Station Type
- Onsite
- Reforming
- Electrolysis
- Offsite
By Pressure
- Low Pressure
- High Pressure
By Mobility
- Fixed Hydrogen Station
- Mobile Hydrogen Station
By End-Use
- Marine
- Railways
- Commercial Vehicles
- Aviation
Hydrogen Stations Market Growth Opportunities
Expanding to Heavy Transport Offers Untapped Growth in Hydrogen Stations Market
The potential expansion of hydrogen stations to support fuel cell trucks, trains, ships, and planes presents a significant yet under-tapped growth opportunity for the market. Currently, the focus has been predominantly on light passenger vehicles.
However, by strategically providing refueling access for heavier modes of transport, hydrogen stations can enable broader adoption of hydrogen fuel cells in these segments. This expansion is crucial in addressing the larger transportation sector's shift away from fossil fuels. The growing interest in sustainable heavy transport solutions indicates a substantial market expansion potential for hydrogen stations in these areas.
Partnering with Municipalities Drives Scale and Utilization in Hydrogen Stations Market
Collaborating with municipal authorities to establish hydrogen stations optimized for taxis, buses, and municipal fleets can significantly drive market scale and utilization. Such partnerships focus on clustered deployments, which not only enhance the efficiency of hydrogen use in public transport but also address consumer concerns about fueling access.
By targeting vehicles that refuel frequently, these stations can achieve higher throughput and efficiency, making the hydrogen infrastructure more viable and visible. This approach, combined with the increasing push for greener public transport solutions, presents a substantial growth opportunity for the hydrogen stations market, especially in urban areas.
Hydrogen Stations Market Market Regional Analysis
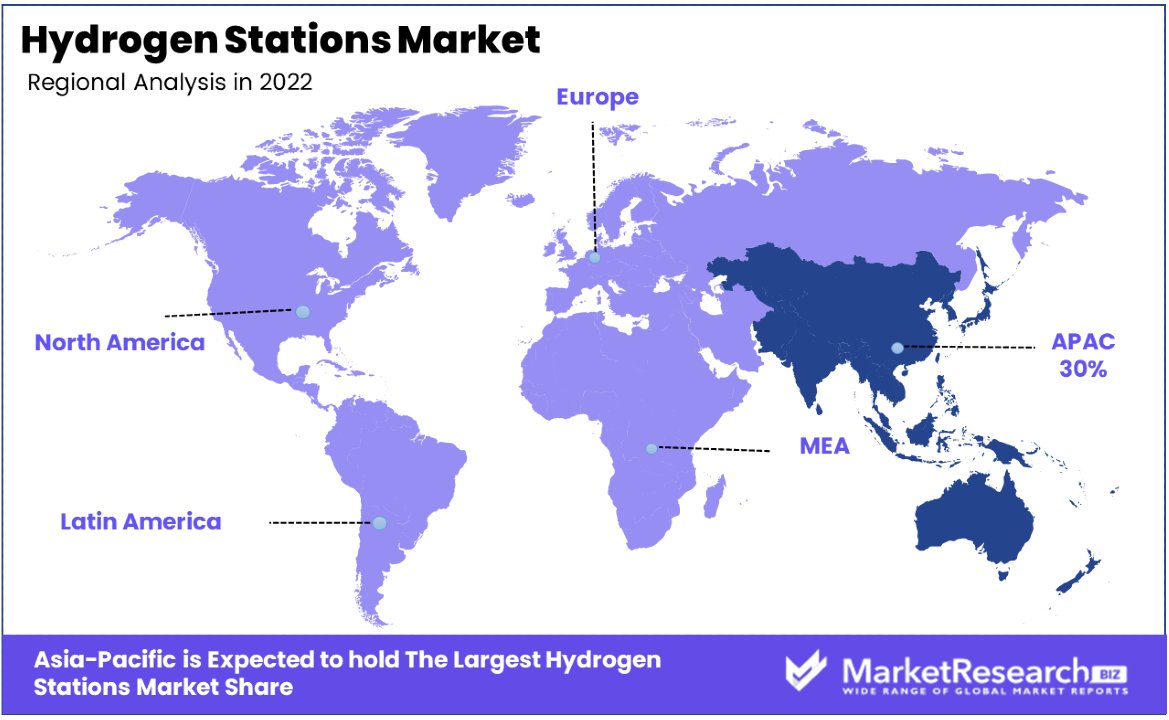
Asia Pacific Dominates with 30% Market Share
Asia Pacific's significant 30% share in the Hydrogen Stations Market is largely due to the region's aggressive push towards clean energy and sustainable transportation. Countries like Japan, South Korea, and China are at the forefront of this transition, implementing national policies that favor hydrogen fuel cell technologies.
The increasing number of hydrogen fuel cell vehicles (FCVs) in these countries drives the need for an extensive hydrogen refueling infrastructure. Additionally, governmental support in the form of subsidies and incentives for hydrogen infrastructure development significantly contributes to the market growth in this region.
The market dynamics in Asia Pacific are influenced by the region's commitment to reducing carbon emissions and combating climate change. This has led to strategic investments in hydrogen technology, including the development of hydrogen refueling stations. The collaboration between governments and major automotive and energy companies in the region accelerates the deployment of hydrogen stations. Furthermore, Asia Pacific's technological advancements in hydrogen production and storage enhance the efficiency and feasibility of these stations.
Europe's Commitment to Green Energy Transition
Europe's hydrogen stations market is driven by the region's strong commitment to the green energy transition and achieving carbon neutrality. The European Union's ambitious targets for reducing greenhouse gas emissions underpin the development of hydrogen infrastructure as a critical component of its energy strategy. European countries are investing in hydrogen technologies, aiming to integrate hydrogen stations into their broader renewable energy and transportation networks.
North America is an Emerging Market with Significant Potential
In North America, particularly in the United States and Canada, the hydrogen stations market is emerging, driven by increasing environmental awareness and the shift towards sustainable energy solutions. The region shows significant potential for market growth, with initiatives to develop hydrogen infrastructure as part of broader clean energy strategies. The partnership between government entities and private companies in North America is crucial for the market’s development, focusing on creating a sustainable and efficient hydrogen refueling ecosystem.
Hydrogen Stations Industry By Region
North America
- The US
- Canada
Europe
- Germany
- France
- The UK
- Spain
- Italy
- Russia
- Netherlands
- Rest of Europe
Asia-Pacific
- China
- Japan
- South Korea
- India
- New Zealand
- Singapore
- Thailand
- Vietnam
- Rest of Asia Pacific
Latin America
- Brazil
- Mexico
- Rest of Latin America
Middle East & Africa
- South Africa
- Saudi Arabia
- UAE
- Rest of the Middle East & Africa
Hydrogen Stations Market Key Player Analysis
The hydrogen Stations Market is crucial for the deployment of hydrogen fuel cell vehicles (FCVs), the companies listed are key in shaping this sector's growth and infrastructure. Air Liquide and Linde PLC, as industrial gas giants, are instrumental in the development and operation of hydrogen refueling stations, providing crucial expertise in hydrogen production and supply.
Air Products and Chemicals, Inc., with its extensive experience in gas production and distribution, plays a pivotal role in establishing and managing hydrogen fueling infrastructure, essential for the market's expansion. Ballard Power Systems, specializing in fuel cell technology, contributes to the market through the development of hydrogen-powered systems, showcasing the technological advancements driving hydrogen station viability.
Black and Veatch Holding Company and China Petrochemical Corporation, with their engineering and construction expertise, are key players in building the physical infrastructure required for hydrogen stations, reflecting the industry's move towards large-scale deployment. Cummins Inc. and FuelCell Energy, Inc., known for their power solutions, provide critical components and technologies for efficient hydrogen fueling systems.
FirstElement Fuel, Inc. and H2ENERGY Solutions LTD, focusing specifically on hydrogen fueling solutions, underscore the market's specialization and the growing number of companies dedicated solely to hydrogen infrastructure. ITM Power PLC and NEL ASA, with their expertise in electrolysis, contribute to the market by providing green hydrogen solutions, essential for sustainable hydrogen production.
Nuvera Fuel Cells, LLC and PDC Machines Inc., through their innovative fuel cell and compressor technologies, play crucial roles in enhancing the efficiency and reliability of hydrogen refueling. Shell, traditionally an oil and gas company, is increasingly investing in hydrogen infrastructure, indicating a significant industry shift towards sustainable energy solutions.
Collectively, these prominent players drive the growth of the Hydrogen Stations Market, representing a range of strategies from hydrogen production and supply to infrastructure development and technological innovation, essential for the widespread adoption of hydrogen as a clean fuel alternative.
Major Market Players in Hydrogen Stations Market
- Ballard Power Systems
- FirstElement Fuel, Inc.
- NEL ASA
- Iwatani Corporation
- PDC Machines Inc.
- Cummins Inc.
- Linde PLC
- Air Products and Chemicals, Inc.
- ITM Power PLC
- Powertech Labs Inc
- Peric Hydrogen Technologies Co., Ltd
- H2ENERGY Solutions LTD
- Black and Veatch Holding Company
- China Petrochemical Corporation
- FuelCell Energy, Inc.
- Shell
- McPhy Energy S.A.
- Nuvera Fuel Cells, LLC
- Air Liquide
Recent Developments
- In August 2023, Nikola Corporation recently secured a $16.3 million grant, bringing the total grant amount to $58.2 million, to support the construction of hydrogen refueling stations. This funding, in partnership with Voltera, aims to develop up to 50 HYLA hydrogen stations in North America over the next 5 years.
- In September 2023, a research initiative by the U.S. Department of Energy’s National Renewable Energy Laboratory (NREL) and Colorado State University (CSU) aimed at improving consumer confidence in driving hydrogen-fueled vehicles. The researchers propose the adoption of a predictive model, known as prognostics health monitoring (PHM), to anticipate maintenance needs in hydrogen fueling stations.
- On December 5, 2023, Hydrogen Refueling Solutions (HRS), a leading European designer and manufacturer of hydrogen refueling stations, announced its continued partnership with Plug Power Inc. The company has received a new firm order for two specific hydrogen refueling stations from Plug Power, bringing the total number of stations ordered by Plug to seven under their partnership established earlier in the year.
- In August 2023, Ampol, Australia's largest petrol retailer, has partnered with US firm OneH2 to expand the availability of hydrogen service stations in the country. The collaboration aims to accelerate the adoption of hydrogen in Australia, particularly for heavy transport, to reduce emissions.
- In November 2023, Australia's national science agency, CSIRO, in collaboration with Swinburne University of Technology’s Victorian Hydrogen Hub (VH2), has launched a state-of-the-art clean hydrogen refueling station at CSIRO's Clayton site in Victoria. The $2.5 million facility is dedicated to advancing hydrogen research, testing emerging hydrogen technology, and training the next generation on the use of hydrogen stations.
Report Scope
Report Features Description Market Value (2022) US$ 0.6 Bn Forecast Revenue (2032) US$ 3.7 Bn CAGR (2023-2032) 21.4% Base Year for Estimation 2022 Historic Period 2016-2022 Forecast Period 2023-2032 Report Coverage Revenue Forecast, Market Dynamics, COVID-19 Impact, Competitive Landscape, Recent Developments Segments Covered By Size (Small Station, Medium Station, Large Station), By Type (Onsite, Reforming, Electrolysis, Offsite (By Pressure (Low Pressure, High Pressure), By Mobility (Fixed Hydrogen Station, Mobile Hydrogen Station), By End-Use (Marine, Railways, Commercial Vehicles, Aviation) Regional Analysis North America - The US, Canada, Europe - Germany, France, The UK, Spain, Italy, Russia, Netherlands, Rest of Europe, Asia-Pacific - China, Japan, South Korea, India, New Zealand, Singapore, Thailand, Vietnam, Rest of Asia Pacific, Latin America - Brazil, Mexico, Rest of Latin America, Middle East & Africa - South Africa, Saudi Arabia, UAE, Rest of Middle East & Africa Competitive Landscape Hilleberg Ab., Johnson Outdoors Inc., The North Face Inc., AMG GROUP, Newell Brands Inc., Oase Outdoors, The Coleman Company, Simex Outdoor International, Kampa, Exxel Outdoors, Bushtec Safari (South Africa), Sawday’s Canopy & Stars Ltd. (UK), Huttopia (France), Wigwam Holidays Ltd (UK), Arena Campsites (Europe), Nightfall Camp Pty Ltd., Getaway House Inc. Customization Scope Customization for segments, region/country-level will be provided. Moreover, additional customization can be done based on the requirements. Purchase Options We have three licenses to opt for: Single User License, Multi-User License (Up to 5 Users), Corporate Use License (Unlimited User and Printable PDF) -
- 1. Executive Summary
- 1.1. Definition
- 1.2. Taxonomy
- 1.3. Research Scope
- 1.4. Key Analysis
- 1.5. Key Findings by Major Segments
- 1.6. Top strategies by Major Players
- 2. Global Hydrogen Stations Market Overview
- 2.1. Hydrogen Stations Market Dynamics
- 2.1.1. Drivers
- 2.1.2. Opportunities
- 2.1.3. Restraints
- 2.1.4. Challenges
- 2.2. Macro-economic Factors
- 2.3. Regulatory Framework
- 2.4. Market Investment Feasibility Index
- 2.5. PEST Analysis
- 2.6. PORTER’S Five Force Analysis
- 2.7. Drivers & Restraints Impact Analysis
- 2.8. Industry Chain Analysis
- 2.9. Cost Structure Analysis
- 2.10. Marketing Strategy
- 2.11. Russia-Ukraine War Impact Analysis
- 2.12. Opportunity Map Analysis
- 2.13. Market Competition Scenario Analysis
- 2.14. Product Life Cycle Analysis
- 2.15. Opportunity Orbits
- 2.16. Manufacturer Intensity Map
- 2.17. Major Companies sales by Value & Volume
- 2.1. Hydrogen Stations Market Dynamics
- 3. Global Hydrogen Stations Market Analysis, Opportunity and Forecast, 2016-2032
- 3.1. Global Hydrogen Stations Market Analysis, 2016-2021
- 3.2. Global Hydrogen Stations Market Opportunity and Forecast, 2023-2032
- 3.3. Global Hydrogen Stations Market Analysis, Opportunity and Forecast, By Size, 2016-2032
- 3.3.1. Global Hydrogen Stations Market Analysis by Size: Introduction
- 3.3.2. Market Size Absolute $ Opportunity Analysis and Forecast, By Size, 2016-2032
- 3.3.3. Small Station
- 3.3.4. Medium Station
- 3.3.5. Large Station
- 3.4. Global Hydrogen Stations Market Analysis, Opportunity and Forecast, By Station Type, 2016-2032
- 3.4.1. Global Hydrogen Stations Market Analysis by Station Type: Introduction
- 3.4.2. Market Size Absolute $ Opportunity Analysis and Forecast, By Station Type, 2016-2032
- 3.4.3. Onsite
- 3.4.4. Reforming
- 3.4.5. Electrolysis
- 3.4.6. Offsite
- 3.5. Global Hydrogen Stations Market Analysis, Opportunity and Forecast, By Pressure, 2016-2032
- 3.5.1. Global Hydrogen Stations Market Analysis by Pressure: Introduction
- 3.5.2. Market Size Absolute $ Opportunity Analysis and Forecast, By Pressure, 2016-2032
- 3.5.3. Low Pressure
- 3.5.4. High Pressure
- 3.6. Global Hydrogen Stations Market Analysis, Opportunity and Forecast, By Mobility, 2016-2032
- 3.6.1. Global Hydrogen Stations Market Analysis by Mobility: Introduction
- 3.6.2. Market Size Absolute $ Opportunity Analysis and Forecast, By Mobility, 2016-2032
- 3.6.3. Fixed Hydrogen Station
- 3.6.4. Mobile Hydrogen Station
- 3.7. Global Hydrogen Stations Market Analysis, Opportunity and Forecast, By End-Use, 2016-2032
- 3.7.1. Global Hydrogen Stations Market Analysis by End-Use: Introduction
- 3.7.2. Market Size Absolute $ Opportunity Analysis and Forecast, By End-Use, 2016-2032
- 3.7.3. Marine
- 3.7.4. Railways
- 3.7.5. Commercial Vehicles
- 3.7.6. Aviation
- 4. North America Hydrogen Stations Market Analysis, Opportunity and Forecast, 2016-2032
- 4.1. North America Hydrogen Stations Market Analysis, 2016-2021
- 4.2. North America Hydrogen Stations Market Opportunity and Forecast, 2023-2032
- 4.3. North America Hydrogen Stations Market Analysis, Opportunity and Forecast, By Size, 2016-2032
- 4.3.1. North America Hydrogen Stations Market Analysis by Size: Introduction
- 4.3.2. Market Size Absolute $ Opportunity Analysis and Forecast, By Size, 2016-2032
- 4.3.3. Small Station
- 4.3.4. Medium Station
- 4.3.5. Large Station
- 4.4. North America Hydrogen Stations Market Analysis, Opportunity and Forecast, By Station Type, 2016-2032
- 4.4.1. North America Hydrogen Stations Market Analysis by Station Type: Introduction
- 4.4.2. Market Size Absolute $ Opportunity Analysis and Forecast, By Station Type, 2016-2032
- 4.4.3. Onsite
- 4.4.4. Reforming
- 4.4.5. Electrolysis
- 4.4.6. Offsite
- 4.5. North America Hydrogen Stations Market Analysis, Opportunity and Forecast, By Pressure, 2016-2032
- 4.5.1. North America Hydrogen Stations Market Analysis by Pressure: Introduction
- 4.5.2. Market Size Absolute $ Opportunity Analysis and Forecast, By Pressure, 2016-2032
- 4.5.3. Low Pressure
- 4.5.4. High Pressure
- 4.6. North America Hydrogen Stations Market Analysis, Opportunity and Forecast, By Mobility, 2016-2032
- 4.6.1. North America Hydrogen Stations Market Analysis by Mobility: Introduction
- 4.6.2. Market Size Absolute $ Opportunity Analysis and Forecast, By Mobility, 2016-2032
- 4.6.3. Fixed Hydrogen Station
- 4.6.4. Mobile Hydrogen Station
- 4.7. North America Hydrogen Stations Market Analysis, Opportunity and Forecast, By End-Use, 2016-2032
- 4.7.1. North America Hydrogen Stations Market Analysis by End-Use: Introduction
- 4.7.2. Market Size Absolute $ Opportunity Analysis and Forecast, By End-Use, 2016-2032
- 4.7.3. Marine
- 4.7.4. Railways
- 4.7.5. Commercial Vehicles
- 4.7.6. Aviation
- 4.8. North America Hydrogen Stations Market Analysis, Opportunity and Forecast, By Country , 2016-2032
- 4.8.1. North America Hydrogen Stations Market Analysis by Country : Introduction
- 4.8.2. Market Size Absolute $ Opportunity Analysis and Forecast, Country , 2016-2032
- 4.8.2.1. The US
- 4.8.2.2. Canada
- 4.8.2.3. Mexico
- 5. Western Europe Hydrogen Stations Market Analysis, Opportunity and Forecast, 2016-2032
- 5.1. Western Europe Hydrogen Stations Market Analysis, 2016-2021
- 5.2. Western Europe Hydrogen Stations Market Opportunity and Forecast, 2023-2032
- 5.3. Western Europe Hydrogen Stations Market Analysis, Opportunity and Forecast, By Size, 2016-2032
- 5.3.1. Western Europe Hydrogen Stations Market Analysis by Size: Introduction
- 5.3.2. Market Size Absolute $ Opportunity Analysis and Forecast, By Size, 2016-2032
- 5.3.3. Small Station
- 5.3.4. Medium Station
- 5.3.5. Large Station
- 5.4. Western Europe Hydrogen Stations Market Analysis, Opportunity and Forecast, By Station Type, 2016-2032
- 5.4.1. Western Europe Hydrogen Stations Market Analysis by Station Type: Introduction
- 5.4.2. Market Size Absolute $ Opportunity Analysis and Forecast, By Station Type, 2016-2032
- 5.4.3. Onsite
- 5.4.4. Reforming
- 5.4.5. Electrolysis
- 5.4.6. Offsite
- 5.5. Western Europe Hydrogen Stations Market Analysis, Opportunity and Forecast, By Pressure, 2016-2032
- 5.5.1. Western Europe Hydrogen Stations Market Analysis by Pressure: Introduction
- 5.5.2. Market Size Absolute $ Opportunity Analysis and Forecast, By Pressure, 2016-2032
- 5.5.3. Low Pressure
- 5.5.4. High Pressure
- 5.6. Western Europe Hydrogen Stations Market Analysis, Opportunity and Forecast, By Mobility, 2016-2032
- 5.6.1. Western Europe Hydrogen Stations Market Analysis by Mobility: Introduction
- 5.6.2. Market Size Absolute $ Opportunity Analysis and Forecast, By Mobility, 2016-2032
- 5.6.3. Fixed Hydrogen Station
- 5.6.4. Mobile Hydrogen Station
- 5.7. Western Europe Hydrogen Stations Market Analysis, Opportunity and Forecast, By End-Use, 2016-2032
- 5.7.1. Western Europe Hydrogen Stations Market Analysis by End-Use: Introduction
- 5.7.2. Market Size Absolute $ Opportunity Analysis and Forecast, By End-Use, 2016-2032
- 5.7.3. Marine
- 5.7.4. Railways
- 5.7.5. Commercial Vehicles
- 5.7.6. Aviation
- 5.8. Western Europe Hydrogen Stations Market Analysis, Opportunity and Forecast, By Country , 2016-2032
- 5.8.1. Western Europe Hydrogen Stations Market Analysis by Country : Introduction
- 5.8.2. Market Size Absolute $ Opportunity Analysis and Forecast, Country , 2016-2032
- 5.8.2.1. Germany
- 5.8.2.2. France
- 5.8.2.3. The UK
- 5.8.2.4. Spain
- 5.8.2.5. Italy
- 5.8.2.6. Portugal
- 5.8.2.7. Ireland
- 5.8.2.8. Austria
- 5.8.2.9. Switzerland
- 5.8.2.10. Benelux
- 5.8.2.11. Nordic
- 5.8.2.12. Rest of Western Europe
- 6. Eastern Europe Hydrogen Stations Market Analysis, Opportunity and Forecast, 2016-2032
- 6.1. Eastern Europe Hydrogen Stations Market Analysis, 2016-2021
- 6.2. Eastern Europe Hydrogen Stations Market Opportunity and Forecast, 2023-2032
- 6.3. Eastern Europe Hydrogen Stations Market Analysis, Opportunity and Forecast, By Size, 2016-2032
- 6.3.1. Eastern Europe Hydrogen Stations Market Analysis by Size: Introduction
- 6.3.2. Market Size Absolute $ Opportunity Analysis and Forecast, By Size, 2016-2032
- 6.3.3. Small Station
- 6.3.4. Medium Station
- 6.3.5. Large Station
- 6.4. Eastern Europe Hydrogen Stations Market Analysis, Opportunity and Forecast, By Station Type, 2016-2032
- 6.4.1. Eastern Europe Hydrogen Stations Market Analysis by Station Type: Introduction
- 6.4.2. Market Size Absolute $ Opportunity Analysis and Forecast, By Station Type, 2016-2032
- 6.4.3. Onsite
- 6.4.4. Reforming
- 6.4.5. Electrolysis
- 6.4.6. Offsite
- 6.5. Eastern Europe Hydrogen Stations Market Analysis, Opportunity and Forecast, By Pressure, 2016-2032
- 6.5.1. Eastern Europe Hydrogen Stations Market Analysis by Pressure: Introduction
- 6.5.2. Market Size Absolute $ Opportunity Analysis and Forecast, By Pressure, 2016-2032
- 6.5.3. Low Pressure
- 6.5.4. High Pressure
- 6.6. Eastern Europe Hydrogen Stations Market Analysis, Opportunity and Forecast, By Mobility, 2016-2032
- 6.6.1. Eastern Europe Hydrogen Stations Market Analysis by Mobility: Introduction
- 6.6.2. Market Size Absolute $ Opportunity Analysis and Forecast, By Mobility, 2016-2032
- 6.6.3. Fixed Hydrogen Station
- 6.6.4. Mobile Hydrogen Station
- 6.7. Eastern Europe Hydrogen Stations Market Analysis, Opportunity and Forecast, By End-Use, 2016-2032
- 6.7.1. Eastern Europe Hydrogen Stations Market Analysis by End-Use: Introduction
- 6.7.2. Market Size Absolute $ Opportunity Analysis and Forecast, By End-Use, 2016-2032
- 6.7.3. Marine
- 6.7.4. Railways
- 6.7.5. Commercial Vehicles
- 6.7.6. Aviation
- 6.8. Eastern Europe Hydrogen Stations Market Analysis, Opportunity and Forecast, By Country , 2016-2032
- 6.8.1. Eastern Europe Hydrogen Stations Market Analysis by Country : Introduction
- 6.8.2. Market Size Absolute $ Opportunity Analysis and Forecast, Country , 2016-2032
- 6.8.2.1. Russia
- 6.8.2.2. Poland
- 6.8.2.3. The Czech Republic
- 6.8.2.4. Greece
- 6.8.2.5. Rest of Eastern Europe
- 7. APAC Hydrogen Stations Market Analysis, Opportunity and Forecast, 2016-2032
- 7.1. APAC Hydrogen Stations Market Analysis, 2016-2021
- 7.2. APAC Hydrogen Stations Market Opportunity and Forecast, 2023-2032
- 7.3. APAC Hydrogen Stations Market Analysis, Opportunity and Forecast, By Size, 2016-2032
- 7.3.1. APAC Hydrogen Stations Market Analysis by Size: Introduction
- 7.3.2. Market Size Absolute $ Opportunity Analysis and Forecast, By Size, 2016-2032
- 7.3.3. Small Station
- 7.3.4. Medium Station
- 7.3.5. Large Station
- 7.4. APAC Hydrogen Stations Market Analysis, Opportunity and Forecast, By Station Type, 2016-2032
- 7.4.1. APAC Hydrogen Stations Market Analysis by Station Type: Introduction
- 7.4.2. Market Size Absolute $ Opportunity Analysis and Forecast, By Station Type, 2016-2032
- 7.4.3. Onsite
- 7.4.4. Reforming
- 7.4.5. Electrolysis
- 7.4.6. Offsite
- 7.5. APAC Hydrogen Stations Market Analysis, Opportunity and Forecast, By Pressure, 2016-2032
- 7.5.1. APAC Hydrogen Stations Market Analysis by Pressure: Introduction
- 7.5.2. Market Size Absolute $ Opportunity Analysis and Forecast, By Pressure, 2016-2032
- 7.5.3. Low Pressure
- 7.5.4. High Pressure
- 7.6. APAC Hydrogen Stations Market Analysis, Opportunity and Forecast, By Mobility, 2016-2032
- 7.6.1. APAC Hydrogen Stations Market Analysis by Mobility: Introduction
- 7.6.2. Market Size Absolute $ Opportunity Analysis and Forecast, By Mobility, 2016-2032
- 7.6.3. Fixed Hydrogen Station
- 7.6.4. Mobile Hydrogen Station
- 7.7. APAC Hydrogen Stations Market Analysis, Opportunity and Forecast, By End-Use, 2016-2032
- 7.7.1. APAC Hydrogen Stations Market Analysis by End-Use: Introduction
- 7.7.2. Market Size Absolute $ Opportunity Analysis and Forecast, By End-Use, 2016-2032
- 7.7.3. Marine
- 7.7.4. Railways
- 7.7.5. Commercial Vehicles
- 7.7.6. Aviation
- 7.8. APAC Hydrogen Stations Market Analysis, Opportunity and Forecast, By Country , 2016-2032
- 7.8.1. APAC Hydrogen Stations Market Analysis by Country : Introduction
- 7.8.2. Market Size Absolute $ Opportunity Analysis and Forecast, Country , 2016-2032
- 7.8.2.1. China
- 7.8.2.2. Japan
- 7.8.2.3. South Korea
- 7.8.2.4. India
- 7.8.2.5. Australia & New Zeland
- 7.8.2.6. Indonesia
- 7.8.2.7. Malaysia
- 7.8.2.8. Philippines
- 7.8.2.9. Singapore
- 7.8.2.10. Thailand
- 7.8.2.11. Vietnam
- 7.8.2.12. Rest of APAC
- 8. Latin America Hydrogen Stations Market Analysis, Opportunity and Forecast, 2016-2032
- 8.1. Latin America Hydrogen Stations Market Analysis, 2016-2021
- 8.2. Latin America Hydrogen Stations Market Opportunity and Forecast, 2023-2032
- 8.3. Latin America Hydrogen Stations Market Analysis, Opportunity and Forecast, By Size, 2016-2032
- 8.3.1. Latin America Hydrogen Stations Market Analysis by Size: Introduction
- 8.3.2. Market Size Absolute $ Opportunity Analysis and Forecast, By Size, 2016-2032
- 8.3.3. Small Station
- 8.3.4. Medium Station
- 8.3.5. Large Station
- 8.4. Latin America Hydrogen Stations Market Analysis, Opportunity and Forecast, By Station Type, 2016-2032
- 8.4.1. Latin America Hydrogen Stations Market Analysis by Station Type: Introduction
- 8.4.2. Market Size Absolute $ Opportunity Analysis and Forecast, By Station Type, 2016-2032
- 8.4.3. Onsite
- 8.4.4. Reforming
- 8.4.5. Electrolysis
- 8.4.6. Offsite
- 8.5. Latin America Hydrogen Stations Market Analysis, Opportunity and Forecast, By Pressure, 2016-2032
- 8.5.1. Latin America Hydrogen Stations Market Analysis by Pressure: Introduction
- 8.5.2. Market Size Absolute $ Opportunity Analysis and Forecast, By Pressure, 2016-2032
- 8.5.3. Low Pressure
- 8.5.4. High Pressure
- 8.6. Latin America Hydrogen Stations Market Analysis, Opportunity and Forecast, By Mobility, 2016-2032
- 8.6.1. Latin America Hydrogen Stations Market Analysis by Mobility: Introduction
- 8.6.2. Market Size Absolute $ Opportunity Analysis and Forecast, By Mobility, 2016-2032
- 8.6.3. Fixed Hydrogen Station
- 8.6.4. Mobile Hydrogen Station
- 8.7. Latin America Hydrogen Stations Market Analysis, Opportunity and Forecast, By End-Use, 2016-2032
- 8.7.1. Latin America Hydrogen Stations Market Analysis by End-Use: Introduction
- 8.7.2. Market Size Absolute $ Opportunity Analysis and Forecast, By End-Use, 2016-2032
- 8.7.3. Marine
- 8.7.4. Railways
- 8.7.5. Commercial Vehicles
- 8.7.6. Aviation
- 8.8. Latin America Hydrogen Stations Market Analysis, Opportunity and Forecast, By Country , 2016-2032
- 8.8.1. Latin America Hydrogen Stations Market Analysis by Country : Introduction
- 8.8.2. Market Size Absolute $ Opportunity Analysis and Forecast, Country , 2016-2032
- 8.8.2.1. Brazil
- 8.8.2.2. Colombia
- 8.8.2.3. Chile
- 8.8.2.4. Argentina
- 8.8.2.5. Costa Rica
- 8.8.2.6. Rest of Latin America
- 9. Middle East & Africa Hydrogen Stations Market Analysis, Opportunity and Forecast, 2016-2032
- 9.1. Middle East & Africa Hydrogen Stations Market Analysis, 2016-2021
- 9.2. Middle East & Africa Hydrogen Stations Market Opportunity and Forecast, 2023-2032
- 9.3. Middle East & Africa Hydrogen Stations Market Analysis, Opportunity and Forecast, By Size, 2016-2032
- 9.3.1. Middle East & Africa Hydrogen Stations Market Analysis by Size: Introduction
- 9.3.2. Market Size Absolute $ Opportunity Analysis and Forecast, By Size, 2016-2032
- 9.3.3. Small Station
- 9.3.4. Medium Station
- 9.3.5. Large Station
- 9.4. Middle East & Africa Hydrogen Stations Market Analysis, Opportunity and Forecast, By Station Type, 2016-2032
- 9.4.1. Middle East & Africa Hydrogen Stations Market Analysis by Station Type: Introduction
- 9.4.2. Market Size Absolute $ Opportunity Analysis and Forecast, By Station Type, 2016-2032
- 9.4.3. Onsite
- 9.4.4. Reforming
- 9.4.5. Electrolysis
- 9.4.6. Offsite
- 9.5. Middle East & Africa Hydrogen Stations Market Analysis, Opportunity and Forecast, By Pressure, 2016-2032
- 9.5.1. Middle East & Africa Hydrogen Stations Market Analysis by Pressure: Introduction
- 9.5.2. Market Size Absolute $ Opportunity Analysis and Forecast, By Pressure, 2016-2032
- 9.5.3. Low Pressure
- 9.5.4. High Pressure
- 9.6. Middle East & Africa Hydrogen Stations Market Analysis, Opportunity and Forecast, By Mobility, 2016-2032
- 9.6.1. Middle East & Africa Hydrogen Stations Market Analysis by Mobility: Introduction
- 9.6.2. Market Size Absolute $ Opportunity Analysis and Forecast, By Mobility, 2016-2032
- 9.6.3. Fixed Hydrogen Station
- 9.6.4. Mobile Hydrogen Station
- 9.7. Middle East & Africa Hydrogen Stations Market Analysis, Opportunity and Forecast, By End-Use, 2016-2032
- 9.7.1. Middle East & Africa Hydrogen Stations Market Analysis by End-Use: Introduction
- 9.7.2. Market Size Absolute $ Opportunity Analysis and Forecast, By End-Use, 2016-2032
- 9.7.3. Marine
- 9.7.4. Railways
- 9.7.5. Commercial Vehicles
- 9.7.6. Aviation
- 9.8. Middle East & Africa Hydrogen Stations Market Analysis, Opportunity and Forecast, By Country , 2016-2032
- 9.8.1. Middle East & Africa Hydrogen Stations Market Analysis by Country : Introduction
- 9.8.2. Market Size Absolute $ Opportunity Analysis and Forecast, Country , 2016-2032
- 9.8.2.1. Algeria
- 9.8.2.2. Egypt
- 9.8.2.3. Israel
- 9.8.2.4. Kuwait
- 9.8.2.5. Nigeria
- 9.8.2.6. Saudi Arabia
- 9.8.2.7. South Africa
- 9.8.2.8. Turkey
- 9.8.2.9. The UAE
- 9.8.2.10. Rest of MEA
- 10. Global Hydrogen Stations Market Analysis, Opportunity and Forecast, By Region , 2016-2032
- 10.1. Global Hydrogen Stations Market Analysis by Region : Introduction
- 10.2. Market Size Absolute $ Opportunity Analysis and Forecast, By Region , 2016-2032
- 10.2.1. North America
- 10.2.2. Western Europe
- 10.2.3. Eastern Europe
- 10.2.4. APAC
- 10.2.5. Latin America
- 10.2.6. Middle East & Africa
- 11. Global Hydrogen Stations Market Competitive Landscape, Market Share Analysis, and Company Profiles
- 11.1. Market Share Analysis
- 11.2. Company Profiles
- 11.3. Ballard Power Systems
- 11.3.1. Company Overview
- 11.3.2. Financial Highlights
- 11.3.3. Product Portfolio
- 11.3.4. SWOT Analysis
- 11.3.5. Key Strategies and Developments
- 11.4. FirstElement Fuel, Inc.
- 11.4.1. Company Overview
- 11.4.2. Financial Highlights
- 11.4.3. Product Portfolio
- 11.4.4. SWOT Analysis
- 11.4.5. Key Strategies and Developments
- 11.5. NEL ASA
- 11.5.1. Company Overview
- 11.5.2. Financial Highlights
- 11.5.3. Product Portfolio
- 11.5.4. SWOT Analysis
- 11.5.5. Key Strategies and Developments
- 11.6. Iwatani Corporation
- 11.6.1. Company Overview
- 11.6.2. Financial Highlights
- 11.6.3. Product Portfolio
- 11.6.4. SWOT Analysis
- 11.6.5. Key Strategies and Developments
- 11.7. PDC Machines Inc.
- 11.7.1. Company Overview
- 11.7.2. Financial Highlights
- 11.7.3. Product Portfolio
- 11.7.4. SWOT Analysis
- 11.7.5. Key Strategies and Developments
- 11.8. Cummins Inc.
- 11.8.1. Company Overview
- 11.8.2. Financial Highlights
- 11.8.3. Product Portfolio
- 11.8.4. SWOT Analysis
- 11.8.5. Key Strategies and Developments
- 11.9. Linde PLC
- 11.9.1. Company Overview
- 11.9.2. Financial Highlights
- 11.9.3. Product Portfolio
- 11.9.4. SWOT Analysis
- 11.9.5. Key Strategies and Developments
- 11.10. Air Products and Chemicals, Inc.
- 11.10.1. Company Overview
- 11.10.2. Financial Highlights
- 11.10.3. Product Portfolio
- 11.10.4. SWOT Analysis
- 11.10.5. Key Strategies and Developments
- 11.11. ITM Power PLC
- 11.11.1. Company Overview
- 11.11.2. Financial Highlights
- 11.11.3. Product Portfolio
- 11.11.4. SWOT Analysis
- 11.11.5. Key Strategies and Developments
- 11.12. Powertech Labs Inc
- 11.12.1. Company Overview
- 11.12.2. Financial Highlights
- 11.12.3. Product Portfolio
- 11.12.4. SWOT Analysis
- 11.12.5. Key Strategies and Developments
- 11.13.1. Company Overview
- 11.13.2. Financial Highlights
- 11.13.3. Product Portfolio
- 11.13.4. SWOT Analysis
- 11.13.5. Key Strategies and Developments
- 11.14. Peric Hydrogen Technologies Co., Ltd
- 11.14.1. Company Overview
- 11.14.2. Financial Highlights
- 11.14.3. Product Portfolio
- 11.14.4. SWOT Analysis
- 11.14.5. Key Strategies and Developments
- 11.15. Black and Veatch Holding Company
- 11.15.1. Company Overview
- 11.15.2. Financial Highlights
- 11.15.3. Product Portfolio
- 11.15.4. SWOT Analysis
- 11.15.5. Key Strategies and Developments
- 11.16. China Petrochemical Corporation
- 11.16.1. Company Overview
- 11.16.2. Financial Highlights
- 11.16.3. Product Portfolio
- 11.16.4. SWOT Analysis
- 11.16.5. Key Strategies and Developments
- 11.17. FuelCell Energy, Inc.
- 11.17.1. Company Overview
- 11.17.2. Financial Highlights
- 11.17.3. Product Portfolio
- 11.17.4. SWOT Analysis
- 11.17.5. Key Strategies and Developments
- 11.18. Shell
- 11.18.1. Company Overview
- 11.18.2. Financial Highlights
- 11.18.3. Product Portfolio
- 11.18.4. SWOT Analysis
- 11.18.5. Key Strategies and Developments
- 11.19. McPhy Energy S.A.
- 11.19.1. Company Overview
- 11.19.2. Financial Highlights
- 11.19.3. Product Portfolio
- 11.19.4. SWOT Analysis
- 11.19.5. Key Strategies and Developments
- 11.20. Nuvera Fuel Cells, LLC
- 11.20.1. Company Overview
- 11.20.2. Financial Highlights
- 11.20.3. Product Portfolio
- 11.20.4. SWOT Analysis
- 11.20.5. Key Strategies and Developments
- 11.21. Air Liquide
- 11.21.1. Company Overview
- 11.21.2. Financial Highlights
- 11.21.3. Product Portfolio
- 11.21.4. SWOT Analysis
- 11.21.5. Key Strategies and Developments
- 11.22. Other Key Players
- 11.22.1. Company Overview
- 11.22.2. Financial Highlights
- 11.22.3. Product Portfolio
- 11.22.4. SWOT Analysis
- 11.22.5. Key Strategies and Developments
- 12. Assumptions and Acronyms
- 13. Research Methodology
- 14. Contact
- List of Figures
- Figure 1: Global Hydrogen Stations Market Revenue (US$ Mn) Market Share by Size in 2022
- Figure 2: Global Hydrogen Stations Market Attractiveness Analysis by Size, 2016-2032
- Figure 3: Global Hydrogen Stations Market Revenue (US$ Mn) Market Share by Station Typein 2022
- Figure 4: Global Hydrogen Stations Market Attractiveness Analysis by Station Type, 2016-2032
- Figure 5: Global Hydrogen Stations Market Revenue (US$ Mn) Market Share by Pressurein 2022
- Figure 6: Global Hydrogen Stations Market Attractiveness Analysis by Pressure, 2016-2032
- Figure 7: Global Hydrogen Stations Market Revenue (US$ Mn) Market Share by Mobilityin 2022
- Figure 8: Global Hydrogen Stations Market Attractiveness Analysis by Mobility, 2016-2032
- Figure 9: Global Hydrogen Stations Market Revenue (US$ Mn) Market Share by End-Usein 2022
- Figure 10: Global Hydrogen Stations Market Attractiveness Analysis by End-Use, 2016-2032
- Figure 11: Global Hydrogen Stations Market Revenue (US$ Mn) Market Share by Region in 2022
- Figure 12: Global Hydrogen Stations Market Attractiveness Analysis by Region, 2016-2032
- Figure 13: Global Hydrogen Stations Market Revenue (US$ Mn) (2016-2032)
- Figure 14: Global Hydrogen Stations Market Revenue (US$ Mn) Comparison by Region (2016-2032)
- Figure 15: Global Hydrogen Stations Market Revenue (US$ Mn) Comparison by Size (2016-2032)
- Figure 16: Global Hydrogen Stations Market Revenue (US$ Mn) Comparison by Station Type (2016-2032)
- Figure 17: Global Hydrogen Stations Market Revenue (US$ Mn) Comparison by Pressure (2016-2032)
- Figure 18: Global Hydrogen Stations Market Revenue (US$ Mn) Comparison by Mobility (2016-2032)
- Figure 19: Global Hydrogen Stations Market Revenue (US$ Mn) Comparison by End-Use (2016-2032)
- Figure 20: Global Hydrogen Stations Market Y-o-Y Growth Rate Comparison by Region (2016-2032)
- Figure 21: Global Hydrogen Stations Market Y-o-Y Growth Rate Comparison by Size (2016-2032)
- Figure 22: Global Hydrogen Stations Market Y-o-Y Growth Rate Comparison by Station Type (2016-2032)
- Figure 23: Global Hydrogen Stations Market Y-o-Y Growth Rate Comparison by Pressure (2016-2032)
- Figure 24: Global Hydrogen Stations Market Y-o-Y Growth Rate Comparison by Mobility (2016-2032)
- Figure 25: Global Hydrogen Stations Market Y-o-Y Growth Rate Comparison by End-Use (2016-2032)
- Figure 26: Global Hydrogen Stations Market Share Comparison by Region (2016-2032)
- Figure 27: Global Hydrogen Stations Market Share Comparison by Size (2016-2032)
- Figure 28: Global Hydrogen Stations Market Share Comparison by Station Type (2016-2032)
- Figure 29: Global Hydrogen Stations Market Share Comparison by Pressure (2016-2032)
- Figure 30: Global Hydrogen Stations Market Share Comparison by Mobility (2016-2032)
- Figure 31: Global Hydrogen Stations Market Share Comparison by End-Use (2016-2032)
- Figure 32: North America Hydrogen Stations Market Revenue (US$ Mn) Market Share by Sizein 2022
- Figure 33: North America Hydrogen Stations Market Attractiveness Analysis by Size, 2016-2032
- Figure 34: North America Hydrogen Stations Market Revenue (US$ Mn) Market Share by Station Typein 2022
- Figure 35: North America Hydrogen Stations Market Attractiveness Analysis by Station Type, 2016-2032
- Figure 36: North America Hydrogen Stations Market Revenue (US$ Mn) Market Share by Pressurein 2022
- Figure 37: North America Hydrogen Stations Market Attractiveness Analysis by Pressure, 2016-2032
- Figure 38: North America Hydrogen Stations Market Revenue (US$ Mn) Market Share by Mobilityin 2022
- Figure 39: North America Hydrogen Stations Market Attractiveness Analysis by Mobility, 2016-2032
- Figure 40: North America Hydrogen Stations Market Revenue (US$ Mn) Market Share by End-Usein 2022
- Figure 41: North America Hydrogen Stations Market Attractiveness Analysis by End-Use, 2016-2032
- Figure 42: North America Hydrogen Stations Market Revenue (US$ Mn) Market Share by Country in 2022
- Figure 43: North America Hydrogen Stations Market Attractiveness Analysis by Country, 2016-2032
- Figure 44: North America Hydrogen Stations Market Revenue (US$ Mn) (2016-2032)
- Figure 45: North America Hydrogen Stations Market Revenue (US$ Mn) Comparison by Country (2016-2032)
- Figure 46: North America Hydrogen Stations Market Revenue (US$ Mn) Comparison by Size (2016-2032)
- Figure 47: North America Hydrogen Stations Market Revenue (US$ Mn) Comparison by Station Type (2016-2032)
- Figure 48: North America Hydrogen Stations Market Revenue (US$ Mn) Comparison by Pressure (2016-2032)
- Figure 49: North America Hydrogen Stations Market Revenue (US$ Mn) Comparison by Mobility (2016-2032)
- Figure 50: North America Hydrogen Stations Market Revenue (US$ Mn) Comparison by End-Use (2016-2032)
- Figure 51: North America Hydrogen Stations Market Y-o-Y Growth Rate Comparison by Country (2016-2032)
- Figure 52: North America Hydrogen Stations Market Y-o-Y Growth Rate Comparison by Size (2016-2032)
- Figure 53: North America Hydrogen Stations Market Y-o-Y Growth Rate Comparison by Station Type (2016-2032)
- Figure 54: North America Hydrogen Stations Market Y-o-Y Growth Rate Comparison by Pressure (2016-2032)
- Figure 55: North America Hydrogen Stations Market Y-o-Y Growth Rate Comparison by Mobility (2016-2032)
- Figure 56: North America Hydrogen Stations Market Y-o-Y Growth Rate Comparison by End-Use (2016-2032)
- Figure 57: North America Hydrogen Stations Market Share Comparison by Country (2016-2032)
- Figure 58: North America Hydrogen Stations Market Share Comparison by Size (2016-2032)
- Figure 59: North America Hydrogen Stations Market Share Comparison by Station Type (2016-2032)
- Figure 60: North America Hydrogen Stations Market Share Comparison by Pressure (2016-2032)
- Figure 61: North America Hydrogen Stations Market Share Comparison by Mobility (2016-2032)
- Figure 62: North America Hydrogen Stations Market Share Comparison by End-Use (2016-2032)
- Figure 63: Western Europe Hydrogen Stations Market Revenue (US$ Mn) Market Share by Sizein 2022
- Figure 64: Western Europe Hydrogen Stations Market Attractiveness Analysis by Size, 2016-2032
- Figure 65: Western Europe Hydrogen Stations Market Revenue (US$ Mn) Market Share by Station Typein 2022
- Figure 66: Western Europe Hydrogen Stations Market Attractiveness Analysis by Station Type, 2016-2032
- Figure 67: Western Europe Hydrogen Stations Market Revenue (US$ Mn) Market Share by Pressurein 2022
- Figure 68: Western Europe Hydrogen Stations Market Attractiveness Analysis by Pressure, 2016-2032
- Figure 69: Western Europe Hydrogen Stations Market Revenue (US$ Mn) Market Share by Mobilityin 2022
- Figure 70: Western Europe Hydrogen Stations Market Attractiveness Analysis by Mobility, 2016-2032
- Figure 71: Western Europe Hydrogen Stations Market Revenue (US$ Mn) Market Share by End-Usein 2022
- Figure 72: Western Europe Hydrogen Stations Market Attractiveness Analysis by End-Use, 2016-2032
- Figure 73: Western Europe Hydrogen Stations Market Revenue (US$ Mn) Market Share by Country in 2022
- Figure 74: Western Europe Hydrogen Stations Market Attractiveness Analysis by Country, 2016-2032
- Figure 75: Western Europe Hydrogen Stations Market Revenue (US$ Mn) (2016-2032)
- Figure 76: Western Europe Hydrogen Stations Market Revenue (US$ Mn) Comparison by Country (2016-2032)
- Figure 77: Western Europe Hydrogen Stations Market Revenue (US$ Mn) Comparison by Size (2016-2032)
- Figure 78: Western Europe Hydrogen Stations Market Revenue (US$ Mn) Comparison by Station Type (2016-2032)
- Figure 79: Western Europe Hydrogen Stations Market Revenue (US$ Mn) Comparison by Pressure (2016-2032)
- Figure 80: Western Europe Hydrogen Stations Market Revenue (US$ Mn) Comparison by Mobility (2016-2032)
- Figure 81: Western Europe Hydrogen Stations Market Revenue (US$ Mn) Comparison by End-Use (2016-2032)
- Figure 82: Western Europe Hydrogen Stations Market Y-o-Y Growth Rate Comparison by Country (2016-2032)
- Figure 83: Western Europe Hydrogen Stations Market Y-o-Y Growth Rate Comparison by Size (2016-2032)
- Figure 84: Western Europe Hydrogen Stations Market Y-o-Y Growth Rate Comparison by Station Type (2016-2032)
- Figure 85: Western Europe Hydrogen Stations Market Y-o-Y Growth Rate Comparison by Pressure (2016-2032)
- Figure 86: Western Europe Hydrogen Stations Market Y-o-Y Growth Rate Comparison by Mobility (2016-2032)
- Figure 87: Western Europe Hydrogen Stations Market Y-o-Y Growth Rate Comparison by End-Use (2016-2032)
- Figure 88: Western Europe Hydrogen Stations Market Share Comparison by Country (2016-2032)
- Figure 89: Western Europe Hydrogen Stations Market Share Comparison by Size (2016-2032)
- Figure 90: Western Europe Hydrogen Stations Market Share Comparison by Station Type (2016-2032)
- Figure 91: Western Europe Hydrogen Stations Market Share Comparison by Pressure (2016-2032)
- Figure 92: Western Europe Hydrogen Stations Market Share Comparison by Mobility (2016-2032)
- Figure 93: Western Europe Hydrogen Stations Market Share Comparison by End-Use (2016-2032)
- Figure 94: Eastern Europe Hydrogen Stations Market Revenue (US$ Mn) Market Share by Sizein 2022
- Figure 95: Eastern Europe Hydrogen Stations Market Attractiveness Analysis by Size, 2016-2032
- Figure 96: Eastern Europe Hydrogen Stations Market Revenue (US$ Mn) Market Share by Station Typein 2022
- Figure 97: Eastern Europe Hydrogen Stations Market Attractiveness Analysis by Station Type, 2016-2032
- Figure 98: Eastern Europe Hydrogen Stations Market Revenue (US$ Mn) Market Share by Pressurein 2022
- Figure 99: Eastern Europe Hydrogen Stations Market Attractiveness Analysis by Pressure, 2016-2032
- Figure 100: Eastern Europe Hydrogen Stations Market Revenue (US$ Mn) Market Share by Mobilityin 2022
- Figure 101: Eastern Europe Hydrogen Stations Market Attractiveness Analysis by Mobility, 2016-2032
- Figure 102: Eastern Europe Hydrogen Stations Market Revenue (US$ Mn) Market Share by End-Usein 2022
- Figure 103: Eastern Europe Hydrogen Stations Market Attractiveness Analysis by End-Use, 2016-2032
- Figure 104: Eastern Europe Hydrogen Stations Market Revenue (US$ Mn) Market Share by Country in 2022
- Figure 105: Eastern Europe Hydrogen Stations Market Attractiveness Analysis by Country, 2016-2032
- Figure 106: Eastern Europe Hydrogen Stations Market Revenue (US$ Mn) (2016-2032)
- Figure 107: Eastern Europe Hydrogen Stations Market Revenue (US$ Mn) Comparison by Country (2016-2032)
- Figure 108: Eastern Europe Hydrogen Stations Market Revenue (US$ Mn) Comparison by Size (2016-2032)
- Figure 109: Eastern Europe Hydrogen Stations Market Revenue (US$ Mn) Comparison by Station Type (2016-2032)
- Figure 110: Eastern Europe Hydrogen Stations Market Revenue (US$ Mn) Comparison by Pressure (2016-2032)
- Figure 111: Eastern Europe Hydrogen Stations Market Revenue (US$ Mn) Comparison by Mobility (2016-2032)
- Figure 112: Eastern Europe Hydrogen Stations Market Revenue (US$ Mn) Comparison by End-Use (2016-2032)
- Figure 113: Eastern Europe Hydrogen Stations Market Y-o-Y Growth Rate Comparison by Country (2016-2032)
- Figure 114: Eastern Europe Hydrogen Stations Market Y-o-Y Growth Rate Comparison by Size (2016-2032)
- Figure 115: Eastern Europe Hydrogen Stations Market Y-o-Y Growth Rate Comparison by Station Type (2016-2032)
- Figure 116: Eastern Europe Hydrogen Stations Market Y-o-Y Growth Rate Comparison by Pressure (2016-2032)
- Figure 117: Eastern Europe Hydrogen Stations Market Y-o-Y Growth Rate Comparison by Mobility (2016-2032)
- Figure 118: Eastern Europe Hydrogen Stations Market Y-o-Y Growth Rate Comparison by End-Use (2016-2032)
- Figure 119: Eastern Europe Hydrogen Stations Market Share Comparison by Country (2016-2032)
- Figure 120: Eastern Europe Hydrogen Stations Market Share Comparison by Size (2016-2032)
- Figure 121: Eastern Europe Hydrogen Stations Market Share Comparison by Station Type (2016-2032)
- Figure 122: Eastern Europe Hydrogen Stations Market Share Comparison by Pressure (2016-2032)
- Figure 123: Eastern Europe Hydrogen Stations Market Share Comparison by Mobility (2016-2032)
- Figure 124: Eastern Europe Hydrogen Stations Market Share Comparison by End-Use (2016-2032)
- Figure 125: APAC Hydrogen Stations Market Revenue (US$ Mn) Market Share by Sizein 2022
- Figure 126: APAC Hydrogen Stations Market Attractiveness Analysis by Size, 2016-2032
- Figure 127: APAC Hydrogen Stations Market Revenue (US$ Mn) Market Share by Station Typein 2022
- Figure 128: APAC Hydrogen Stations Market Attractiveness Analysis by Station Type, 2016-2032
- Figure 129: APAC Hydrogen Stations Market Revenue (US$ Mn) Market Share by Pressurein 2022
- Figure 130: APAC Hydrogen Stations Market Attractiveness Analysis by Pressure, 2016-2032
- Figure 131: APAC Hydrogen Stations Market Revenue (US$ Mn) Market Share by Mobilityin 2022
- Figure 132: APAC Hydrogen Stations Market Attractiveness Analysis by Mobility, 2016-2032
- Figure 133: APAC Hydrogen Stations Market Revenue (US$ Mn) Market Share by End-Usein 2022
- Figure 134: APAC Hydrogen Stations Market Attractiveness Analysis by End-Use, 2016-2032
- Figure 135: APAC Hydrogen Stations Market Revenue (US$ Mn) Market Share by Country in 2022
- Figure 136: APAC Hydrogen Stations Market Attractiveness Analysis by Country, 2016-2032
- Figure 137: APAC Hydrogen Stations Market Revenue (US$ Mn) (2016-2032)
- Figure 138: APAC Hydrogen Stations Market Revenue (US$ Mn) Comparison by Country (2016-2032)
- Figure 139: APAC Hydrogen Stations Market Revenue (US$ Mn) Comparison by Size (2016-2032)
- Figure 140: APAC Hydrogen Stations Market Revenue (US$ Mn) Comparison by Station Type (2016-2032)
- Figure 141: APAC Hydrogen Stations Market Revenue (US$ Mn) Comparison by Pressure (2016-2032)
- Figure 142: APAC Hydrogen Stations Market Revenue (US$ Mn) Comparison by Mobility (2016-2032)
- Figure 143: APAC Hydrogen Stations Market Revenue (US$ Mn) Comparison by End-Use (2016-2032)
- Figure 144: APAC Hydrogen Stations Market Y-o-Y Growth Rate Comparison by Country (2016-2032)
- Figure 145: APAC Hydrogen Stations Market Y-o-Y Growth Rate Comparison by Size (2016-2032)
- Figure 146: APAC Hydrogen Stations Market Y-o-Y Growth Rate Comparison by Station Type (2016-2032)
- Figure 147: APAC Hydrogen Stations Market Y-o-Y Growth Rate Comparison by Pressure (2016-2032)
- Figure 148: APAC Hydrogen Stations Market Y-o-Y Growth Rate Comparison by Mobility (2016-2032)
- Figure 149: APAC Hydrogen Stations Market Y-o-Y Growth Rate Comparison by End-Use (2016-2032)
- Figure 150: APAC Hydrogen Stations Market Share Comparison by Country (2016-2032)
- Figure 151: APAC Hydrogen Stations Market Share Comparison by Size (2016-2032)
- Figure 152: APAC Hydrogen Stations Market Share Comparison by Station Type (2016-2032)
- Figure 153: APAC Hydrogen Stations Market Share Comparison by Pressure (2016-2032)
- Figure 154: APAC Hydrogen Stations Market Share Comparison by Mobility (2016-2032)
- Figure 155: APAC Hydrogen Stations Market Share Comparison by End-Use (2016-2032)
- Figure 156: Latin America Hydrogen Stations Market Revenue (US$ Mn) Market Share by Sizein 2022
- Figure 157: Latin America Hydrogen Stations Market Attractiveness Analysis by Size, 2016-2032
- Figure 158: Latin America Hydrogen Stations Market Revenue (US$ Mn) Market Share by Station Typein 2022
- Figure 159: Latin America Hydrogen Stations Market Attractiveness Analysis by Station Type, 2016-2032
- Figure 160: Latin America Hydrogen Stations Market Revenue (US$ Mn) Market Share by Pressurein 2022
- Figure 161: Latin America Hydrogen Stations Market Attractiveness Analysis by Pressure, 2016-2032
- Figure 162: Latin America Hydrogen Stations Market Revenue (US$ Mn) Market Share by Mobilityin 2022
- Figure 163: Latin America Hydrogen Stations Market Attractiveness Analysis by Mobility, 2016-2032
- Figure 164: Latin America Hydrogen Stations Market Revenue (US$ Mn) Market Share by End-Usein 2022
- Figure 165: Latin America Hydrogen Stations Market Attractiveness Analysis by End-Use, 2016-2032
- Figure 166: Latin America Hydrogen Stations Market Revenue (US$ Mn) Market Share by Country in 2022
- Figure 167: Latin America Hydrogen Stations Market Attractiveness Analysis by Country, 2016-2032
- Figure 168: Latin America Hydrogen Stations Market Revenue (US$ Mn) (2016-2032)
- Figure 169: Latin America Hydrogen Stations Market Revenue (US$ Mn) Comparison by Country (2016-2032)
- Figure 170: Latin America Hydrogen Stations Market Revenue (US$ Mn) Comparison by Size (2016-2032)
- Figure 171: Latin America Hydrogen Stations Market Revenue (US$ Mn) Comparison by Station Type (2016-2032)
- Figure 172: Latin America Hydrogen Stations Market Revenue (US$ Mn) Comparison by Pressure (2016-2032)
- Figure 173: Latin America Hydrogen Stations Market Revenue (US$ Mn) Comparison by Mobility (2016-2032)
- Figure 174: Latin America Hydrogen Stations Market Revenue (US$ Mn) Comparison by End-Use (2016-2032)
- Figure 175: Latin America Hydrogen Stations Market Y-o-Y Growth Rate Comparison by Country (2016-2032)
- Figure 176: Latin America Hydrogen Stations Market Y-o-Y Growth Rate Comparison by Size (2016-2032)
- Figure 177: Latin America Hydrogen Stations Market Y-o-Y Growth Rate Comparison by Station Type (2016-2032)
- Figure 178: Latin America Hydrogen Stations Market Y-o-Y Growth Rate Comparison by Pressure (2016-2032)
- Figure 179: Latin America Hydrogen Stations Market Y-o-Y Growth Rate Comparison by Mobility (2016-2032)
- Figure 180: Latin America Hydrogen Stations Market Y-o-Y Growth Rate Comparison by End-Use (2016-2032)
- Figure 181: Latin America Hydrogen Stations Market Share Comparison by Country (2016-2032)
- Figure 182: Latin America Hydrogen Stations Market Share Comparison by Size (2016-2032)
- Figure 183: Latin America Hydrogen Stations Market Share Comparison by Station Type (2016-2032)
- Figure 184: Latin America Hydrogen Stations Market Share Comparison by Pressure (2016-2032)
- Figure 185: Latin America Hydrogen Stations Market Share Comparison by Mobility (2016-2032)
- Figure 186: Latin America Hydrogen Stations Market Share Comparison by End-Use (2016-2032)
- Figure 187: Middle East & Africa Hydrogen Stations Market Revenue (US$ Mn) Market Share by Sizein 2022
- Figure 188: Middle East & Africa Hydrogen Stations Market Attractiveness Analysis by Size, 2016-2032
- Figure 189: Middle East & Africa Hydrogen Stations Market Revenue (US$ Mn) Market Share by Station Typein 2022
- Figure 190: Middle East & Africa Hydrogen Stations Market Attractiveness Analysis by Station Type, 2016-2032
- Figure 191: Middle East & Africa Hydrogen Stations Market Revenue (US$ Mn) Market Share by Pressurein 2022
- Figure 192: Middle East & Africa Hydrogen Stations Market Attractiveness Analysis by Pressure, 2016-2032
- Figure 193: Middle East & Africa Hydrogen Stations Market Revenue (US$ Mn) Market Share by Mobilityin 2022
- Figure 194: Middle East & Africa Hydrogen Stations Market Attractiveness Analysis by Mobility, 2016-2032
- Figure 195: Middle East & Africa Hydrogen Stations Market Revenue (US$ Mn) Market Share by End-Usein 2022
- Figure 196: Middle East & Africa Hydrogen Stations Market Attractiveness Analysis by End-Use, 2016-2032
- Figure 197: Middle East & Africa Hydrogen Stations Market Revenue (US$ Mn) Market Share by Country in 2022
- Figure 198: Middle East & Africa Hydrogen Stations Market Attractiveness Analysis by Country, 2016-2032
- Figure 199: Middle East & Africa Hydrogen Stations Market Revenue (US$ Mn) (2016-2032)
- Figure 200: Middle East & Africa Hydrogen Stations Market Revenue (US$ Mn) Comparison by Country (2016-2032)
- Figure 201: Middle East & Africa Hydrogen Stations Market Revenue (US$ Mn) Comparison by Size (2016-2032)
- Figure 202: Middle East & Africa Hydrogen Stations Market Revenue (US$ Mn) Comparison by Station Type (2016-2032)
- Figure 203: Middle East & Africa Hydrogen Stations Market Revenue (US$ Mn) Comparison by Pressure (2016-2032)
- Figure 204: Middle East & Africa Hydrogen Stations Market Revenue (US$ Mn) Comparison by Mobility (2016-2032)
- Figure 205: Middle East & Africa Hydrogen Stations Market Revenue (US$ Mn) Comparison by End-Use (2016-2032)
- Figure 206: Middle East & Africa Hydrogen Stations Market Y-o-Y Growth Rate Comparison by Country (2016-2032)
- Figure 207: Middle East & Africa Hydrogen Stations Market Y-o-Y Growth Rate Comparison by Size (2016-2032)
- Figure 208: Middle East & Africa Hydrogen Stations Market Y-o-Y Growth Rate Comparison by Station Type (2016-2032)
- Figure 209: Middle East & Africa Hydrogen Stations Market Y-o-Y Growth Rate Comparison by Pressure (2016-2032)
- Figure 210: Middle East & Africa Hydrogen Stations Market Y-o-Y Growth Rate Comparison by Mobility (2016-2032)
- Figure 211: Middle East & Africa Hydrogen Stations Market Y-o-Y Growth Rate Comparison by End-Use (2016-2032)
- Figure 212: Middle East & Africa Hydrogen Stations Market Share Comparison by Country (2016-2032)
- Figure 213: Middle East & Africa Hydrogen Stations Market Share Comparison by Size (2016-2032)
- Figure 214: Middle East & Africa Hydrogen Stations Market Share Comparison by Station Type (2016-2032)
- Figure 215: Middle East & Africa Hydrogen Stations Market Share Comparison by Pressure (2016-2032)
- Figure 216: Middle East & Africa Hydrogen Stations Market Share Comparison by Mobility (2016-2032)
- Figure 217: Middle East & Africa Hydrogen Stations Market Share Comparison by End-Use (2016-2032)
- List of Tables
- Table 1: Global Hydrogen Stations Market Comparison by Size (2016-2032)
- Table 2: Global Hydrogen Stations Market Comparison by Station Type (2016-2032)
- Table 3: Global Hydrogen Stations Market Comparison by Pressure (2016-2032)
- Table 4: Global Hydrogen Stations Market Comparison by Mobility (2016-2032)
- Table 5: Global Hydrogen Stations Market Comparison by End-Use (2016-2032)
- Table 6: Global Hydrogen Stations Market Revenue (US$ Mn) Comparison by Region (2016-2032)
- Table 7: Global Hydrogen Stations Market Revenue (US$ Mn) (2016-2032)
- Table 8: Global Hydrogen Stations Market Revenue (US$ Mn) Comparison by Region (2016-2032)
- Table 9: Global Hydrogen Stations Market Revenue (US$ Mn) Comparison by Size (2016-2032)
- Table 10: Global Hydrogen Stations Market Revenue (US$ Mn) Comparison by Station Type (2016-2032)
- Table 11: Global Hydrogen Stations Market Revenue (US$ Mn) Comparison by Pressure (2016-2032)
- Table 12: Global Hydrogen Stations Market Revenue (US$ Mn) Comparison by Mobility (2016-2032)
- Table 13: Global Hydrogen Stations Market Revenue (US$ Mn) Comparison by End-Use (2016-2032)
- Table 14: Global Hydrogen Stations Market Y-o-Y Growth Rate Comparison by Region (2016-2032)
- Table 15: Global Hydrogen Stations Market Y-o-Y Growth Rate Comparison by Size (2016-2032)
- Table 16: Global Hydrogen Stations Market Y-o-Y Growth Rate Comparison by Station Type (2016-2032)
- Table 17: Global Hydrogen Stations Market Y-o-Y Growth Rate Comparison by Pressure (2016-2032)
- Table 18: Global Hydrogen Stations Market Y-o-Y Growth Rate Comparison by Mobility (2016-2032)
- Table 19: Global Hydrogen Stations Market Y-o-Y Growth Rate Comparison by End-Use (2016-2032)
- Table 20: Global Hydrogen Stations Market Share Comparison by Region (2016-2032)
- Table 21: Global Hydrogen Stations Market Share Comparison by Size (2016-2032)
- Table 22: Global Hydrogen Stations Market Share Comparison by Station Type (2016-2032)
- Table 23: Global Hydrogen Stations Market Share Comparison by Pressure (2016-2032)
- Table 24: Global Hydrogen Stations Market Share Comparison by Mobility (2016-2032)
- Table 25: Global Hydrogen Stations Market Share Comparison by End-Use (2016-2032)
- Table 26: North America Hydrogen Stations Market Comparison by Station Type (2016-2032)
- Table 27: North America Hydrogen Stations Market Comparison by Pressure (2016-2032)
- Table 28: North America Hydrogen Stations Market Comparison by Mobility (2016-2032)
- Table 29: North America Hydrogen Stations Market Comparison by End-Use (2016-2032)
- Table 30: North America Hydrogen Stations Market Revenue (US$ Mn) Comparison by Country (2016-2032)
- Table 31: North America Hydrogen Stations Market Revenue (US$ Mn) (2016-2032)
- Table 32: North America Hydrogen Stations Market Revenue (US$ Mn) Comparison by Country (2016-2032)
- Table 33: North America Hydrogen Stations Market Revenue (US$ Mn) Comparison by Size (2016-2032)
- Table 34: North America Hydrogen Stations Market Revenue (US$ Mn) Comparison by Station Type (2016-2032)
- Table 35: North America Hydrogen Stations Market Revenue (US$ Mn) Comparison by Pressure (2016-2032)
- Table 36: North America Hydrogen Stations Market Revenue (US$ Mn) Comparison by Mobility (2016-2032)
- Table 37: North America Hydrogen Stations Market Revenue (US$ Mn) Comparison by End-Use (2016-2032)
- Table 38: North America Hydrogen Stations Market Y-o-Y Growth Rate Comparison by Country (2016-2032)
- Table 39: North America Hydrogen Stations Market Y-o-Y Growth Rate Comparison by Size (2016-2032)
- Table 40: North America Hydrogen Stations Market Y-o-Y Growth Rate Comparison by Station Type (2016-2032)
- Table 41: North America Hydrogen Stations Market Y-o-Y Growth Rate Comparison by Pressure (2016-2032)
- Table 42: North America Hydrogen Stations Market Y-o-Y Growth Rate Comparison by Mobility (2016-2032)
- Table 43: North America Hydrogen Stations Market Y-o-Y Growth Rate Comparison by End-Use (2016-2032)
- Table 44: North America Hydrogen Stations Market Share Comparison by Country (2016-2032)
- Table 45: North America Hydrogen Stations Market Share Comparison by Size (2016-2032)
- Table 46: North America Hydrogen Stations Market Share Comparison by Station Type (2016-2032)
- Table 47: North America Hydrogen Stations Market Share Comparison by Pressure (2016-2032)
- Table 48: North America Hydrogen Stations Market Share Comparison by Mobility (2016-2032)
- Table 49: North America Hydrogen Stations Market Share Comparison by End-Use (2016-2032)
- Table 50: Western Europe Hydrogen Stations Market Comparison by Size (2016-2032)
- Table 51: Western Europe Hydrogen Stations Market Comparison by Station Type (2016-2032)
- Table 52: Western Europe Hydrogen Stations Market Comparison by Pressure (2016-2032)
- Table 53: Western Europe Hydrogen Stations Market Comparison by Mobility (2016-2032)
- Table 54: Western Europe Hydrogen Stations Market Comparison by End-Use (2016-2032)
- Table 55: Western Europe Hydrogen Stations Market Revenue (US$ Mn) Comparison by Country (2016-2032)
- Table 56: Western Europe Hydrogen Stations Market Revenue (US$ Mn) (2016-2032)
- Table 57: Western Europe Hydrogen Stations Market Revenue (US$ Mn) Comparison by Country (2016-2032)
- Table 58: Western Europe Hydrogen Stations Market Revenue (US$ Mn) Comparison by Size (2016-2032)
- Table 59: Western Europe Hydrogen Stations Market Revenue (US$ Mn) Comparison by Station Type (2016-2032)
- Table 60: Western Europe Hydrogen Stations Market Revenue (US$ Mn) Comparison by Pressure (2016-2032)
- Table 61: Western Europe Hydrogen Stations Market Revenue (US$ Mn) Comparison by Mobility (2016-2032)
- Table 62: Western Europe Hydrogen Stations Market Revenue (US$ Mn) Comparison by End-Use (2016-2032)
- Table 63: Western Europe Hydrogen Stations Market Y-o-Y Growth Rate Comparison by Country (2016-2032)
- Table 64: Western Europe Hydrogen Stations Market Y-o-Y Growth Rate Comparison by Size (2016-2032)
- Table 65: Western Europe Hydrogen Stations Market Y-o-Y Growth Rate Comparison by Station Type (2016-2032)
- Table 66: Western Europe Hydrogen Stations Market Y-o-Y Growth Rate Comparison by Pressure (2016-2032)
- Table 67: Western Europe Hydrogen Stations Market Y-o-Y Growth Rate Comparison by Mobility (2016-2032)
- Table 68: Western Europe Hydrogen Stations Market Y-o-Y Growth Rate Comparison by End-Use (2016-2032)
- Table 69: Western Europe Hydrogen Stations Market Share Comparison by Country (2016-2032)
- Table 70: Western Europe Hydrogen Stations Market Share Comparison by Size (2016-2032)
- Table 71: Western Europe Hydrogen Stations Market Share Comparison by Station Type (2016-2032)
- Table 72: Western Europe Hydrogen Stations Market Share Comparison by Pressure (2016-2032)
- Table 73: Western Europe Hydrogen Stations Market Share Comparison by Mobility (2016-2032)
- Table 74: Western Europe Hydrogen Stations Market Share Comparison by End-Use (2016-2032)
- Table 75: Eastern Europe Hydrogen Stations Market Comparison by Size (2016-2032)
- Table 76: Eastern Europe Hydrogen Stations Market Comparison by Station Type (2016-2032)
- Table 77: Eastern Europe Hydrogen Stations Market Comparison by Pressure (2016-2032)
- Table 78: Eastern Europe Hydrogen Stations Market Comparison by Mobility (2016-2032)
- Table 79: Eastern Europe Hydrogen Stations Market Comparison by End-Use (2016-2032)
- Table 80: Eastern Europe Hydrogen Stations Market Revenue (US$ Mn) Comparison by Country (2016-2032)
- Table 81: Eastern Europe Hydrogen Stations Market Revenue (US$ Mn) (2016-2032)
- Table 82: Eastern Europe Hydrogen Stations Market Revenue (US$ Mn) Comparison by Country (2016-2032)
- Table 83: Eastern Europe Hydrogen Stations Market Revenue (US$ Mn) Comparison by Size (2016-2032)
- Table 84: Eastern Europe Hydrogen Stations Market Revenue (US$ Mn) Comparison by Station Type (2016-2032)
- Table 85: Eastern Europe Hydrogen Stations Market Revenue (US$ Mn) Comparison by Pressure (2016-2032)
- Table 86: Eastern Europe Hydrogen Stations Market Revenue (US$ Mn) Comparison by Mobility (2016-2032)
- Table 87: Eastern Europe Hydrogen Stations Market Revenue (US$ Mn) Comparison by End-Use (2016-2032)
- Table 88: Eastern Europe Hydrogen Stations Market Y-o-Y Growth Rate Comparison by Country (2016-2032)
- Table 89: Eastern Europe Hydrogen Stations Market Y-o-Y Growth Rate Comparison by Size (2016-2032)
- Table 90: Eastern Europe Hydrogen Stations Market Y-o-Y Growth Rate Comparison by Station Type (2016-2032)
- Table 91: Eastern Europe Hydrogen Stations Market Y-o-Y Growth Rate Comparison by Pressure (2016-2032)
- Table 92: Eastern Europe Hydrogen Stations Market Y-o-Y Growth Rate Comparison by Mobility (2016-2032)
- Table 93: Eastern Europe Hydrogen Stations Market Y-o-Y Growth Rate Comparison by End-Use (2016-2032)
- Table 94: Eastern Europe Hydrogen Stations Market Share Comparison by Country (2016-2032)
- Table 95: Eastern Europe Hydrogen Stations Market Share Comparison by Size (2016-2032)
- Table 96: Eastern Europe Hydrogen Stations Market Share Comparison by Station Type (2016-2032)
- Table 97: Eastern Europe Hydrogen Stations Market Share Comparison by Pressure (2016-2032)
- Table 98: Eastern Europe Hydrogen Stations Market Share Comparison by Mobility (2016-2032)
- Table 99: Eastern Europe Hydrogen Stations Market Share Comparison by End-Use (2016-2032)
- Table 100: APAC Hydrogen Stations Market Comparison by Size (2016-2032)
- Table 101: APAC Hydrogen Stations Market Comparison by Station Type (2016-2032)
- Table 102: APAC Hydrogen Stations Market Comparison by Pressure (2016-2032)
- Table 103: APAC Hydrogen Stations Market Comparison by Mobility (2016-2032)
- Table 104: APAC Hydrogen Stations Market Comparison by End-Use (2016-2032)
- Table 105: APAC Hydrogen Stations Market Revenue (US$ Mn) Comparison by Country (2016-2032)
- Table 106: APAC Hydrogen Stations Market Revenue (US$ Mn) (2016-2032)
- Table 107: APAC Hydrogen Stations Market Revenue (US$ Mn) Comparison by Country (2016-2032)
- Table 108: APAC Hydrogen Stations Market Revenue (US$ Mn) Comparison by Size (2016-2032)
- Table 109: APAC Hydrogen Stations Market Revenue (US$ Mn) Comparison by Station Type (2016-2032)
- Table 110: APAC Hydrogen Stations Market Revenue (US$ Mn) Comparison by Pressure (2016-2032)
- Table 111: APAC Hydrogen Stations Market Revenue (US$ Mn) Comparison by Mobility (2016-2032)
- Table 112: APAC Hydrogen Stations Market Revenue (US$ Mn) Comparison by End-Use (2016-2032)
- Table 113: APAC Hydrogen Stations Market Y-o-Y Growth Rate Comparison by Country (2016-2032)
- Table 114: APAC Hydrogen Stations Market Y-o-Y Growth Rate Comparison by Size (2016-2032)
- Table 115: APAC Hydrogen Stations Market Y-o-Y Growth Rate Comparison by Station Type (2016-2032)
- Table 116: APAC Hydrogen Stations Market Y-o-Y Growth Rate Comparison by Pressure (2016-2032)
- Table 117: APAC Hydrogen Stations Market Y-o-Y Growth Rate Comparison by Mobility (2016-2032)
- Table 118: APAC Hydrogen Stations Market Y-o-Y Growth Rate Comparison by End-Use (2016-2032)
- Table 119: APAC Hydrogen Stations Market Share Comparison by Country (2016-2032)
- Table 120: APAC Hydrogen Stations Market Share Comparison by Size (2016-2032)
- Table 121: APAC Hydrogen Stations Market Share Comparison by Station Type (2016-2032)
- Table 122: APAC Hydrogen Stations Market Share Comparison by Pressure (2016-2032)
- Table 123: APAC Hydrogen Stations Market Share Comparison by Mobility (2016-2032)
- Table 124: APAC Hydrogen Stations Market Share Comparison by End-Use (2016-2032)
- Table 125: Latin America Hydrogen Stations Market Comparison by Size (2016-2032)
- Table 126: Latin America Hydrogen Stations Market Comparison by Station Type (2016-2032)
- Table 127: Latin America Hydrogen Stations Market Comparison by Pressure (2016-2032)
- Table 128: Latin America Hydrogen Stations Market Comparison by Mobility (2016-2032)
- Table 129: Latin America Hydrogen Stations Market Comparison by End-Use (2016-2032)
- Table 130: Latin America Hydrogen Stations Market Revenue (US$ Mn) Comparison by Country (2016-2032)
- Table 131: Latin America Hydrogen Stations Market Revenue (US$ Mn) (2016-2032)
- Table 132: Latin America Hydrogen Stations Market Revenue (US$ Mn) Comparison by Country (2016-2032)
- Table 133: Latin America Hydrogen Stations Market Revenue (US$ Mn) Comparison by Size (2016-2032)
- Table 134: Latin America Hydrogen Stations Market Revenue (US$ Mn) Comparison by Station Type (2016-2032)
- Table 135: Latin America Hydrogen Stations Market Revenue (US$ Mn) Comparison by Pressure (2016-2032)
- Table 136: Latin America Hydrogen Stations Market Revenue (US$ Mn) Comparison by Mobility (2016-2032)
- Table 137: Latin America Hydrogen Stations Market Revenue (US$ Mn) Comparison by End-Use (2016-2032)
- Table 138: Latin America Hydrogen Stations Market Y-o-Y Growth Rate Comparison by Country (2016-2032)
- Table 139: Latin America Hydrogen Stations Market Y-o-Y Growth Rate Comparison by Size (2016-2032)
- Table 140: Latin America Hydrogen Stations Market Y-o-Y Growth Rate Comparison by Station Type (2016-2032)
- Table 141: Latin America Hydrogen Stations Market Y-o-Y Growth Rate Comparison by Pressure (2016-2032)
- Table 142: Latin America Hydrogen Stations Market Y-o-Y Growth Rate Comparison by Mobility (2016-2032)
- Table 143: Latin America Hydrogen Stations Market Y-o-Y Growth Rate Comparison by End-Use (2016-2032)
- Table 144: Latin America Hydrogen Stations Market Share Comparison by Country (2016-2032)
- Table 145: Latin America Hydrogen Stations Market Share Comparison by Size (2016-2032)
- Table 146: Latin America Hydrogen Stations Market Share Comparison by Station Type (2016-2032)
- Table 147: Latin America Hydrogen Stations Market Share Comparison by Pressure (2016-2032)
- Table 148: Latin America Hydrogen Stations Market Share Comparison by Mobility (2016-2032)
- Table 149: Latin America Hydrogen Stations Market Share Comparison by End-Use (2016-2032)
- Table 150: Middle East & Africa Hydrogen Stations Market Comparison by Size (2016-2032)
- Table 151: Middle East & Africa Hydrogen Stations Market Comparison by Station Type (2016-2032)
- Table 152: Middle East & Africa Hydrogen Stations Market Comparison by Pressure (2016-2032)
- Table 153: Middle East & Africa Hydrogen Stations Market Comparison by Mobility (2016-2032)
- Table 154: Middle East & Africa Hydrogen Stations Market Comparison by End-Use (2016-2032)
- Table 155: Middle East & Africa Hydrogen Stations Market Revenue (US$ Mn) Comparison by Country (2016-2032)
- Table 156: Middle East & Africa Hydrogen Stations Market Revenue (US$ Mn) (2016-2032)
- Table 157: Middle East & Africa Hydrogen Stations Market Revenue (US$ Mn) Comparison by Country (2016-2032)
- Table 158: Middle East & Africa Hydrogen Stations Market Revenue (US$ Mn) Comparison by Size (2016-2032)
- Table 159: Middle East & Africa Hydrogen Stations Market Revenue (US$ Mn) Comparison by Station Type (2016-2032)
- Table 160: Middle East & Africa Hydrogen Stations Market Revenue (US$ Mn) Comparison by Pressure (2016-2032)
- Table 161: Middle East & Africa Hydrogen Stations Market Revenue (US$ Mn) Comparison by Mobility (2016-2032)
- Table 162: Middle East & Africa Hydrogen Stations Market Revenue (US$ Mn) Comparison by End-Use (2016-2032)
- Table 163: Middle East & Africa Hydrogen Stations Market Y-o-Y Growth Rate Comparison by Country (2016-2032)
- Table 164: Middle East & Africa Hydrogen Stations Market Y-o-Y Growth Rate Comparison by Size (2016-2032)
- Table 165: Middle East & Africa Hydrogen Stations Market Y-o-Y Growth Rate Comparison by Station Type (2016-2032)
- Table 166: Middle East & Africa Hydrogen Stations Market Y-o-Y Growth Rate Comparison by Pressure (2016-2032)
- Table 167: Middle East & Africa Hydrogen Stations Market Y-o-Y Growth Rate Comparison by Mobility (2016-2032)
- Table 168: Middle East & Africa Hydrogen Stations Market Y-o-Y Growth Rate Comparison by End-Use (2016-2032)
- Table 169: Middle East & Africa Hydrogen Stations Market Share Comparison by Country (2016-2032)
- Table 170: Middle East & Africa Hydrogen Stations Market Share Comparison by Size (2016-2032)
- Table 171: Middle East & Africa Hydrogen Stations Market Share Comparison by Station Type (2016-2032)
- Table 172: Middle East & Africa Hydrogen Stations Market Share Comparison by Pressure (2016-2032)
- Table 173: Middle East & Africa Hydrogen Stations Market Share Comparison by Mobility (2016-2032)
- Table 174: Middle East & Africa Hydrogen Stations Market Share Comparison by End-Use (2016-2032)
- 1. Executive Summary
-
- Ballard Power Systems
- FirstElement Fuel, Inc.
- NEL ASA
- Iwatani Corporation
- PDC Machines Inc.
- Cummins Inc.
- Linde PLC
- Air Products and Chemicals, Inc.
- ITM Power PLC
- Powertech Labs Inc
- Peric Hydrogen Technologies Co., Ltd
- H2ENERGY Solutions LTD
- Black and Veatch Holding Company
- China Petrochemical Corporation
- FuelCell Energy, Inc.
- Shell
- McPhy Energy S.A.
- Nuvera Fuel Cells, LLC
- Air Liquide
Our Clients


View Our Licence Options
