Hydrogen as a Fuel Market By Technology (Proton Exchange Membrane Fuel cells, Phosphoric Acid Fuel Cells, Solid Oxide Fuel Cells, Others), By Application (Stationary, Transportation, Portable), By End-Use (Commercial & Industrial, Data Centers, Transportation, Others), By Region And Companies - Industry Segment Outlook, Market Assessment, Competition Scenario, Trends, And Forecast 2023-2032
-
42259
-
Dec 2023
-
130
-


-
This report was compiled by Shreyas Rokade Shreyas Rokade is a seasoned Research Analyst with CMFE, bringing extensive expertise in market research and consulting, with a strong background in Chemical Engineering. Correspondence Team Lead-CMFE Linkedin | Detailed Market research Methodology Our methodology involves a mix of primary research, including interviews with leading mental health experts, and secondary research from reputable medical journals and databases. View Detailed Methodology Page
-
Quick Navigation
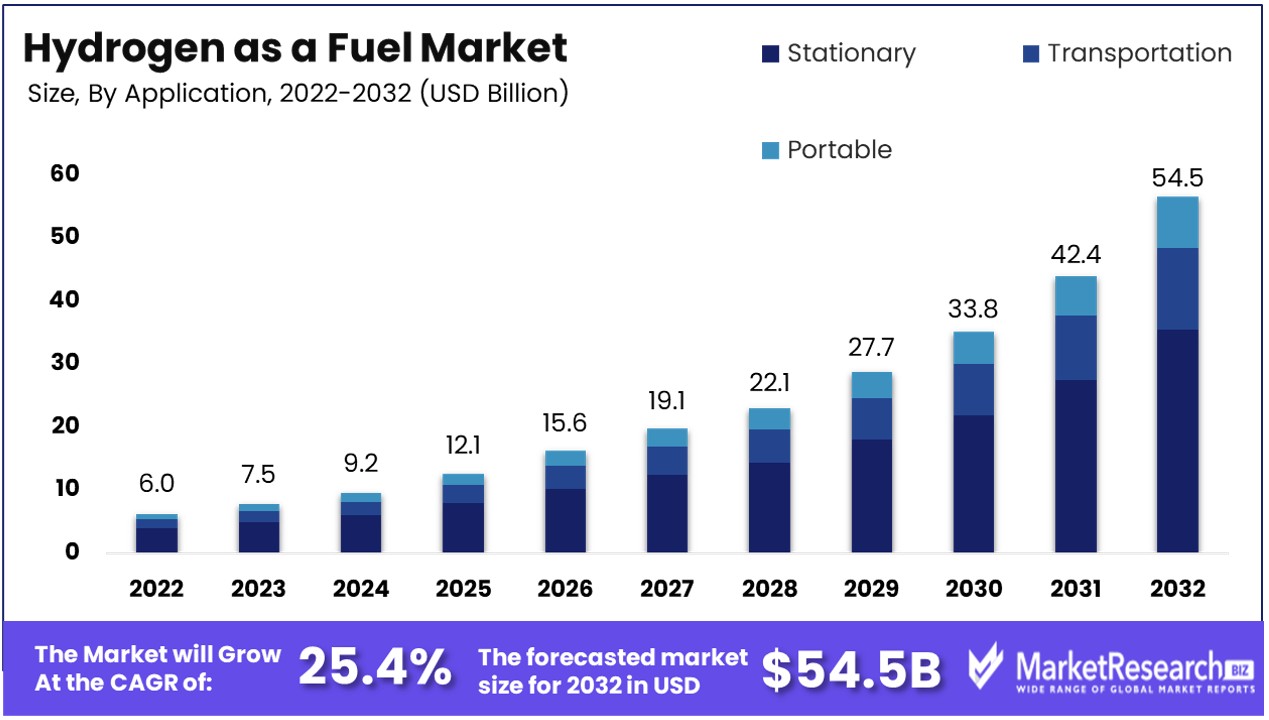
Hydrogen as a Fuel Market size is predicted to reach approximately USD 54.5 Bn by 2032, from a valuation of USD 6.0 Bn in 2022, growing at a CAGR of 25.4% during the forecast period from 2023 to 2032.
Hydrogen is considered a potential sustainable fuel for the future. When used in a fuel cell, hydrogen reacts with oxygen to produce electrical energy, with water as the only byproduct. Compared to fossil fuels, hydrogen does not emit greenhouse gases or air pollutants when used, making it a clean fuel. Transitioning to a hydrogen economy could significantly reduce human impact on climate change.
International Renewable Energy Agency (IRENA) emphasizes the increasing global commitment to achieving net-zero emissions, with 131 countries covering 88% of global greenhouse gas emissions having announced net-zero targets by April 2022.
The Hydrogen as a Fuel Market is expected to experience significant growth in the coming years driven by several key factors. One major driver is the push towards decarbonization and reducing greenhouse gas emissions from the transportation and energy sectors. Hydrogen is seen as a clean fuel alternative that can help countries meet emissions reduction targets when produced from renewable energy sources.
For Instance, Aircraft are responsible for 2.5% of global CO2 emissions, and the industry aims to achieve net-zero emissions by 2050. Both Airbus and startups like ZeroAvia and Universal Hydrogen are exploring hydrogen technology.
Additionally, falling costs for hydrogen production via electrolysis as well as commitments by major automakers to expand their hydrogen vehicle offerings are providing momentum.
Government policies and incentives aimed at supporting the adoption of hydrogen technology are also catalyzing the Hydrogen as a Fuel Market’s expansion. Regions with comprehensive hydrogen development strategies such as the EU, China, Japan and South Korea are likely to see substantial Hydrogen as a Fuel Market growth.
The Inflation Reduction Act of 2022, also known as the US Climate Change Bill, is a landmark climate legislation focusing on energy measures. It promotes low-carbon energy, offers tax credits for eco-friendly technologies, and encourages electric vehicle purchases. Within a year, it spurred $110 billion in clean energy investments, created 170,000 jobs, and aims to reduce U.S. greenhouse gas emissions by 40%, fostering cleaner air and improved public health.
Furthermore, interest from the energy industry in blending hydrogen with natural gas to reduce the carbon intensity is driving early investment. If renewable hydrogen reaches cost parity with fossil fuel-based hydrogen sooner than predicted, it could greatly accelerate the Hydrogen as a Fuel Market’s growth globally.
The hydrogen fuel market shows immense potential for growth and innovation. As countries aim to decarbonize economies, hydrogen is poised to play a pivotal role as a clean fuel and energy carrier. Companies have robust opportunities to develop more efficient and cost-competitive production, storage and distribution solutions for hydrogen through sustained R&D. Emerging use cases in sectors like transportation, electricity generation and industry open new revenue streams.
By continuing research into novel hydrogen production methods, storage materials and fuel cells, companies can enable wider adoption. Realizing hydrogen's versatility would necessitate strategic partnerships between private and public players to co-create technologies and infrastructure. Unlocking long-term, sustainable value propositions would further accelerate innovation in this high-growth market.
Hydrogen as a Fuel Market Dynamics
Decarbonizing Industrial and Transport Sectors Fuels Hydrogen Market
Hydrogen's role in decarbonizing key industrial, heat, and transport sectors that are difficult or expensive to electrify significantly contributes to Hydrogen as a Fuel Market growth. Many industrial processes and heavy-duty transport systems cannot be easily electrified due to technical constraints or high costs. Hydrogen offers a viable alternative, enabling these sectors to reduce their carbon footprint without compromising efficiency.
Its versatility as a fuel and energy carrier makes it particularly suited for high-energy-demand applications. The trend towards decarbonization, driven by global climate change initiatives, positions hydrogen as a key player in achieving emission reduction goals. The long-term market growth for hydrogen as a fuel is likely to be sustained by its increasing adoption in these hard-to-electrify sectors, driven by the global push for cleaner energy solutions.
Zero Emissions from Hydrogen Fuel Cells Boost Market Appeal
The fact that hydrogen fuel cells produce no greenhouse gases or other pollutants bolsters their attractiveness in reducing emissions, thus driving the hydrogen fuel market. This environmental benefit positions hydrogen fuel cells as a leading solution in the shift towards sustainable energy, especially in sectors where emissions reduction is a critical goal.
The absence of pollutants in hydrogen fuel cell operations aligns with increasing environmental regulations and public demand for cleaner energy sources. As the world intensifies its efforts to combat climate change, the demand for zero-emission energy solutions like hydrogen fuel cells is expected to grow. This trend indicates a robust future for the Hydrogen as a Fuel Market, where its environmental credentials play a key role in its expansion.
Government and Industry Support Propel Hydrogen Transportation Market
The hydrogen market for transportation is bolstered by government and industry efforts toward clean, economical, and safe hydrogen production and distribution, especially for use in fuel cell electric vehicles (FCEVs). These efforts include investments in infrastructure development, research into cost-effective production methods, and policies supporting hydrogen adoption.
The collaboration between government entities and industry players is crucial in overcoming barriers to hydrogen use, such as high costs and lack of refueling infrastructure. This combined support is not only accelerating the development of the hydrogen transportation market but also shaping a future where FCEVs are a common sight. The ongoing commitment to establishing a hydrogen economy, particularly in transportation, foresees a market driven by the dual goals of environmental sustainability and energy security.
High Production Costs Limit Widespread Adoption of Hydrogen Fuel
Electrolysis-based methods for producing hydrogen fuel remain a costly way of producing the energy source, which limits its widespread adoption. Production of hydrogen fuel currently exceeds that of fossil fuels due to energy requirements and cost associated with electrolysis.
This cost disparity makes hydrogen less competitive as an energy source in markets where cost-efficiency is paramount. The economic challenge is further compounded in regions with limited renewable energy sources, as the environmental benefits of hydrogen are best realized when produced from clean energy sources. This cost factor restricts the market's ability to compete with more established, cheaper fossil fuels.
Competition from Batteries in Transportation Limits Hydrogen's Market
Batteries present a serious competition to hydrogen fuel solutions in the transportation sector. As battery technology improves to offer greater range, faster charging times, and reduced costs, electric vehicles (EVs) have become an attractive alternative to traditional internal combustion engine vehicles.
This transition toward battery-powered transportation decreases the addressable market for hydrogen fuel cell vehicles, which are still developing both infrastructure-wise and financially. The competition from batteries, especially in the automotive industry, limits the potential market growth for hydrogen as a fuel source, as consumers and manufacturers may prefer the more established and rapidly evolving battery technology.
Hydrogen as a Fuel Market Segmentation Analysis
By Technology Analysis
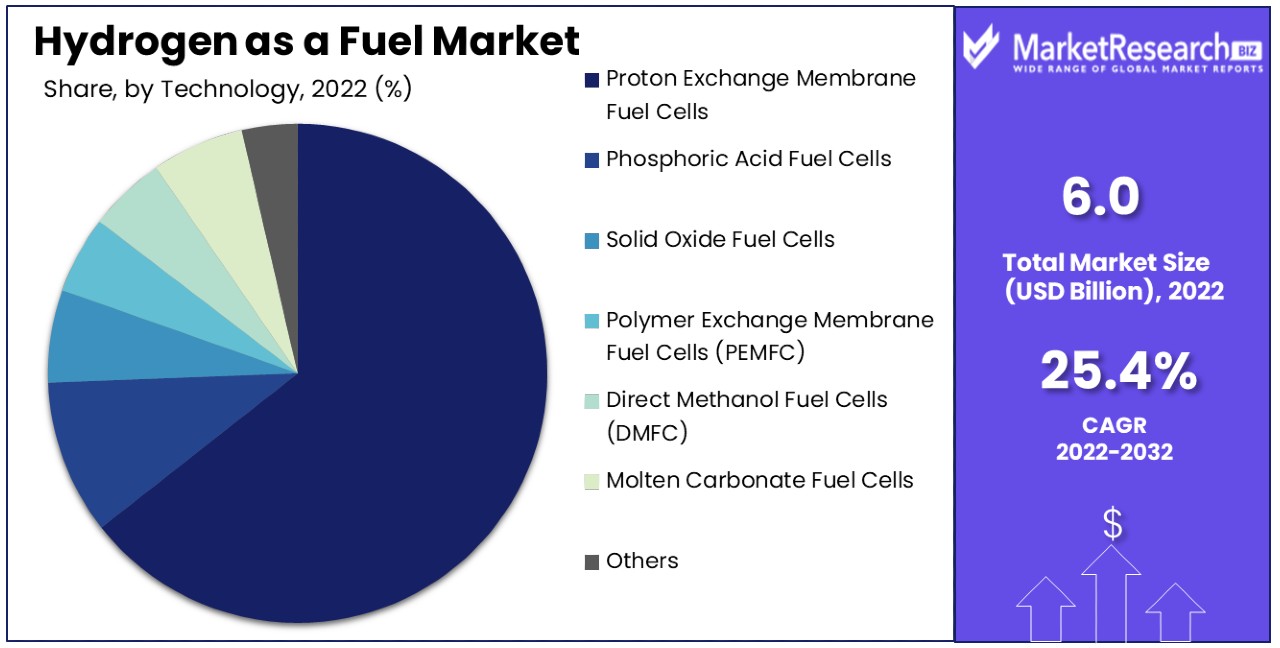
Proton Exchange Membrane (PEM) fuel cells, leading with 64.6% market share, are pivotal in the Hydrogen as a Fuel Market. Their dominance is attributed to their energy efficiency, low operating temperatures, and suitability for a wide range of applications, from automotive to stationary power generation. PEM fuel cells offer rapid start-up and scalability, making them ideal for vehicles and smaller-scale energy solutions. Their growth is driven by advancements in membrane technology, reducing costs and improving durability.
Phosphoric Acid, Solid Oxide, Direct Methanol, and Molten Carbonate Fuel Cells each cater to specific needs. Solid Oxide Fuel Cells are preferred for high-temperature applications, while Direct Methanol Fuel Cells are valued for their ease of fuel handling. Phosphoric Acid and Molten Carbonate Fuel Cells are suitable for larger, stationary applications. The diversity of these technologies contributes to the market's overall growth.
By Application Analysis
Stationary applications, constituting 68.5% of the market, are primarily in commercial and industrial sectors. This dominance is due to the increasing demand for reliable, low-emission power sources. Stationary fuel cells are used for on-site power generation, backup power, and as a part of decentralized energy systems. Their growth is supported by the shift towards sustainable energy solutions and the need for energy security.
The transportation sector is rapidly adopting hydrogen fuel cells, especially in public transport and commercial vehicles. Portable applications are emerging, with fuel cells being used in smaller devices and emergency power systems, offering mobility and convenience.
By End-Use Analysis
The commercial and industrial sector, with a 48.2% share, is the largest end-use market for hydrogen fuel cells. These sectors utilize hydrogen fuel cells for continuous power supply and peak-load energy management. The growth in this segment is driven by the need for energy-efficient, environmentally-friendly power solutions in industries and businesses.
Data centers require reliable, uninterrupted power, making fuel cells a preferred choice. In transportation, hydrogen fuel cells are key to powering electric vehicles. Military and defense applications include portable power and unmanned vehicles. Residential use is growing, with fuel cells providing an alternative to traditional power sources. Utilities use fuel cells for grid support and distributed generation. Each of these end-use sectors contributes to the diverse applications of hydrogen fuel cells, supporting the market's expansion.
Hydrogen as a Fuel Industry Key Segments
By Technology
- Proton Exchange Membrane Fuel cells
- Phosphoric Acid Fuel Cells
- Solid Oxide Fuel Cells
- Polymer Exchange Membrane Fuel Cells (PEMFC)
- Direct Methanol Fuel Cells (DMFC)
- Molten Carbonate Fuel Cells
- Others
By Application
- Stationary
- Transportation
- Portable
By End-Use
- Commercial & Industrial
- Data Centers
- Transportation
- Military & Defense
- Residential
- Utilities
- Others
Hydrogen as a Fuel Market Growth Opportunities
Hydrogen-Powered Heavy Transport Supports Net-Zero Emission Targets
The adoption of hydrogen fuel cell technology in heavy transport sectors such as trucks, trains, ships, and planes offers a significant growth opportunity for the Hydrogen as a Fuel Market. This shift from high-polluting diesel fuels to hydrogen aligns with global net-zero emission targets.
Hydrogen fuel cells provide a viable solution for reducing emissions in heavy transportation, a sector traditionally challenging to decarbonize. The increasing focus on sustainability and the implementation of strict environmental regulations are driving the demand for cleaner fuel alternatives, positioning hydrogen as a key player in the transition towards sustainable, low-emission transport systems.
Abundant Renewable Energy Resources Drive Global Hydrogen Supply Chains
Countries possessing abundant and cheap renewable energy resources have the potential to produce low-cost green hydrogen, opening up significant opportunities in the global hydrogen fuel market. By exporting green hydrogen to major energy importers like Europe or Asia, these countries can establish global hydrogen supply chains.
This development is critical in creating a sustainable and economically viable market for hydrogen fuel, catering to the growing international demand for hydrogen. The trend towards leveraging renewable resources for hydrogen production underscores a strategic market expansion, fostering global collaborations and investments in hydrogen infrastructure and technology.
Hydrogen as a Fuel Market Regional Analysis
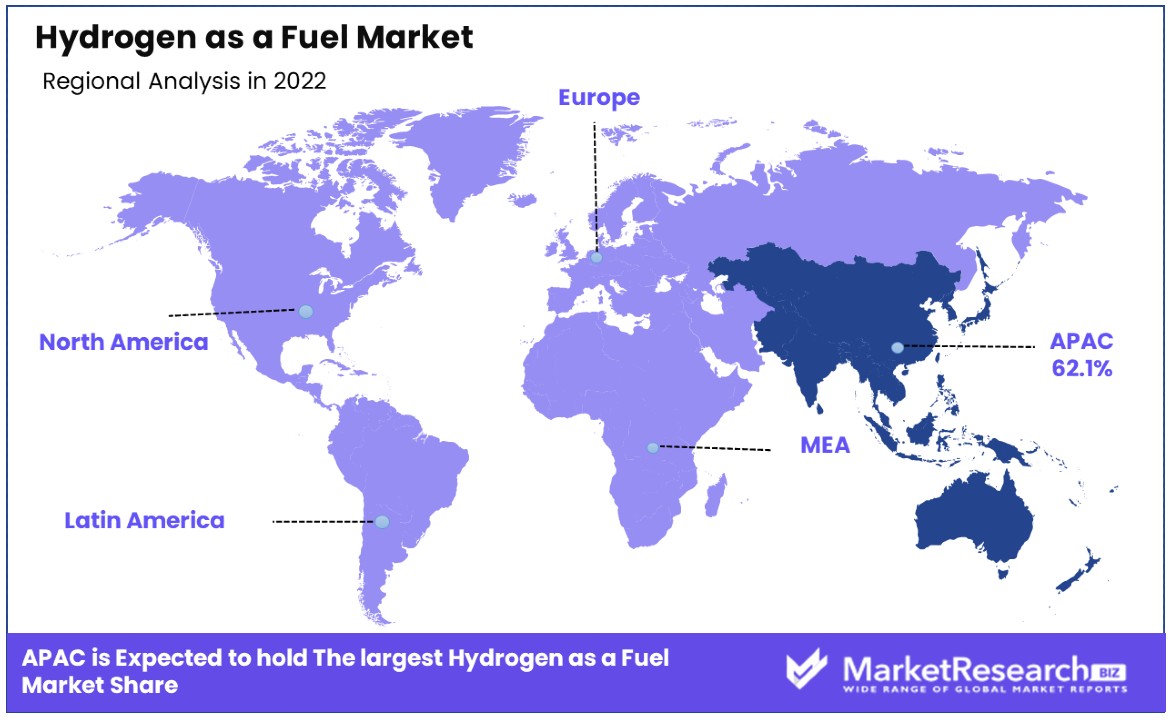
Asia Pacific Dominates with 62.1% Market Share
Asia Pacific's substantial 62.1% share in the global Hydrogen as a Fuel Market is primarily driven by the region's strong commitment to reducing carbon emissions and transitioning to cleaner energy sources. Countries like Japan, South Korea, and China are leading this shift, heavily investing in hydrogen technology as part of their national energy strategies.
The region's focus on sustainable transportation, including the development of hydrogen fuel cell vehicles, significantly contributes to market growth. Additionally, Asia Pacific's large manufacturing base provides an ideal environment for the development and scaling of hydrogen technologies.
The market dynamics in Asia Pacific are influenced by governmental initiatives and public-private partnerships aimed at developing hydrogen infrastructure, such as hydrogen fueling stations and production facilities. The increasing demand for clean energy in industrial applications and public transportation systems in the region further drives the adoption of hydrogen fuel.
Europe Is Leading in Innovation and Policy Support
Europe's hydrogen fuel market is driven by strong policy support and innovation in green hydrogen technologies. The European Union's ambitious climate targets and the emphasis on energy transition contribute to the region's focus on hydrogen as a key component of its renewable energy strategy. European countries are also pioneering in the integration of hydrogen in various sectors, including transportation and industrial processes, backed by significant research and development efforts.
North America's Growing Interest in Clean Energy Solutions
In North America, particularly in the United States and Canada, the Hydrogen as a Fuel Market is expanding due to growing interest in clean energy solutions and reducing dependency on fossil fuels. The region is seeing increased investments in hydrogen infrastructure and technology development. North America's vast natural resources and technological capabilities position it well for the adoption and production of hydrogen fuel, particularly for industrial and transportation applications.
Hydrogen as a Fuel Industry By Region
North America
- The US
- Canada
Europe
- Germany
- France
- The UK
- Spain
- Italy
- Russia
- Netherlands
- Rest of Europe
Asia-Pacific
- China
- Japan
- South Korea
- India
- New Zealand
- Singapore
- Thailand
- Vietnam
- Rest of Asia Pacific
Latin America
- Brazil
- Mexico
- Rest of Latin America
Middle East & Africa
- South Africa
- Saudi Arabia
- UAE
- Rest of the Middle East & Africa
Hydrogen as a Fuel Market Key Player Analysis
In the Hydrogen as a Fuel Market, an area pivotal for the transition to sustainable energy, the listed companies play significant roles in shaping its trajectory. Air Liquide, Linde plc, and Air Products and Chemicals, Inc., as leaders in industrial gases, are pivotal in the production and supply chain of hydrogen, demonstrating the market's focus on infrastructure and accessibility.
Shell plc and Saudi Arabian Oil Co., traditionally oil and gas giants, are transitioning towards sustainable energy, investing heavily in hydrogen fuel technologies, reflecting the broader industry shift towards clean energy. Toyota Motor Corporation and Hyundai Motor Company, leading in the development and commercialization of hydrogen fuel cell vehicles (FCVs), underscore the automotive industry's role in driving hydrogen fuel adoption.
General Motors, Honda Motor Co., Ltd., and BMW AG, with their commitments to FCVs, highlight the growing interest in hydrogen as a viable alternative to traditional fossil fuels in the transportation sector. Daimler AG, Audi AG, and Nikola Corporation focusing on hydrogen-powered trucks and commercial vehicles, showcase the potential of hydrogen in heavy-duty transportation.
Cummins Inc., known for its engines and power solutions, and Ballard Power Systems Inc., specializing in fuel cell technology, play crucial roles in developing and providing hydrogen-based power systems for various applications, from vehicles to stationary power.
Collectively, these companies not only drive the growth of Hydrogen as a Fuel Market but also represent a spectrum of strategies, from production and infrastructure development to vehicle manufacturing and technological innovation, crucial for the adoption and advancement of hydrogen as a clean and sustainable energy source.
Major Market Players in Hydrogen as a Fuel Market
- Air Liquide
- Linde plc
- Air Products and Chemicals, Inc.
- Shell plc
- Saudi Arabian Oil Co.
- Toyota Motor Corporation
- Hyundai Motor Company
- General Motors
- Honda Motor Co., Ltd.
- BMW AG
- Daimler AG
- Audi AG
- Nikola Corporation
- Cummins Inc.
- Ballard Power Systems Inc.
Recent Developments
- In November 2023, GAC Motor, a Chinese automaker, revealed its ERA model concept hydrogen car at the Guangzhou Auto Show. The vehicle's distinctive design incorporates recycled ocean plastic, seaweed, and other biomaterials, reflecting the country's commitment to decarbonization.
- In September 2023, FuelCell Energy and Toyota completed the world's first "Tri-gen" production system at Toyota's Port of Long Beach operations, owned and operated by FuelCell Energy. This innovative system produces renewable electricity, renewable hydrogen, and usable water from directed biogas.
- In August 2023, Nikola Corporation announced that the demand for their hydrogen fuel cell electric vehicles (FCEVs) has surpassed 200 sales orders. A majority of the sales orders to the California Air Resources Board's Hybrid and Zero-Emission Truck and Bus Voucher Incentive Project (HVIP) program, which provides incentives to customers.
- In August 2023, Hyzon Motors, in collaboration with Performance Food Group (PFG) and Chart Industries, completed its first customer demonstration of a liquid hydrogen fuel cell electric truck. This milestone affirms the viability of onboard liquid hydrogen for long-distance, zero-emission transportation in commercial trucking applications.
Report Scope
Report Features Description Market Value (2022) US$ 6.0 Bn Forecast Revenue (2032) US$ 54.5 Bn CAGR (2023-2032) 25.4% Base Year for Estimation 2022 Historic Period 2016-2022 Forecast Period 2023-2032 Report Coverage Revenue Forecast, Market Dynamics, COVID-19 Impact, Competitive Landscape, Recent Developments Segments Covered By Technology (Proton Exchange Membrane Fuel cells, Phosphoric Acid Fuel Cells, Solid Oxide Fuel Cells, Polymer Exchange Membrane Fuel Cells (PEMFC), Direct Methanol Fuel Cells (DMFC), Molten Carbonate Fuel Cells, Others), By Application (Stationary, Transportation, Portable), By End-Use (Commercial & Industrial, Data Centers, Transportation, Military & Defense, Residential, Utilities, Others) Regional Analysis North America - The US, Canada, Europe - Germany, France, The UK, Spain, Italy, Russia, Netherlands, Rest of Europe, Asia-Pacific - China, Japan, South Korea, India, New Zealand, Singapore, Thailand, Vietnam, Rest of Asia Pacific, Latin America - Brazil, Mexico, Rest of Latin America, Middle East & Africa - South Africa, Saudi Arabia, UAE, Rest of Middle East & Africa Competitive Landscape Air Liquide, Linde plc, Air Products and Chemicals, Inc., Shell plc, Saudi Arabian Oil Co., Toyota Motor Corporation, Hyundai Motor Company, General Motors, Honda Motor Co., Ltd., BMW AG, Daimler AG, Audi AG, Nikola Corporation, Cummins Inc., Ballard Power Systems Inc. Customization Scope Customization for segments, region/country-level will be provided. Moreover, additional customization can be done based on the requirements. Purchase Options We have three licenses to opt for: Single User License, Multi-User License (Up to 5 Users), Corporate Use License (Unlimited User and Printable PDF) -
- 1. Executive Summary
- 1.1. Definition
- 1.2. Taxonomy
- 1.3. Research Scope
- 1.4. Key Analysis
- 1.5. Key Findings by Major Segments
- 1.6. Top strategies by Major Players
- 2. Global Hydrogen as a Fuel Market Overview
- 2.1. Hydrogen as a Fuel Market Dynamics
- 2.1.1. Drivers
- 2.1.2. Opportunities
- 2.1.3. Restraints
- 2.1.4. Challenges
- 2.2. Macro-economic Factors
- 2.3. Regulatory Framework
- 2.4. Market Investment Feasibility Index
- 2.5. PEST Analysis
- 2.6. PORTER’S Five Force Analysis
- 2.7. Drivers & Restraints Impact Analysis
- 2.8. Industry Chain Analysis
- 2.9. Cost Structure Analysis
- 2.10. Marketing Strategy
- 2.11. Russia-Ukraine War Impact Analysis
- 2.12. Opportunity Map Analysis
- 2.13. Market Competition Scenario Analysis
- 2.14. Product Life Cycle Analysis
- 2.15. Opportunity Orbits
- 2.16. Manufacturer Intensity Map
- 2.17. Major Companies sales by Value & Volume
- 2.1. Hydrogen as a Fuel Market Dynamics
- 3. Global Hydrogen as a Fuel Market Analysis, Opportunity and Forecast, 2016-2032
- 3.1. Global Hydrogen as a Fuel Market Analysis, 2016-2021
- 3.2. Global Hydrogen as a Fuel Market Opportunity and Forecast, 2023-2032
- 3.3. Global Hydrogen as a Fuel Market Analysis, Opportunity and Forecast, By Technology, 2016-2032
- 3.3.1. Global Hydrogen as a Fuel Market Analysis by Technology: Introduction
- 3.3.2. Market Size Absolute $ Opportunity Analysis and Forecast, By Technology, 2016-2032
- 3.3.3. Proton Exchange Membrane Fuel cells
- 3.3.4. Phosphoric Acid Fuel Cells
- 3.3.5. Solid Oxide Fuel Cells
- 3.3.6. Polymer Exchange Membrane Fuel Cells (PEMFC)
- 3.3.7. Direct Methanol Fuel Cells (DMFC)
- 3.3.8. Molten Carbonate Fuel Cells
- 3.3.9. Others
- 3.4. Global Hydrogen as a Fuel Market Analysis, Opportunity and Forecast, By Application, 2016-2032
- 3.4.1. Global Hydrogen as a Fuel Market Analysis by Application: Introduction
- 3.4.2. Market Size Absolute $ Opportunity Analysis and Forecast, By Application, 2016-2032
- 3.4.3. Stationary
- 3.4.4. Transportation
- 3.4.5. Portable
- 3.5. Global Hydrogen as a Fuel Market Analysis, Opportunity and Forecast, By End-Use, 2016-2032
- 3.5.1. Global Hydrogen as a Fuel Market Analysis by End-Use: Introduction
- 3.5.2. Market Size Absolute $ Opportunity Analysis and Forecast, By End-Use, 2016-2032
- 3.5.3. Commercial & Industrial
- 3.5.4. Data Centers
- 3.5.5. Transportation
- 3.5.6. Military & Defense
- 3.5.7. Residential
- 3.5.8. Utilities
- 3.5.9. Others
- 4. North America Hydrogen as a Fuel Market Analysis, Opportunity and Forecast, 2016-2032
- 4.1. North America Hydrogen as a Fuel Market Analysis, 2016-2021
- 4.2. North America Hydrogen as a Fuel Market Opportunity and Forecast, 2023-2032
- 4.3. North America Hydrogen as a Fuel Market Analysis, Opportunity and Forecast, By Technology, 2016-2032
- 4.3.1. North America Hydrogen as a Fuel Market Analysis by Technology: Introduction
- 4.3.2. Market Size Absolute $ Opportunity Analysis and Forecast, By Technology, 2016-2032
- 4.3.3. Proton Exchange Membrane Fuel cells
- 4.3.4. Phosphoric Acid Fuel Cells
- 4.3.5. Solid Oxide Fuel Cells
- 4.3.6. Polymer Exchange Membrane Fuel Cells (PEMFC)
- 4.3.7. Direct Methanol Fuel Cells (DMFC)
- 4.3.8. Molten Carbonate Fuel Cells
- 4.3.9. Others
- 4.4. North America Hydrogen as a Fuel Market Analysis, Opportunity and Forecast, By Application, 2016-2032
- 4.4.1. North America Hydrogen as a Fuel Market Analysis by Application: Introduction
- 4.4.2. Market Size Absolute $ Opportunity Analysis and Forecast, By Application, 2016-2032
- 4.4.3. Stationary
- 4.4.4. Transportation
- 4.4.5. Portable
- 4.5. North America Hydrogen as a Fuel Market Analysis, Opportunity and Forecast, By End-Use, 2016-2032
- 4.5.1. North America Hydrogen as a Fuel Market Analysis by End-Use: Introduction
- 4.5.2. Market Size Absolute $ Opportunity Analysis and Forecast, By End-Use, 2016-2032
- 4.5.3. Commercial & Industrial
- 4.5.4. Data Centers
- 4.5.5. Transportation
- 4.5.6. Military & Defense
- 4.5.7. Residential
- 4.5.8. Utilities
- 4.5.9. Others
- 4.6. North America Hydrogen as a Fuel Market Analysis, Opportunity and Forecast, By Country , 2016-2032
- 4.6.1. North America Hydrogen as a Fuel Market Analysis by Country : Introduction
- 4.6.2. Market Size Absolute $ Opportunity Analysis and Forecast, Country , 2016-2032
- 4.6.2.1. The US
- 4.6.2.2. Canada
- 4.6.2.3. Mexico
- 5. Western Europe Hydrogen as a Fuel Market Analysis, Opportunity and Forecast, 2016-2032
- 5.1. Western Europe Hydrogen as a Fuel Market Analysis, 2016-2021
- 5.2. Western Europe Hydrogen as a Fuel Market Opportunity and Forecast, 2023-2032
- 5.3. Western Europe Hydrogen as a Fuel Market Analysis, Opportunity and Forecast, By Technology, 2016-2032
- 5.3.1. Western Europe Hydrogen as a Fuel Market Analysis by Technology: Introduction
- 5.3.2. Market Size Absolute $ Opportunity Analysis and Forecast, By Technology, 2016-2032
- 5.3.3. Proton Exchange Membrane Fuel cells
- 5.3.4. Phosphoric Acid Fuel Cells
- 5.3.5. Solid Oxide Fuel Cells
- 5.3.6. Polymer Exchange Membrane Fuel Cells (PEMFC)
- 5.3.7. Direct Methanol Fuel Cells (DMFC)
- 5.3.8. Molten Carbonate Fuel Cells
- 5.3.9. Others
- 5.4. Western Europe Hydrogen as a Fuel Market Analysis, Opportunity and Forecast, By Application, 2016-2032
- 5.4.1. Western Europe Hydrogen as a Fuel Market Analysis by Application: Introduction
- 5.4.2. Market Size Absolute $ Opportunity Analysis and Forecast, By Application, 2016-2032
- 5.4.3. Stationary
- 5.4.4. Transportation
- 5.4.5. Portable
- 5.5. Western Europe Hydrogen as a Fuel Market Analysis, Opportunity and Forecast, By End-Use, 2016-2032
- 5.5.1. Western Europe Hydrogen as a Fuel Market Analysis by End-Use: Introduction
- 5.5.2. Market Size Absolute $ Opportunity Analysis and Forecast, By End-Use, 2016-2032
- 5.5.3. Commercial & Industrial
- 5.5.4. Data Centers
- 5.5.5. Transportation
- 5.5.6. Military & Defense
- 5.5.7. Residential
- 5.5.8. Utilities
- 5.5.9. Others
- 5.6. Western Europe Hydrogen as a Fuel Market Analysis, Opportunity and Forecast, By Country , 2016-2032
- 5.6.1. Western Europe Hydrogen as a Fuel Market Analysis by Country : Introduction
- 5.6.2. Market Size Absolute $ Opportunity Analysis and Forecast, Country , 2016-2032
- 5.6.2.1. Germany
- 5.6.2.2. France
- 5.6.2.3. The UK
- 5.6.2.4. Spain
- 5.6.2.5. Italy
- 5.6.2.6. Portugal
- 5.6.2.7. Ireland
- 5.6.2.8. Austria
- 5.6.2.9. Switzerland
- 5.6.2.10. Benelux
- 5.6.2.11. Nordic
- 5.6.2.12. Rest of Western Europe
- 6. Eastern Europe Hydrogen as a Fuel Market Analysis, Opportunity and Forecast, 2016-2032
- 6.1. Eastern Europe Hydrogen as a Fuel Market Analysis, 2016-2021
- 6.2. Eastern Europe Hydrogen as a Fuel Market Opportunity and Forecast, 2023-2032
- 6.3. Eastern Europe Hydrogen as a Fuel Market Analysis, Opportunity and Forecast, By Technology, 2016-2032
- 6.3.1. Eastern Europe Hydrogen as a Fuel Market Analysis by Technology: Introduction
- 6.3.2. Market Size Absolute $ Opportunity Analysis and Forecast, By Technology, 2016-2032
- 6.3.3. Proton Exchange Membrane Fuel cells
- 6.3.4. Phosphoric Acid Fuel Cells
- 6.3.5. Solid Oxide Fuel Cells
- 6.3.6. Polymer Exchange Membrane Fuel Cells (PEMFC)
- 6.3.7. Direct Methanol Fuel Cells (DMFC)
- 6.3.8. Molten Carbonate Fuel Cells
- 6.3.9. Others
- 6.4. Eastern Europe Hydrogen as a Fuel Market Analysis, Opportunity and Forecast, By Application, 2016-2032
- 6.4.1. Eastern Europe Hydrogen as a Fuel Market Analysis by Application: Introduction
- 6.4.2. Market Size Absolute $ Opportunity Analysis and Forecast, By Application, 2016-2032
- 6.4.3. Stationary
- 6.4.4. Transportation
- 6.4.5. Portable
- 6.5. Eastern Europe Hydrogen as a Fuel Market Analysis, Opportunity and Forecast, By End-Use, 2016-2032
- 6.5.1. Eastern Europe Hydrogen as a Fuel Market Analysis by End-Use: Introduction
- 6.5.2. Market Size Absolute $ Opportunity Analysis and Forecast, By End-Use, 2016-2032
- 6.5.3. Commercial & Industrial
- 6.5.4. Data Centers
- 6.5.5. Transportation
- 6.5.6. Military & Defense
- 6.5.7. Residential
- 6.5.8. Utilities
- 6.5.9. Others
- 6.6. Eastern Europe Hydrogen as a Fuel Market Analysis, Opportunity and Forecast, By Country , 2016-2032
- 6.6.1. Eastern Europe Hydrogen as a Fuel Market Analysis by Country : Introduction
- 6.6.2. Market Size Absolute $ Opportunity Analysis and Forecast, Country , 2016-2032
- 6.6.2.1. Russia
- 6.6.2.2. Poland
- 6.6.2.3. The Czech Republic
- 6.6.2.4. Greece
- 6.6.2.5. Rest of Eastern Europe
- 7. APAC Hydrogen as a Fuel Market Analysis, Opportunity and Forecast, 2016-2032
- 7.1. APAC Hydrogen as a Fuel Market Analysis, 2016-2021
- 7.2. APAC Hydrogen as a Fuel Market Opportunity and Forecast, 2023-2032
- 7.3. APAC Hydrogen as a Fuel Market Analysis, Opportunity and Forecast, By Technology, 2016-2032
- 7.3.1. APAC Hydrogen as a Fuel Market Analysis by Technology: Introduction
- 7.3.2. Market Size Absolute $ Opportunity Analysis and Forecast, By Technology, 2016-2032
- 7.3.3. Proton Exchange Membrane Fuel cells
- 7.3.4. Phosphoric Acid Fuel Cells
- 7.3.5. Solid Oxide Fuel Cells
- 7.3.6. Polymer Exchange Membrane Fuel Cells (PEMFC)
- 7.3.7. Direct Methanol Fuel Cells (DMFC)
- 7.3.8. Molten Carbonate Fuel Cells
- 7.3.9. Others
- 7.4. APAC Hydrogen as a Fuel Market Analysis, Opportunity and Forecast, By Application, 2016-2032
- 7.4.1. APAC Hydrogen as a Fuel Market Analysis by Application: Introduction
- 7.4.2. Market Size Absolute $ Opportunity Analysis and Forecast, By Application, 2016-2032
- 7.4.3. Stationary
- 7.4.4. Transportation
- 7.4.5. Portable
- 7.5. APAC Hydrogen as a Fuel Market Analysis, Opportunity and Forecast, By End-Use, 2016-2032
- 7.5.1. APAC Hydrogen as a Fuel Market Analysis by End-Use: Introduction
- 7.5.2. Market Size Absolute $ Opportunity Analysis and Forecast, By End-Use, 2016-2032
- 7.5.3. Commercial & Industrial
- 7.5.4. Data Centers
- 7.5.5. Transportation
- 7.5.6. Military & Defense
- 7.5.7. Residential
- 7.5.8. Utilities
- 7.5.9. Others
- 7.6. APAC Hydrogen as a Fuel Market Analysis, Opportunity and Forecast, By Country , 2016-2032
- 7.6.1. APAC Hydrogen as a Fuel Market Analysis by Country : Introduction
- 7.6.2. Market Size Absolute $ Opportunity Analysis and Forecast, Country , 2016-2032
- 7.6.2.1. China
- 7.6.2.2. Japan
- 7.6.2.3. South Korea
- 7.6.2.4. India
- 7.6.2.5. Australia & New Zeland
- 7.6.2.6. Indonesia
- 7.6.2.7. Malaysia
- 7.6.2.8. Philippines
- 7.6.2.9. Singapore
- 7.6.2.10. Thailand
- 7.6.2.11. Vietnam
- 7.6.2.12. Rest of APAC
- 8. Latin America Hydrogen as a Fuel Market Analysis, Opportunity and Forecast, 2016-2032
- 8.1. Latin America Hydrogen as a Fuel Market Analysis, 2016-2021
- 8.2. Latin America Hydrogen as a Fuel Market Opportunity and Forecast, 2023-2032
- 8.3. Latin America Hydrogen as a Fuel Market Analysis, Opportunity and Forecast, By Technology, 2016-2032
- 8.3.1. Latin America Hydrogen as a Fuel Market Analysis by Technology: Introduction
- 8.3.2. Market Size Absolute $ Opportunity Analysis and Forecast, By Technology, 2016-2032
- 8.3.3. Proton Exchange Membrane Fuel cells
- 8.3.4. Phosphoric Acid Fuel Cells
- 8.3.5. Solid Oxide Fuel Cells
- 8.3.6. Polymer Exchange Membrane Fuel Cells (PEMFC)
- 8.3.7. Direct Methanol Fuel Cells (DMFC)
- 8.3.8. Molten Carbonate Fuel Cells
- 8.3.9. Others
- 8.4. Latin America Hydrogen as a Fuel Market Analysis, Opportunity and Forecast, By Application, 2016-2032
- 8.4.1. Latin America Hydrogen as a Fuel Market Analysis by Application: Introduction
- 8.4.2. Market Size Absolute $ Opportunity Analysis and Forecast, By Application, 2016-2032
- 8.4.3. Stationary
- 8.4.4. Transportation
- 8.4.5. Portable
- 8.5. Latin America Hydrogen as a Fuel Market Analysis, Opportunity and Forecast, By End-Use, 2016-2032
- 8.5.1. Latin America Hydrogen as a Fuel Market Analysis by End-Use: Introduction
- 8.5.2. Market Size Absolute $ Opportunity Analysis and Forecast, By End-Use, 2016-2032
- 8.5.3. Commercial & Industrial
- 8.5.4. Data Centers
- 8.5.5. Transportation
- 8.5.6. Military & Defense
- 8.5.7. Residential
- 8.5.8. Utilities
- 8.5.9. Others
- 8.6. Latin America Hydrogen as a Fuel Market Analysis, Opportunity and Forecast, By Country , 2016-2032
- 8.6.1. Latin America Hydrogen as a Fuel Market Analysis by Country : Introduction
- 8.6.2. Market Size Absolute $ Opportunity Analysis and Forecast, Country , 2016-2032
- 8.6.2.1. Brazil
- 8.6.2.2. Colombia
- 8.6.2.3. Chile
- 8.6.2.4. Argentina
- 8.6.2.5. Costa Rica
- 8.6.2.6. Rest of Latin America
- 9. Middle East & Africa Hydrogen as a Fuel Market Analysis, Opportunity and Forecast, 2016-2032
- 9.1. Middle East & Africa Hydrogen as a Fuel Market Analysis, 2016-2021
- 9.2. Middle East & Africa Hydrogen as a Fuel Market Opportunity and Forecast, 2023-2032
- 9.3. Middle East & Africa Hydrogen as a Fuel Market Analysis, Opportunity and Forecast, By Technology, 2016-2032
- 9.3.1. Middle East & Africa Hydrogen as a Fuel Market Analysis by Technology: Introduction
- 9.3.2. Market Size Absolute $ Opportunity Analysis and Forecast, By Technology, 2016-2032
- 9.3.3. Proton Exchange Membrane Fuel cells
- 9.3.4. Phosphoric Acid Fuel Cells
- 9.3.5. Solid Oxide Fuel Cells
- 9.3.6. Polymer Exchange Membrane Fuel Cells (PEMFC)
- 9.3.7. Direct Methanol Fuel Cells (DMFC)
- 9.3.8. Molten Carbonate Fuel Cells
- 9.3.9. Others
- 9.4. Middle East & Africa Hydrogen as a Fuel Market Analysis, Opportunity and Forecast, By Application, 2016-2032
- 9.4.1. Middle East & Africa Hydrogen as a Fuel Market Analysis by Application: Introduction
- 9.4.2. Market Size Absolute $ Opportunity Analysis and Forecast, By Application, 2016-2032
- 9.4.3. Stationary
- 9.4.4. Transportation
- 9.4.5. Portable
- 9.5. Middle East & Africa Hydrogen as a Fuel Market Analysis, Opportunity and Forecast, By End-Use, 2016-2032
- 9.5.1. Middle East & Africa Hydrogen as a Fuel Market Analysis by End-Use: Introduction
- 9.5.2. Market Size Absolute $ Opportunity Analysis and Forecast, By End-Use, 2016-2032
- 9.5.3. Commercial & Industrial
- 9.5.4. Data Centers
- 9.5.5. Transportation
- 9.5.6. Military & Defense
- 9.5.7. Residential
- 9.5.8. Utilities
- 9.5.9. Others
- 9.6. Middle East & Africa Hydrogen as a Fuel Market Analysis, Opportunity and Forecast, By Country , 2016-2032
- 9.6.1. Middle East & Africa Hydrogen as a Fuel Market Analysis by Country : Introduction
- 9.6.2. Market Size Absolute $ Opportunity Analysis and Forecast, Country , 2016-2032
- 9.6.2.1. Algeria
- 9.6.2.2. Egypt
- 9.6.2.3. Israel
- 9.6.2.4. Kuwait
- 9.6.2.5. Nigeria
- 9.6.2.6. Saudi Arabia
- 9.6.2.7. South Africa
- 9.6.2.8. Turkey
- 9.6.2.9. The UAE
- 9.6.2.10. Rest of MEA
- 10. Global Hydrogen as a Fuel Market Analysis, Opportunity and Forecast, By Region , 2016-2032
- 10.1. Global Hydrogen as a Fuel Market Analysis by Region : Introduction
- 10.2. Market Size Absolute $ Opportunity Analysis and Forecast, By Region , 2016-2032
- 10.2.1. North America
- 10.2.2. Western Europe
- 10.2.3. Eastern Europe
- 10.2.4. APAC
- 10.2.5. Latin America
- 10.2.6. Middle East & Africa
- 11. Global Hydrogen as a Fuel Market Competitive Landscape, Market Share Analysis, and Company Profiles
- 11.1. Market Share Analysis
- 11.2. Company Profiles
- 11.3. Air Liquide
- 11.3.1. Company Overview
- 11.3.2. Financial Highlights
- 11.3.3. Product Portfolio
- 11.3.4. SWOT Analysis
- 11.3.5. Key Strategies and Developments
- 11.4. Linde plc
- 11.4.1. Company Overview
- 11.4.2. Financial Highlights
- 11.4.3. Product Portfolio
- 11.4.4. SWOT Analysis
- 11.4.5. Key Strategies and Developments
- 11.5. Air Products and Chemicals, Inc.
- 11.5.1. Company Overview
- 11.5.2. Financial Highlights
- 11.5.3. Product Portfolio
- 11.5.4. SWOT Analysis
- 11.5.5. Key Strategies and Developments
- 11.6. Shell plc
- 11.6.1. Company Overview
- 11.6.2. Financial Highlights
- 11.6.3. Product Portfolio
- 11.6.4. SWOT Analysis
- 11.6.5. Key Strategies and Developments
- 11.7. Saudi Arabian Oil Co.
- 11.7.1. Company Overview
- 11.7.2. Financial Highlights
- 11.7.3. Product Portfolio
- 11.7.4. SWOT Analysis
- 11.7.5. Key Strategies and Developments
- 11.8. Toyota Motor Corporation
- 11.8.1. Company Overview
- 11.8.2. Financial Highlights
- 11.8.3. Product Portfolio
- 11.8.4. SWOT Analysis
- 11.8.5. Key Strategies and Developments
- 11.9. Hyundai Motor Company
- 11.9.1. Company Overview
- 11.9.2. Financial Highlights
- 11.9.3. Product Portfolio
- 11.9.4. SWOT Analysis
- 11.9.5. Key Strategies and Developments
- 11.10. General Motors
- 11.10.1. Company Overview
- 11.10.2. Financial Highlights
- 11.10.3. Product Portfolio
- 11.10.4. SWOT Analysis
- 11.10.5. Key Strategies and Developments
- 11.11. Honda Motor Co., Ltd.
- 11.11.1. Company Overview
- 11.11.2. Financial Highlights
- 11.11.3. Product Portfolio
- 11.11.4. SWOT Analysis
- 11.11.5. Key Strategies and Developments
- 11.12. BMW AG
- 11.12.1. Company Overview
- 11.12.2. Financial Highlights
- 11.12.3. Product Portfolio
- 11.12.4. SWOT Analysis
- 11.12.5. Key Strategies and Developments
- 11.13.1. Company Overview
- 11.13.2. Financial Highlights
- 11.13.3. Product Portfolio
- 11.13.4. SWOT Analysis
- 11.13.5. Key Strategies and Developments
- 11.14. Daimler AG
- 11.14.1. Company Overview
- 11.14.2. Financial Highlights
- 11.14.3. Product Portfolio
- 11.14.4. SWOT Analysis
- 11.14.5. Key Strategies and Developments
- 11.15. Nikola Corporation
- 11.15.1. Company Overview
- 11.15.2. Financial Highlights
- 11.15.3. Product Portfolio
- 11.15.4. SWOT Analysis
- 11.15.5. Key Strategies and Developments
- 11.16. Cummins Inc.
- 11.16.1. Company Overview
- 11.16.2. Financial Highlights
- 11.16.3. Product Portfolio
- 11.16.4. SWOT Analysis
- 11.16.5. Key Strategies and Developments
- 11.17. Ballard Power Systems Inc.
- 11.17.1. Company Overview
- 11.17.2. Financial Highlights
- 11.17.3. Product Portfolio
- 11.17.4. SWOT Analysis
- 11.17.5. Key Strategies and Developments
- 11.18. Other Key Players
- 11.18.1. Company Overview
- 11.18.2. Financial Highlights
- 11.18.3. Product Portfolio
- 11.18.4. SWOT Analysis
- 11.18.5. Key Strategies and Developments
- 12. Assumptions and Acronyms
- 13. Research Methodology
- 14. Contact
- List of Figures
- Figure 1: Global Hydrogen as a Fuel Market Revenue (US$ Mn) Market Share by Technology in 2022
- Figure 2: Global Hydrogen as a Fuel Market Attractiveness Analysis by Technology, 2016-2032
- Figure 3: Global Hydrogen as a Fuel Market Revenue (US$ Mn) Market Share by Applicationin 2022
- Figure 4: Global Hydrogen as a Fuel Market Attractiveness Analysis by Application, 2016-2032
- Figure 5: Global Hydrogen as a Fuel Market Revenue (US$ Mn) Market Share by End-Usein 2022
- Figure 6: Global Hydrogen as a Fuel Market Attractiveness Analysis by End-Use, 2016-2032
- Figure 7: Global Hydrogen as a Fuel Market Revenue (US$ Mn) Market Share by Region in 2022
- Figure 8: Global Hydrogen as a Fuel Market Attractiveness Analysis by Region, 2016-2032
- Figure 9: Global Hydrogen as a Fuel Market Revenue (US$ Mn) (2016-2032)
- Figure 10: Global Hydrogen as a Fuel Market Revenue (US$ Mn) Comparison by Region (2016-2032)
- Figure 11: Global Hydrogen as a Fuel Market Revenue (US$ Mn) Comparison by Technology (2016-2032)
- Figure 12: Global Hydrogen as a Fuel Market Revenue (US$ Mn) Comparison by Application (2016-2032)
- Figure 13: Global Hydrogen as a Fuel Market Revenue (US$ Mn) Comparison by End-Use (2016-2032)
- Figure 14: Global Hydrogen as a Fuel Market Y-o-Y Growth Rate Comparison by Region (2016-2032)
- Figure 15: Global Hydrogen as a Fuel Market Y-o-Y Growth Rate Comparison by Technology (2016-2032)
- Figure 16: Global Hydrogen as a Fuel Market Y-o-Y Growth Rate Comparison by Application (2016-2032)
- Figure 17: Global Hydrogen as a Fuel Market Y-o-Y Growth Rate Comparison by End-Use (2016-2032)
- Figure 18: Global Hydrogen as a Fuel Market Share Comparison by Region (2016-2032)
- Figure 19: Global Hydrogen as a Fuel Market Share Comparison by Technology (2016-2032)
- Figure 20: Global Hydrogen as a Fuel Market Share Comparison by Application (2016-2032)
- Figure 21: Global Hydrogen as a Fuel Market Share Comparison by End-Use (2016-2032)
- Figure 22: North America Hydrogen as a Fuel Market Revenue (US$ Mn) Market Share by Technologyin 2022
- Figure 23: North America Hydrogen as a Fuel Market Attractiveness Analysis by Technology, 2016-2032
- Figure 24: North America Hydrogen as a Fuel Market Revenue (US$ Mn) Market Share by Applicationin 2022
- Figure 25: North America Hydrogen as a Fuel Market Attractiveness Analysis by Application, 2016-2032
- Figure 26: North America Hydrogen as a Fuel Market Revenue (US$ Mn) Market Share by End-Usein 2022
- Figure 27: North America Hydrogen as a Fuel Market Attractiveness Analysis by End-Use, 2016-2032
- Figure 28: North America Hydrogen as a Fuel Market Revenue (US$ Mn) Market Share by Country in 2022
- Figure 29: North America Hydrogen as a Fuel Market Attractiveness Analysis by Country, 2016-2032
- Figure 30: North America Hydrogen as a Fuel Market Revenue (US$ Mn) (2016-2032)
- Figure 31: North America Hydrogen as a Fuel Market Revenue (US$ Mn) Comparison by Country (2016-2032)
- Figure 32: North America Hydrogen as a Fuel Market Revenue (US$ Mn) Comparison by Technology (2016-2032)
- Figure 33: North America Hydrogen as a Fuel Market Revenue (US$ Mn) Comparison by Application (2016-2032)
- Figure 34: North America Hydrogen as a Fuel Market Revenue (US$ Mn) Comparison by End-Use (2016-2032)
- Figure 35: North America Hydrogen as a Fuel Market Y-o-Y Growth Rate Comparison by Country (2016-2032)
- Figure 36: North America Hydrogen as a Fuel Market Y-o-Y Growth Rate Comparison by Technology (2016-2032)
- Figure 37: North America Hydrogen as a Fuel Market Y-o-Y Growth Rate Comparison by Application (2016-2032)
- Figure 38: North America Hydrogen as a Fuel Market Y-o-Y Growth Rate Comparison by End-Use (2016-2032)
- Figure 39: North America Hydrogen as a Fuel Market Share Comparison by Country (2016-2032)
- Figure 40: North America Hydrogen as a Fuel Market Share Comparison by Technology (2016-2032)
- Figure 41: North America Hydrogen as a Fuel Market Share Comparison by Application (2016-2032)
- Figure 42: North America Hydrogen as a Fuel Market Share Comparison by End-Use (2016-2032)
- Figure 43: Western Europe Hydrogen as a Fuel Market Revenue (US$ Mn) Market Share by Technologyin 2022
- Figure 44: Western Europe Hydrogen as a Fuel Market Attractiveness Analysis by Technology, 2016-2032
- Figure 45: Western Europe Hydrogen as a Fuel Market Revenue (US$ Mn) Market Share by Applicationin 2022
- Figure 46: Western Europe Hydrogen as a Fuel Market Attractiveness Analysis by Application, 2016-2032
- Figure 47: Western Europe Hydrogen as a Fuel Market Revenue (US$ Mn) Market Share by End-Usein 2022
- Figure 48: Western Europe Hydrogen as a Fuel Market Attractiveness Analysis by End-Use, 2016-2032
- Figure 49: Western Europe Hydrogen as a Fuel Market Revenue (US$ Mn) Market Share by Country in 2022
- Figure 50: Western Europe Hydrogen as a Fuel Market Attractiveness Analysis by Country, 2016-2032
- Figure 51: Western Europe Hydrogen as a Fuel Market Revenue (US$ Mn) (2016-2032)
- Figure 52: Western Europe Hydrogen as a Fuel Market Revenue (US$ Mn) Comparison by Country (2016-2032)
- Figure 53: Western Europe Hydrogen as a Fuel Market Revenue (US$ Mn) Comparison by Technology (2016-2032)
- Figure 54: Western Europe Hydrogen as a Fuel Market Revenue (US$ Mn) Comparison by Application (2016-2032)
- Figure 55: Western Europe Hydrogen as a Fuel Market Revenue (US$ Mn) Comparison by End-Use (2016-2032)
- Figure 56: Western Europe Hydrogen as a Fuel Market Y-o-Y Growth Rate Comparison by Country (2016-2032)
- Figure 57: Western Europe Hydrogen as a Fuel Market Y-o-Y Growth Rate Comparison by Technology (2016-2032)
- Figure 58: Western Europe Hydrogen as a Fuel Market Y-o-Y Growth Rate Comparison by Application (2016-2032)
- Figure 59: Western Europe Hydrogen as a Fuel Market Y-o-Y Growth Rate Comparison by End-Use (2016-2032)
- Figure 60: Western Europe Hydrogen as a Fuel Market Share Comparison by Country (2016-2032)
- Figure 61: Western Europe Hydrogen as a Fuel Market Share Comparison by Technology (2016-2032)
- Figure 62: Western Europe Hydrogen as a Fuel Market Share Comparison by Application (2016-2032)
- Figure 63: Western Europe Hydrogen as a Fuel Market Share Comparison by End-Use (2016-2032)
- Figure 64: Eastern Europe Hydrogen as a Fuel Market Revenue (US$ Mn) Market Share by Technologyin 2022
- Figure 65: Eastern Europe Hydrogen as a Fuel Market Attractiveness Analysis by Technology, 2016-2032
- Figure 66: Eastern Europe Hydrogen as a Fuel Market Revenue (US$ Mn) Market Share by Applicationin 2022
- Figure 67: Eastern Europe Hydrogen as a Fuel Market Attractiveness Analysis by Application, 2016-2032
- Figure 68: Eastern Europe Hydrogen as a Fuel Market Revenue (US$ Mn) Market Share by End-Usein 2022
- Figure 69: Eastern Europe Hydrogen as a Fuel Market Attractiveness Analysis by End-Use, 2016-2032
- Figure 70: Eastern Europe Hydrogen as a Fuel Market Revenue (US$ Mn) Market Share by Country in 2022
- Figure 71: Eastern Europe Hydrogen as a Fuel Market Attractiveness Analysis by Country, 2016-2032
- Figure 72: Eastern Europe Hydrogen as a Fuel Market Revenue (US$ Mn) (2016-2032)
- Figure 73: Eastern Europe Hydrogen as a Fuel Market Revenue (US$ Mn) Comparison by Country (2016-2032)
- Figure 74: Eastern Europe Hydrogen as a Fuel Market Revenue (US$ Mn) Comparison by Technology (2016-2032)
- Figure 75: Eastern Europe Hydrogen as a Fuel Market Revenue (US$ Mn) Comparison by Application (2016-2032)
- Figure 76: Eastern Europe Hydrogen as a Fuel Market Revenue (US$ Mn) Comparison by End-Use (2016-2032)
- Figure 77: Eastern Europe Hydrogen as a Fuel Market Y-o-Y Growth Rate Comparison by Country (2016-2032)
- Figure 78: Eastern Europe Hydrogen as a Fuel Market Y-o-Y Growth Rate Comparison by Technology (2016-2032)
- Figure 79: Eastern Europe Hydrogen as a Fuel Market Y-o-Y Growth Rate Comparison by Application (2016-2032)
- Figure 80: Eastern Europe Hydrogen as a Fuel Market Y-o-Y Growth Rate Comparison by End-Use (2016-2032)
- Figure 81: Eastern Europe Hydrogen as a Fuel Market Share Comparison by Country (2016-2032)
- Figure 82: Eastern Europe Hydrogen as a Fuel Market Share Comparison by Technology (2016-2032)
- Figure 83: Eastern Europe Hydrogen as a Fuel Market Share Comparison by Application (2016-2032)
- Figure 84: Eastern Europe Hydrogen as a Fuel Market Share Comparison by End-Use (2016-2032)
- Figure 85: APAC Hydrogen as a Fuel Market Revenue (US$ Mn) Market Share by Technologyin 2022
- Figure 86: APAC Hydrogen as a Fuel Market Attractiveness Analysis by Technology, 2016-2032
- Figure 87: APAC Hydrogen as a Fuel Market Revenue (US$ Mn) Market Share by Applicationin 2022
- Figure 88: APAC Hydrogen as a Fuel Market Attractiveness Analysis by Application, 2016-2032
- Figure 89: APAC Hydrogen as a Fuel Market Revenue (US$ Mn) Market Share by End-Usein 2022
- Figure 90: APAC Hydrogen as a Fuel Market Attractiveness Analysis by End-Use, 2016-2032
- Figure 91: APAC Hydrogen as a Fuel Market Revenue (US$ Mn) Market Share by Country in 2022
- Figure 92: APAC Hydrogen as a Fuel Market Attractiveness Analysis by Country, 2016-2032
- Figure 93: APAC Hydrogen as a Fuel Market Revenue (US$ Mn) (2016-2032)
- Figure 94: APAC Hydrogen as a Fuel Market Revenue (US$ Mn) Comparison by Country (2016-2032)
- Figure 95: APAC Hydrogen as a Fuel Market Revenue (US$ Mn) Comparison by Technology (2016-2032)
- Figure 96: APAC Hydrogen as a Fuel Market Revenue (US$ Mn) Comparison by Application (2016-2032)
- Figure 97: APAC Hydrogen as a Fuel Market Revenue (US$ Mn) Comparison by End-Use (2016-2032)
- Figure 98: APAC Hydrogen as a Fuel Market Y-o-Y Growth Rate Comparison by Country (2016-2032)
- Figure 99: APAC Hydrogen as a Fuel Market Y-o-Y Growth Rate Comparison by Technology (2016-2032)
- Figure 100: APAC Hydrogen as a Fuel Market Y-o-Y Growth Rate Comparison by Application (2016-2032)
- Figure 101: APAC Hydrogen as a Fuel Market Y-o-Y Growth Rate Comparison by End-Use (2016-2032)
- Figure 102: APAC Hydrogen as a Fuel Market Share Comparison by Country (2016-2032)
- Figure 103: APAC Hydrogen as a Fuel Market Share Comparison by Technology (2016-2032)
- Figure 104: APAC Hydrogen as a Fuel Market Share Comparison by Application (2016-2032)
- Figure 105: APAC Hydrogen as a Fuel Market Share Comparison by End-Use (2016-2032)
- Figure 106: Latin America Hydrogen as a Fuel Market Revenue (US$ Mn) Market Share by Technologyin 2022
- Figure 107: Latin America Hydrogen as a Fuel Market Attractiveness Analysis by Technology, 2016-2032
- Figure 108: Latin America Hydrogen as a Fuel Market Revenue (US$ Mn) Market Share by Applicationin 2022
- Figure 109: Latin America Hydrogen as a Fuel Market Attractiveness Analysis by Application, 2016-2032
- Figure 110: Latin America Hydrogen as a Fuel Market Revenue (US$ Mn) Market Share by End-Usein 2022
- Figure 111: Latin America Hydrogen as a Fuel Market Attractiveness Analysis by End-Use, 2016-2032
- Figure 112: Latin America Hydrogen as a Fuel Market Revenue (US$ Mn) Market Share by Country in 2022
- Figure 113: Latin America Hydrogen as a Fuel Market Attractiveness Analysis by Country, 2016-2032
- Figure 114: Latin America Hydrogen as a Fuel Market Revenue (US$ Mn) (2016-2032)
- Figure 115: Latin America Hydrogen as a Fuel Market Revenue (US$ Mn) Comparison by Country (2016-2032)
- Figure 116: Latin America Hydrogen as a Fuel Market Revenue (US$ Mn) Comparison by Technology (2016-2032)
- Figure 117: Latin America Hydrogen as a Fuel Market Revenue (US$ Mn) Comparison by Application (2016-2032)
- Figure 118: Latin America Hydrogen as a Fuel Market Revenue (US$ Mn) Comparison by End-Use (2016-2032)
- Figure 119: Latin America Hydrogen as a Fuel Market Y-o-Y Growth Rate Comparison by Country (2016-2032)
- Figure 120: Latin America Hydrogen as a Fuel Market Y-o-Y Growth Rate Comparison by Technology (2016-2032)
- Figure 121: Latin America Hydrogen as a Fuel Market Y-o-Y Growth Rate Comparison by Application (2016-2032)
- Figure 122: Latin America Hydrogen as a Fuel Market Y-o-Y Growth Rate Comparison by End-Use (2016-2032)
- Figure 123: Latin America Hydrogen as a Fuel Market Share Comparison by Country (2016-2032)
- Figure 124: Latin America Hydrogen as a Fuel Market Share Comparison by Technology (2016-2032)
- Figure 125: Latin America Hydrogen as a Fuel Market Share Comparison by Application (2016-2032)
- Figure 126: Latin America Hydrogen as a Fuel Market Share Comparison by End-Use (2016-2032)
- Figure 127: Middle East & Africa Hydrogen as a Fuel Market Revenue (US$ Mn) Market Share by Technologyin 2022
- Figure 128: Middle East & Africa Hydrogen as a Fuel Market Attractiveness Analysis by Technology, 2016-2032
- Figure 129: Middle East & Africa Hydrogen as a Fuel Market Revenue (US$ Mn) Market Share by Applicationin 2022
- Figure 130: Middle East & Africa Hydrogen as a Fuel Market Attractiveness Analysis by Application, 2016-2032
- Figure 131: Middle East & Africa Hydrogen as a Fuel Market Revenue (US$ Mn) Market Share by End-Usein 2022
- Figure 132: Middle East & Africa Hydrogen as a Fuel Market Attractiveness Analysis by End-Use, 2016-2032
- Figure 133: Middle East & Africa Hydrogen as a Fuel Market Revenue (US$ Mn) Market Share by Country in 2022
- Figure 134: Middle East & Africa Hydrogen as a Fuel Market Attractiveness Analysis by Country, 2016-2032
- Figure 135: Middle East & Africa Hydrogen as a Fuel Market Revenue (US$ Mn) (2016-2032)
- Figure 136: Middle East & Africa Hydrogen as a Fuel Market Revenue (US$ Mn) Comparison by Country (2016-2032)
- Figure 137: Middle East & Africa Hydrogen as a Fuel Market Revenue (US$ Mn) Comparison by Technology (2016-2032)
- Figure 138: Middle East & Africa Hydrogen as a Fuel Market Revenue (US$ Mn) Comparison by Application (2016-2032)
- Figure 139: Middle East & Africa Hydrogen as a Fuel Market Revenue (US$ Mn) Comparison by End-Use (2016-2032)
- Figure 140: Middle East & Africa Hydrogen as a Fuel Market Y-o-Y Growth Rate Comparison by Country (2016-2032)
- Figure 141: Middle East & Africa Hydrogen as a Fuel Market Y-o-Y Growth Rate Comparison by Technology (2016-2032)
- Figure 142: Middle East & Africa Hydrogen as a Fuel Market Y-o-Y Growth Rate Comparison by Application (2016-2032)
- Figure 143: Middle East & Africa Hydrogen as a Fuel Market Y-o-Y Growth Rate Comparison by End-Use (2016-2032)
- Figure 144: Middle East & Africa Hydrogen as a Fuel Market Share Comparison by Country (2016-2032)
- Figure 145: Middle East & Africa Hydrogen as a Fuel Market Share Comparison by Technology (2016-2032)
- Figure 146: Middle East & Africa Hydrogen as a Fuel Market Share Comparison by Application (2016-2032)
- Figure 147: Middle East & Africa Hydrogen as a Fuel Market Share Comparison by End-Use (2016-2032)
- List of Tables
- Table 1: Global Hydrogen as a Fuel Market Comparison by Technology (2016-2032)
- Table 2: Global Hydrogen as a Fuel Market Comparison by Application (2016-2032)
- Table 3: Global Hydrogen as a Fuel Market Comparison by End-Use (2016-2032)
- Table 4: Global Hydrogen as a Fuel Market Revenue (US$ Mn) Comparison by Region (2016-2032)
- Table 5: Global Hydrogen as a Fuel Market Revenue (US$ Mn) (2016-2032)
- Table 6: Global Hydrogen as a Fuel Market Revenue (US$ Mn) Comparison by Region (2016-2032)
- Table 7: Global Hydrogen as a Fuel Market Revenue (US$ Mn) Comparison by Technology (2016-2032)
- Table 8: Global Hydrogen as a Fuel Market Revenue (US$ Mn) Comparison by Application (2016-2032)
- Table 9: Global Hydrogen as a Fuel Market Revenue (US$ Mn) Comparison by End-Use (2016-2032)
- Table 10: Global Hydrogen as a Fuel Market Y-o-Y Growth Rate Comparison by Region (2016-2032)
- Table 11: Global Hydrogen as a Fuel Market Y-o-Y Growth Rate Comparison by Technology (2016-2032)
- Table 12: Global Hydrogen as a Fuel Market Y-o-Y Growth Rate Comparison by Application (2016-2032)
- Table 13: Global Hydrogen as a Fuel Market Y-o-Y Growth Rate Comparison by End-Use (2016-2032)
- Table 14: Global Hydrogen as a Fuel Market Share Comparison by Region (2016-2032)
- Table 15: Global Hydrogen as a Fuel Market Share Comparison by Technology (2016-2032)
- Table 16: Global Hydrogen as a Fuel Market Share Comparison by Application (2016-2032)
- Table 17: Global Hydrogen as a Fuel Market Share Comparison by End-Use (2016-2032)
- Table 18: North America Hydrogen as a Fuel Market Comparison by Application (2016-2032)
- Table 19: North America Hydrogen as a Fuel Market Comparison by End-Use (2016-2032)
- Table 20: North America Hydrogen as a Fuel Market Revenue (US$ Mn) Comparison by Country (2016-2032)
- Table 21: North America Hydrogen as a Fuel Market Revenue (US$ Mn) (2016-2032)
- Table 22: North America Hydrogen as a Fuel Market Revenue (US$ Mn) Comparison by Country (2016-2032)
- Table 23: North America Hydrogen as a Fuel Market Revenue (US$ Mn) Comparison by Technology (2016-2032)
- Table 24: North America Hydrogen as a Fuel Market Revenue (US$ Mn) Comparison by Application (2016-2032)
- Table 25: North America Hydrogen as a Fuel Market Revenue (US$ Mn) Comparison by End-Use (2016-2032)
- Table 26: North America Hydrogen as a Fuel Market Y-o-Y Growth Rate Comparison by Country (2016-2032)
- Table 27: North America Hydrogen as a Fuel Market Y-o-Y Growth Rate Comparison by Technology (2016-2032)
- Table 28: North America Hydrogen as a Fuel Market Y-o-Y Growth Rate Comparison by Application (2016-2032)
- Table 29: North America Hydrogen as a Fuel Market Y-o-Y Growth Rate Comparison by End-Use (2016-2032)
- Table 30: North America Hydrogen as a Fuel Market Share Comparison by Country (2016-2032)
- Table 31: North America Hydrogen as a Fuel Market Share Comparison by Technology (2016-2032)
- Table 32: North America Hydrogen as a Fuel Market Share Comparison by Application (2016-2032)
- Table 33: North America Hydrogen as a Fuel Market Share Comparison by End-Use (2016-2032)
- Table 34: Western Europe Hydrogen as a Fuel Market Comparison by Technology (2016-2032)
- Table 35: Western Europe Hydrogen as a Fuel Market Comparison by Application (2016-2032)
- Table 36: Western Europe Hydrogen as a Fuel Market Comparison by End-Use (2016-2032)
- Table 37: Western Europe Hydrogen as a Fuel Market Revenue (US$ Mn) Comparison by Country (2016-2032)
- Table 38: Western Europe Hydrogen as a Fuel Market Revenue (US$ Mn) (2016-2032)
- Table 39: Western Europe Hydrogen as a Fuel Market Revenue (US$ Mn) Comparison by Country (2016-2032)
- Table 40: Western Europe Hydrogen as a Fuel Market Revenue (US$ Mn) Comparison by Technology (2016-2032)
- Table 41: Western Europe Hydrogen as a Fuel Market Revenue (US$ Mn) Comparison by Application (2016-2032)
- Table 42: Western Europe Hydrogen as a Fuel Market Revenue (US$ Mn) Comparison by End-Use (2016-2032)
- Table 43: Western Europe Hydrogen as a Fuel Market Y-o-Y Growth Rate Comparison by Country (2016-2032)
- Table 44: Western Europe Hydrogen as a Fuel Market Y-o-Y Growth Rate Comparison by Technology (2016-2032)
- Table 45: Western Europe Hydrogen as a Fuel Market Y-o-Y Growth Rate Comparison by Application (2016-2032)
- Table 46: Western Europe Hydrogen as a Fuel Market Y-o-Y Growth Rate Comparison by End-Use (2016-2032)
- Table 47: Western Europe Hydrogen as a Fuel Market Share Comparison by Country (2016-2032)
- Table 48: Western Europe Hydrogen as a Fuel Market Share Comparison by Technology (2016-2032)
- Table 49: Western Europe Hydrogen as a Fuel Market Share Comparison by Application (2016-2032)
- Table 50: Western Europe Hydrogen as a Fuel Market Share Comparison by End-Use (2016-2032)
- Table 51: Eastern Europe Hydrogen as a Fuel Market Comparison by Technology (2016-2032)
- Table 52: Eastern Europe Hydrogen as a Fuel Market Comparison by Application (2016-2032)
- Table 53: Eastern Europe Hydrogen as a Fuel Market Comparison by End-Use (2016-2032)
- Table 54: Eastern Europe Hydrogen as a Fuel Market Revenue (US$ Mn) Comparison by Country (2016-2032)
- Table 55: Eastern Europe Hydrogen as a Fuel Market Revenue (US$ Mn) (2016-2032)
- Table 56: Eastern Europe Hydrogen as a Fuel Market Revenue (US$ Mn) Comparison by Country (2016-2032)
- Table 57: Eastern Europe Hydrogen as a Fuel Market Revenue (US$ Mn) Comparison by Technology (2016-2032)
- Table 58: Eastern Europe Hydrogen as a Fuel Market Revenue (US$ Mn) Comparison by Application (2016-2032)
- Table 59: Eastern Europe Hydrogen as a Fuel Market Revenue (US$ Mn) Comparison by End-Use (2016-2032)
- Table 60: Eastern Europe Hydrogen as a Fuel Market Y-o-Y Growth Rate Comparison by Country (2016-2032)
- Table 61: Eastern Europe Hydrogen as a Fuel Market Y-o-Y Growth Rate Comparison by Technology (2016-2032)
- Table 62: Eastern Europe Hydrogen as a Fuel Market Y-o-Y Growth Rate Comparison by Application (2016-2032)
- Table 63: Eastern Europe Hydrogen as a Fuel Market Y-o-Y Growth Rate Comparison by End-Use (2016-2032)
- Table 64: Eastern Europe Hydrogen as a Fuel Market Share Comparison by Country (2016-2032)
- Table 65: Eastern Europe Hydrogen as a Fuel Market Share Comparison by Technology (2016-2032)
- Table 66: Eastern Europe Hydrogen as a Fuel Market Share Comparison by Application (2016-2032)
- Table 67: Eastern Europe Hydrogen as a Fuel Market Share Comparison by End-Use (2016-2032)
- Table 68: APAC Hydrogen as a Fuel Market Comparison by Technology (2016-2032)
- Table 69: APAC Hydrogen as a Fuel Market Comparison by Application (2016-2032)
- Table 70: APAC Hydrogen as a Fuel Market Comparison by End-Use (2016-2032)
- Table 71: APAC Hydrogen as a Fuel Market Revenue (US$ Mn) Comparison by Country (2016-2032)
- Table 72: APAC Hydrogen as a Fuel Market Revenue (US$ Mn) (2016-2032)
- Table 73: APAC Hydrogen as a Fuel Market Revenue (US$ Mn) Comparison by Country (2016-2032)
- Table 74: APAC Hydrogen as a Fuel Market Revenue (US$ Mn) Comparison by Technology (2016-2032)
- Table 75: APAC Hydrogen as a Fuel Market Revenue (US$ Mn) Comparison by Application (2016-2032)
- Table 76: APAC Hydrogen as a Fuel Market Revenue (US$ Mn) Comparison by End-Use (2016-2032)
- Table 77: APAC Hydrogen as a Fuel Market Y-o-Y Growth Rate Comparison by Country (2016-2032)
- Table 78: APAC Hydrogen as a Fuel Market Y-o-Y Growth Rate Comparison by Technology (2016-2032)
- Table 79: APAC Hydrogen as a Fuel Market Y-o-Y Growth Rate Comparison by Application (2016-2032)
- Table 80: APAC Hydrogen as a Fuel Market Y-o-Y Growth Rate Comparison by End-Use (2016-2032)
- Table 81: APAC Hydrogen as a Fuel Market Share Comparison by Country (2016-2032)
- Table 82: APAC Hydrogen as a Fuel Market Share Comparison by Technology (2016-2032)
- Table 83: APAC Hydrogen as a Fuel Market Share Comparison by Application (2016-2032)
- Table 84: APAC Hydrogen as a Fuel Market Share Comparison by End-Use (2016-2032)
- Table 85: Latin America Hydrogen as a Fuel Market Comparison by Technology (2016-2032)
- Table 86: Latin America Hydrogen as a Fuel Market Comparison by Application (2016-2032)
- Table 87: Latin America Hydrogen as a Fuel Market Comparison by End-Use (2016-2032)
- Table 88: Latin America Hydrogen as a Fuel Market Revenue (US$ Mn) Comparison by Country (2016-2032)
- Table 89: Latin America Hydrogen as a Fuel Market Revenue (US$ Mn) (2016-2032)
- Table 90: Latin America Hydrogen as a Fuel Market Revenue (US$ Mn) Comparison by Country (2016-2032)
- Table 91: Latin America Hydrogen as a Fuel Market Revenue (US$ Mn) Comparison by Technology (2016-2032)
- Table 92: Latin America Hydrogen as a Fuel Market Revenue (US$ Mn) Comparison by Application (2016-2032)
- Table 93: Latin America Hydrogen as a Fuel Market Revenue (US$ Mn) Comparison by End-Use (2016-2032)
- Table 94: Latin America Hydrogen as a Fuel Market Y-o-Y Growth Rate Comparison by Country (2016-2032)
- Table 95: Latin America Hydrogen as a Fuel Market Y-o-Y Growth Rate Comparison by Technology (2016-2032)
- Table 96: Latin America Hydrogen as a Fuel Market Y-o-Y Growth Rate Comparison by Application (2016-2032)
- Table 97: Latin America Hydrogen as a Fuel Market Y-o-Y Growth Rate Comparison by End-Use (2016-2032)
- Table 98: Latin America Hydrogen as a Fuel Market Share Comparison by Country (2016-2032)
- Table 99: Latin America Hydrogen as a Fuel Market Share Comparison by Technology (2016-2032)
- Table 100: Latin America Hydrogen as a Fuel Market Share Comparison by Application (2016-2032)
- Table 101: Latin America Hydrogen as a Fuel Market Share Comparison by End-Use (2016-2032)
- Table 102: Middle East & Africa Hydrogen as a Fuel Market Comparison by Technology (2016-2032)
- Table 103: Middle East & Africa Hydrogen as a Fuel Market Comparison by Application (2016-2032)
- Table 104: Middle East & Africa Hydrogen as a Fuel Market Comparison by End-Use (2016-2032)
- Table 105: Middle East & Africa Hydrogen as a Fuel Market Revenue (US$ Mn) Comparison by Country (2016-2032)
- Table 106: Middle East & Africa Hydrogen as a Fuel Market Revenue (US$ Mn) (2016-2032)
- Table 107: Middle East & Africa Hydrogen as a Fuel Market Revenue (US$ Mn) Comparison by Country (2016-2032)
- Table 108: Middle East & Africa Hydrogen as a Fuel Market Revenue (US$ Mn) Comparison by Technology (2016-2032)
- Table 109: Middle East & Africa Hydrogen as a Fuel Market Revenue (US$ Mn) Comparison by Application (2016-2032)
- Table 110: Middle East & Africa Hydrogen as a Fuel Market Revenue (US$ Mn) Comparison by End-Use (2016-2032)
- Table 111: Middle East & Africa Hydrogen as a Fuel Market Y-o-Y Growth Rate Comparison by Country (2016-2032)
- Table 112: Middle East & Africa Hydrogen as a Fuel Market Y-o-Y Growth Rate Comparison by Technology (2016-2032)
- Table 113: Middle East & Africa Hydrogen as a Fuel Market Y-o-Y Growth Rate Comparison by Application (2016-2032)
- Table 114: Middle East & Africa Hydrogen as a Fuel Market Y-o-Y Growth Rate Comparison by End-Use (2016-2032)
- Table 115: Middle East & Africa Hydrogen as a Fuel Market Share Comparison by Country (2016-2032)
- Table 116: Middle East & Africa Hydrogen as a Fuel Market Share Comparison by Technology (2016-2032)
- Table 117: Middle East & Africa Hydrogen as a Fuel Market Share Comparison by Application (2016-2032)
- Table 118: Middle East & Africa Hydrogen as a Fuel Market Share Comparison by End-Use (2016-2032)
- 1. Executive Summary
-
- Air Liquide
- Linde plc
- Air Products and Chemicals, Inc.
- Shell plc
- Saudi Arabian Oil Co.
- Toyota Motor Corporation
- Hyundai Motor Company
- General Motors
- Honda Motor Co., Ltd.
- BMW AG
- Daimler AG
- Audi AG
- Nikola Corporation
- Cummins Inc.
- Ballard Power Systems Inc.
Our Clients


View Our Licence Options
