Global Hydrate Inhibitors Market By Product Type(Thermodynamic Inhibitors (Methanol, Ethylene Glycol, and Monoethylene Glycol), Low-Dosage Inhibitor (Anti-Agglomerate Inhibitors, Kinetic Hydrate Inhibitors)), By Raw Material(Alcohol, Glycol, Ionic Salt, Others), By Operations(Onshore, Offshore), By Application(Gas Gathering System, Pipeline System, Corrosion Protector, Others), By Region And Companies - Industry Segment Outlook, Market Assessment, Competition Scenario, Trends, And Forecast 2024-2033
-
46635
-
May 2024
-
300
-


-
This report was compiled by Shreyas Rokade Shreyas Rokade is a seasoned Research Analyst with CMFE, bringing extensive expertise in market research and consulting, with a strong background in Chemical Engineering. Correspondence Team Lead-CMFE Linkedin | Detailed Market research Methodology Our methodology involves a mix of primary research, including interviews with leading mental health experts, and secondary research from reputable medical journals and databases. View Detailed Methodology Page
-
Quick Navigation
- Report Overview
- Key Takeaways
- Driving factors
- Restraining Factors
- By Product Type Analysis
- By Raw Material Analysis
- By Operations Analysis
- By Application Analysis
- Key Market Segments
- Growth Opportunity
- Latest Trends
- Rising Research and Development Endeavors
- Regional Analysis
- Key Players Analysis
- Recent Development
- Report Scope
Report Overview
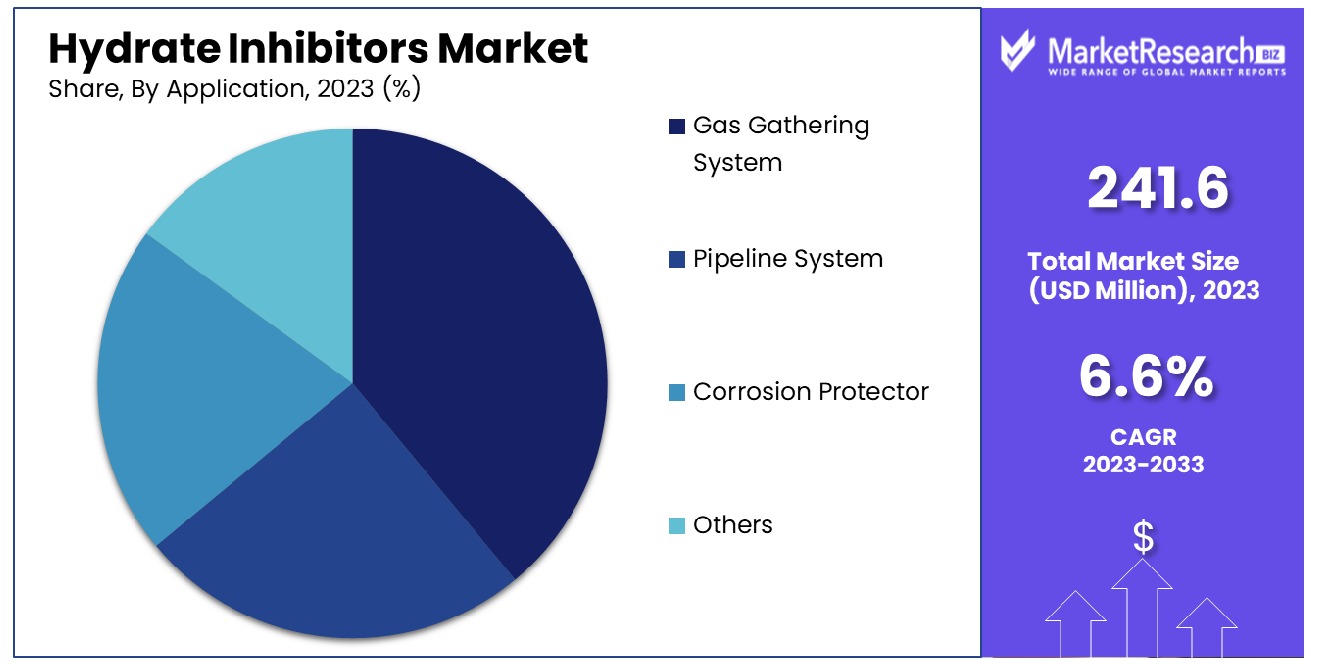
The Global Hydrate Inhibitors Market was valued at USD 241.6 million in 2023. It is expected to reach USD 450.5 million by 2033, with a CAGR of 6.6% during the forecast period from 2024 to 2033.
The Hydrate Inhibitors Market comprises enterprises focused on developing chemicals that prevent the formation of hydrates in oil and gas pipelines. These hydrates, crystalline ice-like structures, can obstruct fluid flow, posing operational and safety risks. Market offerings include kinetic hydrate inhibitors and anti-agglomerates, tailored to enhance flow assurance under diverse conditions.
Key market participants are driven to innovate in formulation and application techniques to meet the industry's evolving demands. This sector is crucial for maintaining uninterrupted energy supply chains, particularly in regions with extreme temperature and pressure conditions in oil and gas extraction and transportation.

The hydrate inhibitors market has experienced significant growth driven by increasing exploration and production activities in the oil and gas sector. Hydrate inhibitors, particularly thermodynamic hydrate inhibitors (THIs), play a crucial role in preventing the formation of gas hydrates, which can obstruct pipelines and disrupt operations.
The effectiveness of THIs in shifting the hydrate-liquid-vapor equilibrium (HLVE) curve is paramount as it prevents hydrate formation by lowering the hydrate formation temperature. These inhibitors are typically applied in substantial quantities, ranging from 10-50 wt%, and commonly consist of anti-freezing solvents such as methanol, glycols, and salts like sodium and potassium chlorides.
However, the market faces significant challenges. The environmental impact of using THIs is a growing concern, as these substances are not environmentally friendly, leading to increased regulatory scrutiny. Additionally, the high costs associated with the use of THIs, both in terms of procurement and the impact on oil and gas production and transportation costs, pose economic challenges. Companies are investing in research and development to innovate and develop more sustainable and cost-effective solutions.
Recent advancements in low-dosage hydrate inhibitors (LDHIs) present an opportunity for the market. LDHIs, which include kinetic hydrate inhibitors (KHIs) and anti-agglomerates (AAs), offer a more environmentally friendly and cost-effective alternative to THIs. The adoption of these advanced inhibitors could drive market growth, provided they prove to be effective at scale.
Key Takeaways
- Market Growth: The Global Hydrate Inhibitors Market was valued at USD 241.6 million in 2023. It is expected to reach USD 450.5 million by 2033, with a CAGR of 6.6% during the forecast period from 2024 to 2033.
- By Product Type: Thermodynamic inhibitors, including Methanol, Ethylene Glycol, and Monoethylene Glycol, lead with 37.3% market dominance.
- By Raw Material: Alcohol emerges as the dominant raw material, comprising 27%.
- By Operations: Onshore operations stand out, commanding a dominant 60% share.
- By Application: Gas gathering systems claim dominance with a commanding 42% share.
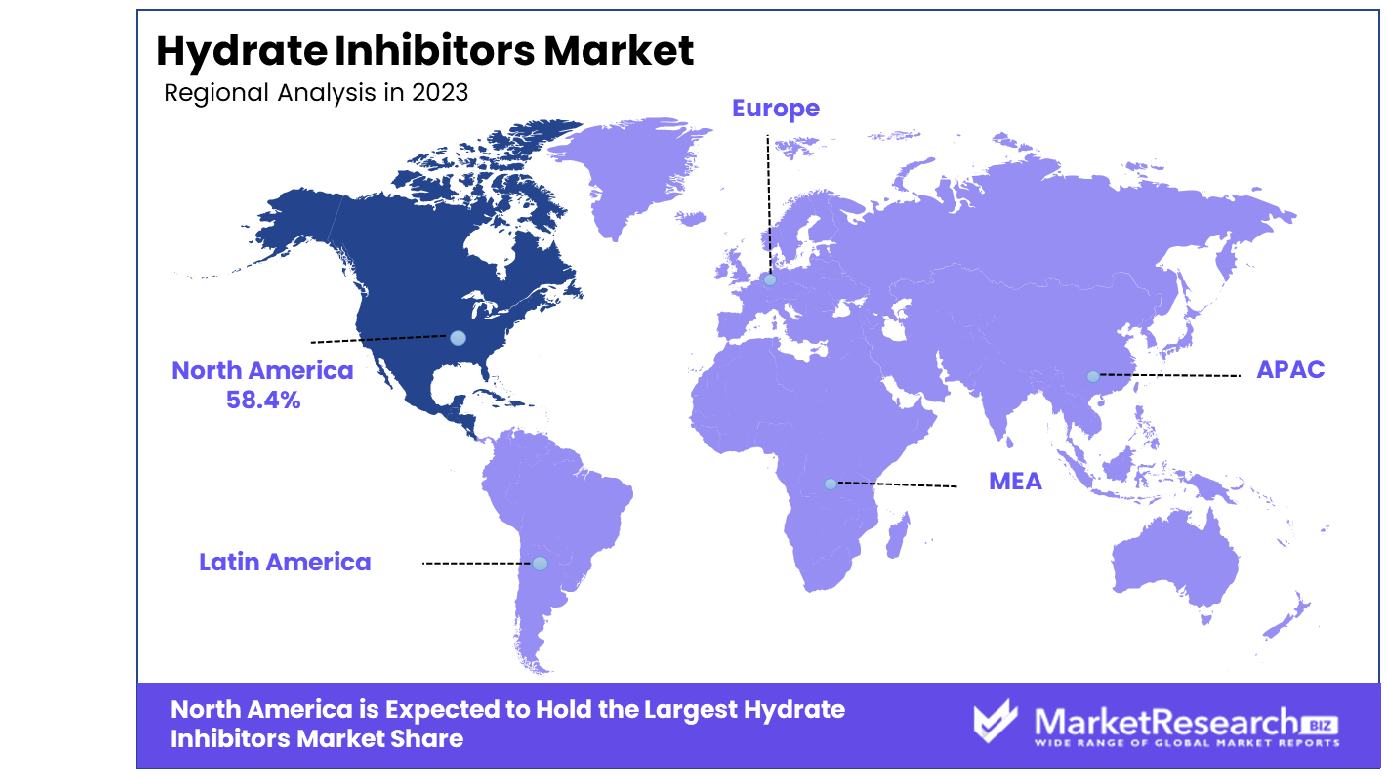
- Regional Dominance: In North America, the market for hydrate inhibitors has witnessed a robust growth of 58.4%.
- Growth Opportunity: The 2023 outlook for the global Hydrate Inhibitors Market is optimistic, driven by the increasing shift to renewable energy and investments in oil and gas exploration, especially in developing nations.
Driving factors
Environmental Issues Related to Anti-Agglomerate (AA) LDHI
The growing environmental concerns associated with Anti-Agglomerate (AA) Low-Dosage Hydrate Inhibitors (LDHI) have significantly impacted the Hydrate Inhibitors Market. AA LDHIs, while effective in preventing hydrate formation in pipelines, pose environmental risks due to their chemical composition. This has led to increased regulatory scrutiny and a push for more sustainable alternatives.
The market has responded by accelerating the development and adoption of environmentally friendly hydrate inhibitors, such as kinetic hydrate inhibitors (KHIs) and greener AA formulations. This shift not only addresses regulatory compliance but also aligns with broader industry trends towards sustainability, thereby driving market growth as companies invest in research and development of safer and more eco-friendly products.
Shifting Trend Towards Renewable Energy Sources
The global shift towards renewable energy sources has reshaped the landscape of the Hydrate Inhibitors Market. As countries and companies strive to reduce their carbon footprints, there is an increasing investment in renewable energy infrastructure, such as offshore wind farms and solar energy projects. While traditional oil and gas sectors remain significant, the integration of renewable energy systems necessitates advanced hydrate management solutions to ensure operational efficiency.
This transition is creating new opportunities for hydrate inhibitor manufacturers to develop specialized products that cater to the unique challenges of renewable energy operations, thus fostering market expansion. Additionally, the convergence of traditional and renewable energy sectors encourages innovation and diversification within the hydrate inhibitors industry.
Market Competitiveness and Vendor Strategies
The competitive landscape of the Hydrate Inhibitors Market is characterized by aggressive strategies adopted by vendors to enhance their market share. Key players are focusing on product innovation, strategic partnerships, and mergers and acquisitions to strengthen their positions. For instance, companies are investing heavily in R&D to develop more efficient and cost-effective hydrate inhibitors, which can offer better performance under varying operational conditions.
Moreover, strategic collaborations with oil and gas operators and renewable energy companies are facilitating the deployment of tailored solutions that meet specific client needs. This competitive drive not only intensifies market dynamics but also accelerates the overall growth of the Hydrate Inhibitors Market as vendors seek to capitalize on emerging opportunities and technological advancements.
Restraining Factors
High Dosage Requirement of Thermodynamic Inhibitors
The high dosage requirement of thermodynamic inhibitors presents a significant challenge to the growth of the Hydrate Inhibitors Market. Thermodynamic inhibitors, such as methanol and glycols, are widely used to prevent hydrate formation in oil and gas pipelines. However, these inhibitors necessitate large quantities to be effective, leading to increased operational costs and logistical complexities.
For instance, the transportation and storage of substantial volumes of these chemicals can be both costly and cumbersome, particularly in remote offshore locations. This financial burden can deter companies from using thermodynamic inhibitors extensively, thereby limiting market expansion.
Moreover, the environmental impact of high dosage usage is another critical concern, as large-scale chemical use can lead to potential ecological hazards. Consequently, the industry is witnessing a shift towards low-dosage hydrate inhibitors (LDHIs), which are more efficient and environmentally friendly, indirectly promoting the growth of LDHI segments within the broader hydrate inhibitors market.
Availability of Depressurization Method for Controlling Hydrate Formation
The availability of the depressurization method as an alternative to chemical inhibitors is another restraining factor impacting the Hydrate Inhibitors Market. Depressurization, which involves reducing the pressure in pipelines to prevent hydrate formation, offers a cost-effective and straightforward solution, especially in scenarios where the infrastructure can support such operations. This method can significantly reduce the reliance on chemical inhibitors, thereby diminishing their market demand.
Additionally, depressurization is perceived as a safer and more environmentally benign approach, further encouraging its adoption over chemical-based methods. However, the method is not universally applicable, particularly in deepwater and high-pressure environments where maintaining operational pressure is critical.
Despite its limitations, the growing preference for depressurization in suitable applications can stifle the growth of the chemical hydrate inhibitors segment. This dynamic pushes the market towards innovation and the development of more versatile and effective inhibitors that can compete with physical methods like depressurization, ultimately influencing the overall market landscape and driving advancements in inhibitor technologies.
By Product Type Analysis
Thermodynamic Inhibitors, including Methanol, Ethylene Glycol, and Monoethylene Glycol, dominated 37.3% of the market.
In 2023, Thermodynamic Inhibitors (Methanol, Ethylene Glycol, and Monoethylene Glycol) held a dominant market position in the By Product Type segment of the Hydrate Inhibitors Market, capturing more than a 37.3% share. This segment's robust performance underscores the significant role played by thermodynamic inhibitors in preventing hydrate formation in various industrial applications, particularly in oil and gas production.
Thermodynamic inhibitors, including Methanol, Ethylene Glycol, and Monoethylene Glycol, are widely recognized for their efficacy in inhibiting hydrate formation by altering the thermodynamic conditions of the fluid system. Methanol, in particular, is favored for its versatility and cost-effectiveness, making it a preferred choice for hydrate inhibition in offshore oil and gas operations. Ethylene Glycol and Monoethylene Glycol are also extensively utilized owing to their ability to lower the freezing point of water, thereby preventing hydrate formation in subsea pipelines and equipment.
Moreover, the Low-Dosage Inhibitor segment, comprising Anti-Agglomerate Inhibitors and Kinetic Hydrate Inhibitors, exhibited promising growth prospects in the Hydrate Inhibitors Market. These inhibitors offer innovative solutions for mitigating hydrate-related risks while minimizing chemical usage, thus appealing to operators seeking sustainable and cost-efficient hydrate management strategies.
The dominance of Thermodynamic Inhibitors coupled with the burgeoning interest in Low-Dosage Inhibitors reflects the industry's ongoing efforts to enhance operational efficiency and safety in challenging environments. Moving forward, market participants are poised to capitalize on these trends by innovating novel inhibitor formulations and expanding their product portfolios to meet evolving industry demands.
By Raw Material Analysis
Alcohol dominated 27% of the market, highlighting its significance in production processes.
In 2023, Alcohol held a dominant market position in the By Raw Material segment of the Hydrate Inhibitors Market, capturing more than a 27% share. This segment's notable performance underscores the pivotal role played by alcohol-based inhibitors in effectively mitigating hydrate formation in various industrial applications, particularly within the oil and gas sector.
Alcohol-based inhibitors, such as Methanol and Ethanol, are widely recognized for their effectiveness in disrupting hydrate crystallization by altering the interfacial tension between water and hydrocarbons. Methanol, in particular, is extensively utilized due to its favorable thermodynamic properties and compatibility with existing infrastructure, making it a preferred choice for hydrate inhibition in offshore drilling and production operations. Ethanol and other alcohol derivatives also exhibit similar inhibitory properties, contributing to their widespread adoption across diverse industries.
Furthermore, the Glycol segment emerged as a significant contributor to the Hydrate Inhibitors Market, showcasing considerable growth potential. Glycols, including Ethylene Glycol and Propylene Glycol, are valued for their ability to depress the freezing point of water, thereby preventing hydrate formation in pipelines and process equipment. These compounds offer a reliable and cost-effective solution for managing hydrate-related risks in cold climates and deepwater environments.
Ionic Salt and other raw materials also play a crucial role in hydrate inhibition, catering to niche applications and specialized requirements within the industry. As the demand for efficient hydrate management solutions continues to rise, market participants are expected to focus on innovation and product development to address evolving customer needs and enhance market competitiveness.
By Operations Analysis
Onshore operations dominated 60% of the market, indicating a strong preference for land-based activities.
In 2023, Onshore held a dominant market position in the By Operations segment of the Hydrate Inhibitors Market, capturing more than a 60% share. This segment's commanding performance underscores the widespread use of hydrate inhibitors in onshore oil and gas production facilities, where the risk of hydrate formation is significant due to varying operating conditions and geographical factors.
Onshore operations rely heavily on hydrate inhibitors to ensure uninterrupted production and maintain the integrity of pipelines and equipment. The utilization of inhibitors such as Methanol and Glycols is prevalent in these settings, where the proximity to infrastructure facilitates the deployment and replenishment of chemical treatments. Additionally, the availability of resources and infrastructure supports the implementation of preventive measures, further reinforcing the dominance of onshore operations in the Hydrate Inhibitors Market.
In contrast, the Offshore segment represents a smaller yet significant portion of the market, catering to oil and gas production activities in marine environments. Offshore operations present unique challenges related to hydrate management, including harsh weather conditions, limited space, and remote accessibility. As a result, the adoption of hydrate inhibitors in offshore installations is imperative to mitigate the risk of hydrate blockages and ensure operational safety and efficiency.
Despite facing logistical constraints, offshore operators leverage advanced hydrate inhibition technologies, such as Low-Dosage Inhibitors and innovative chemical formulations, to address hydrate-related challenges effectively. Furthermore, ongoing advancements in offshore drilling and production techniques are expected to drive the demand for hydrate inhibitors, facilitating continued market growth in the coming years.
By Application Analysis
Gas Gathering System dominated 42% of the market, underscoring its critical role in the industry.
In 2023, Gas Gathering System held a dominant market position in the By Application segment of the Hydrate Inhibitors Market, capturing more than a 42% share. This segment's significant market share highlights the critical role played by hydrate inhibitors in ensuring the efficient and safe operation of gas gathering systems, which are integral components of upstream oil and gas infrastructure.
Gas gathering systems are responsible for transporting raw natural gas from production wells to processing facilities, where it undergoes treatment and purification. These systems are susceptible to hydrate formation, especially in colder climates or high-pressure environments, posing risks to operational integrity and efficiency. As such, the implementation of effective hydrate inhibition strategies is essential to prevent blockages and maintain the uninterrupted flow of gas.
Hydrate inhibitors utilized in gas gathering systems often include Methanol, Ethylene Glycol, and other chemical compounds known for their ability to disrupt hydrate formation and prevent pipeline blockages. The dominance of this segment underscores the industry's recognition of the importance of proactive hydrate management in gas-gathering operations, driving investments in inhibitor technologies and solutions.
Additionally, the Pipeline System segment emerged as a significant contributor to the Hydrate Inhibitors Market, addressing hydrate-related challenges in transmission and distribution pipelines. Corrosion protection applications also play a vital role in safeguarding pipeline integrity, with inhibitors often integrated into corrosion protection systems to provide dual functionality.
Looking ahead, advancements in hydrate inhibition technologies and increasing emphasis on asset optimization and integrity management are expected to drive further growth in the Hydrate Inhibitors Market across various application segments, including gas gathering systems, pipeline systems, corrosion protection, and others.
Key Market Segments
By Product Type
- Thermodynamic Inhibitors (Methanol, Ethylene Glycol, and Monoethylene Glycol)
- Low-Dosage Inhibitors (Anti-Agglomerate Inhibitors, Kinetic Hydrate Inhibitors)
By Raw Material
- Alcohol
- Glycol
- Ionic Salt
- Others
By Operations
- Onshore
- Offshore
By Application
- Gas Gathering System
- Pipeline System
- Corrosion Protector
- Others
Growth Opportunity
Renewable Energy Drive Fuels Market Growth
The global Hydrate Inhibitors Market is poised for significant expansion in 2023, propelled by the burgeoning shift towards renewable energy sources and products. As governments worldwide intensify efforts to mitigate climate change, renewable energy adoption continues to accelerate, creating a favorable landscape for the market.
Hydrate inhibitors, crucial in preventing the formation of gas hydrates that can impede energy production and transportation, are in high demand across various sectors, including oil and gas, ensuring uninterrupted operations in a sustainable manner.
Investment Surge in Oil and Gas Exploration
Simultaneously, investments in oil and gas exploration, particularly in developing nations, bolster market prospects. Despite the renewable energy surge, oil and gas remain indispensable energy sources, especially in regions experiencing rapid industrialization and urbanization.
As emerging economies ramp up exploration activities to meet escalating energy demands, the need for hydrate inhibitors escalates proportionately, driving market growth.
Latest Trends
Emphasis on Enhanced Efficiency and Performance
In 2023, the global Hydrate Inhibitors Market is witnessing a pronounced trend toward improving the efficiency and performance of inhibitors across diverse applications. Market players are intensifying efforts to develop advanced formulations capable of effectively mitigating gas hydrate formation in oil and gas production, transportation management systems, and storage. This focus on optimization aims to address industry demands for higher efficacy and reliability in hydrate inhibition processes.
Rising Research and Development Endeavors
Furthermore, there is a notable uptick in research and development activities aimed at innovating new types of hydrate inhibitors. Market leaders and emerging players alike are investing resources into exploring novel chemical compositions and application techniques to enhance inhibition capabilities. This surge in R&D reflects the industry's commitment to staying ahead of evolving challenges and catering to the unique requirements of different operational environments.
Regional Analysis
In North America, the market for hydrate inhibitors is dominated by a substantial 58.4% share.
In the Hydrate Inhibitors market, North America emerges as a dominant force, commanding a substantial share of approximately 58.4%. The region's ascendancy is underpinned by robust industrial activities, particularly in the oil and gas sector, where hydrate inhibitors find extensive application in preventing the formation of gas hydrates in pipelines and subsea infrastructure. Moreover, stringent regulatory frameworks mandating the use of effective hydrate inhibition solutions further bolster market growth.
Europe constitutes another significant market segment for hydrate inhibitors. The region's demand is propelled by thriving offshore oil and gas exploration activities, particularly in the North Sea region. Additionally, the increasing adoption of natural gas as a cleaner energy source underscores the need for efficient hydrate inhibition solutions across the continent. Stringent environmental regulations and emphasis on sustainability also drive the deployment of eco-friendly hydrate inhibitors in the region.
Asia Pacific represents a burgeoning market for hydrate inhibitors, fueled by rapid industrialization and infrastructural development in emerging economies such as China and India. The region's substantial investments in energy infrastructure, including oil and gas exploration and production facilities, contribute to the escalating demand for hydrate inhibition solutions. Furthermore, the growing emphasis on renewable energy sources augments the adoption of hydrate inhibitors in offshore wind farms and liquefied natural gas (LNG) terminals across the region.
In the Middle East & Africa region, the demand for hydrate inhibitors is propelled by the flourishing oil and gas sector, particularly in countries like Saudi Arabia, the United Arab Emirates, and Nigeria. The region's vast hydrocarbon reserves and extensive exploration and production activities necessitate effective hydrate inhibition strategies to ensure uninterrupted operations. Additionally, the expansion of LNG infrastructure in the region further drives market growth, with hydrate inhibitors playing a crucial role in LNG processing and transportation facilities.
Latin America presents promising opportunities for the hydrate inhibitors market, driven by increasing investments in offshore oil and gas exploration activities, particularly in Brazil and Mexico. The region's rich hydrocarbon reserves and ongoing developments in deepwater and ultra-deepwater projects fuel the demand for hydrate inhibition solutions. Furthermore, government initiatives to attract foreign investments in the energy sector and improve infrastructure further bolster market expansion in the region.
Key Regions and Countries
North America
- The US
- Canada
- Rest of North America
Europe
- Germany
- France
- The UK
- Spain
- Netherlands
- Russia
- Italy
- Rest of Europe
Asia-Pacific
- China
- Japan
- Singapore
- Thailand
- South Korea
- Vietnam
- India
- New Zealand
- Rest of Asia Pacific
Latin America
- Mexico
- Brazil
- Rest of Latin America
Middle East & Africa
- Saudi Arabia
- South Africa
- UAE
- Rest of Middle East & Africa
Key Players Analysis
In 2023, the global Hydrate Inhibitors Market witnessed robust activity with several key players vying for prominence. Among these, prominent entities such as BASF SE, Schlumberger, Halliburton, Baker Hughes, Nalco Champion, Clariant, Lubrizol, Infineum, Dorf Ketal, and Ecolab emerged as pivotal drivers shaping the market landscape.
BASF SE, a global leader in chemical manufacturing, leveraged its extensive R&D capabilities to introduce innovative hydrate inhibitor solutions, catering to diverse industrial applications. Schlumberger, renowned for its expertise in oilfield services, continued to strengthen its foothold by offering comprehensive solutions tailored to the unique challenges faced in the extraction and transportation of hydrocarbons.
Meanwhile, Halliburton and Baker Hughes, both stalwarts in the energy sector, remained pivotal players, capitalizing on their deep industry insights and advanced technologies to deliver cutting-edge hydrate inhibition solutions.
Nalco Champion, a subsidiary of Ecolab, stood out for its holistic approach towards sustainability, integrating eco-friendly formulations into its product portfolio, thus resonating well with environmentally conscious consumers. Clariant and Lubrizol, with their strong emphasis on research and development, contributed significantly to the market's evolution by introducing next-generation hydrate inhibitors engineered to deliver superior performance and efficiency.
Infineum, Dorf Ketal, and Ecolab maintained their competitive edge through strategic collaborations and investments, bolstering their capabilities to address evolving market demands. Their proactive approach towards customization and client-centric solutions reinforced their position as preferred partners among industry stakeholders.
Market Key Players
- BASF SE
- Schlumberger
- Halliburton
- Baker Hughes
- Nalco Champion
- Clariant
- Lubrizol
- Infineum
- Dorf Ketal
- Ecolab
Recent Development
- In March 2024, Dr. Maggi Ahmed, MD, PhD, presented findings at the American Academy of Dermatology Meeting on combining melanocyte transplantation with topical JAK inhibitors or tacrolimus for vitiligo treatment, showcasing improved pigmentation outcomes and reduced CD8+ T cell numbers.
- In January 2024, The U.S. Department of Energy's Gas Hydrates R&D Program aims to develop environmentally safe methane production from Arctic and offshore hydrates through feasibility studies, research, modeling, and international collaboration.
- In December 2021, Clariant Oil Services showcased cutting-edge solutions at the 2021 SPE International Oilfield Chemicals Conference. Innovations address corrosion inhibition, hydrogen sulfide scavenging, and more, advancing sustainability in oil production.
Report Scope
Report Features Description Market Value (2023) USD 241.6 Million Forecast Revenue (2033) USD 450.5 Million CAGR (2024-2032) 6.6% Base Year for Estimation 2023 Historic Period 2016-2023 Forecast Period 2024-2033 Report Coverage Revenue Forecast, Market Dynamics, COVID-19 Impact, Competitive Landscape, Recent Developments Segments Covered By Product Type(Thermodynamic Inhibitors (Methanol, Ethylene Glycol, and Monoethylene Glycol), Low-Dosage Inhibitor (Anti-Agglomerate Inhibitors, Kinetic Hydrate Inhibitors)), By Raw Material(Alcohol, Glycol, Ionic Salt, Others), By Operations(Onshore, Offshore), By Application(Gas Gathering System, Pipeline System, Corrosion Protector, Others) Regional Analysis North America - The US, Canada, Rest of North America, Europe - Germany, France, The UK, Spain, Italy, Russia, Netherlands, Rest of Europe, Asia-Pacific - China, Japan, South Korea, India, New Zealand, Singapore, Thailand, Vietnam, Rest of Asia Pacific, Latin America - Brazil, Mexico, Rest of Latin America, Middle East & Africa - South Africa, Saudi Arabia, UAE, Rest of Middle East & Africa Competitive Landscape BASF SE, Schlumberger, Halliburton, Baker Hughes, Nalco Champion, Clariant, Lubrizol, Infineum, Dorf Ketal, Ecolab Customization Scope Customization for segments, region/country-level will be provided. Moreover, additional customization can be done based on the requirements. Purchase Options We have three licenses to opt for Single User License, Multi-User License (Up to 5 Users), Corporate Use License (Unlimited User and Printable PDF) -
- 1. Executive Summary
- 1.1. Definition
- 1.2. Taxonomy
- 1.3. Research Scope
- 1.4. Key Analysis
- 1.5. Key Findings by Major Segments
- 1.6. Top strategies by Major Players
- 2. Global Hydrate Inhibitors Market Overview
- 2.1. Hydrate Inhibitors Market Dynamics
- 2.1.1. Drivers
- 2.1.2. Opportunities
- 2.1.3. Restraints
- 2.1.4. Challenges
- 2.2. Macro-economic Factors
- 2.3. Regulatory Framework
- 2.4. Market Investment Feasibility Index
- 2.5. PEST Analysis
- 2.6. PORTER’S Five Force Analysis
- 2.7. Drivers & Restraints Impact Analysis
- 2.8. Industry Chain Analysis
- 2.9. Cost Structure Analysis
- 2.10. Marketing Strategy
- 2.11. Russia-Ukraine War Impact Analysis
- 2.12. Opportunity Map Analysis
- 2.13. Market Competition Scenario Analysis
- 2.14. Product Life Cycle Analysis
- 2.15. Opportunity Orbits
- 2.16. Manufacturer Intensity Map
- 2.17. Major Companies sales by Value & Volume
- 2.1. Hydrate Inhibitors Market Dynamics
- 3. Global Hydrate Inhibitors Market Analysis, Opportunity and Forecast, 2016-2032
- 3.1. Global Hydrate Inhibitors Market Analysis, 2016-2021
- 3.2. Global Hydrate Inhibitors Market Opportunity and Forecast, 2023-2032
- 3.3. Global Hydrate Inhibitors Market Analysis, Opportunity and Forecast, By By Product Type, 2016-2032
- 3.3.1. Global Hydrate Inhibitors Market Analysis by By Product Type: Introduction
- 3.3.2. Market Size Absolute $ Opportunity Analysis and Forecast, By By Product Type, 2016-2032
- 3.3.3. Thermodynamic Inhibitors (Methanol, Ethylene Glycol, and Monoethylene Glycol)
- 3.3.4. Low-Dosage Inhibitor (Anti-Agglomerate Inhibitors, Kinetic Hydrate Inhibitors)
- 3.4. Global Hydrate Inhibitors Market Analysis, Opportunity and Forecast, By By Raw Material, 2016-2032
- 3.4.1. Global Hydrate Inhibitors Market Analysis by By Raw Material: Introduction
- 3.4.2. Market Size Absolute $ Opportunity Analysis and Forecast, By By Raw Material, 2016-2032
- 3.4.3. Alcohol
- 3.4.4. Glycol
- 3.4.5. Ionic Salt
- 3.4.6. Others
- 3.5. Global Hydrate Inhibitors Market Analysis, Opportunity and Forecast, By By Operations , 2016-2032
- 3.5.1. Global Hydrate Inhibitors Market Analysis by By Operations : Introduction
- 3.5.2. Market Size Absolute $ Opportunity Analysis and Forecast, By By Operations , 2016-2032
- 3.5.3. Onshore
- 3.5.4. Offshore
- 3.6. Global Hydrate Inhibitors Market Analysis, Opportunity and Forecast, By By Application , 2016-2032
- 3.6.1. Global Hydrate Inhibitors Market Analysis by By Application : Introduction
- 3.6.2. Market Size Absolute $ Opportunity Analysis and Forecast, By By Application , 2016-2032
- 3.6.3. Gas Gathering System
- 3.6.4. Pipeline System
- 3.6.5. Corrosion Protector
- 3.6.6. Others
- 4. North America Hydrate Inhibitors Market Analysis, Opportunity and Forecast, 2016-2032
- 4.1. North America Hydrate Inhibitors Market Analysis, 2016-2021
- 4.2. North America Hydrate Inhibitors Market Opportunity and Forecast, 2023-2032
- 4.3. North America Hydrate Inhibitors Market Analysis, Opportunity and Forecast, By By Product Type, 2016-2032
- 4.3.1. North America Hydrate Inhibitors Market Analysis by By Product Type: Introduction
- 4.3.2. Market Size Absolute $ Opportunity Analysis and Forecast, By By Product Type, 2016-2032
- 4.3.3. Thermodynamic Inhibitors (Methanol, Ethylene Glycol, and Monoethylene Glycol)
- 4.3.4. Low-Dosage Inhibitor (Anti-Agglomerate Inhibitors, Kinetic Hydrate Inhibitors)
- 4.4. North America Hydrate Inhibitors Market Analysis, Opportunity and Forecast, By By Raw Material, 2016-2032
- 4.4.1. North America Hydrate Inhibitors Market Analysis by By Raw Material: Introduction
- 4.4.2. Market Size Absolute $ Opportunity Analysis and Forecast, By By Raw Material, 2016-2032
- 4.4.3. Alcohol
- 4.4.4. Glycol
- 4.4.5. Ionic Salt
- 4.4.6. Others
- 4.5. North America Hydrate Inhibitors Market Analysis, Opportunity and Forecast, By By Operations , 2016-2032
- 4.5.1. North America Hydrate Inhibitors Market Analysis by By Operations : Introduction
- 4.5.2. Market Size Absolute $ Opportunity Analysis and Forecast, By By Operations , 2016-2032
- 4.5.3. Onshore
- 4.5.4. Offshore
- 4.6. North America Hydrate Inhibitors Market Analysis, Opportunity and Forecast, By By Application , 2016-2032
- 4.6.1. North America Hydrate Inhibitors Market Analysis by By Application : Introduction
- 4.6.2. Market Size Absolute $ Opportunity Analysis and Forecast, By By Application , 2016-2032
- 4.6.3. Gas Gathering System
- 4.6.4. Pipeline System
- 4.6.5. Corrosion Protector
- 4.6.6. Others
- 4.7. North America Hydrate Inhibitors Market Analysis, Opportunity and Forecast, By Country , 2016-2032
- 4.7.1. North America Hydrate Inhibitors Market Analysis by Country : Introduction
- 4.7.2. Market Size Absolute $ Opportunity Analysis and Forecast, Country , 2016-2032
- 4.7.2.1. The US
- 4.7.2.2. Canada
- 4.7.2.3. Mexico
- 5. Western Europe Hydrate Inhibitors Market Analysis, Opportunity and Forecast, 2016-2032
- 5.1. Western Europe Hydrate Inhibitors Market Analysis, 2016-2021
- 5.2. Western Europe Hydrate Inhibitors Market Opportunity and Forecast, 2023-2032
- 5.3. Western Europe Hydrate Inhibitors Market Analysis, Opportunity and Forecast, By By Product Type, 2016-2032
- 5.3.1. Western Europe Hydrate Inhibitors Market Analysis by By Product Type: Introduction
- 5.3.2. Market Size Absolute $ Opportunity Analysis and Forecast, By By Product Type, 2016-2032
- 5.3.3. Thermodynamic Inhibitors (Methanol, Ethylene Glycol, and Monoethylene Glycol)
- 5.3.4. Low-Dosage Inhibitor (Anti-Agglomerate Inhibitors, Kinetic Hydrate Inhibitors)
- 5.4. Western Europe Hydrate Inhibitors Market Analysis, Opportunity and Forecast, By By Raw Material, 2016-2032
- 5.4.1. Western Europe Hydrate Inhibitors Market Analysis by By Raw Material: Introduction
- 5.4.2. Market Size Absolute $ Opportunity Analysis and Forecast, By By Raw Material, 2016-2032
- 5.4.3. Alcohol
- 5.4.4. Glycol
- 5.4.5. Ionic Salt
- 5.4.6. Others
- 5.5. Western Europe Hydrate Inhibitors Market Analysis, Opportunity and Forecast, By By Operations , 2016-2032
- 5.5.1. Western Europe Hydrate Inhibitors Market Analysis by By Operations : Introduction
- 5.5.2. Market Size Absolute $ Opportunity Analysis and Forecast, By By Operations , 2016-2032
- 5.5.3. Onshore
- 5.5.4. Offshore
- 5.6. Western Europe Hydrate Inhibitors Market Analysis, Opportunity and Forecast, By By Application , 2016-2032
- 5.6.1. Western Europe Hydrate Inhibitors Market Analysis by By Application : Introduction
- 5.6.2. Market Size Absolute $ Opportunity Analysis and Forecast, By By Application , 2016-2032
- 5.6.3. Gas Gathering System
- 5.6.4. Pipeline System
- 5.6.5. Corrosion Protector
- 5.6.6. Others
- 5.7. Western Europe Hydrate Inhibitors Market Analysis, Opportunity and Forecast, By Country , 2016-2032
- 5.7.1. Western Europe Hydrate Inhibitors Market Analysis by Country : Introduction
- 5.7.2. Market Size Absolute $ Opportunity Analysis and Forecast, Country , 2016-2032
- 5.7.2.1. Germany
- 5.7.2.2. France
- 5.7.2.3. The UK
- 5.7.2.4. Spain
- 5.7.2.5. Italy
- 5.7.2.6. Portugal
- 5.7.2.7. Ireland
- 5.7.2.8. Austria
- 5.7.2.9. Switzerland
- 5.7.2.10. Benelux
- 5.7.2.11. Nordic
- 5.7.2.12. Rest of Western Europe
- 6. Eastern Europe Hydrate Inhibitors Market Analysis, Opportunity and Forecast, 2016-2032
- 6.1. Eastern Europe Hydrate Inhibitors Market Analysis, 2016-2021
- 6.2. Eastern Europe Hydrate Inhibitors Market Opportunity and Forecast, 2023-2032
- 6.3. Eastern Europe Hydrate Inhibitors Market Analysis, Opportunity and Forecast, By By Product Type, 2016-2032
- 6.3.1. Eastern Europe Hydrate Inhibitors Market Analysis by By Product Type: Introduction
- 6.3.2. Market Size Absolute $ Opportunity Analysis and Forecast, By By Product Type, 2016-2032
- 6.3.3. Thermodynamic Inhibitors (Methanol, Ethylene Glycol, and Monoethylene Glycol)
- 6.3.4. Low-Dosage Inhibitor (Anti-Agglomerate Inhibitors, Kinetic Hydrate Inhibitors)
- 6.4. Eastern Europe Hydrate Inhibitors Market Analysis, Opportunity and Forecast, By By Raw Material, 2016-2032
- 6.4.1. Eastern Europe Hydrate Inhibitors Market Analysis by By Raw Material: Introduction
- 6.4.2. Market Size Absolute $ Opportunity Analysis and Forecast, By By Raw Material, 2016-2032
- 6.4.3. Alcohol
- 6.4.4. Glycol
- 6.4.5. Ionic Salt
- 6.4.6. Others
- 6.5. Eastern Europe Hydrate Inhibitors Market Analysis, Opportunity and Forecast, By By Operations , 2016-2032
- 6.5.1. Eastern Europe Hydrate Inhibitors Market Analysis by By Operations : Introduction
- 6.5.2. Market Size Absolute $ Opportunity Analysis and Forecast, By By Operations , 2016-2032
- 6.5.3. Onshore
- 6.5.4. Offshore
- 6.6. Eastern Europe Hydrate Inhibitors Market Analysis, Opportunity and Forecast, By By Application , 2016-2032
- 6.6.1. Eastern Europe Hydrate Inhibitors Market Analysis by By Application : Introduction
- 6.6.2. Market Size Absolute $ Opportunity Analysis and Forecast, By By Application , 2016-2032
- 6.6.3. Gas Gathering System
- 6.6.4. Pipeline System
- 6.6.5. Corrosion Protector
- 6.6.6. Others
- 6.7. Eastern Europe Hydrate Inhibitors Market Analysis, Opportunity and Forecast, By Country , 2016-2032
- 6.7.1. Eastern Europe Hydrate Inhibitors Market Analysis by Country : Introduction
- 6.7.2. Market Size Absolute $ Opportunity Analysis and Forecast, Country , 2016-2032
- 6.7.2.1. Russia
- 6.7.2.2. Poland
- 6.7.2.3. The Czech Republic
- 6.7.2.4. Greece
- 6.7.2.5. Rest of Eastern Europe
- 7. APAC Hydrate Inhibitors Market Analysis, Opportunity and Forecast, 2016-2032
- 7.1. APAC Hydrate Inhibitors Market Analysis, 2016-2021
- 7.2. APAC Hydrate Inhibitors Market Opportunity and Forecast, 2023-2032
- 7.3. APAC Hydrate Inhibitors Market Analysis, Opportunity and Forecast, By By Product Type, 2016-2032
- 7.3.1. APAC Hydrate Inhibitors Market Analysis by By Product Type: Introduction
- 7.3.2. Market Size Absolute $ Opportunity Analysis and Forecast, By By Product Type, 2016-2032
- 7.3.3. Thermodynamic Inhibitors (Methanol, Ethylene Glycol, and Monoethylene Glycol)
- 7.3.4. Low-Dosage Inhibitor (Anti-Agglomerate Inhibitors, Kinetic Hydrate Inhibitors)
- 7.4. APAC Hydrate Inhibitors Market Analysis, Opportunity and Forecast, By By Raw Material, 2016-2032
- 7.4.1. APAC Hydrate Inhibitors Market Analysis by By Raw Material: Introduction
- 7.4.2. Market Size Absolute $ Opportunity Analysis and Forecast, By By Raw Material, 2016-2032
- 7.4.3. Alcohol
- 7.4.4. Glycol
- 7.4.5. Ionic Salt
- 7.4.6. Others
- 7.5. APAC Hydrate Inhibitors Market Analysis, Opportunity and Forecast, By By Operations , 2016-2032
- 7.5.1. APAC Hydrate Inhibitors Market Analysis by By Operations : Introduction
- 7.5.2. Market Size Absolute $ Opportunity Analysis and Forecast, By By Operations , 2016-2032
- 7.5.3. Onshore
- 7.5.4. Offshore
- 7.6. APAC Hydrate Inhibitors Market Analysis, Opportunity and Forecast, By By Application , 2016-2032
- 7.6.1. APAC Hydrate Inhibitors Market Analysis by By Application : Introduction
- 7.6.2. Market Size Absolute $ Opportunity Analysis and Forecast, By By Application , 2016-2032
- 7.6.3. Gas Gathering System
- 7.6.4. Pipeline System
- 7.6.5. Corrosion Protector
- 7.6.6. Others
- 7.7. APAC Hydrate Inhibitors Market Analysis, Opportunity and Forecast, By Country , 2016-2032
- 7.7.1. APAC Hydrate Inhibitors Market Analysis by Country : Introduction
- 7.7.2. Market Size Absolute $ Opportunity Analysis and Forecast, Country , 2016-2032
- 7.7.2.1. China
- 7.7.2.2. Japan
- 7.7.2.3. South Korea
- 7.7.2.4. India
- 7.7.2.5. Australia & New Zeland
- 7.7.2.6. Indonesia
- 7.7.2.7. Malaysia
- 7.7.2.8. Philippines
- 7.7.2.9. Singapore
- 7.7.2.10. Thailand
- 7.7.2.11. Vietnam
- 7.7.2.12. Rest of APAC
- 8. Latin America Hydrate Inhibitors Market Analysis, Opportunity and Forecast, 2016-2032
- 8.1. Latin America Hydrate Inhibitors Market Analysis, 2016-2021
- 8.2. Latin America Hydrate Inhibitors Market Opportunity and Forecast, 2023-2032
- 8.3. Latin America Hydrate Inhibitors Market Analysis, Opportunity and Forecast, By By Product Type, 2016-2032
- 8.3.1. Latin America Hydrate Inhibitors Market Analysis by By Product Type: Introduction
- 8.3.2. Market Size Absolute $ Opportunity Analysis and Forecast, By By Product Type, 2016-2032
- 8.3.3. Thermodynamic Inhibitors (Methanol, Ethylene Glycol, and Monoethylene Glycol)
- 8.3.4. Low-Dosage Inhibitor (Anti-Agglomerate Inhibitors, Kinetic Hydrate Inhibitors)
- 8.4. Latin America Hydrate Inhibitors Market Analysis, Opportunity and Forecast, By By Raw Material, 2016-2032
- 8.4.1. Latin America Hydrate Inhibitors Market Analysis by By Raw Material: Introduction
- 8.4.2. Market Size Absolute $ Opportunity Analysis and Forecast, By By Raw Material, 2016-2032
- 8.4.3. Alcohol
- 8.4.4. Glycol
- 8.4.5. Ionic Salt
- 8.4.6. Others
- 8.5. Latin America Hydrate Inhibitors Market Analysis, Opportunity and Forecast, By By Operations , 2016-2032
- 8.5.1. Latin America Hydrate Inhibitors Market Analysis by By Operations : Introduction
- 8.5.2. Market Size Absolute $ Opportunity Analysis and Forecast, By By Operations , 2016-2032
- 8.5.3. Onshore
- 8.5.4. Offshore
- 8.6. Latin America Hydrate Inhibitors Market Analysis, Opportunity and Forecast, By By Application , 2016-2032
- 8.6.1. Latin America Hydrate Inhibitors Market Analysis by By Application : Introduction
- 8.6.2. Market Size Absolute $ Opportunity Analysis and Forecast, By By Application , 2016-2032
- 8.6.3. Gas Gathering System
- 8.6.4. Pipeline System
- 8.6.5. Corrosion Protector
- 8.6.6. Others
- 8.7. Latin America Hydrate Inhibitors Market Analysis, Opportunity and Forecast, By Country , 2016-2032
- 8.7.1. Latin America Hydrate Inhibitors Market Analysis by Country : Introduction
- 8.7.2. Market Size Absolute $ Opportunity Analysis and Forecast, Country , 2016-2032
- 8.7.2.1. Brazil
- 8.7.2.2. Colombia
- 8.7.2.3. Chile
- 8.7.2.4. Argentina
- 8.7.2.5. Costa Rica
- 8.7.2.6. Rest of Latin America
- 9. Middle East & Africa Hydrate Inhibitors Market Analysis, Opportunity and Forecast, 2016-2032
- 9.1. Middle East & Africa Hydrate Inhibitors Market Analysis, 2016-2021
- 9.2. Middle East & Africa Hydrate Inhibitors Market Opportunity and Forecast, 2023-2032
- 9.3. Middle East & Africa Hydrate Inhibitors Market Analysis, Opportunity and Forecast, By By Product Type, 2016-2032
- 9.3.1. Middle East & Africa Hydrate Inhibitors Market Analysis by By Product Type: Introduction
- 9.3.2. Market Size Absolute $ Opportunity Analysis and Forecast, By By Product Type, 2016-2032
- 9.3.3. Thermodynamic Inhibitors (Methanol, Ethylene Glycol, and Monoethylene Glycol)
- 9.3.4. Low-Dosage Inhibitor (Anti-Agglomerate Inhibitors, Kinetic Hydrate Inhibitors)
- 9.4. Middle East & Africa Hydrate Inhibitors Market Analysis, Opportunity and Forecast, By By Raw Material, 2016-2032
- 9.4.1. Middle East & Africa Hydrate Inhibitors Market Analysis by By Raw Material: Introduction
- 9.4.2. Market Size Absolute $ Opportunity Analysis and Forecast, By By Raw Material, 2016-2032
- 9.4.3. Alcohol
- 9.4.4. Glycol
- 9.4.5. Ionic Salt
- 9.4.6. Others
- 9.5. Middle East & Africa Hydrate Inhibitors Market Analysis, Opportunity and Forecast, By By Operations , 2016-2032
- 9.5.1. Middle East & Africa Hydrate Inhibitors Market Analysis by By Operations : Introduction
- 9.5.2. Market Size Absolute $ Opportunity Analysis and Forecast, By By Operations , 2016-2032
- 9.5.3. Onshore
- 9.5.4. Offshore
- 9.6. Middle East & Africa Hydrate Inhibitors Market Analysis, Opportunity and Forecast, By By Application , 2016-2032
- 9.6.1. Middle East & Africa Hydrate Inhibitors Market Analysis by By Application : Introduction
- 9.6.2. Market Size Absolute $ Opportunity Analysis and Forecast, By By Application , 2016-2032
- 9.6.3. Gas Gathering System
- 9.6.4. Pipeline System
- 9.6.5. Corrosion Protector
- 9.6.6. Others
- 9.7. Middle East & Africa Hydrate Inhibitors Market Analysis, Opportunity and Forecast, By Country , 2016-2032
- 9.7.1. Middle East & Africa Hydrate Inhibitors Market Analysis by Country : Introduction
- 9.7.2. Market Size Absolute $ Opportunity Analysis and Forecast, Country , 2016-2032
- 9.7.2.1. Algeria
- 9.7.2.2. Egypt
- 9.7.2.3. Israel
- 9.7.2.4. Kuwait
- 9.7.2.5. Nigeria
- 9.7.2.6. Saudi Arabia
- 9.7.2.7. South Africa
- 9.7.2.8. Turkey
- 9.7.2.9. The UAE
- 9.7.2.10. Rest of MEA
- 10. Global Hydrate Inhibitors Market Analysis, Opportunity and Forecast, By Region , 2016-2032
- 10.1. Global Hydrate Inhibitors Market Analysis by Region : Introduction
- 10.2. Market Size Absolute $ Opportunity Analysis and Forecast, By Region , 2016-2032
- 10.2.1. North America
- 10.2.2. Western Europe
- 10.2.3. Eastern Europe
- 10.2.4. APAC
- 10.2.5. Latin America
- 10.2.6. Middle East & Africa
- 11. Global Hydrate Inhibitors Market Competitive Landscape, Market Share Analysis, and Company Profiles
- 11.1. Market Share Analysis
- 11.2. Company Profiles
- 11.3. BASF SE
- 11.3.1. Company Overview
- 11.3.2. Financial Highlights
- 11.3.3. Product Portfolio
- 11.3.4. SWOT Analysis
- 11.3.5. Key Strategies and Developments
- 11.4. Schlumberger
- 11.4.1. Company Overview
- 11.4.2. Financial Highlights
- 11.4.3. Product Portfolio
- 11.4.4. SWOT Analysis
- 11.4.5. Key Strategies and Developments
- 11.5. Halliburton
- 11.5.1. Company Overview
- 11.5.2. Financial Highlights
- 11.5.3. Product Portfolio
- 11.5.4. SWOT Analysis
- 11.5.5. Key Strategies and Developments
- 11.6. Baker Hughes
- 11.6.1. Company Overview
- 11.6.2. Financial Highlights
- 11.6.3. Product Portfolio
- 11.6.4. SWOT Analysis
- 11.6.5. Key Strategies and Developments
- 11.7. Nalco Champion
- 11.7.1. Company Overview
- 11.7.2. Financial Highlights
- 11.7.3. Product Portfolio
- 11.7.4. SWOT Analysis
- 11.7.5. Key Strategies and Developments
- 11.8. Clariant
- 11.8.1. Company Overview
- 11.8.2. Financial Highlights
- 11.8.3. Product Portfolio
- 11.8.4. SWOT Analysis
- 11.8.5. Key Strategies and Developments
- 11.9. Lubrizol
- 11.9.1. Company Overview
- 11.9.2. Financial Highlights
- 11.9.3. Product Portfolio
- 11.9.4. SWOT Analysis
- 11.9.5. Key Strategies and Developments
- 11.10. Infineum
- 11.10.1. Company Overview
- 11.10.2. Financial Highlights
- 11.10.3. Product Portfolio
- 11.10.4. SWOT Analysis
- 11.10.5. Key Strategies and Developments
- 11.11. Dorf Ketal
- 11.11.1. Company Overview
- 11.11.2. Financial Highlights
- 11.11.3. Product Portfolio
- 11.11.4. SWOT Analysis
- 11.11.5. Key Strategies and Developments
- 11.12. Ecolab
- 11.12.1. Company Overview
- 11.12.2. Financial Highlights
- 11.12.3. Product Portfolio
- 11.12.4. SWOT Analysis
- 11.12.5. Key Strategies and Developments
- 11.13.1. Company Overview
- 11.13.2. Financial Highlights
- 11.13.3. Product Portfolio
- 11.13.4. SWOT Analysis
- 11.13.5. Key Strategies and Developments
- 12. Assumptions and Acronyms
- 13. Research Methodology
- 14. Contact
"
- List of Figures
- "
- Figure 1: Global Hydrate Inhibitors Market Revenue (US$ Mn) Market Share by By Product Type in 2022
- Figure 2: Global Hydrate Inhibitors Market Market Attractiveness Analysis by By Product Type, 2016-2032
- Figure 3: Global Hydrate Inhibitors Market Revenue (US$ Mn) Market Share by By Raw Materialin 2022
- Figure 4: Global Hydrate Inhibitors Market Market Attractiveness Analysis by By Raw Material, 2016-2032
- Figure 5: Global Hydrate Inhibitors Market Revenue (US$ Mn) Market Share by By Operations in 2022
- Figure 6: Global Hydrate Inhibitors Market Market Attractiveness Analysis by By Operations , 2016-2032
- Figure 7: Global Hydrate Inhibitors Market Revenue (US$ Mn) Market Share by By Application in 2022
- Figure 8: Global Hydrate Inhibitors Market Market Attractiveness Analysis by By Application , 2016-2032
- Figure 9: Global Hydrate Inhibitors Market Revenue (US$ Mn) Market Share by Region in 2022
- Figure 10: Global Hydrate Inhibitors Market Market Attractiveness Analysis by Region, 2016-2032
- Figure 11: Global Hydrate Inhibitors Market Market Revenue (US$ Mn) (2016-2032)
- Figure 12: Global Hydrate Inhibitors Market Market Revenue (US$ Mn) Comparison by Region (2016-2032)
- Figure 13: Global Hydrate Inhibitors Market Market Revenue (US$ Mn) Comparison by By Product Type (2016-2032)
- Figure 14: Global Hydrate Inhibitors Market Market Revenue (US$ Mn) Comparison by By Raw Material (2016-2032)
- Figure 15: Global Hydrate Inhibitors Market Market Revenue (US$ Mn) Comparison by By Operations (2016-2032)
- Figure 16: Global Hydrate Inhibitors Market Market Revenue (US$ Mn) Comparison by By Application (2016-2032)
- Figure 17: Global Hydrate Inhibitors Market Market Y-o-Y Growth Rate Comparison by Region (2016-2032)
- Figure 18: Global Hydrate Inhibitors Market Market Y-o-Y Growth Rate Comparison by By Product Type (2016-2032)
- Figure 19: Global Hydrate Inhibitors Market Market Y-o-Y Growth Rate Comparison by By Raw Material (2016-2032)
- Figure 20: Global Hydrate Inhibitors Market Market Y-o-Y Growth Rate Comparison by By Operations (2016-2032)
- Figure 21: Global Hydrate Inhibitors Market Market Y-o-Y Growth Rate Comparison by By Application (2016-2032)
- Figure 22: Global Hydrate Inhibitors Market Market Share Comparison by Region (2016-2032)
- Figure 23: Global Hydrate Inhibitors Market Market Share Comparison by By Product Type (2016-2032)
- Figure 24: Global Hydrate Inhibitors Market Market Share Comparison by By Raw Material (2016-2032)
- Figure 25: Global Hydrate Inhibitors Market Market Share Comparison by By Operations (2016-2032)
- Figure 26: Global Hydrate Inhibitors Market Market Share Comparison by By Application (2016-2032)
- Figure 27: North America Hydrate Inhibitors Market Revenue (US$ Mn) Market Share by By Product Typein 2022
- Figure 28: North America Hydrate Inhibitors Market Market Attractiveness Analysis by By Product Type, 2016-2032
- Figure 29: North America Hydrate Inhibitors Market Revenue (US$ Mn) Market Share by By Raw Materialin 2022
- Figure 30: North America Hydrate Inhibitors Market Market Attractiveness Analysis by By Raw Material, 2016-2032
- Figure 31: North America Hydrate Inhibitors Market Revenue (US$ Mn) Market Share by By Operations in 2022
- Figure 32: North America Hydrate Inhibitors Market Market Attractiveness Analysis by By Operations , 2016-2032
- Figure 33: North America Hydrate Inhibitors Market Revenue (US$ Mn) Market Share by By Application in 2022
- Figure 34: North America Hydrate Inhibitors Market Market Attractiveness Analysis by By Application , 2016-2032
- Figure 35: North America Hydrate Inhibitors Market Revenue (US$ Mn) Market Share by Country in 2022
- Figure 36: North America Hydrate Inhibitors Market Market Attractiveness Analysis by Country, 2016-2032
- Figure 37: North America Hydrate Inhibitors Market Market Revenue (US$ Mn) (2016-2032)
- Figure 38: North America Hydrate Inhibitors Market Market Revenue (US$ Mn) Comparison by Country (2016-2032)
- Figure 39: North America Hydrate Inhibitors Market Market Revenue (US$ Mn) Comparison by By Product Type (2016-2032)
- Figure 40: North America Hydrate Inhibitors Market Market Revenue (US$ Mn) Comparison by By Raw Material (2016-2032)
- Figure 41: North America Hydrate Inhibitors Market Market Revenue (US$ Mn) Comparison by By Operations (2016-2032)
- Figure 42: North America Hydrate Inhibitors Market Market Revenue (US$ Mn) Comparison by By Application (2016-2032)
- Figure 43: North America Hydrate Inhibitors Market Market Y-o-Y Growth Rate Comparison by Country (2016-2032)
- Figure 44: North America Hydrate Inhibitors Market Market Y-o-Y Growth Rate Comparison by By Product Type (2016-2032)
- Figure 45: North America Hydrate Inhibitors Market Market Y-o-Y Growth Rate Comparison by By Raw Material (2016-2032)
- Figure 46: North America Hydrate Inhibitors Market Market Y-o-Y Growth Rate Comparison by By Operations (2016-2032)
- Figure 47: North America Hydrate Inhibitors Market Market Y-o-Y Growth Rate Comparison by By Application (2016-2032)
- Figure 48: North America Hydrate Inhibitors Market Market Share Comparison by Country (2016-2032)
- Figure 49: North America Hydrate Inhibitors Market Market Share Comparison by By Product Type (2016-2032)
- Figure 50: North America Hydrate Inhibitors Market Market Share Comparison by By Raw Material (2016-2032)
- Figure 51: North America Hydrate Inhibitors Market Market Share Comparison by By Operations (2016-2032)
- Figure 52: North America Hydrate Inhibitors Market Market Share Comparison by By Application (2016-2032)
- Figure 53: Western Europe Hydrate Inhibitors Market Revenue (US$ Mn) Market Share by By Product Typein 2022
- Figure 54: Western Europe Hydrate Inhibitors Market Market Attractiveness Analysis by By Product Type, 2016-2032
- Figure 55: Western Europe Hydrate Inhibitors Market Revenue (US$ Mn) Market Share by By Raw Materialin 2022
- Figure 56: Western Europe Hydrate Inhibitors Market Market Attractiveness Analysis by By Raw Material, 2016-2032
- Figure 57: Western Europe Hydrate Inhibitors Market Revenue (US$ Mn) Market Share by By Operations in 2022
- Figure 58: Western Europe Hydrate Inhibitors Market Market Attractiveness Analysis by By Operations , 2016-2032
- Figure 59: Western Europe Hydrate Inhibitors Market Revenue (US$ Mn) Market Share by By Application in 2022
- Figure 60: Western Europe Hydrate Inhibitors Market Market Attractiveness Analysis by By Application , 2016-2032
- Figure 61: Western Europe Hydrate Inhibitors Market Revenue (US$ Mn) Market Share by Country in 2022
- Figure 62: Western Europe Hydrate Inhibitors Market Market Attractiveness Analysis by Country, 2016-2032
- Figure 63: Western Europe Hydrate Inhibitors Market Market Revenue (US$ Mn) (2016-2032)
- Figure 64: Western Europe Hydrate Inhibitors Market Market Revenue (US$ Mn) Comparison by Country (2016-2032)
- Figure 65: Western Europe Hydrate Inhibitors Market Market Revenue (US$ Mn) Comparison by By Product Type (2016-2032)
- Figure 66: Western Europe Hydrate Inhibitors Market Market Revenue (US$ Mn) Comparison by By Raw Material (2016-2032)
- Figure 67: Western Europe Hydrate Inhibitors Market Market Revenue (US$ Mn) Comparison by By Operations (2016-2032)
- Figure 68: Western Europe Hydrate Inhibitors Market Market Revenue (US$ Mn) Comparison by By Application (2016-2032)
- Figure 69: Western Europe Hydrate Inhibitors Market Market Y-o-Y Growth Rate Comparison by Country (2016-2032)
- Figure 70: Western Europe Hydrate Inhibitors Market Market Y-o-Y Growth Rate Comparison by By Product Type (2016-2032)
- Figure 71: Western Europe Hydrate Inhibitors Market Market Y-o-Y Growth Rate Comparison by By Raw Material (2016-2032)
- Figure 72: Western Europe Hydrate Inhibitors Market Market Y-o-Y Growth Rate Comparison by By Operations (2016-2032)
- Figure 73: Western Europe Hydrate Inhibitors Market Market Y-o-Y Growth Rate Comparison by By Application (2016-2032)
- Figure 74: Western Europe Hydrate Inhibitors Market Market Share Comparison by Country (2016-2032)
- Figure 75: Western Europe Hydrate Inhibitors Market Market Share Comparison by By Product Type (2016-2032)
- Figure 76: Western Europe Hydrate Inhibitors Market Market Share Comparison by By Raw Material (2016-2032)
- Figure 77: Western Europe Hydrate Inhibitors Market Market Share Comparison by By Operations (2016-2032)
- Figure 78: Western Europe Hydrate Inhibitors Market Market Share Comparison by By Application (2016-2032)
- Figure 79: Eastern Europe Hydrate Inhibitors Market Revenue (US$ Mn) Market Share by By Product Typein 2022
- Figure 80: Eastern Europe Hydrate Inhibitors Market Market Attractiveness Analysis by By Product Type, 2016-2032
- Figure 81: Eastern Europe Hydrate Inhibitors Market Revenue (US$ Mn) Market Share by By Raw Materialin 2022
- Figure 82: Eastern Europe Hydrate Inhibitors Market Market Attractiveness Analysis by By Raw Material, 2016-2032
- Figure 83: Eastern Europe Hydrate Inhibitors Market Revenue (US$ Mn) Market Share by By Operations in 2022
- Figure 84: Eastern Europe Hydrate Inhibitors Market Market Attractiveness Analysis by By Operations , 2016-2032
- Figure 85: Eastern Europe Hydrate Inhibitors Market Revenue (US$ Mn) Market Share by By Application in 2022
- Figure 86: Eastern Europe Hydrate Inhibitors Market Market Attractiveness Analysis by By Application , 2016-2032
- Figure 87: Eastern Europe Hydrate Inhibitors Market Revenue (US$ Mn) Market Share by Country in 2022
- Figure 88: Eastern Europe Hydrate Inhibitors Market Market Attractiveness Analysis by Country, 2016-2032
- Figure 89: Eastern Europe Hydrate Inhibitors Market Market Revenue (US$ Mn) (2016-2032)
- Figure 90: Eastern Europe Hydrate Inhibitors Market Market Revenue (US$ Mn) Comparison by Country (2016-2032)
- Figure 91: Eastern Europe Hydrate Inhibitors Market Market Revenue (US$ Mn) Comparison by By Product Type (2016-2032)
- Figure 92: Eastern Europe Hydrate Inhibitors Market Market Revenue (US$ Mn) Comparison by By Raw Material (2016-2032)
- Figure 93: Eastern Europe Hydrate Inhibitors Market Market Revenue (US$ Mn) Comparison by By Operations (2016-2032)
- Figure 94: Eastern Europe Hydrate Inhibitors Market Market Revenue (US$ Mn) Comparison by By Application (2016-2032)
- Figure 95: Eastern Europe Hydrate Inhibitors Market Market Y-o-Y Growth Rate Comparison by Country (2016-2032)
- Figure 96: Eastern Europe Hydrate Inhibitors Market Market Y-o-Y Growth Rate Comparison by By Product Type (2016-2032)
- Figure 97: Eastern Europe Hydrate Inhibitors Market Market Y-o-Y Growth Rate Comparison by By Raw Material (2016-2032)
- Figure 98: Eastern Europe Hydrate Inhibitors Market Market Y-o-Y Growth Rate Comparison by By Operations (2016-2032)
- Figure 99: Eastern Europe Hydrate Inhibitors Market Market Y-o-Y Growth Rate Comparison by By Application (2016-2032)
- Figure 100: Eastern Europe Hydrate Inhibitors Market Market Share Comparison by Country (2016-2032)
- Figure 101: Eastern Europe Hydrate Inhibitors Market Market Share Comparison by By Product Type (2016-2032)
- Figure 102: Eastern Europe Hydrate Inhibitors Market Market Share Comparison by By Raw Material (2016-2032)
- Figure 103: Eastern Europe Hydrate Inhibitors Market Market Share Comparison by By Operations (2016-2032)
- Figure 104: Eastern Europe Hydrate Inhibitors Market Market Share Comparison by By Application (2016-2032)
- Figure 105: APAC Hydrate Inhibitors Market Revenue (US$ Mn) Market Share by By Product Typein 2022
- Figure 106: APAC Hydrate Inhibitors Market Market Attractiveness Analysis by By Product Type, 2016-2032
- Figure 107: APAC Hydrate Inhibitors Market Revenue (US$ Mn) Market Share by By Raw Materialin 2022
- Figure 108: APAC Hydrate Inhibitors Market Market Attractiveness Analysis by By Raw Material, 2016-2032
- Figure 109: APAC Hydrate Inhibitors Market Revenue (US$ Mn) Market Share by By Operations in 2022
- Figure 110: APAC Hydrate Inhibitors Market Market Attractiveness Analysis by By Operations , 2016-2032
- Figure 111: APAC Hydrate Inhibitors Market Revenue (US$ Mn) Market Share by By Application in 2022
- Figure 112: APAC Hydrate Inhibitors Market Market Attractiveness Analysis by By Application , 2016-2032
- Figure 113: APAC Hydrate Inhibitors Market Revenue (US$ Mn) Market Share by Country in 2022
- Figure 114: APAC Hydrate Inhibitors Market Market Attractiveness Analysis by Country, 2016-2032
- Figure 115: APAC Hydrate Inhibitors Market Market Revenue (US$ Mn) (2016-2032)
- Figure 116: APAC Hydrate Inhibitors Market Market Revenue (US$ Mn) Comparison by Country (2016-2032)
- Figure 117: APAC Hydrate Inhibitors Market Market Revenue (US$ Mn) Comparison by By Product Type (2016-2032)
- Figure 118: APAC Hydrate Inhibitors Market Market Revenue (US$ Mn) Comparison by By Raw Material (2016-2032)
- Figure 119: APAC Hydrate Inhibitors Market Market Revenue (US$ Mn) Comparison by By Operations (2016-2032)
- Figure 120: APAC Hydrate Inhibitors Market Market Revenue (US$ Mn) Comparison by By Application (2016-2032)
- Figure 121: APAC Hydrate Inhibitors Market Market Y-o-Y Growth Rate Comparison by Country (2016-2032)
- Figure 122: APAC Hydrate Inhibitors Market Market Y-o-Y Growth Rate Comparison by By Product Type (2016-2032)
- Figure 123: APAC Hydrate Inhibitors Market Market Y-o-Y Growth Rate Comparison by By Raw Material (2016-2032)
- Figure 124: APAC Hydrate Inhibitors Market Market Y-o-Y Growth Rate Comparison by By Operations (2016-2032)
- Figure 125: APAC Hydrate Inhibitors Market Market Y-o-Y Growth Rate Comparison by By Application (2016-2032)
- Figure 126: APAC Hydrate Inhibitors Market Market Share Comparison by Country (2016-2032)
- Figure 127: APAC Hydrate Inhibitors Market Market Share Comparison by By Product Type (2016-2032)
- Figure 128: APAC Hydrate Inhibitors Market Market Share Comparison by By Raw Material (2016-2032)
- Figure 129: APAC Hydrate Inhibitors Market Market Share Comparison by By Operations (2016-2032)
- Figure 130: APAC Hydrate Inhibitors Market Market Share Comparison by By Application (2016-2032)
- Figure 131: Latin America Hydrate Inhibitors Market Revenue (US$ Mn) Market Share by By Product Typein 2022
- Figure 132: Latin America Hydrate Inhibitors Market Market Attractiveness Analysis by By Product Type, 2016-2032
- Figure 133: Latin America Hydrate Inhibitors Market Revenue (US$ Mn) Market Share by By Raw Materialin 2022
- Figure 134: Latin America Hydrate Inhibitors Market Market Attractiveness Analysis by By Raw Material, 2016-2032
- Figure 135: Latin America Hydrate Inhibitors Market Revenue (US$ Mn) Market Share by By Operations in 2022
- Figure 136: Latin America Hydrate Inhibitors Market Market Attractiveness Analysis by By Operations , 2016-2032
- Figure 137: Latin America Hydrate Inhibitors Market Revenue (US$ Mn) Market Share by By Application in 2022
- Figure 138: Latin America Hydrate Inhibitors Market Market Attractiveness Analysis by By Application , 2016-2032
- Figure 139: Latin America Hydrate Inhibitors Market Revenue (US$ Mn) Market Share by Country in 2022
- Figure 140: Latin America Hydrate Inhibitors Market Market Attractiveness Analysis by Country, 2016-2032
- Figure 141: Latin America Hydrate Inhibitors Market Market Revenue (US$ Mn) (2016-2032)
- Figure 142: Latin America Hydrate Inhibitors Market Market Revenue (US$ Mn) Comparison by Country (2016-2032)
- Figure 143: Latin America Hydrate Inhibitors Market Market Revenue (US$ Mn) Comparison by By Product Type (2016-2032)
- Figure 144: Latin America Hydrate Inhibitors Market Market Revenue (US$ Mn) Comparison by By Raw Material (2016-2032)
- Figure 145: Latin America Hydrate Inhibitors Market Market Revenue (US$ Mn) Comparison by By Operations (2016-2032)
- Figure 146: Latin America Hydrate Inhibitors Market Market Revenue (US$ Mn) Comparison by By Application (2016-2032)
- Figure 147: Latin America Hydrate Inhibitors Market Market Y-o-Y Growth Rate Comparison by Country (2016-2032)
- Figure 148: Latin America Hydrate Inhibitors Market Market Y-o-Y Growth Rate Comparison by By Product Type (2016-2032)
- Figure 149: Latin America Hydrate Inhibitors Market Market Y-o-Y Growth Rate Comparison by By Raw Material (2016-2032)
- Figure 150: Latin America Hydrate Inhibitors Market Market Y-o-Y Growth Rate Comparison by By Operations (2016-2032)
- Figure 151: Latin America Hydrate Inhibitors Market Market Y-o-Y Growth Rate Comparison by By Application (2016-2032)
- Figure 152: Latin America Hydrate Inhibitors Market Market Share Comparison by Country (2016-2032)
- Figure 153: Latin America Hydrate Inhibitors Market Market Share Comparison by By Product Type (2016-2032)
- Figure 154: Latin America Hydrate Inhibitors Market Market Share Comparison by By Raw Material (2016-2032)
- Figure 155: Latin America Hydrate Inhibitors Market Market Share Comparison by By Operations (2016-2032)
- Figure 156: Latin America Hydrate Inhibitors Market Market Share Comparison by By Application (2016-2032)
- Figure 157: Middle East & Africa Hydrate Inhibitors Market Revenue (US$ Mn) Market Share by By Product Typein 2022
- Figure 158: Middle East & Africa Hydrate Inhibitors Market Market Attractiveness Analysis by By Product Type, 2016-2032
- Figure 159: Middle East & Africa Hydrate Inhibitors Market Revenue (US$ Mn) Market Share by By Raw Materialin 2022
- Figure 160: Middle East & Africa Hydrate Inhibitors Market Market Attractiveness Analysis by By Raw Material, 2016-2032
- Figure 161: Middle East & Africa Hydrate Inhibitors Market Revenue (US$ Mn) Market Share by By Operations in 2022
- Figure 162: Middle East & Africa Hydrate Inhibitors Market Market Attractiveness Analysis by By Operations , 2016-2032
- Figure 163: Middle East & Africa Hydrate Inhibitors Market Revenue (US$ Mn) Market Share by By Application in 2022
- Figure 164: Middle East & Africa Hydrate Inhibitors Market Market Attractiveness Analysis by By Application , 2016-2032
- Figure 165: Middle East & Africa Hydrate Inhibitors Market Revenue (US$ Mn) Market Share by Country in 2022
- Figure 166: Middle East & Africa Hydrate Inhibitors Market Market Attractiveness Analysis by Country, 2016-2032
- Figure 167: Middle East & Africa Hydrate Inhibitors Market Market Revenue (US$ Mn) (2016-2032)
- Figure 168: Middle East & Africa Hydrate Inhibitors Market Market Revenue (US$ Mn) Comparison by Country (2016-2032)
- Figure 169: Middle East & Africa Hydrate Inhibitors Market Market Revenue (US$ Mn) Comparison by By Product Type (2016-2032)
- Figure 170: Middle East & Africa Hydrate Inhibitors Market Market Revenue (US$ Mn) Comparison by By Raw Material (2016-2032)
- Figure 171: Middle East & Africa Hydrate Inhibitors Market Market Revenue (US$ Mn) Comparison by By Operations (2016-2032)
- Figure 172: Middle East & Africa Hydrate Inhibitors Market Market Revenue (US$ Mn) Comparison by By Application (2016-2032)
- Figure 173: Middle East & Africa Hydrate Inhibitors Market Market Y-o-Y Growth Rate Comparison by Country (2016-2032)
- Figure 174: Middle East & Africa Hydrate Inhibitors Market Market Y-o-Y Growth Rate Comparison by By Product Type (2016-2032)
- Figure 175: Middle East & Africa Hydrate Inhibitors Market Market Y-o-Y Growth Rate Comparison by By Raw Material (2016-2032)
- Figure 176: Middle East & Africa Hydrate Inhibitors Market Market Y-o-Y Growth Rate Comparison by By Operations (2016-2032)
- Figure 177: Middle East & Africa Hydrate Inhibitors Market Market Y-o-Y Growth Rate Comparison by By Application (2016-2032)
- Figure 178: Middle East & Africa Hydrate Inhibitors Market Market Share Comparison by Country (2016-2032)
- Figure 179: Middle East & Africa Hydrate Inhibitors Market Market Share Comparison by By Product Type (2016-2032)
- Figure 180: Middle East & Africa Hydrate Inhibitors Market Market Share Comparison by By Raw Material (2016-2032)
- Figure 181: Middle East & Africa Hydrate Inhibitors Market Market Share Comparison by By Operations (2016-2032)
- Figure 182: Middle East & Africa Hydrate Inhibitors Market Market Share Comparison by By Application (2016-2032)
"
- List of Tables
- "
- Table 1: Global Hydrate Inhibitors Market Market Comparison by By Product Type (2016-2032)
- Table 2: Global Hydrate Inhibitors Market Market Comparison by By Raw Material (2016-2032)
- Table 3: Global Hydrate Inhibitors Market Market Comparison by By Operations (2016-2032)
- Table 4: Global Hydrate Inhibitors Market Market Comparison by By Application (2016-2032)
- Table 5: Global Hydrate Inhibitors Market Revenue (US$ Mn) Comparison by Region (2016-2032)
- Table 6: Global Hydrate Inhibitors Market Market Revenue (US$ Mn) (2016-2032)
- Table 7: Global Hydrate Inhibitors Market Market Revenue (US$ Mn) Comparison by Region (2016-2032)
- Table 8: Global Hydrate Inhibitors Market Market Revenue (US$ Mn) Comparison by By Product Type (2016-2032)
- Table 9: Global Hydrate Inhibitors Market Market Revenue (US$ Mn) Comparison by By Raw Material (2016-2032)
- Table 10: Global Hydrate Inhibitors Market Market Revenue (US$ Mn) Comparison by By Operations (2016-2032)
- Table 11: Global Hydrate Inhibitors Market Market Revenue (US$ Mn) Comparison by By Application (2016-2032)
- Table 12: Global Hydrate Inhibitors Market Market Y-o-Y Growth Rate Comparison by Region (2016-2032)
- Table 13: Global Hydrate Inhibitors Market Market Y-o-Y Growth Rate Comparison by By Product Type (2016-2032)
- Table 14: Global Hydrate Inhibitors Market Market Y-o-Y Growth Rate Comparison by By Raw Material (2016-2032)
- Table 15: Global Hydrate Inhibitors Market Market Y-o-Y Growth Rate Comparison by By Operations (2016-2032)
- Table 16: Global Hydrate Inhibitors Market Market Y-o-Y Growth Rate Comparison by By Application (2016-2032)
- Table 17: Global Hydrate Inhibitors Market Market Share Comparison by Region (2016-2032)
- Table 18: Global Hydrate Inhibitors Market Market Share Comparison by By Product Type (2016-2032)
- Table 19: Global Hydrate Inhibitors Market Market Share Comparison by By Raw Material (2016-2032)
- Table 20: Global Hydrate Inhibitors Market Market Share Comparison by By Operations (2016-2032)
- Table 21: Global Hydrate Inhibitors Market Market Share Comparison by By Application (2016-2032)
- Table 22: North America Hydrate Inhibitors Market Market Comparison by By Raw Material (2016-2032)
- Table 23: North America Hydrate Inhibitors Market Market Comparison by By Operations (2016-2032)
- Table 24: North America Hydrate Inhibitors Market Market Comparison by By Application (2016-2032)
- Table 25: North America Hydrate Inhibitors Market Revenue (US$ Mn) Comparison by Country (2016-2032)
- Table 26: North America Hydrate Inhibitors Market Market Revenue (US$ Mn) (2016-2032)
- Table 27: North America Hydrate Inhibitors Market Market Revenue (US$ Mn) Comparison by Country (2016-2032)
- Table 28: North America Hydrate Inhibitors Market Market Revenue (US$ Mn) Comparison by By Product Type (2016-2032)
- Table 29: North America Hydrate Inhibitors Market Market Revenue (US$ Mn) Comparison by By Raw Material (2016-2032)
- Table 30: North America Hydrate Inhibitors Market Market Revenue (US$ Mn) Comparison by By Operations (2016-2032)
- Table 31: North America Hydrate Inhibitors Market Market Revenue (US$ Mn) Comparison by By Application (2016-2032)
- Table 32: North America Hydrate Inhibitors Market Market Y-o-Y Growth Rate Comparison by Country (2016-2032)
- Table 33: North America Hydrate Inhibitors Market Market Y-o-Y Growth Rate Comparison by By Product Type (2016-2032)
- Table 34: North America Hydrate Inhibitors Market Market Y-o-Y Growth Rate Comparison by By Raw Material (2016-2032)
- Table 35: North America Hydrate Inhibitors Market Market Y-o-Y Growth Rate Comparison by By Operations (2016-2032)
- Table 36: North America Hydrate Inhibitors Market Market Y-o-Y Growth Rate Comparison by By Application (2016-2032)
- Table 37: North America Hydrate Inhibitors Market Market Share Comparison by Country (2016-2032)
- Table 38: North America Hydrate Inhibitors Market Market Share Comparison by By Product Type (2016-2032)
- Table 39: North America Hydrate Inhibitors Market Market Share Comparison by By Raw Material (2016-2032)
- Table 40: North America Hydrate Inhibitors Market Market Share Comparison by By Operations (2016-2032)
- Table 41: North America Hydrate Inhibitors Market Market Share Comparison by By Application (2016-2032)
- Table 42: Western Europe Hydrate Inhibitors Market Market Comparison by By Product Type (2016-2032)
- Table 43: Western Europe Hydrate Inhibitors Market Market Comparison by By Raw Material (2016-2032)
- Table 44: Western Europe Hydrate Inhibitors Market Market Comparison by By Operations (2016-2032)
- Table 45: Western Europe Hydrate Inhibitors Market Market Comparison by By Application (2016-2032)
- Table 46: Western Europe Hydrate Inhibitors Market Revenue (US$ Mn) Comparison by Country (2016-2032)
- Table 47: Western Europe Hydrate Inhibitors Market Market Revenue (US$ Mn) (2016-2032)
- Table 48: Western Europe Hydrate Inhibitors Market Market Revenue (US$ Mn) Comparison by Country (2016-2032)
- Table 49: Western Europe Hydrate Inhibitors Market Market Revenue (US$ Mn) Comparison by By Product Type (2016-2032)
- Table 50: Western Europe Hydrate Inhibitors Market Market Revenue (US$ Mn) Comparison by By Raw Material (2016-2032)
- Table 51: Western Europe Hydrate Inhibitors Market Market Revenue (US$ Mn) Comparison by By Operations (2016-2032)
- Table 52: Western Europe Hydrate Inhibitors Market Market Revenue (US$ Mn) Comparison by By Application (2016-2032)
- Table 53: Western Europe Hydrate Inhibitors Market Market Y-o-Y Growth Rate Comparison by Country (2016-2032)
- Table 54: Western Europe Hydrate Inhibitors Market Market Y-o-Y Growth Rate Comparison by By Product Type (2016-2032)
- Table 55: Western Europe Hydrate Inhibitors Market Market Y-o-Y Growth Rate Comparison by By Raw Material (2016-2032)
- Table 56: Western Europe Hydrate Inhibitors Market Market Y-o-Y Growth Rate Comparison by By Operations (2016-2032)
- Table 57: Western Europe Hydrate Inhibitors Market Market Y-o-Y Growth Rate Comparison by By Application (2016-2032)
- Table 58: Western Europe Hydrate Inhibitors Market Market Share Comparison by Country (2016-2032)
- Table 59: Western Europe Hydrate Inhibitors Market Market Share Comparison by By Product Type (2016-2032)
- Table 60: Western Europe Hydrate Inhibitors Market Market Share Comparison by By Raw Material (2016-2032)
- Table 61: Western Europe Hydrate Inhibitors Market Market Share Comparison by By Operations (2016-2032)
- Table 62: Western Europe Hydrate Inhibitors Market Market Share Comparison by By Application (2016-2032)
- Table 63: Eastern Europe Hydrate Inhibitors Market Market Comparison by By Product Type (2016-2032)
- Table 64: Eastern Europe Hydrate Inhibitors Market Market Comparison by By Raw Material (2016-2032)
- Table 65: Eastern Europe Hydrate Inhibitors Market Market Comparison by By Operations (2016-2032)
- Table 66: Eastern Europe Hydrate Inhibitors Market Market Comparison by By Application (2016-2032)
- Table 67: Eastern Europe Hydrate Inhibitors Market Revenue (US$ Mn) Comparison by Country (2016-2032)
- Table 68: Eastern Europe Hydrate Inhibitors Market Market Revenue (US$ Mn) (2016-2032)
- Table 69: Eastern Europe Hydrate Inhibitors Market Market Revenue (US$ Mn) Comparison by Country (2016-2032)
- Table 70: Eastern Europe Hydrate Inhibitors Market Market Revenue (US$ Mn) Comparison by By Product Type (2016-2032)
- Table 71: Eastern Europe Hydrate Inhibitors Market Market Revenue (US$ Mn) Comparison by By Raw Material (2016-2032)
- Table 72: Eastern Europe Hydrate Inhibitors Market Market Revenue (US$ Mn) Comparison by By Operations (2016-2032)
- Table 73: Eastern Europe Hydrate Inhibitors Market Market Revenue (US$ Mn) Comparison by By Application (2016-2032)
- Table 74: Eastern Europe Hydrate Inhibitors Market Market Y-o-Y Growth Rate Comparison by Country (2016-2032)
- Table 75: Eastern Europe Hydrate Inhibitors Market Market Y-o-Y Growth Rate Comparison by By Product Type (2016-2032)
- Table 76: Eastern Europe Hydrate Inhibitors Market Market Y-o-Y Growth Rate Comparison by By Raw Material (2016-2032)
- Table 77: Eastern Europe Hydrate Inhibitors Market Market Y-o-Y Growth Rate Comparison by By Operations (2016-2032)
- Table 78: Eastern Europe Hydrate Inhibitors Market Market Y-o-Y Growth Rate Comparison by By Application (2016-2032)
- Table 79: Eastern Europe Hydrate Inhibitors Market Market Share Comparison by Country (2016-2032)
- Table 80: Eastern Europe Hydrate Inhibitors Market Market Share Comparison by By Product Type (2016-2032)
- Table 81: Eastern Europe Hydrate Inhibitors Market Market Share Comparison by By Raw Material (2016-2032)
- Table 82: Eastern Europe Hydrate Inhibitors Market Market Share Comparison by By Operations (2016-2032)
- Table 83: Eastern Europe Hydrate Inhibitors Market Market Share Comparison by By Application (2016-2032)
- Table 84: APAC Hydrate Inhibitors Market Market Comparison by By Product Type (2016-2032)
- Table 85: APAC Hydrate Inhibitors Market Market Comparison by By Raw Material (2016-2032)
- Table 86: APAC Hydrate Inhibitors Market Market Comparison by By Operations (2016-2032)
- Table 87: APAC Hydrate Inhibitors Market Market Comparison by By Application (2016-2032)
- Table 88: APAC Hydrate Inhibitors Market Revenue (US$ Mn) Comparison by Country (2016-2032)
- Table 89: APAC Hydrate Inhibitors Market Market Revenue (US$ Mn) (2016-2032)
- Table 90: APAC Hydrate Inhibitors Market Market Revenue (US$ Mn) Comparison by Country (2016-2032)
- Table 91: APAC Hydrate Inhibitors Market Market Revenue (US$ Mn) Comparison by By Product Type (2016-2032)
- Table 92: APAC Hydrate Inhibitors Market Market Revenue (US$ Mn) Comparison by By Raw Material (2016-2032)
- Table 93: APAC Hydrate Inhibitors Market Market Revenue (US$ Mn) Comparison by By Operations (2016-2032)
- Table 94: APAC Hydrate Inhibitors Market Market Revenue (US$ Mn) Comparison by By Application (2016-2032)
- Table 95: APAC Hydrate Inhibitors Market Market Y-o-Y Growth Rate Comparison by Country (2016-2032)
- Table 96: APAC Hydrate Inhibitors Market Market Y-o-Y Growth Rate Comparison by By Product Type (2016-2032)
- Table 97: APAC Hydrate Inhibitors Market Market Y-o-Y Growth Rate Comparison by By Raw Material (2016-2032)
- Table 98: APAC Hydrate Inhibitors Market Market Y-o-Y Growth Rate Comparison by By Operations (2016-2032)
- Table 99: APAC Hydrate Inhibitors Market Market Y-o-Y Growth Rate Comparison by By Application (2016-2032)
- Table 100: APAC Hydrate Inhibitors Market Market Share Comparison by Country (2016-2032)
- Table 101: APAC Hydrate Inhibitors Market Market Share Comparison by By Product Type (2016-2032)
- Table 102: APAC Hydrate Inhibitors Market Market Share Comparison by By Raw Material (2016-2032)
- Table 103: APAC Hydrate Inhibitors Market Market Share Comparison by By Operations (2016-2032)
- Table 104: APAC Hydrate Inhibitors Market Market Share Comparison by By Application (2016-2032)
- Table 105: Latin America Hydrate Inhibitors Market Market Comparison by By Product Type (2016-2032)
- Table 106: Latin America Hydrate Inhibitors Market Market Comparison by By Raw Material (2016-2032)
- Table 107: Latin America Hydrate Inhibitors Market Market Comparison by By Operations (2016-2032)
- Table 108: Latin America Hydrate Inhibitors Market Market Comparison by By Application (2016-2032)
- Table 109: Latin America Hydrate Inhibitors Market Revenue (US$ Mn) Comparison by Country (2016-2032)
- Table 110: Latin America Hydrate Inhibitors Market Market Revenue (US$ Mn) (2016-2032)
- Table 111: Latin America Hydrate Inhibitors Market Market Revenue (US$ Mn) Comparison by Country (2016-2032)
- Table 112: Latin America Hydrate Inhibitors Market Market Revenue (US$ Mn) Comparison by By Product Type (2016-2032)
- Table 113: Latin America Hydrate Inhibitors Market Market Revenue (US$ Mn) Comparison by By Raw Material (2016-2032)
- Table 114: Latin America Hydrate Inhibitors Market Market Revenue (US$ Mn) Comparison by By Operations (2016-2032)
- Table 115: Latin America Hydrate Inhibitors Market Market Revenue (US$ Mn) Comparison by By Application (2016-2032)
- Table 116: Latin America Hydrate Inhibitors Market Market Y-o-Y Growth Rate Comparison by Country (2016-2032)
- Table 117: Latin America Hydrate Inhibitors Market Market Y-o-Y Growth Rate Comparison by By Product Type (2016-2032)
- Table 118: Latin America Hydrate Inhibitors Market Market Y-o-Y Growth Rate Comparison by By Raw Material (2016-2032)
- Table 119: Latin America Hydrate Inhibitors Market Market Y-o-Y Growth Rate Comparison by By Operations (2016-2032)
- Table 120: Latin America Hydrate Inhibitors Market Market Y-o-Y Growth Rate Comparison by By Application (2016-2032)
- Table 121: Latin America Hydrate Inhibitors Market Market Share Comparison by Country (2016-2032)
- Table 122: Latin America Hydrate Inhibitors Market Market Share Comparison by By Product Type (2016-2032)
- Table 123: Latin America Hydrate Inhibitors Market Market Share Comparison by By Raw Material (2016-2032)
- Table 124: Latin America Hydrate Inhibitors Market Market Share Comparison by By Operations (2016-2032)
- Table 125: Latin America Hydrate Inhibitors Market Market Share Comparison by By Application (2016-2032)
- Table 126: Middle East & Africa Hydrate Inhibitors Market Market Comparison by By Product Type (2016-2032)
- Table 127: Middle East & Africa Hydrate Inhibitors Market Market Comparison by By Raw Material (2016-2032)
- Table 128: Middle East & Africa Hydrate Inhibitors Market Market Comparison by By Operations (2016-2032)
- Table 129: Middle East & Africa Hydrate Inhibitors Market Market Comparison by By Application (2016-2032)
- Table 130: Middle East & Africa Hydrate Inhibitors Market Revenue (US$ Mn) Comparison by Country (2016-2032)
- Table 131: Middle East & Africa Hydrate Inhibitors Market Market Revenue (US$ Mn) (2016-2032)
- Table 132: Middle East & Africa Hydrate Inhibitors Market Market Revenue (US$ Mn) Comparison by Country (2016-2032)
- Table 133: Middle East & Africa Hydrate Inhibitors Market Market Revenue (US$ Mn) Comparison by By Product Type (2016-2032)
- Table 134: Middle East & Africa Hydrate Inhibitors Market Market Revenue (US$ Mn) Comparison by By Raw Material (2016-2032)
- Table 135: Middle East & Africa Hydrate Inhibitors Market Market Revenue (US$ Mn) Comparison by By Operations (2016-2032)
- Table 136: Middle East & Africa Hydrate Inhibitors Market Market Revenue (US$ Mn) Comparison by By Application (2016-2032)
- Table 137: Middle East & Africa Hydrate Inhibitors Market Market Y-o-Y Growth Rate Comparison by Country (2016-2032)
- Table 138: Middle East & Africa Hydrate Inhibitors Market Market Y-o-Y Growth Rate Comparison by By Product Type (2016-2032)
- Table 139: Middle East & Africa Hydrate Inhibitors Market Market Y-o-Y Growth Rate Comparison by By Raw Material (2016-2032)
- Table 140: Middle East & Africa Hydrate Inhibitors Market Market Y-o-Y Growth Rate Comparison by By Operations (2016-2032)
- Table 141: Middle East & Africa Hydrate Inhibitors Market Market Y-o-Y Growth Rate Comparison by By Application (2016-2032)
- Table 142: Middle East & Africa Hydrate Inhibitors Market Market Share Comparison by Country (2016-2032)
- Table 143: Middle East & Africa Hydrate Inhibitors Market Market Share Comparison by By Product Type (2016-2032)
- Table 144: Middle East & Africa Hydrate Inhibitors Market Market Share Comparison by By Raw Material (2016-2032)
- Table 145: Middle East & Africa Hydrate Inhibitors Market Market Share Comparison by By Operations (2016-2032)
- Table 146: Middle East & Africa Hydrate Inhibitors Market Market Share Comparison by By Application (2016-2032)
- 1. Executive Summary
-
- BASF SE
- Schlumberger
- Halliburton
- Baker Hughes
- Nalco Champion
- Clariant
- Lubrizol
- Infineum
- Dorf Ketal
- Ecolab
Our Clients


View Our Licence Options
