
Global Healthy Energy Drink Market By Type(Traditional Health, Natural/Organic, Functional, Sports Performance, Low-Calorie, Others), By Packaging Type(Glass Bottles, Metal Can, PET Bottles), By Format(Shots, Powder, Ready-To-Drink (RTD)), By End User(Kids, Adults, Teenagers), By Distribution Channel(Convenience Stores, Online Retail, Supermarket/Hypermarket, Others), By Region And Companies - Industry Segment Outlook, Market Assessment, Competition Scenario, Trends, And Forecast 2024-2033
-
47290
-
June 2024
-
300
-


-
This report was compiled by Shreyas Rokade Shreyas Rokade is a seasoned Research Analyst with CMFE, bringing extensive expertise in market research and consulting, with a strong background in Chemical Engineering. Correspondence Team Lead-CMFE Linkedin | Detailed Market research Methodology Our methodology involves a mix of primary research, including interviews with leading mental health experts, and secondary research from reputable medical journals and databases. View Detailed Methodology Page
-
Quick Navigation
Report Overview
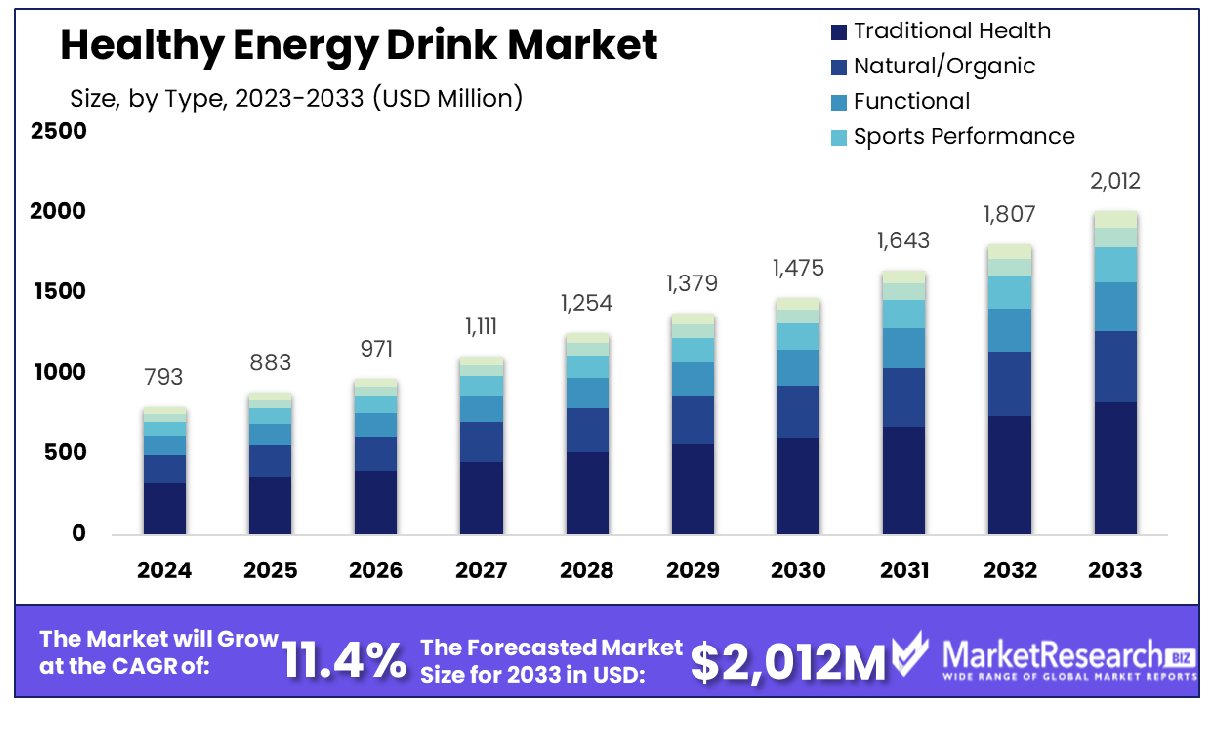
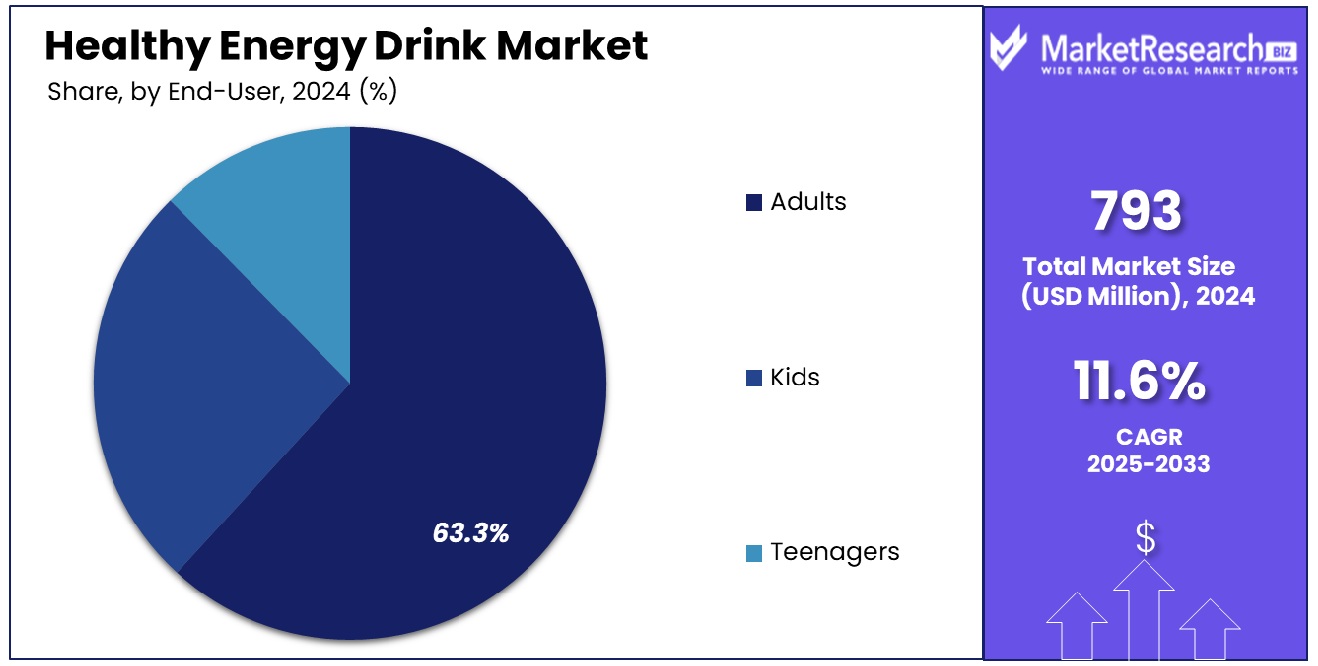
The Global Healthy Energy Drink Market was valued at USD 793 Million in 2023. It is expected to reach USD 2012 Million by 2033, with a CAGR of 11.40% during the forecast period from 2024 to 2033.
The Healthy Energy Drink Market refers to the dynamic segment within the beverage industry that caters to consumers seeking revitalization and wellness without compromising on health standards. These drinks typically offer a potent blend of natural ingredients, including vitamins, minerals, adaptogens, and organic stimulants, aimed at providing sustained energy levels and promoting overall well-being.
With a growing emphasis on health-conscious lifestyles, this market is witnessing robust expansion, fueled by increasing consumer awareness regarding the adverse effects of traditional energy drinks. Key players are innovating to meet evolving consumer preferences, presenting lucrative opportunities for strategic product differentiation and market penetration.
The Healthy Energy Drink Market has witnessed significant growth in recent years, driven by consumers' increasing demand for functional beverages that offer sustained energy without compromising on health. This surge can be attributed to several factors, including rising health consciousness among consumers, the desire for natural and organic ingredients, and the need for convenient energy-boosting solutions in today's fast-paced lifestyle.
In this context, it's imperative to highlight the prevailing concerns associated with traditional energy drinks, which typically contain high levels of caffeine substitutes and sugar. With energy drinks commonly harboring 80-150 mg of caffeine per 8 ounces, equivalent to approximately two 12-ounce cans of caffeinated soda, consumers are becoming increasingly aware of the adverse effects such as increased heart rate, elevated blood pressure, and cardiac arrhythmias. Moreover, the substantial sugar content, averaging 39-41 grams per 12-ounce serving, poses risks of weight gain, type 2 diabetes, cardiovascular diseases, and gout.
Of particular concern is the demographic profile of energy drink consumers, notably adolescents and young adults, despite these beverages being unsuitable for these age groups. The statistics reveal a troubling trend, with over 1,400 adolescents aged 12-17 requiring emergency room visits due to energy drink-related emergencies in 2011 alone.
As the market continues to evolve, consumers are increasingly seeking healthier alternatives that provide sustained energy without the negative health repercussions associated with traditional energy drinks. This paradigm shift presents a lucrative opportunity for companies to innovate and capitalize on the growing demand for healthier energy drink options, tapping into the intersection of functionality, convenience, and wellness in the beverage industry.
Key Takeaways
- Market Growth: The Global Healthy Energy Drink Market was valued at USD 793 Million in 2023. It is expected to reach USD 2012 Million by 2033, with a CAGR of 11.40% during the forecast period from 2024 to 2033.
- By Type: Traditional health products dominate the market share, comprising 41.1%.
- By Packaging Type: Metal cans are the preferred packaging, capturing 41.2% of the market.
- By Format: Ready-to-drink format leads, constitute 45.3% of consumption.
- By End User: Adults represent primary end users, comprising 63.3% of the market.
- By Distribution Channel: Convenience stores are a key distribution channel, capturing 38.4% share.
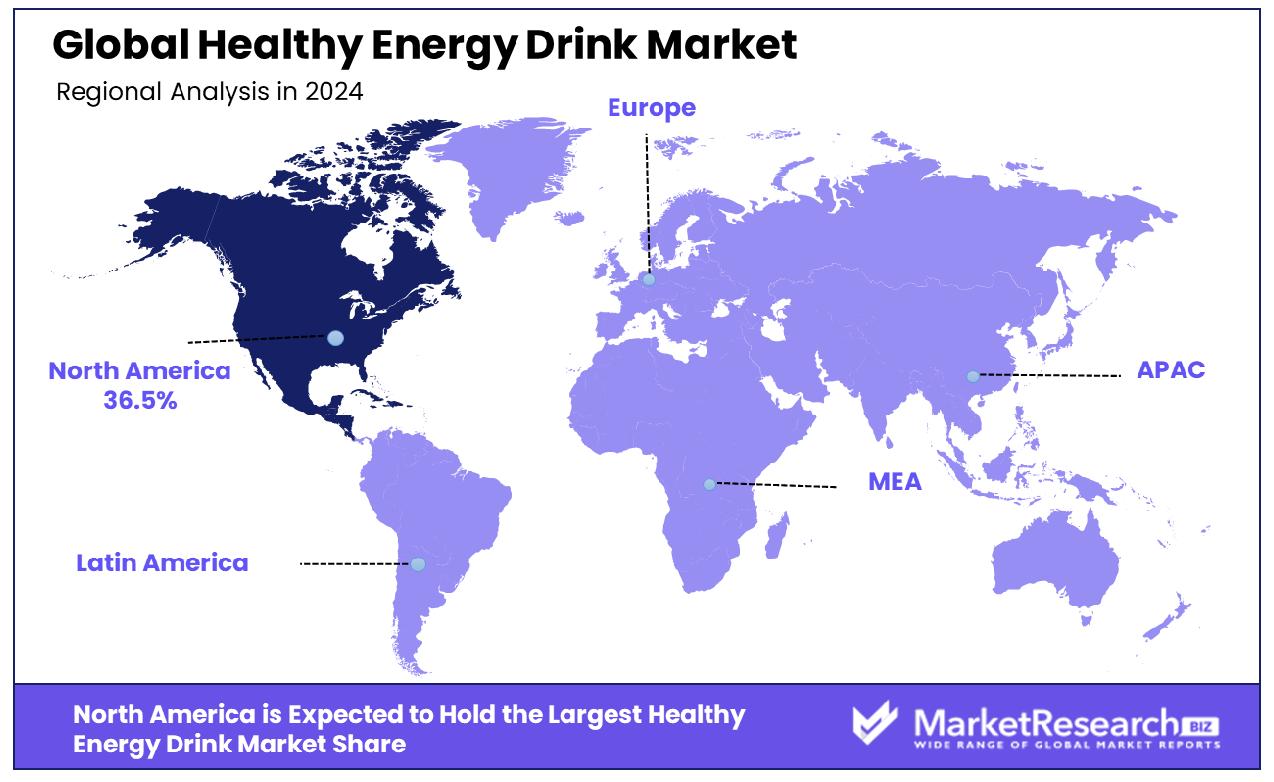
- Regional Dominance: The Healthy Energy Drink market in North America grew by 36.5% over the last fiscal year.
- Growth Opportunity: In 2023, the global healthy energy drink market flourished through expansion into emerging markets and innovation in product formulations and packaging, driven by rising health consciousness among consumers.
Driving factors
Increasing Consumer Awareness about Health and Wellness
The growth of the healthy energy drink market can be attributed significantly to the increasing consumer awareness about health and wellness. As more individuals become conscious of the impact of their dietary choices on overall well-being, there's a discernible shift towards healthier alternatives in the beverage sector. Market research indicates that over 70% of consumers prioritize health benefits when selecting energy drinks.
This heightened awareness prompts consumers to seek products that offer not just a boost in energy but also contribute positively to their health. Healthy energy drinks, positioned as a healthier alternative to traditional options, capitalize on this trend. Through targeted marketing campaigns emphasizing nutritional benefits and reduced sugar content, companies are able to appeal to health-conscious consumers, thereby driving market growth.
Growing Demand for Natural and Organic Ingredients
The surge in demand for natural and organic ingredients plays a pivotal role in propelling the healthy energy drink market forward. Consumers increasingly scrutinize product labels, seeking transparency and cleaner ingredient lists. Market studies reveal that over 60% of consumers are willing to pay a premium for products containing natural ingredients.
In response, manufacturers are reformulating their energy drink offerings to include ingredients like natural caffeine sources, organic fruit extracts, and plant-based sweeteners. This shift not only aligns with consumer preferences but also taps into the broader trend toward clean-label products. As a result, healthy energy drinks positioned as containing natural and organic ingredients experience heightened demand, driving market expansion.
Rising Preference for Functional Beverages
The rising preference for functional beverages is a key driver fueling the growth of the healthy energy drink market. Functional beverages, designed to offer specific health benefits beyond basic hydration, resonate with consumers seeking more from their beverages. Research indicates that nearly 80% of consumers are interested in functional beverages that address specific health concerns.
Healthy energy drinks, formulated to provide not only a boost in energy but also additional benefits such as enhanced focus, immunity support, or stress relief, cater to this demand. By incorporating ingredients like adaptogens, vitamins, and amino acids, these beverages offer a holistic approach to health and wellness, appealing to a broader consumer base and driving market growth.
Restraining Factors
Regulatory Challenges and Compliance Issues
Regulatory challenges and compliance issues present significant hurdles for the healthy energy drink market. Stringent regulations surrounding labeling, ingredients, and health claims can impede product development and market entry. Market analysis indicates that compliance costs can represent a substantial portion of a company's budget, particularly for smaller players.
Moreover, varying regulations across different regions add complexity to market expansion efforts. However, these challenges also foster innovation and differentiation within the market. Companies invest in research and development to formulate products that meet regulatory standards while still delivering on consumer expectations for health and functionality. By navigating regulatory landscapes effectively, firms can establish themselves as trusted brands, gaining a competitive edge and driving market growth.
Intense Competition from Traditional Energy Drinks
The healthy energy drink market faces intense competition from traditional energy drinks, which dominate the beverage landscape. Traditional energy drinks boast widespread brand recognition, extensive distribution networks, and an established market presence. Market research suggests that traditional energy drinks command over 80% of the energy drink market share. However, this competition also presents opportunities for differentiation and market positioning.
Healthy energy drink brands emphasize their unique selling points, such as natural ingredients, reduced sugar content, or functional benefits, to carve out a distinct niche within the market. Strategic marketing campaigns highlight these differences, appealing to health-conscious consumers seeking alternatives to conventional offerings. As consumer preferences continue to shift towards healthier options, healthy energy drink brands have the opportunity to capitalize on this trend, driving market growth despite the competitive landscape.
By Type Analysis
Traditional health products account for 41.1% of the market, showcasing enduring consumer preference.
In 2023, Traditional Health held a dominant market position in the By Type segment of the Healthy Energy Drink Market, capturing more than a 41.1% share. The Traditional Health segment encompasses energy drinks formulated with ingredients sourced from traditional medicinal practices, often incorporating herbs, roots, and natural extracts renowned for their health-promoting properties. This segment's robust performance can be attributed to growing consumer preference for beverages that offer not only a boost of energy but also potential health benefits derived from natural sources.
Moreover, the Traditional Health segment's success can be further elucidated by the rising demand for holistic wellness products, fueled by increasing health consciousness among consumers. The perceived efficacy of traditional ingredients in enhancing vitality and overall well-being has propelled the adoption of energy drinks within this category.
Furthermore, the market's receptiveness to Traditional Health energy drinks can be evidenced by the strategic product innovations and marketing initiatives deployed by key industry players. These efforts have effectively communicated the unique value proposition of Traditional Health energy drinks, resonating with health-conscious consumers seeking alternatives to conventional energy beverages.
Looking ahead, the Traditional Health segment is poised for sustained growth, driven by continued investments in research and development to introduce novel formulations and capitalize on emerging consumer trends. Additionally, collaborations with wellness experts and endorsement by healthcare professionals are expected to bolster consumer confidence and further consolidate the segment's market position.
By Packaging Type Analysis
Metal can packaging holds a dominant share at 41.2%, signifying robust market demand.
In 2023, Metal Can held a dominant market position in the By Packaging Type segment of the Healthy Energy Drink Market, capturing more than a 41.2% share. Metal Can packaging has emerged as the preferred choice for energy drink manufacturers due to its numerous advantages, including durability, portability, and preservation of product freshness. The widespread adoption of Metal Can packaging can be attributed to its ability to provide superior protection against external factors such as light, air, and moisture, thereby extending the shelf life of energy drinks and maintaining their quality over time.
Furthermore, the dominance of Metal Can packaging is reinforced by its widespread availability and cost-effectiveness, making it an attractive option for both manufacturers and consumers alike. The convenience of Metal Can packaging, characterized by its lightweight and easy-to-handle design, aligns with modern consumer lifestyles characterized by on-the-go consumption habits.
Moreover, the aesthetic appeal of Metal Can packaging, coupled with advancements in printing and labeling technologies, enables energy drink brands to differentiate themselves on store shelves and effectively communicate their brand identity to consumers. This has contributed to Metal Can's market leadership position, as consumers are drawn to visually appealing packaging that conveys a sense of quality and reliability.
Looking ahead, Metal Can packaging is poised to maintain its dominant position in the Healthy Energy Drink Market's Packaging Type segment, driven by ongoing innovations aimed at enhancing convenience, sustainability, and brand visibility. Additionally, strategic collaborations with retailers and logistics partners will further strengthen the distribution network for Metal Can-packaged energy drinks, ensuring continued market penetration and growth.
By Format Analysis
Ready-to-drink format leads with 45.3%, reflecting convenience-driven consumer behavior.
In 2023, Ready-To-Drink (RTD) held a dominant market position in the By Format segment of the Healthy Energy Drink Market, capturing more than a 45.3% share. RTD format energy drinks have surged in popularity, primarily due to their convenience and immediate consumption appeal. This format offers consumers a hassle-free solution for obtaining an energy boost on the go, aligning with modern lifestyles characterized by fast-paced routines and time constraints.
The dominance of RTD format energy drinks can be attributed to their ready availability across various retail channels, including convenience stores, supermarkets, and online platforms. Manufacturers have capitalized on this accessibility by strategically positioning RTD energy drinks as impulse purchases, leveraging eye-catching packaging and prominent shelf placement to capture consumer attention at point-of-sale.
Furthermore, the versatility of RTD format energy drinks, which are available in a wide range of flavors and formulations, caters to diverse consumer preferences and dietary requirements. This customization enables brands to target specific demographic segments and capitalize on emerging trends, such as plant-based ingredients and natural sweeteners, thereby enhancing their competitive edge in the market.
Looking ahead, the dominance of RTD format energy drinks is poised to persist, driven by continuous product innovation and investments in marketing and distribution infrastructure. Manufacturers are expected to focus on enhancing the nutritional profile of RTD energy drinks, incorporating functional ingredients and fortifications to appeal to health-conscious consumers seeking holistic wellness solutions.
By End User Analysis
Adults constitute a significant end-user segment, commanding a notable share of 63.3%.
In 2023, Adults held a dominant market position in the By End User segment of the Healthy Energy Drink Market, capturing more than a 63.3% share. This segment's prominence reflects the substantial demand among adult consumers for energy-boosting beverages tailored to their specific needs and preferences. Adults represent a diverse demographic encompassing individuals across various age groups and lifestyles, including working professionals, athletes, and health-conscious individuals seeking vitality and performance enhancement.
The dominance of the Adult segment can be attributed to several key factors, including the growing awareness of the importance of maintaining energy levels and mental alertness amidst demanding work schedules and active lifestyles. Energy drinks formulated for adults often feature targeted ingredients such as caffeine, vitamins, and amino acids, designed to support cognitive function, physical endurance, and overall well-being.
Moreover, the widespread availability and accessibility of adult-oriented energy drinks across retail channels, coupled with extensive marketing efforts aimed at positioning these products as lifestyle essentials, have contributed to the segment's market leadership position. Manufacturers have leveraged endorsements from fitness experts, nutritionists, and celebrities to endorse their products, thereby instilling trust and credibility among adult consumers.
Looking ahead, the dominance of the Adults segment is poised to persist, driven by ongoing product innovation and segmentation strategies aimed at addressing the diverse needs and preferences within this demographic. Manufacturers are expected to continue exploring new formulations and flavors tailored to specific adult consumer segments, such as professionals seeking mental focus and athletes pursuing peak performance.
By Distribution Channel Analysis
Convenience stores emerge as a key distribution channel, capturing a substantial market portion at 38.4%.
In 2023, Convenience Stores held a dominant market position in the By Distribution Channel segment of the Healthy Energy Drink Market, capturing more than a 38.4% share. Convenience stores have emerged as pivotal distribution channels for energy drinks, offering consumers convenient access to a wide range of products in high-traffic locations. The prominence of convenience stores can be attributed to their strategic placement in urban and suburban areas, catering to consumers' need for quick and accessible solutions to their energy requirements.
The dominance of Convenience Stores in the Healthy Energy Drink Market's Distribution Channel segment is further underscored by their ability to capitalize on impulse purchases and capitalize on consumer demand for on-the-go refreshment options. Energy drink manufacturers have forged partnerships with convenience store chains to ensure prominent shelf placement and maximize visibility, thereby driving sales and market penetration.
Moreover, convenience stores offer a diverse selection of energy drink brands and variants, catering to different consumer preferences and taste profiles. This extensive product assortment, coupled with promotional activities such as discounts, bundling deals, and point-of-sale displays, enhances the appeal of convenience stores as preferred destinations for purchasing energy drinks.
Looking ahead, the dominance of Convenience Stores in the Healthy Energy Drink Market's Distribution Channel segment is poised to persist, fueled by ongoing urbanization trends, changing consumer lifestyles, and convenience-driven shopping behavior. Manufacturers are expected to continue leveraging convenience stores as key distribution partners, investing in collaborative marketing initiatives and innovative merchandising strategies to maintain their competitive edge and capitalize on evolving consumer preferences.
Key Market Segments
By Type
- Traditional Health
- Natural/Organic
- Functional
- Sports Performance
- Low-Calorie
- Others
By Packaging Type
- Glass Bottles
- Metal Can
- PET Bottles
By Format
- Shots
- Powder
- Ready-To-Drink (RTD)
By End User
- Kids
- Adults
- Teenagers
By Distribution Channel
- Convenience Stores
- Online Retail
- Supermarket/Hypermarket
- Others
Growth Opportunity
Expansion into Emerging Markets Drives Growth
The global healthy energy drink market witnessed promising growth opportunities in 2023, primarily fueled by strategic expansions into emerging markets characterized by a burgeoning health-conscious demographic. This shift reflects a paradigmatic evolution in consumer preferences, with discerning individuals seeking healthier alternatives to traditional energy beverages.
Market players capitalized on this trend by penetrating untapped territories, leveraging the rising awareness of health benefits associated with their products. Such strategic maneuvers not only expanded market reach but also diversified revenue streams, mitigating risks associated with saturation in established markets.
Innovation in Formulations and Packaging
Innovation emerged as a cornerstone for market growth in 2023, with significant investments directed towards enhancing product formulations and packaging. Market leaders prioritized research and development initiatives aimed at concocting novel blends enriched with natural ingredients, catering to evolving consumer demands for healthier options devoid of artificial additives.
Additionally, packaging innovations played a pivotal role in captivating consumer interest, with emphasis placed on sustainability, convenience, and aesthetics. Sleek, eco-friendly designs not only resonated with environmentally-conscious consumers but also conveyed a premium image, fostering brand loyalty and consumer trust.
Latest Trends
Clean Label and Transparent Sourcing: A Dominant Trend
The global healthy energy drink market in 2023 witnessed a significant shift towards clean label and transparent ingredient sourcing, representing a dominant trend reshaping consumer preferences and industry standards. Increasingly health-conscious consumers, discerning about what they consume, demanded products with easily recognizable, natural ingredients and clear sourcing practices.
Market players responded by reformulating their offerings, eliminating artificial additives, preservatives, and sweeteners, and emphasizing the use of organic, non-GMO ingredients. This transition towards cleaner labels not only appealed to health-conscious consumers but also bolstered brand trust and loyalty, positioning companies as transparent and ethical stewards of consumer well-being.
Rising Popularity of Plant-based and Adaptogenic Ingredients
Another noteworthy trend shaping the global healthy energy drink market in 2023 was the rising popularity of plant-based and adaptogenic ingredients. As consumers increasingly sought holistic wellness solutions, they gravitated towards beverages fortified with botanical extracts known for their health-promoting properties.
Market leaders capitalized on this trend by incorporating ingredients such as ginseng, ashwagandha, and turmeric, renowned for their adaptogenic properties, which help the body adapt to stress and promote overall well-being. Moreover, the surge in demand for plant-based lifestyles propelled the adoption of ingredients like coconut water, green tea, and fruit juices, further enhancing the nutritional profile of energy drinks while catering to diverse dietary preferences.
Regional Analysis
The healthy energy drink market in North America has grown by 36.5% according to recent market analysis.
The Healthy Energy Drink market exhibits a robust growth trajectory across diverse regions, including North America, Europe, Asia Pacific, Middle East & Africa, and Latin America. North America emerges as a dominant force in this market landscape, with a remarkable growth rate of 36.5% over the past fiscal year, indicative of the region's strong consumer demand and favorable regulatory environment. In North America, the rising health consciousness among consumers, coupled with a growing preference for natural and functional beverages, has propelled the demand for healthy energy drinks.
In Europe, a similar trend is observed, with consumers increasingly seeking healthier alternatives to traditional energy drinks, thereby driving significant market growth. The region benefits from a well-established market infrastructure and a growing number of health-conscious consumers, contributing to the expansion of the healthy energy drink segment.
The Asia Pacific region presents substantial growth opportunities for the healthy energy drink market, fueled by increasing urbanization, rising disposable incomes, and changing lifestyle patterns among consumers. With a large and diverse consumer base, coupled with a growing awareness regarding health and wellness, Asia Pacific emerges as a key market for healthy energy drinks, experiencing significant growth in recent years.
In the Middle East & Africa and Latin America regions, the healthy energy drink market is also witnessing steady growth, propelled by factors such as changing consumer preferences, urbanization, and increasing health awareness. While these regions may have unique market dynamics and challenges, they represent emerging markets with untapped potential for healthy energy drink manufacturers.
Key Regions and Countries
North America
- The US
- Canada
- Rest of North America
Europe
- Germany
- France
- The UK
- Spain
- Netherlands
- Russia
- Italy
- Rest of Europe
Asia-Pacific
- China
- Japan
- Singapore
- Thailand
- South Korea
- Vietnam
- India
- New Zealand
- Rest of Asia Pacific
Latin America
- Mexico
- Brazil
- Rest of Latin America
Middle East & Africa
- Saudi Arabia
- South Africa
- UAE
- Rest of Middle East & Africa
Key Players Analysis
In the thriving landscape of the global Healthy Energy Drink Market in 2023, several key players have emerged as frontrunners, each contributing uniquely to the industry's growth and dynamics. Among these prominent entities are Aspire Drinks, RITA Food & Drink Co., Ltd., Jouleshealth Enterprise Pvt Ltd., RVIITA, Jeunesse, Unicity, Le-vel, Amway, Vemma Retail, Better Body Company, and ZOA Energy.
These companies exhibit diverse strategies and product offerings, catering to the evolving preferences of health-conscious consumers worldwide. Aspire Drinks, for instance, is recognized for its commitment to natural ingredients and innovative formulations, positioning itself as a pioneer in the healthy energy segment. Similarly, RITA Food & Drink Co., Ltd., and Jouleshealth Enterprise Pvt Ltd., leverage their expertise in beverage manufacturing to introduce nutritious alternatives to traditional energy drinks.
Moreover, brands like RVIITA and ZOA Energy capitalize on the rising demand for functional beverages by incorporating botanical extracts and vitamins into their product lines, appealing to consumers seeking holistic wellness solutions. Jeunesse and Unicity, with their established presence in the wellness industry, offer credibility and reliability, further bolstering the market's expansion.
As the global population increasingly prioritizes health and wellness, companies like Le-vel, Amway, Vemma Retail, and Better Body Company seize the opportunity to promote healthy lifestyles through their diverse product portfolios and robust distribution networks.
In essence, the presence of these key players underscores the dynamism and potential of the Healthy Energy Drink Market in 2023. Their innovative approaches, coupled with a commitment to quality and consumer well-being, position them as pivotal influencers shaping the trajectory of the industry.
Market Key Players
- Aspire Drinks
- RITA Food & Drink Co.,Ltd
- Jouleshealth Enterprise Pvt Ltd.
- RVIITA
- Jeunesse
- Unicity
- Le-vel
- Amway
- Vemma Retail
- Better Body Company
- ZOA Energy
Recent Development
- In May 2023, Ingredient suppliers like Florida Food Products and Van Drunen Farms/FutureCeuticals are innovating with natural caffeine sources from coffee and tea, offering benefits like reduced acidity and additional health perks.
- In August 2018, Leading energy drink brands are innovating with cleaner, organic ingredients like matcha and cascara to address health concerns and boost sales. Red Bull's 'Organics' range and MatchaBar's carbonated matcha drink reflect this trend.
Report Scope
Report Features Description Market Value (2023) USD 793 Million Forecast Revenue (2033) USD 2012 Billion CAGR (2024-2032) 11.40 Base Year for Estimation 2023 Historic Period 2016-2023 Forecast Period 2024-2033 Report Coverage Revenue Forecast, Market Dynamics, COVID-19 Impact, Competitive Landscape, Recent Developments Segments Covered By Type(Traditional Health, Natural/Organic, Functional, Sports Performance, Low-Calorie, Others), By Packaging Type(Glass Bottles, Metal Can, PET Bottles), By Format(Shots, Powder, Ready-To-Drink (RTD)), By End User(Kids, Adults, Teenagers), By Distribution Channel(Convenience Stores, Online Retail, Supermarket/Hypermarket, Others) Regional Analysis North America - The US, Canada, Rest of North America, Europe - Germany, France, The UK, Spain, Italy, Russia, Netherlands, Rest of Europe, Asia-Pacific - China, Japan, South Korea, India, New Zealand, Singapore, Thailand, Vietnam, Rest of Asia Pacific, Latin America - Brazil, Mexico, Rest of Latin America, Middle East & Africa - South Africa, Saudi Arabia, UAE, Rest of Middle East & Africa Competitive Landscape Aspire Drinks, RITA Food & Drink Co.,Ltd, Jouleshealth Enterprise Pvt Ltd., RVIITA, Jeunesse, Unicity, Le-vel, Amway, Vemma Retail, Better Body Company, ZOA Energy Customization Scope Customization for segments, region/country-level will be provided. Moreover, additional customization can be done based on the requirements. Purchase Options We have three licenses to opt for Single User License, Multi-User License (Up to 5 Users), Corporate Use License (Unlimited User and Printable PDF) -
- 1. Executive Summary
- 1.1. Definition
- 1.2. Taxonomy
- 1.3. Research Scope
- 1.4. Key Analysis
- 1.5. Key Findings by Major Segments
- 1.6. Top strategies by Major Players
- 2. Global Healthy Energy Drink Market Overview
- 2.1. Healthy Energy Drink Market Dynamics
- 2.1.1. Drivers
- 2.1.2. Opportunities
- 2.1.3. Restraints
- 2.1.4. Challenges
- 2.2. Macro-economic Factors
- 2.3. Regulatory Framework
- 2.4. Market Investment Feasibility Index
- 2.5. PEST Analysis
- 2.6. PORTER’S Five Force Analysis
- 2.7. Drivers & Restraints Impact Analysis
- 2.8. Industry Chain Analysis
- 2.9. Cost Structure Analysis
- 2.10. Marketing Strategy
- 2.11. Russia-Ukraine War Impact Analysis
- 2.12. Opportunity Map Analysis
- 2.13. Market Competition Scenario Analysis
- 2.14. Product Life Cycle Analysis
- 2.15. Opportunity Orbits
- 2.16. Manufacturer Intensity Map
- 2.17. Major Companies sales by Value & Volume
- 2.1. Healthy Energy Drink Market Dynamics
- 3. Global Healthy Energy Drink Market Analysis, Opportunity and Forecast, 2016-2032
- 3.1. Global Healthy Energy Drink Market Analysis, 2016-2021
- 3.2. Global Healthy Energy Drink Market Opportunity and Forecast, 2023-2032
- 3.3. Global Healthy Energy Drink Market Analysis, Opportunity and Forecast, By By Type , 2016-2032
- 3.3.1. Global Healthy Energy Drink Market Analysis by By Type : Introduction
- 3.3.2. Market Size Absolute $ Opportunity Analysis and Forecast, By By Type , 2016-2032
- 3.3.3. Traditional Health
- 3.3.4. Natural/Organic
- 3.3.5. Functional
- 3.3.6. Sports Performance
- 3.3.7. Low-Calorie
- 3.3.8. Others
- 3.4. Global Healthy Energy Drink Market Analysis, Opportunity and Forecast, By By Packaging Type, 2016-2032
- 3.4.1. Global Healthy Energy Drink Market Analysis by By Packaging Type: Introduction
- 3.4.2. Market Size Absolute $ Opportunity Analysis and Forecast, By By Packaging Type, 2016-2032
- 3.4.3. Glass Bottles
- 3.4.4. Metal Can
- 3.4.5. PET Bottles
- 3.5. Global Healthy Energy Drink Market Analysis, Opportunity and Forecast, By By Format, 2016-2032
- 3.5.1. Global Healthy Energy Drink Market Analysis by By Format: Introduction
- 3.5.2. Market Size Absolute $ Opportunity Analysis and Forecast, By By Format, 2016-2032
- 3.5.3. Shots
- 3.5.4. Powder
- 3.5.5. Ready-To-Drink (RTD)
- 3.6. Global Healthy Energy Drink Market Analysis, Opportunity and Forecast, By By End User, 2016-2032
- 3.6.1. Global Healthy Energy Drink Market Analysis by By End User: Introduction
- 3.6.2. Market Size Absolute $ Opportunity Analysis and Forecast, By By End User, 2016-2032
- 3.6.3. Kids
- 3.6.4. Adults
- 3.6.5. Teenagers
- 3.7. Global Healthy Energy Drink Market Analysis, Opportunity and Forecast, By By Distribution Channel, 2016-2032
- 3.7.1. Global Healthy Energy Drink Market Analysis by By Distribution Channel: Introduction
- 3.7.2. Market Size Absolute $ Opportunity Analysis and Forecast, By By Distribution Channel, 2016-2032
- 3.7.3. Convenience Stores
- 3.7.4. Online Retail
- 3.7.5. Supermarket/Hypermarket
- 3.7.6. Others
- 4. North America Healthy Energy Drink Market Analysis, Opportunity and Forecast, 2016-2032
- 4.1. North America Healthy Energy Drink Market Analysis, 2016-2021
- 4.2. North America Healthy Energy Drink Market Opportunity and Forecast, 2023-2032
- 4.3. North America Healthy Energy Drink Market Analysis, Opportunity and Forecast, By By Type , 2016-2032
- 4.3.1. North America Healthy Energy Drink Market Analysis by By Type : Introduction
- 4.3.2. Market Size Absolute $ Opportunity Analysis and Forecast, By By Type , 2016-2032
- 4.3.3. Traditional Health
- 4.3.4. Natural/Organic
- 4.3.5. Functional
- 4.3.6. Sports Performance
- 4.3.7. Low-Calorie
- 4.3.8. Others
- 4.4. North America Healthy Energy Drink Market Analysis, Opportunity and Forecast, By By Packaging Type, 2016-2032
- 4.4.1. North America Healthy Energy Drink Market Analysis by By Packaging Type: Introduction
- 4.4.2. Market Size Absolute $ Opportunity Analysis and Forecast, By By Packaging Type, 2016-2032
- 4.4.3. Glass Bottles
- 4.4.4. Metal Can
- 4.4.5. PET Bottles
- 4.5. North America Healthy Energy Drink Market Analysis, Opportunity and Forecast, By By Format, 2016-2032
- 4.5.1. North America Healthy Energy Drink Market Analysis by By Format: Introduction
- 4.5.2. Market Size Absolute $ Opportunity Analysis and Forecast, By By Format, 2016-2032
- 4.5.3. Shots
- 4.5.4. Powder
- 4.5.5. Ready-To-Drink (RTD)
- 4.6. North America Healthy Energy Drink Market Analysis, Opportunity and Forecast, By By End User, 2016-2032
- 4.6.1. North America Healthy Energy Drink Market Analysis by By End User: Introduction
- 4.6.2. Market Size Absolute $ Opportunity Analysis and Forecast, By By End User, 2016-2032
- 4.6.3. Kids
- 4.6.4. Adults
- 4.6.5. Teenagers
- 4.7. North America Healthy Energy Drink Market Analysis, Opportunity and Forecast, By By Distribution Channel, 2016-2032
- 4.7.1. North America Healthy Energy Drink Market Analysis by By Distribution Channel: Introduction
- 4.7.2. Market Size Absolute $ Opportunity Analysis and Forecast, By By Distribution Channel, 2016-2032
- 4.7.3. Convenience Stores
- 4.7.4. Online Retail
- 4.7.5. Supermarket/Hypermarket
- 4.7.6. Others
- 4.8. North America Healthy Energy Drink Market Analysis, Opportunity and Forecast, By Country , 2016-2032
- 4.8.1. North America Healthy Energy Drink Market Analysis by Country : Introduction
- 4.8.2. Market Size Absolute $ Opportunity Analysis and Forecast, Country , 2016-2032
- 4.8.2.1. The US
- 4.8.2.2. Canada
- 4.8.2.3. Mexico
- 5. Western Europe Healthy Energy Drink Market Analysis, Opportunity and Forecast, 2016-2032
- 5.1. Western Europe Healthy Energy Drink Market Analysis, 2016-2021
- 5.2. Western Europe Healthy Energy Drink Market Opportunity and Forecast, 2023-2032
- 5.3. Western Europe Healthy Energy Drink Market Analysis, Opportunity and Forecast, By By Type , 2016-2032
- 5.3.1. Western Europe Healthy Energy Drink Market Analysis by By Type : Introduction
- 5.3.2. Market Size Absolute $ Opportunity Analysis and Forecast, By By Type , 2016-2032
- 5.3.3. Traditional Health
- 5.3.4. Natural/Organic
- 5.3.5. Functional
- 5.3.6. Sports Performance
- 5.3.7. Low-Calorie
- 5.3.8. Others
- 5.4. Western Europe Healthy Energy Drink Market Analysis, Opportunity and Forecast, By By Packaging Type, 2016-2032
- 5.4.1. Western Europe Healthy Energy Drink Market Analysis by By Packaging Type: Introduction
- 5.4.2. Market Size Absolute $ Opportunity Analysis and Forecast, By By Packaging Type, 2016-2032
- 5.4.3. Glass Bottles
- 5.4.4. Metal Can
- 5.4.5. PET Bottles
- 5.5. Western Europe Healthy Energy Drink Market Analysis, Opportunity and Forecast, By By Format, 2016-2032
- 5.5.1. Western Europe Healthy Energy Drink Market Analysis by By Format: Introduction
- 5.5.2. Market Size Absolute $ Opportunity Analysis and Forecast, By By Format, 2016-2032
- 5.5.3. Shots
- 5.5.4. Powder
- 5.5.5. Ready-To-Drink (RTD)
- 5.6. Western Europe Healthy Energy Drink Market Analysis, Opportunity and Forecast, By By End User, 2016-2032
- 5.6.1. Western Europe Healthy Energy Drink Market Analysis by By End User: Introduction
- 5.6.2. Market Size Absolute $ Opportunity Analysis and Forecast, By By End User, 2016-2032
- 5.6.3. Kids
- 5.6.4. Adults
- 5.6.5. Teenagers
- 5.7. Western Europe Healthy Energy Drink Market Analysis, Opportunity and Forecast, By By Distribution Channel, 2016-2032
- 5.7.1. Western Europe Healthy Energy Drink Market Analysis by By Distribution Channel: Introduction
- 5.7.2. Market Size Absolute $ Opportunity Analysis and Forecast, By By Distribution Channel, 2016-2032
- 5.7.3. Convenience Stores
- 5.7.4. Online Retail
- 5.7.5. Supermarket/Hypermarket
- 5.7.6. Others
- 5.8. Western Europe Healthy Energy Drink Market Analysis, Opportunity and Forecast, By Country , 2016-2032
- 5.8.1. Western Europe Healthy Energy Drink Market Analysis by Country : Introduction
- 5.8.2. Market Size Absolute $ Opportunity Analysis and Forecast, Country , 2016-2032
- 5.8.2.1. Germany
- 5.8.2.2. France
- 5.8.2.3. The UK
- 5.8.2.4. Spain
- 5.8.2.5. Italy
- 5.8.2.6. Portugal
- 5.8.2.7. Ireland
- 5.8.2.8. Austria
- 5.8.2.9. Switzerland
- 5.8.2.10. Benelux
- 5.8.2.11. Nordic
- 5.8.2.12. Rest of Western Europe
- 6. Eastern Europe Healthy Energy Drink Market Analysis, Opportunity and Forecast, 2016-2032
- 6.1. Eastern Europe Healthy Energy Drink Market Analysis, 2016-2021
- 6.2. Eastern Europe Healthy Energy Drink Market Opportunity and Forecast, 2023-2032
- 6.3. Eastern Europe Healthy Energy Drink Market Analysis, Opportunity and Forecast, By By Type , 2016-2032
- 6.3.1. Eastern Europe Healthy Energy Drink Market Analysis by By Type : Introduction
- 6.3.2. Market Size Absolute $ Opportunity Analysis and Forecast, By By Type , 2016-2032
- 6.3.3. Traditional Health
- 6.3.4. Natural/Organic
- 6.3.5. Functional
- 6.3.6. Sports Performance
- 6.3.7. Low-Calorie
- 6.3.8. Others
- 6.4. Eastern Europe Healthy Energy Drink Market Analysis, Opportunity and Forecast, By By Packaging Type, 2016-2032
- 6.4.1. Eastern Europe Healthy Energy Drink Market Analysis by By Packaging Type: Introduction
- 6.4.2. Market Size Absolute $ Opportunity Analysis and Forecast, By By Packaging Type, 2016-2032
- 6.4.3. Glass Bottles
- 6.4.4. Metal Can
- 6.4.5. PET Bottles
- 6.5. Eastern Europe Healthy Energy Drink Market Analysis, Opportunity and Forecast, By By Format, 2016-2032
- 6.5.1. Eastern Europe Healthy Energy Drink Market Analysis by By Format: Introduction
- 6.5.2. Market Size Absolute $ Opportunity Analysis and Forecast, By By Format, 2016-2032
- 6.5.3. Shots
- 6.5.4. Powder
- 6.5.5. Ready-To-Drink (RTD)
- 6.6. Eastern Europe Healthy Energy Drink Market Analysis, Opportunity and Forecast, By By End User, 2016-2032
- 6.6.1. Eastern Europe Healthy Energy Drink Market Analysis by By End User: Introduction
- 6.6.2. Market Size Absolute $ Opportunity Analysis and Forecast, By By End User, 2016-2032
- 6.6.3. Kids
- 6.6.4. Adults
- 6.6.5. Teenagers
- 6.7. Eastern Europe Healthy Energy Drink Market Analysis, Opportunity and Forecast, By By Distribution Channel, 2016-2032
- 6.7.1. Eastern Europe Healthy Energy Drink Market Analysis by By Distribution Channel: Introduction
- 6.7.2. Market Size Absolute $ Opportunity Analysis and Forecast, By By Distribution Channel, 2016-2032
- 6.7.3. Convenience Stores
- 6.7.4. Online Retail
- 6.7.5. Supermarket/Hypermarket
- 6.7.6. Others
- 6.8. Eastern Europe Healthy Energy Drink Market Analysis, Opportunity and Forecast, By Country , 2016-2032
- 6.8.1. Eastern Europe Healthy Energy Drink Market Analysis by Country : Introduction
- 6.8.2. Market Size Absolute $ Opportunity Analysis and Forecast, Country , 2016-2032
- 6.8.2.1. Russia
- 6.8.2.2. Poland
- 6.8.2.3. The Czech Republic
- 6.8.2.4. Greece
- 6.8.2.5. Rest of Eastern Europe
- 7. APAC Healthy Energy Drink Market Analysis, Opportunity and Forecast, 2016-2032
- 7.1. APAC Healthy Energy Drink Market Analysis, 2016-2021
- 7.2. APAC Healthy Energy Drink Market Opportunity and Forecast, 2023-2032
- 7.3. APAC Healthy Energy Drink Market Analysis, Opportunity and Forecast, By By Type , 2016-2032
- 7.3.1. APAC Healthy Energy Drink Market Analysis by By Type : Introduction
- 7.3.2. Market Size Absolute $ Opportunity Analysis and Forecast, By By Type , 2016-2032
- 7.3.3. Traditional Health
- 7.3.4. Natural/Organic
- 7.3.5. Functional
- 7.3.6. Sports Performance
- 7.3.7. Low-Calorie
- 7.3.8. Others
- 7.4. APAC Healthy Energy Drink Market Analysis, Opportunity and Forecast, By By Packaging Type, 2016-2032
- 7.4.1. APAC Healthy Energy Drink Market Analysis by By Packaging Type: Introduction
- 7.4.2. Market Size Absolute $ Opportunity Analysis and Forecast, By By Packaging Type, 2016-2032
- 7.4.3. Glass Bottles
- 7.4.4. Metal Can
- 7.4.5. PET Bottles
- 7.5. APAC Healthy Energy Drink Market Analysis, Opportunity and Forecast, By By Format, 2016-2032
- 7.5.1. APAC Healthy Energy Drink Market Analysis by By Format: Introduction
- 7.5.2. Market Size Absolute $ Opportunity Analysis and Forecast, By By Format, 2016-2032
- 7.5.3. Shots
- 7.5.4. Powder
- 7.5.5. Ready-To-Drink (RTD)
- 7.6. APAC Healthy Energy Drink Market Analysis, Opportunity and Forecast, By By End User, 2016-2032
- 7.6.1. APAC Healthy Energy Drink Market Analysis by By End User: Introduction
- 7.6.2. Market Size Absolute $ Opportunity Analysis and Forecast, By By End User, 2016-2032
- 7.6.3. Kids
- 7.6.4. Adults
- 7.6.5. Teenagers
- 7.7. APAC Healthy Energy Drink Market Analysis, Opportunity and Forecast, By By Distribution Channel, 2016-2032
- 7.7.1. APAC Healthy Energy Drink Market Analysis by By Distribution Channel: Introduction
- 7.7.2. Market Size Absolute $ Opportunity Analysis and Forecast, By By Distribution Channel, 2016-2032
- 7.7.3. Convenience Stores
- 7.7.4. Online Retail
- 7.7.5. Supermarket/Hypermarket
- 7.7.6. Others
- 7.8. APAC Healthy Energy Drink Market Analysis, Opportunity and Forecast, By Country , 2016-2032
- 7.8.1. APAC Healthy Energy Drink Market Analysis by Country : Introduction
- 7.8.2. Market Size Absolute $ Opportunity Analysis and Forecast, Country , 2016-2032
- 7.8.2.1. China
- 7.8.2.2. Japan
- 7.8.2.3. South Korea
- 7.8.2.4. India
- 7.8.2.5. Australia & New Zeland
- 7.8.2.6. Indonesia
- 7.8.2.7. Malaysia
- 7.8.2.8. Philippines
- 7.8.2.9. Singapore
- 7.8.2.10. Thailand
- 7.8.2.11. Vietnam
- 7.8.2.12. Rest of APAC
- 8. Latin America Healthy Energy Drink Market Analysis, Opportunity and Forecast, 2016-2032
- 8.1. Latin America Healthy Energy Drink Market Analysis, 2016-2021
- 8.2. Latin America Healthy Energy Drink Market Opportunity and Forecast, 2023-2032
- 8.3. Latin America Healthy Energy Drink Market Analysis, Opportunity and Forecast, By By Type , 2016-2032
- 8.3.1. Latin America Healthy Energy Drink Market Analysis by By Type : Introduction
- 8.3.2. Market Size Absolute $ Opportunity Analysis and Forecast, By By Type , 2016-2032
- 8.3.3. Traditional Health
- 8.3.4. Natural/Organic
- 8.3.5. Functional
- 8.3.6. Sports Performance
- 8.3.7. Low-Calorie
- 8.3.8. Others
- 8.4. Latin America Healthy Energy Drink Market Analysis, Opportunity and Forecast, By By Packaging Type, 2016-2032
- 8.4.1. Latin America Healthy Energy Drink Market Analysis by By Packaging Type: Introduction
- 8.4.2. Market Size Absolute $ Opportunity Analysis and Forecast, By By Packaging Type, 2016-2032
- 8.4.3. Glass Bottles
- 8.4.4. Metal Can
- 8.4.5. PET Bottles
- 8.5. Latin America Healthy Energy Drink Market Analysis, Opportunity and Forecast, By By Format, 2016-2032
- 8.5.1. Latin America Healthy Energy Drink Market Analysis by By Format: Introduction
- 8.5.2. Market Size Absolute $ Opportunity Analysis and Forecast, By By Format, 2016-2032
- 8.5.3. Shots
- 8.5.4. Powder
- 8.5.5. Ready-To-Drink (RTD)
- 8.6. Latin America Healthy Energy Drink Market Analysis, Opportunity and Forecast, By By End User, 2016-2032
- 8.6.1. Latin America Healthy Energy Drink Market Analysis by By End User: Introduction
- 8.6.2. Market Size Absolute $ Opportunity Analysis and Forecast, By By End User, 2016-2032
- 8.6.3. Kids
- 8.6.4. Adults
- 8.6.5. Teenagers
- 8.7. Latin America Healthy Energy Drink Market Analysis, Opportunity and Forecast, By By Distribution Channel, 2016-2032
- 8.7.1. Latin America Healthy Energy Drink Market Analysis by By Distribution Channel: Introduction
- 8.7.2. Market Size Absolute $ Opportunity Analysis and Forecast, By By Distribution Channel, 2016-2032
- 8.7.3. Convenience Stores
- 8.7.4. Online Retail
- 8.7.5. Supermarket/Hypermarket
- 8.7.6. Others
- 8.8. Latin America Healthy Energy Drink Market Analysis, Opportunity and Forecast, By Country , 2016-2032
- 8.8.1. Latin America Healthy Energy Drink Market Analysis by Country : Introduction
- 8.8.2. Market Size Absolute $ Opportunity Analysis and Forecast, Country , 2016-2032
- 8.8.2.1. Brazil
- 8.8.2.2. Colombia
- 8.8.2.3. Chile
- 8.8.2.4. Argentina
- 8.8.2.5. Costa Rica
- 8.8.2.6. Rest of Latin America
- 9. Middle East & Africa Healthy Energy Drink Market Analysis, Opportunity and Forecast, 2016-2032
- 9.1. Middle East & Africa Healthy Energy Drink Market Analysis, 2016-2021
- 9.2. Middle East & Africa Healthy Energy Drink Market Opportunity and Forecast, 2023-2032
- 9.3. Middle East & Africa Healthy Energy Drink Market Analysis, Opportunity and Forecast, By By Type , 2016-2032
- 9.3.1. Middle East & Africa Healthy Energy Drink Market Analysis by By Type : Introduction
- 9.3.2. Market Size Absolute $ Opportunity Analysis and Forecast, By By Type , 2016-2032
- 9.3.3. Traditional Health
- 9.3.4. Natural/Organic
- 9.3.5. Functional
- 9.3.6. Sports Performance
- 9.3.7. Low-Calorie
- 9.3.8. Others
- 9.4. Middle East & Africa Healthy Energy Drink Market Analysis, Opportunity and Forecast, By By Packaging Type, 2016-2032
- 9.4.1. Middle East & Africa Healthy Energy Drink Market Analysis by By Packaging Type: Introduction
- 9.4.2. Market Size Absolute $ Opportunity Analysis and Forecast, By By Packaging Type, 2016-2032
- 9.4.3. Glass Bottles
- 9.4.4. Metal Can
- 9.4.5. PET Bottles
- 9.5. Middle East & Africa Healthy Energy Drink Market Analysis, Opportunity and Forecast, By By Format, 2016-2032
- 9.5.1. Middle East & Africa Healthy Energy Drink Market Analysis by By Format: Introduction
- 9.5.2. Market Size Absolute $ Opportunity Analysis and Forecast, By By Format, 2016-2032
- 9.5.3. Shots
- 9.5.4. Powder
- 9.5.5. Ready-To-Drink (RTD)
- 9.6. Middle East & Africa Healthy Energy Drink Market Analysis, Opportunity and Forecast, By By End User, 2016-2032
- 9.6.1. Middle East & Africa Healthy Energy Drink Market Analysis by By End User: Introduction
- 9.6.2. Market Size Absolute $ Opportunity Analysis and Forecast, By By End User, 2016-2032
- 9.6.3. Kids
- 9.6.4. Adults
- 9.6.5. Teenagers
- 9.7. Middle East & Africa Healthy Energy Drink Market Analysis, Opportunity and Forecast, By By Distribution Channel, 2016-2032
- 9.7.1. Middle East & Africa Healthy Energy Drink Market Analysis by By Distribution Channel: Introduction
- 9.7.2. Market Size Absolute $ Opportunity Analysis and Forecast, By By Distribution Channel, 2016-2032
- 9.7.3. Convenience Stores
- 9.7.4. Online Retail
- 9.7.5. Supermarket/Hypermarket
- 9.7.6. Others
- 9.8. Middle East & Africa Healthy Energy Drink Market Analysis, Opportunity and Forecast, By Country , 2016-2032
- 9.8.1. Middle East & Africa Healthy Energy Drink Market Analysis by Country : Introduction
- 9.8.2. Market Size Absolute $ Opportunity Analysis and Forecast, Country , 2016-2032
- 9.8.2.1. Algeria
- 9.8.2.2. Egypt
- 9.8.2.3. Israel
- 9.8.2.4. Kuwait
- 9.8.2.5. Nigeria
- 9.8.2.6. Saudi Arabia
- 9.8.2.7. South Africa
- 9.8.2.8. Turkey
- 9.8.2.9. The UAE
- 9.8.2.10. Rest of MEA
- 10. Global Healthy Energy Drink Market Analysis, Opportunity and Forecast, By Region , 2016-2032
- 10.1. Global Healthy Energy Drink Market Analysis by Region : Introduction
- 10.2. Market Size Absolute $ Opportunity Analysis and Forecast, By Region , 2016-2032
- 10.2.1. North America
- 10.2.2. Western Europe
- 10.2.3. Eastern Europe
- 10.2.4. APAC
- 10.2.5. Latin America
- 10.2.6. Middle East & Africa
- 11. Global Healthy Energy Drink Market Competitive Landscape, Market Share Analysis, and Company Profiles
- 11.1. Market Share Analysis
- 11.2. Company Profiles
- 11.3. Aspire Drinks
- 11.3.1. Company Overview
- 11.3.2. Financial Highlights
- 11.3.3. Product Portfolio
- 11.3.4. SWOT Analysis
- 11.3.5. Key Strategies and Developments
- 11.4. RITA Food & Drink Co.,Ltd
- 11.4.1. Company Overview
- 11.4.2. Financial Highlights
- 11.4.3. Product Portfolio
- 11.4.4. SWOT Analysis
- 11.4.5. Key Strategies and Developments
- 11.5. Jouleshealth Enterprise Pvt Ltd.
- 11.5.1. Company Overview
- 11.5.2. Financial Highlights
- 11.5.3. Product Portfolio
- 11.5.4. SWOT Analysis
- 11.5.5. Key Strategies and Developments
- 11.6. RVIITA
- 11.6.1. Company Overview
- 11.6.2. Financial Highlights
- 11.6.3. Product Portfolio
- 11.6.4. SWOT Analysis
- 11.6.5. Key Strategies and Developments
- 11.7. Jeunesse
- 11.7.1. Company Overview
- 11.7.2. Financial Highlights
- 11.7.3. Product Portfolio
- 11.7.4. SWOT Analysis
- 11.7.5. Key Strategies and Developments
- 11.8. Unicity
- 11.8.1. Company Overview
- 11.8.2. Financial Highlights
- 11.8.3. Product Portfolio
- 11.8.4. SWOT Analysis
- 11.8.5. Key Strategies and Developments
- 11.9. Le-vel
- 11.9.1. Company Overview
- 11.9.2. Financial Highlights
- 11.9.3. Product Portfolio
- 11.9.4. SWOT Analysis
- 11.9.5. Key Strategies and Developments
- 11.10. Amway
- 11.10.1. Company Overview
- 11.10.2. Financial Highlights
- 11.10.3. Product Portfolio
- 11.10.4. SWOT Analysis
- 11.10.5. Key Strategies and Developments
- 11.11. Vemma Retail
- 11.11.1. Company Overview
- 11.11.2. Financial Highlights
- 11.11.3. Product Portfolio
- 11.11.4. SWOT Analysis
- 11.11.5. Key Strategies and Developments
- 11.12. Better Body Company
- 11.12.1. Company Overview
- 11.12.2. Financial Highlights
- 11.12.3. Product Portfolio
- 11.12.4. SWOT Analysis
- 11.12.5. Key Strategies and Developments
- 11.13.1. Company Overview
- 11.13.2. Financial Highlights
- 11.13.3. Product Portfolio
- 11.13.4. SWOT Analysis
- 11.13.5. Key Strategies and Developments
- 11.14. ZOA Energy
- 11.14.1. Company Overview
- 11.14.2. Financial Highlights
- 11.14.3. Product Portfolio
- 11.14.4. SWOT Analysis
- 11.14.5. Key Strategies and Developments
- 12. Assumptions and Acronyms
- 13. Research Methodology
- 14. Contact
"
- List of Figures
- "
- Figure 1: Global Healthy Energy Drink Market Revenue (US$ Mn) Market Share by By Type in 2022
- Figure 2: Global Healthy Energy Drink Market Market Attractiveness Analysis by By Type , 2016-2032
- Figure 3: Global Healthy Energy Drink Market Revenue (US$ Mn) Market Share by By Packaging Typein 2022
- Figure 4: Global Healthy Energy Drink Market Market Attractiveness Analysis by By Packaging Type, 2016-2032
- Figure 5: Global Healthy Energy Drink Market Revenue (US$ Mn) Market Share by By Formatin 2022
- Figure 6: Global Healthy Energy Drink Market Market Attractiveness Analysis by By Format, 2016-2032
- Figure 7: Global Healthy Energy Drink Market Revenue (US$ Mn) Market Share by By End Userin 2022
- Figure 8: Global Healthy Energy Drink Market Market Attractiveness Analysis by By End User, 2016-2032
- Figure 9: Global Healthy Energy Drink Market Revenue (US$ Mn) Market Share by By Distribution Channelin 2022
- Figure 10: Global Healthy Energy Drink Market Market Attractiveness Analysis by By Distribution Channel, 2016-2032
- Figure 11: Global Healthy Energy Drink Market Revenue (US$ Mn) Market Share by Region in 2022
- Figure 12: Global Healthy Energy Drink Market Market Attractiveness Analysis by Region, 2016-2032
- Figure 13: Global Healthy Energy Drink Market Market Revenue (US$ Mn) (2016-2032)
- Figure 14: Global Healthy Energy Drink Market Market Revenue (US$ Mn) Comparison by Region (2016-2032)
- Figure 15: Global Healthy Energy Drink Market Market Revenue (US$ Mn) Comparison by By Type (2016-2032)
- Figure 16: Global Healthy Energy Drink Market Market Revenue (US$ Mn) Comparison by By Packaging Type (2016-2032)
- Figure 17: Global Healthy Energy Drink Market Market Revenue (US$ Mn) Comparison by By Format (2016-2032)
- Figure 18: Global Healthy Energy Drink Market Market Revenue (US$ Mn) Comparison by By End User (2016-2032)
- Figure 19: Global Healthy Energy Drink Market Market Revenue (US$ Mn) Comparison by By Distribution Channel (2016-2032)
- Figure 20: Global Healthy Energy Drink Market Market Y-o-Y Growth Rate Comparison by Region (2016-2032)
- Figure 21: Global Healthy Energy Drink Market Market Y-o-Y Growth Rate Comparison by By Type (2016-2032)
- Figure 22: Global Healthy Energy Drink Market Market Y-o-Y Growth Rate Comparison by By Packaging Type (2016-2032)
- Figure 23: Global Healthy Energy Drink Market Market Y-o-Y Growth Rate Comparison by By Format (2016-2032)
- Figure 24: Global Healthy Energy Drink Market Market Y-o-Y Growth Rate Comparison by By End User (2016-2032)
- Figure 25: Global Healthy Energy Drink Market Market Y-o-Y Growth Rate Comparison by By Distribution Channel (2016-2032)
- Figure 26: Global Healthy Energy Drink Market Market Share Comparison by Region (2016-2032)
- Figure 27: Global Healthy Energy Drink Market Market Share Comparison by By Type (2016-2032)
- Figure 28: Global Healthy Energy Drink Market Market Share Comparison by By Packaging Type (2016-2032)
- Figure 29: Global Healthy Energy Drink Market Market Share Comparison by By Format (2016-2032)
- Figure 30: Global Healthy Energy Drink Market Market Share Comparison by By End User (2016-2032)
- Figure 31: Global Healthy Energy Drink Market Market Share Comparison by By Distribution Channel (2016-2032)
- Figure 32: North America Healthy Energy Drink Market Revenue (US$ Mn) Market Share by By Type in 2022
- Figure 33: North America Healthy Energy Drink Market Market Attractiveness Analysis by By Type , 2016-2032
- Figure 34: North America Healthy Energy Drink Market Revenue (US$ Mn) Market Share by By Packaging Typein 2022
- Figure 35: North America Healthy Energy Drink Market Market Attractiveness Analysis by By Packaging Type, 2016-2032
- Figure 36: North America Healthy Energy Drink Market Revenue (US$ Mn) Market Share by By Formatin 2022
- Figure 37: North America Healthy Energy Drink Market Market Attractiveness Analysis by By Format, 2016-2032
- Figure 38: North America Healthy Energy Drink Market Revenue (US$ Mn) Market Share by By End Userin 2022
- Figure 39: North America Healthy Energy Drink Market Market Attractiveness Analysis by By End User, 2016-2032
- Figure 40: North America Healthy Energy Drink Market Revenue (US$ Mn) Market Share by By Distribution Channelin 2022
- Figure 41: North America Healthy Energy Drink Market Market Attractiveness Analysis by By Distribution Channel, 2016-2032
- Figure 42: North America Healthy Energy Drink Market Revenue (US$ Mn) Market Share by Country in 2022
- Figure 43: North America Healthy Energy Drink Market Market Attractiveness Analysis by Country, 2016-2032
- Figure 44: North America Healthy Energy Drink Market Market Revenue (US$ Mn) (2016-2032)
- Figure 45: North America Healthy Energy Drink Market Market Revenue (US$ Mn) Comparison by Country (2016-2032)
- Figure 46: North America Healthy Energy Drink Market Market Revenue (US$ Mn) Comparison by By Type (2016-2032)
- Figure 47: North America Healthy Energy Drink Market Market Revenue (US$ Mn) Comparison by By Packaging Type (2016-2032)
- Figure 48: North America Healthy Energy Drink Market Market Revenue (US$ Mn) Comparison by By Format (2016-2032)
- Figure 49: North America Healthy Energy Drink Market Market Revenue (US$ Mn) Comparison by By End User (2016-2032)
- Figure 50: North America Healthy Energy Drink Market Market Revenue (US$ Mn) Comparison by By Distribution Channel (2016-2032)
- Figure 51: North America Healthy Energy Drink Market Market Y-o-Y Growth Rate Comparison by Country (2016-2032)
- Figure 52: North America Healthy Energy Drink Market Market Y-o-Y Growth Rate Comparison by By Type (2016-2032)
- Figure 53: North America Healthy Energy Drink Market Market Y-o-Y Growth Rate Comparison by By Packaging Type (2016-2032)
- Figure 54: North America Healthy Energy Drink Market Market Y-o-Y Growth Rate Comparison by By Format (2016-2032)
- Figure 55: North America Healthy Energy Drink Market Market Y-o-Y Growth Rate Comparison by By End User (2016-2032)
- Figure 56: North America Healthy Energy Drink Market Market Y-o-Y Growth Rate Comparison by By Distribution Channel (2016-2032)
- Figure 57: North America Healthy Energy Drink Market Market Share Comparison by Country (2016-2032)
- Figure 58: North America Healthy Energy Drink Market Market Share Comparison by By Type (2016-2032)
- Figure 59: North America Healthy Energy Drink Market Market Share Comparison by By Packaging Type (2016-2032)
- Figure 60: North America Healthy Energy Drink Market Market Share Comparison by By Format (2016-2032)
- Figure 61: North America Healthy Energy Drink Market Market Share Comparison by By End User (2016-2032)
- Figure 62: North America Healthy Energy Drink Market Market Share Comparison by By Distribution Channel (2016-2032)
- Figure 63: Western Europe Healthy Energy Drink Market Revenue (US$ Mn) Market Share by By Type in 2022
- Figure 64: Western Europe Healthy Energy Drink Market Market Attractiveness Analysis by By Type , 2016-2032
- Figure 65: Western Europe Healthy Energy Drink Market Revenue (US$ Mn) Market Share by By Packaging Typein 2022
- Figure 66: Western Europe Healthy Energy Drink Market Market Attractiveness Analysis by By Packaging Type, 2016-2032
- Figure 67: Western Europe Healthy Energy Drink Market Revenue (US$ Mn) Market Share by By Formatin 2022
- Figure 68: Western Europe Healthy Energy Drink Market Market Attractiveness Analysis by By Format, 2016-2032
- Figure 69: Western Europe Healthy Energy Drink Market Revenue (US$ Mn) Market Share by By End Userin 2022
- Figure 70: Western Europe Healthy Energy Drink Market Market Attractiveness Analysis by By End User, 2016-2032
- Figure 71: Western Europe Healthy Energy Drink Market Revenue (US$ Mn) Market Share by By Distribution Channelin 2022
- Figure 72: Western Europe Healthy Energy Drink Market Market Attractiveness Analysis by By Distribution Channel, 2016-2032
- Figure 73: Western Europe Healthy Energy Drink Market Revenue (US$ Mn) Market Share by Country in 2022
- Figure 74: Western Europe Healthy Energy Drink Market Market Attractiveness Analysis by Country, 2016-2032
- Figure 75: Western Europe Healthy Energy Drink Market Market Revenue (US$ Mn) (2016-2032)
- Figure 76: Western Europe Healthy Energy Drink Market Market Revenue (US$ Mn) Comparison by Country (2016-2032)
- Figure 77: Western Europe Healthy Energy Drink Market Market Revenue (US$ Mn) Comparison by By Type (2016-2032)
- Figure 78: Western Europe Healthy Energy Drink Market Market Revenue (US$ Mn) Comparison by By Packaging Type (2016-2032)
- Figure 79: Western Europe Healthy Energy Drink Market Market Revenue (US$ Mn) Comparison by By Format (2016-2032)
- Figure 80: Western Europe Healthy Energy Drink Market Market Revenue (US$ Mn) Comparison by By End User (2016-2032)
- Figure 81: Western Europe Healthy Energy Drink Market Market Revenue (US$ Mn) Comparison by By Distribution Channel (2016-2032)
- Figure 82: Western Europe Healthy Energy Drink Market Market Y-o-Y Growth Rate Comparison by Country (2016-2032)
- Figure 83: Western Europe Healthy Energy Drink Market Market Y-o-Y Growth Rate Comparison by By Type (2016-2032)
- Figure 84: Western Europe Healthy Energy Drink Market Market Y-o-Y Growth Rate Comparison by By Packaging Type (2016-2032)
- Figure 85: Western Europe Healthy Energy Drink Market Market Y-o-Y Growth Rate Comparison by By Format (2016-2032)
- Figure 86: Western Europe Healthy Energy Drink Market Market Y-o-Y Growth Rate Comparison by By End User (2016-2032)
- Figure 87: Western Europe Healthy Energy Drink Market Market Y-o-Y Growth Rate Comparison by By Distribution Channel (2016-2032)
- Figure 88: Western Europe Healthy Energy Drink Market Market Share Comparison by Country (2016-2032)
- Figure 89: Western Europe Healthy Energy Drink Market Market Share Comparison by By Type (2016-2032)
- Figure 90: Western Europe Healthy Energy Drink Market Market Share Comparison by By Packaging Type (2016-2032)
- Figure 91: Western Europe Healthy Energy Drink Market Market Share Comparison by By Format (2016-2032)
- Figure 92: Western Europe Healthy Energy Drink Market Market Share Comparison by By End User (2016-2032)
- Figure 93: Western Europe Healthy Energy Drink Market Market Share Comparison by By Distribution Channel (2016-2032)
- Figure 94: Eastern Europe Healthy Energy Drink Market Revenue (US$ Mn) Market Share by By Type in 2022
- Figure 95: Eastern Europe Healthy Energy Drink Market Market Attractiveness Analysis by By Type , 2016-2032
- Figure 96: Eastern Europe Healthy Energy Drink Market Revenue (US$ Mn) Market Share by By Packaging Typein 2022
- Figure 97: Eastern Europe Healthy Energy Drink Market Market Attractiveness Analysis by By Packaging Type, 2016-2032
- Figure 98: Eastern Europe Healthy Energy Drink Market Revenue (US$ Mn) Market Share by By Formatin 2022
- Figure 99: Eastern Europe Healthy Energy Drink Market Market Attractiveness Analysis by By Format, 2016-2032
- Figure 100: Eastern Europe Healthy Energy Drink Market Revenue (US$ Mn) Market Share by By End Userin 2022
- Figure 101: Eastern Europe Healthy Energy Drink Market Market Attractiveness Analysis by By End User, 2016-2032
- Figure 102: Eastern Europe Healthy Energy Drink Market Revenue (US$ Mn) Market Share by By Distribution Channelin 2022
- Figure 103: Eastern Europe Healthy Energy Drink Market Market Attractiveness Analysis by By Distribution Channel, 2016-2032
- Figure 104: Eastern Europe Healthy Energy Drink Market Revenue (US$ Mn) Market Share by Country in 2022
- Figure 105: Eastern Europe Healthy Energy Drink Market Market Attractiveness Analysis by Country, 2016-2032
- Figure 106: Eastern Europe Healthy Energy Drink Market Market Revenue (US$ Mn) (2016-2032)
- Figure 107: Eastern Europe Healthy Energy Drink Market Market Revenue (US$ Mn) Comparison by Country (2016-2032)
- Figure 108: Eastern Europe Healthy Energy Drink Market Market Revenue (US$ Mn) Comparison by By Type (2016-2032)
- Figure 109: Eastern Europe Healthy Energy Drink Market Market Revenue (US$ Mn) Comparison by By Packaging Type (2016-2032)
- Figure 110: Eastern Europe Healthy Energy Drink Market Market Revenue (US$ Mn) Comparison by By Format (2016-2032)
- Figure 111: Eastern Europe Healthy Energy Drink Market Market Revenue (US$ Mn) Comparison by By End User (2016-2032)
- Figure 112: Eastern Europe Healthy Energy Drink Market Market Revenue (US$ Mn) Comparison by By Distribution Channel (2016-2032)
- Figure 113: Eastern Europe Healthy Energy Drink Market Market Y-o-Y Growth Rate Comparison by Country (2016-2032)
- Figure 114: Eastern Europe Healthy Energy Drink Market Market Y-o-Y Growth Rate Comparison by By Type (2016-2032)
- Figure 115: Eastern Europe Healthy Energy Drink Market Market Y-o-Y Growth Rate Comparison by By Packaging Type (2016-2032)
- Figure 116: Eastern Europe Healthy Energy Drink Market Market Y-o-Y Growth Rate Comparison by By Format (2016-2032)
- Figure 117: Eastern Europe Healthy Energy Drink Market Market Y-o-Y Growth Rate Comparison by By End User (2016-2032)
- Figure 118: Eastern Europe Healthy Energy Drink Market Market Y-o-Y Growth Rate Comparison by By Distribution Channel (2016-2032)
- Figure 119: Eastern Europe Healthy Energy Drink Market Market Share Comparison by Country (2016-2032)
- Figure 120: Eastern Europe Healthy Energy Drink Market Market Share Comparison by By Type (2016-2032)
- Figure 121: Eastern Europe Healthy Energy Drink Market Market Share Comparison by By Packaging Type (2016-2032)
- Figure 122: Eastern Europe Healthy Energy Drink Market Market Share Comparison by By Format (2016-2032)
- Figure 123: Eastern Europe Healthy Energy Drink Market Market Share Comparison by By End User (2016-2032)
- Figure 124: Eastern Europe Healthy Energy Drink Market Market Share Comparison by By Distribution Channel (2016-2032)
- Figure 125: APAC Healthy Energy Drink Market Revenue (US$ Mn) Market Share by By Type in 2022
- Figure 126: APAC Healthy Energy Drink Market Market Attractiveness Analysis by By Type , 2016-2032
- Figure 127: APAC Healthy Energy Drink Market Revenue (US$ Mn) Market Share by By Packaging Typein 2022
- Figure 128: APAC Healthy Energy Drink Market Market Attractiveness Analysis by By Packaging Type, 2016-2032
- Figure 129: APAC Healthy Energy Drink Market Revenue (US$ Mn) Market Share by By Formatin 2022
- Figure 130: APAC Healthy Energy Drink Market Market Attractiveness Analysis by By Format, 2016-2032
- Figure 131: APAC Healthy Energy Drink Market Revenue (US$ Mn) Market Share by By End Userin 2022
- Figure 132: APAC Healthy Energy Drink Market Market Attractiveness Analysis by By End User, 2016-2032
- Figure 133: APAC Healthy Energy Drink Market Revenue (US$ Mn) Market Share by By Distribution Channelin 2022
- Figure 134: APAC Healthy Energy Drink Market Market Attractiveness Analysis by By Distribution Channel, 2016-2032
- Figure 135: APAC Healthy Energy Drink Market Revenue (US$ Mn) Market Share by Country in 2022
- Figure 136: APAC Healthy Energy Drink Market Market Attractiveness Analysis by Country, 2016-2032
- Figure 137: APAC Healthy Energy Drink Market Market Revenue (US$ Mn) (2016-2032)
- Figure 138: APAC Healthy Energy Drink Market Market Revenue (US$ Mn) Comparison by Country (2016-2032)
- Figure 139: APAC Healthy Energy Drink Market Market Revenue (US$ Mn) Comparison by By Type (2016-2032)
- Figure 140: APAC Healthy Energy Drink Market Market Revenue (US$ Mn) Comparison by By Packaging Type (2016-2032)
- Figure 141: APAC Healthy Energy Drink Market Market Revenue (US$ Mn) Comparison by By Format (2016-2032)
- Figure 142: APAC Healthy Energy Drink Market Market Revenue (US$ Mn) Comparison by By End User (2016-2032)
- Figure 143: APAC Healthy Energy Drink Market Market Revenue (US$ Mn) Comparison by By Distribution Channel (2016-2032)
- Figure 144: APAC Healthy Energy Drink Market Market Y-o-Y Growth Rate Comparison by Country (2016-2032)
- Figure 145: APAC Healthy Energy Drink Market Market Y-o-Y Growth Rate Comparison by By Type (2016-2032)
- Figure 146: APAC Healthy Energy Drink Market Market Y-o-Y Growth Rate Comparison by By Packaging Type (2016-2032)
- Figure 147: APAC Healthy Energy Drink Market Market Y-o-Y Growth Rate Comparison by By Format (2016-2032)
- Figure 148: APAC Healthy Energy Drink Market Market Y-o-Y Growth Rate Comparison by By End User (2016-2032)
- Figure 149: APAC Healthy Energy Drink Market Market Y-o-Y Growth Rate Comparison by By Distribution Channel (2016-2032)
- Figure 150: APAC Healthy Energy Drink Market Market Share Comparison by Country (2016-2032)
- Figure 151: APAC Healthy Energy Drink Market Market Share Comparison by By Type (2016-2032)
- Figure 152: APAC Healthy Energy Drink Market Market Share Comparison by By Packaging Type (2016-2032)
- Figure 153: APAC Healthy Energy Drink Market Market Share Comparison by By Format (2016-2032)
- Figure 154: APAC Healthy Energy Drink Market Market Share Comparison by By End User (2016-2032)
- Figure 155: APAC Healthy Energy Drink Market Market Share Comparison by By Distribution Channel (2016-2032)
- Figure 156: Latin America Healthy Energy Drink Market Revenue (US$ Mn) Market Share by By Type in 2022
- Figure 157: Latin America Healthy Energy Drink Market Market Attractiveness Analysis by By Type , 2016-2032
- Figure 158: Latin America Healthy Energy Drink Market Revenue (US$ Mn) Market Share by By Packaging Typein 2022
- Figure 159: Latin America Healthy Energy Drink Market Market Attractiveness Analysis by By Packaging Type, 2016-2032
- Figure 160: Latin America Healthy Energy Drink Market Revenue (US$ Mn) Market Share by By Formatin 2022
- Figure 161: Latin America Healthy Energy Drink Market Market Attractiveness Analysis by By Format, 2016-2032
- Figure 162: Latin America Healthy Energy Drink Market Revenue (US$ Mn) Market Share by By End Userin 2022
- Figure 163: Latin America Healthy Energy Drink Market Market Attractiveness Analysis by By End User, 2016-2032
- Figure 164: Latin America Healthy Energy Drink Market Revenue (US$ Mn) Market Share by By Distribution Channelin 2022
- Figure 165: Latin America Healthy Energy Drink Market Market Attractiveness Analysis by By Distribution Channel, 2016-2032
- Figure 166: Latin America Healthy Energy Drink Market Revenue (US$ Mn) Market Share by Country in 2022
- Figure 167: Latin America Healthy Energy Drink Market Market Attractiveness Analysis by Country, 2016-2032
- Figure 168: Latin America Healthy Energy Drink Market Market Revenue (US$ Mn) (2016-2032)
- Figure 169: Latin America Healthy Energy Drink Market Market Revenue (US$ Mn) Comparison by Country (2016-2032)
- Figure 170: Latin America Healthy Energy Drink Market Market Revenue (US$ Mn) Comparison by By Type (2016-2032)
- Figure 171: Latin America Healthy Energy Drink Market Market Revenue (US$ Mn) Comparison by By Packaging Type (2016-2032)
- Figure 172: Latin America Healthy Energy Drink Market Market Revenue (US$ Mn) Comparison by By Format (2016-2032)
- Figure 173: Latin America Healthy Energy Drink Market Market Revenue (US$ Mn) Comparison by By End User (2016-2032)
- Figure 174: Latin America Healthy Energy Drink Market Market Revenue (US$ Mn) Comparison by By Distribution Channel (2016-2032)
- Figure 175: Latin America Healthy Energy Drink Market Market Y-o-Y Growth Rate Comparison by Country (2016-2032)
- Figure 176: Latin America Healthy Energy Drink Market Market Y-o-Y Growth Rate Comparison by By Type (2016-2032)
- Figure 177: Latin America Healthy Energy Drink Market Market Y-o-Y Growth Rate Comparison by By Packaging Type (2016-2032)
- Figure 178: Latin America Healthy Energy Drink Market Market Y-o-Y Growth Rate Comparison by By Format (2016-2032)
- Figure 179: Latin America Healthy Energy Drink Market Market Y-o-Y Growth Rate Comparison by By End User (2016-2032)
- Figure 180: Latin America Healthy Energy Drink Market Market Y-o-Y Growth Rate Comparison by By Distribution Channel (2016-2032)
- Figure 181: Latin America Healthy Energy Drink Market Market Share Comparison by Country (2016-2032)
- Figure 182: Latin America Healthy Energy Drink Market Market Share Comparison by By Type (2016-2032)
- Figure 183: Latin America Healthy Energy Drink Market Market Share Comparison by By Packaging Type (2016-2032)
- Figure 184: Latin America Healthy Energy Drink Market Market Share Comparison by By Format (2016-2032)
- Figure 185: Latin America Healthy Energy Drink Market Market Share Comparison by By End User (2016-2032)
- Figure 186: Latin America Healthy Energy Drink Market Market Share Comparison by By Distribution Channel (2016-2032)
- Figure 187: Middle East & Africa Healthy Energy Drink Market Revenue (US$ Mn) Market Share by By Type in 2022
- Figure 188: Middle East & Africa Healthy Energy Drink Market Market Attractiveness Analysis by By Type , 2016-2032
- Figure 189: Middle East & Africa Healthy Energy Drink Market Revenue (US$ Mn) Market Share by By Packaging Typein 2022
- Figure 190: Middle East & Africa Healthy Energy Drink Market Market Attractiveness Analysis by By Packaging Type, 2016-2032
- Figure 191: Middle East & Africa Healthy Energy Drink Market Revenue (US$ Mn) Market Share by By Formatin 2022
- Figure 192: Middle East & Africa Healthy Energy Drink Market Market Attractiveness Analysis by By Format, 2016-2032
- Figure 193: Middle East & Africa Healthy Energy Drink Market Revenue (US$ Mn) Market Share by By End Userin 2022
- Figure 194: Middle East & Africa Healthy Energy Drink Market Market Attractiveness Analysis by By End User, 2016-2032
- Figure 195: Middle East & Africa Healthy Energy Drink Market Revenue (US$ Mn) Market Share by By Distribution Channelin 2022
- Figure 196: Middle East & Africa Healthy Energy Drink Market Market Attractiveness Analysis by By Distribution Channel, 2016-2032
- Figure 197: Middle East & Africa Healthy Energy Drink Market Revenue (US$ Mn) Market Share by Country in 2022
- Figure 198: Middle East & Africa Healthy Energy Drink Market Market Attractiveness Analysis by Country, 2016-2032
- Figure 199: Middle East & Africa Healthy Energy Drink Market Market Revenue (US$ Mn) (2016-2032)
- Figure 200: Middle East & Africa Healthy Energy Drink Market Market Revenue (US$ Mn) Comparison by Country (2016-2032)
- Figure 201: Middle East & Africa Healthy Energy Drink Market Market Revenue (US$ Mn) Comparison by By Type (2016-2032)
- Figure 202: Middle East & Africa Healthy Energy Drink Market Market Revenue (US$ Mn) Comparison by By Packaging Type (2016-2032)
- Figure 203: Middle East & Africa Healthy Energy Drink Market Market Revenue (US$ Mn) Comparison by By Format (2016-2032)
- Figure 204: Middle East & Africa Healthy Energy Drink Market Market Revenue (US$ Mn) Comparison by By End User (2016-2032)
- Figure 205: Middle East & Africa Healthy Energy Drink Market Market Revenue (US$ Mn) Comparison by By Distribution Channel (2016-2032)
- Figure 206: Middle East & Africa Healthy Energy Drink Market Market Y-o-Y Growth Rate Comparison by Country (2016-2032)
- Figure 207: Middle East & Africa Healthy Energy Drink Market Market Y-o-Y Growth Rate Comparison by By Type (2016-2032)
- Figure 208: Middle East & Africa Healthy Energy Drink Market Market Y-o-Y Growth Rate Comparison by By Packaging Type (2016-2032)
- Figure 209: Middle East & Africa Healthy Energy Drink Market Market Y-o-Y Growth Rate Comparison by By Format (2016-2032)
- Figure 210: Middle East & Africa Healthy Energy Drink Market Market Y-o-Y Growth Rate Comparison by By End User (2016-2032)
- Figure 211: Middle East & Africa Healthy Energy Drink Market Market Y-o-Y Growth Rate Comparison by By Distribution Channel (2016-2032)
- Figure 212: Middle East & Africa Healthy Energy Drink Market Market Share Comparison by Country (2016-2032)
- Figure 213: Middle East & Africa Healthy Energy Drink Market Market Share Comparison by By Type (2016-2032)
- Figure 214: Middle East & Africa Healthy Energy Drink Market Market Share Comparison by By Packaging Type (2016-2032)
- Figure 215: Middle East & Africa Healthy Energy Drink Market Market Share Comparison by By Format (2016-2032)
- Figure 216: Middle East & Africa Healthy Energy Drink Market Market Share Comparison by By End User (2016-2032)
- Figure 217: Middle East & Africa Healthy Energy Drink Market Market Share Comparison by By Distribution Channel (2016-2032)
"
- List of Tables
- "
- Table 1: Global Healthy Energy Drink Market Market Comparison by By Type (2016-2032)
- Table 2: Global Healthy Energy Drink Market Market Comparison by By Packaging Type (2016-2032)
- Table 3: Global Healthy Energy Drink Market Market Comparison by By Format (2016-2032)
- Table 4: Global Healthy Energy Drink Market Market Comparison by By End User (2016-2032)
- Table 5: Global Healthy Energy Drink Market Market Comparison by By Distribution Channel (2016-2032)
- Table 6: Global Healthy Energy Drink Market Revenue (US$ Mn) Comparison by Region (2016-2032)
- Table 7: Global Healthy Energy Drink Market Market Revenue (US$ Mn) (2016-2032)
- Table 8: Global Healthy Energy Drink Market Market Revenue (US$ Mn) Comparison by Region (2016-2032)
- Table 9: Global Healthy Energy Drink Market Market Revenue (US$ Mn) Comparison by By Type (2016-2032)
- Table 10: Global Healthy Energy Drink Market Market Revenue (US$ Mn) Comparison by By Packaging Type (2016-2032)
- Table 11: Global Healthy Energy Drink Market Market Revenue (US$ Mn) Comparison by By Format (2016-2032)
- Table 12: Global Healthy Energy Drink Market Market Revenue (US$ Mn) Comparison by By End User (2016-2032)
- Table 13: Global Healthy Energy Drink Market Market Revenue (US$ Mn) Comparison by By Distribution Channel (2016-2032)
- Table 14: Global Healthy Energy Drink Market Market Y-o-Y Growth Rate Comparison by Region (2016-2032)
- Table 15: Global Healthy Energy Drink Market Market Y-o-Y Growth Rate Comparison by By Type (2016-2032)
- Table 16: Global Healthy Energy Drink Market Market Y-o-Y Growth Rate Comparison by By Packaging Type (2016-2032)
- Table 17: Global Healthy Energy Drink Market Market Y-o-Y Growth Rate Comparison by By Format (2016-2032)
- Table 18: Global Healthy Energy Drink Market Market Y-o-Y Growth Rate Comparison by By End User (2016-2032)
- Table 19: Global Healthy Energy Drink Market Market Y-o-Y Growth Rate Comparison by By Distribution Channel (2016-2032)
- Table 20: Global Healthy Energy Drink Market Market Share Comparison by Region (2016-2032)
- Table 21: Global Healthy Energy Drink Market Market Share Comparison by By Type (2016-2032)
- Table 22: Global Healthy Energy Drink Market Market Share Comparison by By Packaging Type (2016-2032)
- Table 23: Global Healthy Energy Drink Market Market Share Comparison by By Format (2016-2032)
- Table 24: Global Healthy Energy Drink Market Market Share Comparison by By End User (2016-2032)
- Table 25: Global Healthy Energy Drink Market Market Share Comparison by By Distribution Channel (2016-2032)
- Table 26: North America Healthy Energy Drink Market Market Comparison by By Packaging Type (2016-2032)
- Table 27: North America Healthy Energy Drink Market Market Comparison by By Format (2016-2032)
- Table 28: North America Healthy Energy Drink Market Market Comparison by By End User (2016-2032)
- Table 29: North America Healthy Energy Drink Market Market Comparison by By Distribution Channel (2016-2032)
- Table 30: North America Healthy Energy Drink Market Revenue (US$ Mn) Comparison by Country (2016-2032)
- Table 31: North America Healthy Energy Drink Market Market Revenue (US$ Mn) (2016-2032)
- Table 32: North America Healthy Energy Drink Market Market Revenue (US$ Mn) Comparison by Country (2016-2032)
- Table 33: North America Healthy Energy Drink Market Market Revenue (US$ Mn) Comparison by By Type (2016-2032)
- Table 34: North America Healthy Energy Drink Market Market Revenue (US$ Mn) Comparison by By Packaging Type (2016-2032)
- Table 35: North America Healthy Energy Drink Market Market Revenue (US$ Mn) Comparison by By Format (2016-2032)
- Table 36: North America Healthy Energy Drink Market Market Revenue (US$ Mn) Comparison by By End User (2016-2032)
- Table 37: North America Healthy Energy Drink Market Market Revenue (US$ Mn) Comparison by By Distribution Channel (2016-2032)
- Table 38: North America Healthy Energy Drink Market Market Y-o-Y Growth Rate Comparison by Country (2016-2032)
- Table 39: North America Healthy Energy Drink Market Market Y-o-Y Growth Rate Comparison by By Type (2016-2032)
- Table 40: North America Healthy Energy Drink Market Market Y-o-Y Growth Rate Comparison by By Packaging Type (2016-2032)
- Table 41: North America Healthy Energy Drink Market Market Y-o-Y Growth Rate Comparison by By Format (2016-2032)
- Table 42: North America Healthy Energy Drink Market Market Y-o-Y Growth Rate Comparison by By End User (2016-2032)
- Table 43: North America Healthy Energy Drink Market Market Y-o-Y Growth Rate Comparison by By Distribution Channel (2016-2032)
- Table 44: North America Healthy Energy Drink Market Market Share Comparison by Country (2016-2032)
- Table 45: North America Healthy Energy Drink Market Market Share Comparison by By Type (2016-2032)
- Table 46: North America Healthy Energy Drink Market Market Share Comparison by By Packaging Type (2016-2032)
- Table 47: North America Healthy Energy Drink Market Market Share Comparison by By Format (2016-2032)
- Table 48: North America Healthy Energy Drink Market Market Share Comparison by By End User (2016-2032)
- Table 49: North America Healthy Energy Drink Market Market Share Comparison by By Distribution Channel (2016-2032)
- Table 50: Western Europe Healthy Energy Drink Market Market Comparison by By Type (2016-2032)
- Table 51: Western Europe Healthy Energy Drink Market Market Comparison by By Packaging Type (2016-2032)
- Table 52: Western Europe Healthy Energy Drink Market Market Comparison by By Format (2016-2032)
- Table 53: Western Europe Healthy Energy Drink Market Market Comparison by By End User (2016-2032)
- Table 54: Western Europe Healthy Energy Drink Market Market Comparison by By Distribution Channel (2016-2032)
- Table 55: Western Europe Healthy Energy Drink Market Revenue (US$ Mn) Comparison by Country (2016-2032)
- Table 56: Western Europe Healthy Energy Drink Market Market Revenue (US$ Mn) (2016-2032)
- Table 57: Western Europe Healthy Energy Drink Market Market Revenue (US$ Mn) Comparison by Country (2016-2032)
- Table 58: Western Europe Healthy Energy Drink Market Market Revenue (US$ Mn) Comparison by By Type (2016-2032)
- Table 59: Western Europe Healthy Energy Drink Market Market Revenue (US$ Mn) Comparison by By Packaging Type (2016-2032)
- Table 60: Western Europe Healthy Energy Drink Market Market Revenue (US$ Mn) Comparison by By Format (2016-2032)
- Table 61: Western Europe Healthy Energy Drink Market Market Revenue (US$ Mn) Comparison by By End User (2016-2032)
- Table 62: Western Europe Healthy Energy Drink Market Market Revenue (US$ Mn) Comparison by By Distribution Channel (2016-2032)
- Table 63: Western Europe Healthy Energy Drink Market Market Y-o-Y Growth Rate Comparison by Country (2016-2032)
- Table 64: Western Europe Healthy Energy Drink Market Market Y-o-Y Growth Rate Comparison by By Type (2016-2032)
- Table 65: Western Europe Healthy Energy Drink Market Market Y-o-Y Growth Rate Comparison by By Packaging Type (2016-2032)
- Table 66: Western Europe Healthy Energy Drink Market Market Y-o-Y Growth Rate Comparison by By Format (2016-2032)
- Table 67: Western Europe Healthy Energy Drink Market Market Y-o-Y Growth Rate Comparison by By End User (2016-2032)
- Table 68: Western Europe Healthy Energy Drink Market Market Y-o-Y Growth Rate Comparison by By Distribution Channel (2016-2032)
- Table 69: Western Europe Healthy Energy Drink Market Market Share Comparison by Country (2016-2032)
- Table 70: Western Europe Healthy Energy Drink Market Market Share Comparison by By Type (2016-2032)
- Table 71: Western Europe Healthy Energy Drink Market Market Share Comparison by By Packaging Type (2016-2032)
- Table 72: Western Europe Healthy Energy Drink Market Market Share Comparison by By Format (2016-2032)
- Table 73: Western Europe Healthy Energy Drink Market Market Share Comparison by By End User (2016-2032)
- Table 74: Western Europe Healthy Energy Drink Market Market Share Comparison by By Distribution Channel (2016-2032)
- Table 75: Eastern Europe Healthy Energy Drink Market Market Comparison by By Type (2016-2032)
- Table 76: Eastern Europe Healthy Energy Drink Market Market Comparison by By Packaging Type (2016-2032)
- Table 77: Eastern Europe Healthy Energy Drink Market Market Comparison by By Format (2016-2032)
- Table 78: Eastern Europe Healthy Energy Drink Market Market Comparison by By End User (2016-2032)
- Table 79: Eastern Europe Healthy Energy Drink Market Market Comparison by By Distribution Channel (2016-2032)
- Table 80: Eastern Europe Healthy Energy Drink Market Revenue (US$ Mn) Comparison by Country (2016-2032)
- Table 81: Eastern Europe Healthy Energy Drink Market Market Revenue (US$ Mn) (2016-2032)
- Table 82: Eastern Europe Healthy Energy Drink Market Market Revenue (US$ Mn) Comparison by Country (2016-2032)
- Table 83: Eastern Europe Healthy Energy Drink Market Market Revenue (US$ Mn) Comparison by By Type (2016-2032)
- Table 84: Eastern Europe Healthy Energy Drink Market Market Revenue (US$ Mn) Comparison by By Packaging Type (2016-2032)
- Table 85: Eastern Europe Healthy Energy Drink Market Market Revenue (US$ Mn) Comparison by By Format (2016-2032)
- Table 86: Eastern Europe Healthy Energy Drink Market Market Revenue (US$ Mn) Comparison by By End User (2016-2032)
- Table 87: Eastern Europe Healthy Energy Drink Market Market Revenue (US$ Mn) Comparison by By Distribution Channel (2016-2032)
- Table 88: Eastern Europe Healthy Energy Drink Market Market Y-o-Y Growth Rate Comparison by Country (2016-2032)
- Table 89: Eastern Europe Healthy Energy Drink Market Market Y-o-Y Growth Rate Comparison by By Type (2016-2032)
- Table 90: Eastern Europe Healthy Energy Drink Market Market Y-o-Y Growth Rate Comparison by By Packaging Type (2016-2032)
- Table 91: Eastern Europe Healthy Energy Drink Market Market Y-o-Y Growth Rate Comparison by By Format (2016-2032)
- Table 92: Eastern Europe Healthy Energy Drink Market Market Y-o-Y Growth Rate Comparison by By End User (2016-2032)
- Table 93: Eastern Europe Healthy Energy Drink Market Market Y-o-Y Growth Rate Comparison by By Distribution Channel (2016-2032)
- Table 94: Eastern Europe Healthy Energy Drink Market Market Share Comparison by Country (2016-2032)
- Table 95: Eastern Europe Healthy Energy Drink Market Market Share Comparison by By Type (2016-2032)
- Table 96: Eastern Europe Healthy Energy Drink Market Market Share Comparison by By Packaging Type (2016-2032)
- Table 97: Eastern Europe Healthy Energy Drink Market Market Share Comparison by By Format (2016-2032)
- Table 98: Eastern Europe Healthy Energy Drink Market Market Share Comparison by By End User (2016-2032)
- Table 99: Eastern Europe Healthy Energy Drink Market Market Share Comparison by By Distribution Channel (2016-2032)
- Table 100: APAC Healthy Energy Drink Market Market Comparison by By Type (2016-2032)
- Table 101: APAC Healthy Energy Drink Market Market Comparison by By Packaging Type (2016-2032)
- Table 102: APAC Healthy Energy Drink Market Market Comparison by By Format (2016-2032)
- Table 103: APAC Healthy Energy Drink Market Market Comparison by By End User (2016-2032)
- Table 104: APAC Healthy Energy Drink Market Market Comparison by By Distribution Channel (2016-2032)
- Table 105: APAC Healthy Energy Drink Market Revenue (US$ Mn) Comparison by Country (2016-2032)
- Table 106: APAC Healthy Energy Drink Market Market Revenue (US$ Mn) (2016-2032)
- Table 107: APAC Healthy Energy Drink Market Market Revenue (US$ Mn) Comparison by Country (2016-2032)
- Table 108: APAC Healthy Energy Drink Market Market Revenue (US$ Mn) Comparison by By Type (2016-2032)
- Table 109: APAC Healthy Energy Drink Market Market Revenue (US$ Mn) Comparison by By Packaging Type (2016-2032)
- Table 110: APAC Healthy Energy Drink Market Market Revenue (US$ Mn) Comparison by By Format (2016-2032)
- Table 111: APAC Healthy Energy Drink Market Market Revenue (US$ Mn) Comparison by By End User (2016-2032)
- Table 112: APAC Healthy Energy Drink Market Market Revenue (US$ Mn) Comparison by By Distribution Channel (2016-2032)
- Table 113: APAC Healthy Energy Drink Market Market Y-o-Y Growth Rate Comparison by Country (2016-2032)
- Table 114: APAC Healthy Energy Drink Market Market Y-o-Y Growth Rate Comparison by By Type (2016-2032)
- Table 115: APAC Healthy Energy Drink Market Market Y-o-Y Growth Rate Comparison by By Packaging Type (2016-2032)
- Table 116: APAC Healthy Energy Drink Market Market Y-o-Y Growth Rate Comparison by By Format (2016-2032)
- Table 117: APAC Healthy Energy Drink Market Market Y-o-Y Growth Rate Comparison by By End User (2016-2032)
- Table 118: APAC Healthy Energy Drink Market Market Y-o-Y Growth Rate Comparison by By Distribution Channel (2016-2032)
- Table 119: APAC Healthy Energy Drink Market Market Share Comparison by Country (2016-2032)
- Table 120: APAC Healthy Energy Drink Market Market Share Comparison by By Type (2016-2032)
- Table 121: APAC Healthy Energy Drink Market Market Share Comparison by By Packaging Type (2016-2032)
- Table 122: APAC Healthy Energy Drink Market Market Share Comparison by By Format (2016-2032)
- Table 123: APAC Healthy Energy Drink Market Market Share Comparison by By End User (2016-2032)
- Table 124: APAC Healthy Energy Drink Market Market Share Comparison by By Distribution Channel (2016-2032)
- Table 125: Latin America Healthy Energy Drink Market Market Comparison by By Type (2016-2032)
- Table 126: Latin America Healthy Energy Drink Market Market Comparison by By Packaging Type (2016-2032)
- Table 127: Latin America Healthy Energy Drink Market Market Comparison by By Format (2016-2032)
- Table 128: Latin America Healthy Energy Drink Market Market Comparison by By End User (2016-2032)
- Table 129: Latin America Healthy Energy Drink Market Market Comparison by By Distribution Channel (2016-2032)
- Table 130: Latin America Healthy Energy Drink Market Revenue (US$ Mn) Comparison by Country (2016-2032)
- Table 131: Latin America Healthy Energy Drink Market Market Revenue (US$ Mn) (2016-2032)
- Table 132: Latin America Healthy Energy Drink Market Market Revenue (US$ Mn) Comparison by Country (2016-2032)
- Table 133: Latin America Healthy Energy Drink Market Market Revenue (US$ Mn) Comparison by By Type (2016-2032)
- Table 134: Latin America Healthy Energy Drink Market Market Revenue (US$ Mn) Comparison by By Packaging Type (2016-2032)
- Table 135: Latin America Healthy Energy Drink Market Market Revenue (US$ Mn) Comparison by By Format (2016-2032)
- Table 136: Latin America Healthy Energy Drink Market Market Revenue (US$ Mn) Comparison by By End User (2016-2032)
- Table 137: Latin America Healthy Energy Drink Market Market Revenue (US$ Mn) Comparison by By Distribution Channel (2016-2032)
- Table 138: Latin America Healthy Energy Drink Market Market Y-o-Y Growth Rate Comparison by Country (2016-2032)
- Table 139: Latin America Healthy Energy Drink Market Market Y-o-Y Growth Rate Comparison by By Type (2016-2032)
- Table 140: Latin America Healthy Energy Drink Market Market Y-o-Y Growth Rate Comparison by By Packaging Type (2016-2032)
- Table 141: Latin America Healthy Energy Drink Market Market Y-o-Y Growth Rate Comparison by By Format (2016-2032)
- Table 142: Latin America Healthy Energy Drink Market Market Y-o-Y Growth Rate Comparison by By End User (2016-2032)
- Table 143: Latin America Healthy Energy Drink Market Market Y-o-Y Growth Rate Comparison by By Distribution Channel (2016-2032)
- Table 144: Latin America Healthy Energy Drink Market Market Share Comparison by Country (2016-2032)
- Table 145: Latin America Healthy Energy Drink Market Market Share Comparison by By Type (2016-2032)
- Table 146: Latin America Healthy Energy Drink Market Market Share Comparison by By Packaging Type (2016-2032)
- Table 147: Latin America Healthy Energy Drink Market Market Share Comparison by By Format (2016-2032)
- Table 148: Latin America Healthy Energy Drink Market Market Share Comparison by By End User (2016-2032)
- Table 149: Latin America Healthy Energy Drink Market Market Share Comparison by By Distribution Channel (2016-2032)
- Table 150: Middle East & Africa Healthy Energy Drink Market Market Comparison by By Type (2016-2032)
- Table 151: Middle East & Africa Healthy Energy Drink Market Market Comparison by By Packaging Type (2016-2032)
- Table 152: Middle East & Africa Healthy Energy Drink Market Market Comparison by By Format (2016-2032)
- Table 153: Middle East & Africa Healthy Energy Drink Market Market Comparison by By End User (2016-2032)
- Table 154: Middle East & Africa Healthy Energy Drink Market Market Comparison by By Distribution Channel (2016-2032)
- Table 155: Middle East & Africa Healthy Energy Drink Market Revenue (US$ Mn) Comparison by Country (2016-2032)
- Table 156: Middle East & Africa Healthy Energy Drink Market Market Revenue (US$ Mn) (2016-2032)
- Table 157: Middle East & Africa Healthy Energy Drink Market Market Revenue (US$ Mn) Comparison by Country (2016-2032)
- Table 158: Middle East & Africa Healthy Energy Drink Market Market Revenue (US$ Mn) Comparison by By Type (2016-2032)
- Table 159: Middle East & Africa Healthy Energy Drink Market Market Revenue (US$ Mn) Comparison by By Packaging Type (2016-2032)
- Table 160: Middle East & Africa Healthy Energy Drink Market Market Revenue (US$ Mn) Comparison by By Format (2016-2032)
- Table 161: Middle East & Africa Healthy Energy Drink Market Market Revenue (US$ Mn) Comparison by By End User (2016-2032)
- Table 162: Middle East & Africa Healthy Energy Drink Market Market Revenue (US$ Mn) Comparison by By Distribution Channel (2016-2032)
- Table 163: Middle East & Africa Healthy Energy Drink Market Market Y-o-Y Growth Rate Comparison by Country (2016-2032)
- Table 164: Middle East & Africa Healthy Energy Drink Market Market Y-o-Y Growth Rate Comparison by By Type (2016-2032)
- Table 165: Middle East & Africa Healthy Energy Drink Market Market Y-o-Y Growth Rate Comparison by By Packaging Type (2016-2032)
- Table 166: Middle East & Africa Healthy Energy Drink Market Market Y-o-Y Growth Rate Comparison by By Format (2016-2032)
- Table 167: Middle East & Africa Healthy Energy Drink Market Market Y-o-Y Growth Rate Comparison by By End User (2016-2032)
- Table 168: Middle East & Africa Healthy Energy Drink Market Market Y-o-Y Growth Rate Comparison by By Distribution Channel (2016-2032)
- Table 169: Middle East & Africa Healthy Energy Drink Market Market Share Comparison by Country (2016-2032)
- Table 170: Middle East & Africa Healthy Energy Drink Market Market Share Comparison by By Type (2016-2032)
- Table 171: Middle East & Africa Healthy Energy Drink Market Market Share Comparison by By Packaging Type (2016-2032)
- Table 172: Middle East & Africa Healthy Energy Drink Market Market Share Comparison by By Format (2016-2032)
- Table 173: Middle East & Africa Healthy Energy Drink Market Market Share Comparison by By End User (2016-2032)
- Table 174: Middle East & Africa Healthy Energy Drink Market Market Share Comparison by By Distribution Channel (2016-2032)
- 1. Executive Summary
-
- Aspire Drinks
- RITA Food & Drink Co.,Ltd
- Jouleshealth Enterprise Pvt Ltd.
- RVIITA
- Jeunesse
- Unicity
- Le-vel
- Amway
- Vemma Retail
- Better Body Company
- ZOA Energy
Our Clients


View Our Licence Options
