Global Hangover Cure Products Market By Product(Tablets/Capsules, Solutions, Powder, Patches), By Type(Hangover Remedies, Hangover Prevention), By Distribution Channel(Online, Offline), By Region And Companies - Industry Segment Outlook, Market Assessment, Competition Scenario, Trends, And Forecast 2024-2033
-
40845
-
April 2024
-
300
-


-
This report was compiled by Research Team Research team of over 50 passionate professionals leverages advanced research methodologies and analytical expertise to deliver insightful, data-driven market intelligence that empowers businesses across diverse industries to make strategic, well-informed Correspondence Research Team Linkedin | Detailed Market research Methodology Our methodology involves a mix of primary research, including interviews with leading mental health experts, and secondary research from reputable medical journals and databases. View Detailed Methodology Page
-
Quick Navigation
Report Overview
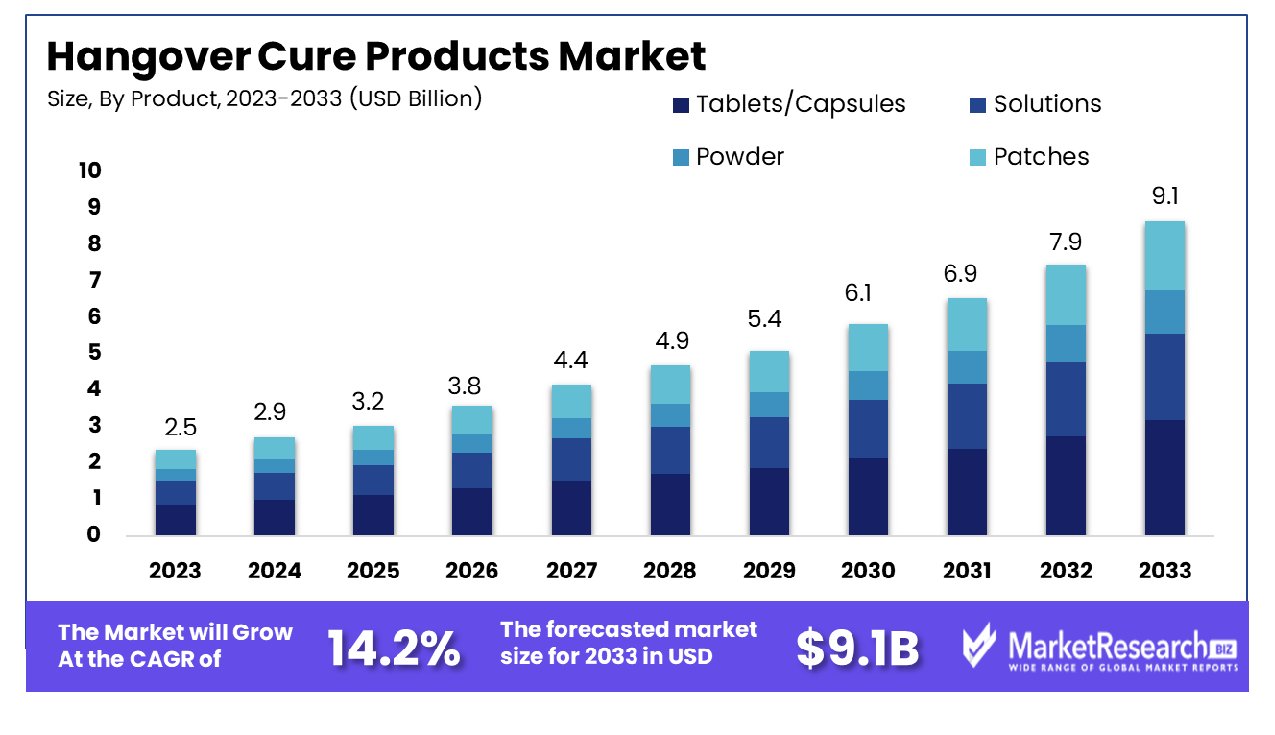
The Global Hangover Cure Products Market was valued at USD 2.5 billion in 2023. It is expected to reach USD 9.1 billion by 2033, with a CAGR of 14.2% during the forecast period from 2024 to 2033.
The Hangover Cure Products Market encompasses a range of solutions designed to alleviate symptoms associated with alcohol consumption, such as dehydration, headache, and nausea. This market serves a growing consumer segment seeking rapid relief and wellness recovery post-intoxication.
Products range from beverages, supplements, and medications to more innovative wearable and app-based technologies that track and manage recovery metrics. As lifestyles evolve and social consumption patterns shift, this market is poised for expansion, offering significant opportunities for development and marketing to companies aiming to meet the urgent needs of health-conscious consumers in dynamic social environments.
The market for hangover cure products is poised for significant growth, driven by increasing awareness of the consequences of dehydration linked to alcohol consumption. The global burden of dehydration, exacerbated by inadequate access to clean water—affecting approximately 2 billion individuals worldwide—underscores the importance of effective hydration solutions. In the UK alone, dehydration accounts for over 500 deaths annually, highlighting the critical need for products that can effectively restore hydration levels.
Furthermore, dehydration risks increase substantially during physical activities, with a loss exceeding 2% of body weight heightening the likelihood of heat-related illnesses. This factor contributes to the demand for hangover cure products that offer rapid rehydration post-alcohol consumption.
The susceptibility of older adults to dehydration, owing to physiological, cognitive, and environmental factors, expands the demographic for these products beyond typical younger consumers.
In the United States, a striking 55% of schoolchildren and adolescents are inadequately hydrated, with disparities observed across gender and race. This demographic trend indicates a broader scope for educational campaigns and product offerings tailored to promote hydration among all age groups.
Market major players in the hangover cure industry are well-positioned to leverage these insights, developing targeted solutions that address the widespread need for effective and accessible hydration aids. This market strategy not only meets a clear consumer health necessity but also aligns with growing health-conscious behaviors and preventive wellness trends.
Key Takeaways
- Market Growth: The Global Hangover Cure Products Market was valued at USD 2.5 billion in 2023. It is expected to reach USD 9.1 billion by 2033, with a CAGR of 14.2% during the forecast period from 2024 to 2033.
- By Product: Tablets/Capsules led products at 36.8%.
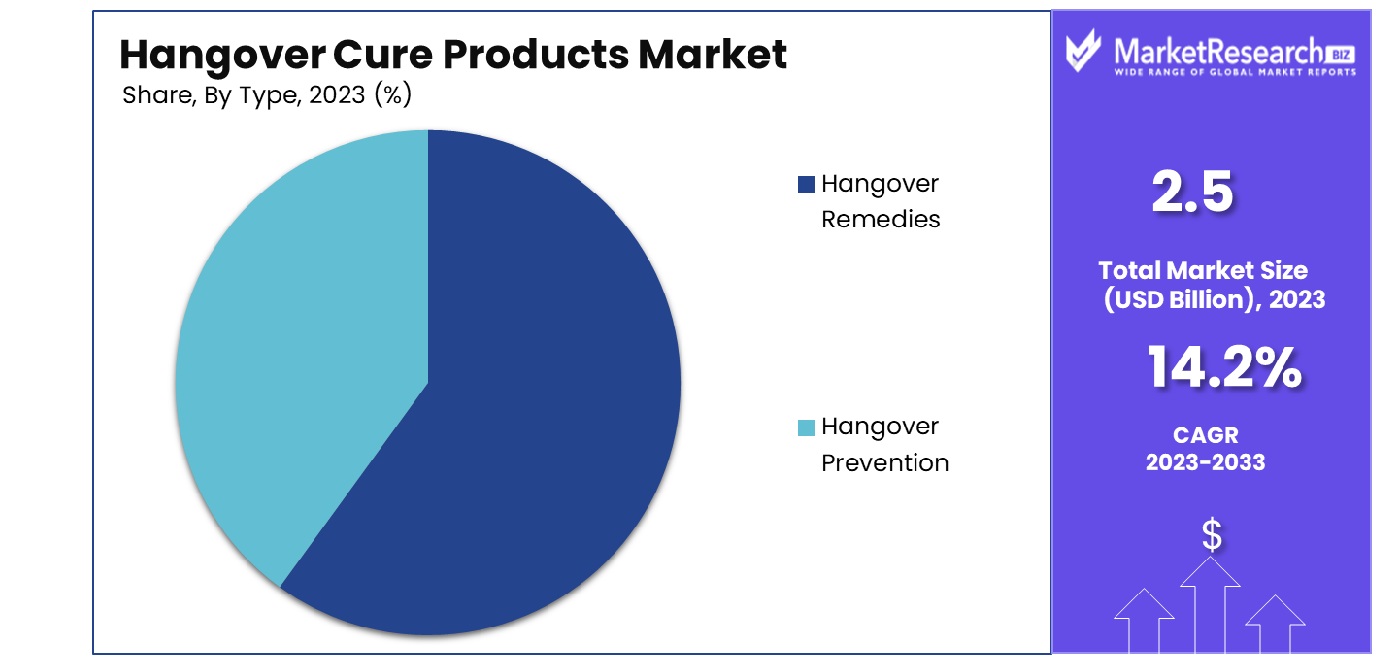
- By Type: Hangover remedies captured 74.5%.
- By Distribution Channel: Online distribution prevailed at 57.3%.
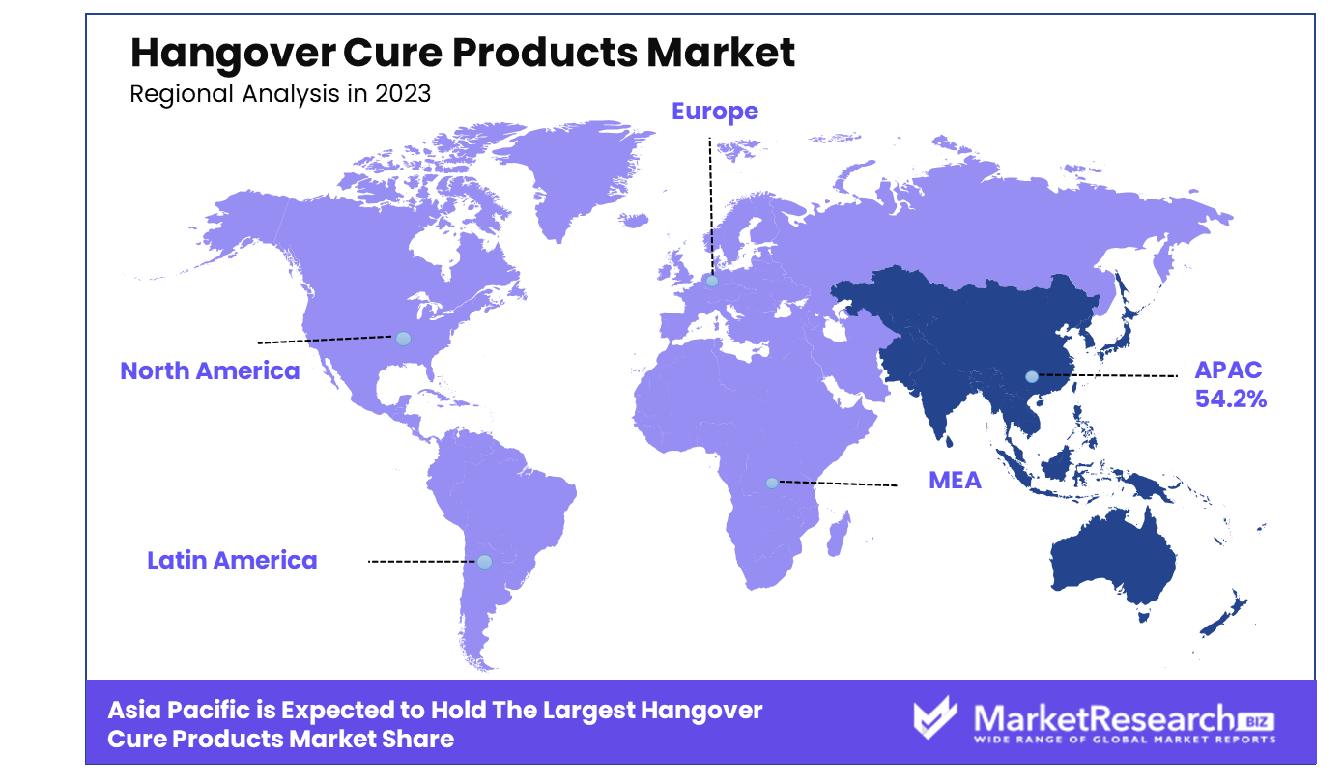
- Regional Dominance: In 2023, the Asia Pacific region dominated 54.2% of the global hangover cure products market.
- Growth Opportunity: In 2023, demand for hangover cure products soared, driven by preferences for quick relief and a significant shift toward herbal-based options, reflecting broader trends toward natural health products.
Driving factors
Growing Health Consciousness Among Consumers
The expansion of the hangover cure products market can be significantly attributed to the increasing health consciousness among consumers. As individuals become more aware of the implications of alcohol consumption and its aftermath, there is a noticeable shift towards preventive wellness products. This growing awareness is boosting the demand for hangover cure products and influencing product innovation and diversification within the market.
Manufacturers are responding by creating formulations that promise efficacy in alleviating hangover symptoms and align with overall health and wellness food trends. Consequently, products that offer additional health benefits, such as enhanced hydration and replenishment of essential nutrients lost during alcohol consumption, are gaining traction, thereby fueling market growth.
Demand for Personalized and Tailored Solutions
The demand for personalized and tailored solutions is becoming a pivotal growth driver in the hangover cure products market. Today’s consumers are seeking products that cater specifically to their individual health profiles and recovery needs.
This demand is driving the emergence of customized hangover relief solutions, ranging from supplements tailored for different body types and tolerance levels to beverages formulated with specific ingredients to address unique recovery needs. Such personalization not only enhances consumer satisfaction but also encourages repeated use, directly impacting the market's expansion.
Surge in Popularity of Natural and Organic Ingredients
The surge in popularity of natural and organic ingredients has had a profound impact on the hangover cure products market. Consumers are increasingly opting for products with natural compositions, driven by a broader trend towards organic and clean-label products.
This shift is due to the perceived safety and efficacy of natural ingredients, which are often considered gentler and free from synthetic additives.
The inclusion of organic compounds like ginger, turmeric, and milk thistle, known for their detoxifying and anti-inflammatory properties, has made these products highly appealing.
The market is witnessing a significant increase in offerings that boast of natural ingredient lists, which not only align with the clean eating habits of health-conscious consumers but also offer reassurance of minimal side effects, thereby enhancing market growth.
Restraining Factors
Limited Availability of Natural Sources of Hangover Cure Products
The hangover cure products market is increasingly constrained by the limited availability of natural sources, which are crucial for the production of these remedies. Natural ingredients such as ginger, milk thistle, and certain vitamins are essential in formulating effective hangover cures that are appealing to health-conscious consumers.
The scarcity of these natural resources can be attributed to overharvesting, inadequate agricultural practices, and environmental changes that affect crop yields.
As a result, this limitation not only increases the cost of raw materials but also restricts the ability of manufacturers to meet rising consumer demand for natural and organic products.
Consequently, the growth of the hangover cure products market is tempered by these supply chain challenges, which hinder the development and widespread distribution of new and existing products. This factor necessitates innovative approaches in sourcing and sustainability practices to ensure consistent supply and market expansion.
Health Concerns Related to Excessive Use of Hangover Cure Products
Health concerns associated with the excessive use of hangover cure products significantly impact market growth. These products often contain ingredients like caffeine, pain relievers, and herbal stimulants, which can pose health risks when used frequently or in large quantities.
Consumers and healthcare professionals are becoming increasingly aware of the potential adverse effects, such as dependency, dehydration, or adverse interactions with alcohol.
This awareness can lead to a cautious approach from potential users, dampening their enthusiasm for regular use. Moreover, regulatory bodies might impose stricter controls and labeling requirements, further complicating market entry and expansion.
The cumulative effect of these health concerns not only slows market growth but also shifts consumer preferences towards more natural and less intensive remedies, influencing product development and marketing strategies in the hangover cure industry.
By Product Analysis
Tablets and capsules led with a 36.8% market share.
In 2023, Tablets/Capsules held a dominant market position in the By Product segment of the Hangover Cure Products Market, capturing more than 36.8% of the market share. This category benefits from consumer preferences for convenient and quick-acting remedies. The widespread availability and established presence in retail and online channels further bolster the segment's strong standing.
Liquid solutions are the second most popular format for hangover cure products. These are typically marketed for their fast absorption rates and ease of use, especially in on-the-go scenarios. The versatility in formulation allows manufacturers to integrate a variety of flavors and supplements, enhancing consumer appeal.
Powder forms of hangover cures, designed to be dissolved in water or another beverage, offer a portable and customizable approach to hangover treatment. This segment attracts consumers who prefer to adjust the strength of their remedy according to personal needs and tolerance.
Patches represent a niche but growing segment in the hangover cure products market. They provide a steady release of active ingredients over several hours, appealing to those seeking a hands-free method to alleviate hangover symptoms. Despite their smaller market share, patches are gaining traction due to their innovative application and perceived health benefits without gastrointestinal discomfort.
By Type Analysis
Hangover remedies dominated at 74.5%.
In 2023, Hangover Remedies held a dominant market position in the By Type segment of the Hangover Cure Products Market, capturing more than 74.5% of the market share. This segment's dominance is attributed to high consumer demand for immediate relief from post-consumption symptoms.
Hangover remedies often comprise a blend of vitamins, electrolytes, and herbal components known to alleviate common hangover symptoms such as dehydration and headaches, solidifying their popularity and consumer trust.
Though smaller in market share, Hangover Prevention products represent an emerging segment that focuses on mitigating hangover symptoms before they start. These products are typically consumed before or during alcohol intake and are formulated to support metabolism and reduce toxin buildup.
The preventive approach is gaining momentum as consumers become more proactive about health and wellness, indicating potential growth opportunities in this nascent market sector.
By Distribution Channel Analysis
Online distribution channels prevailed at 57.3%.
In 2023, the Online distribution channel held a dominant position in the Hangover Cure Products Market, capturing more than 57.3% of the market share. This significant market share can be attributed to the convenience of purchasing, the variety of options available, and the rising consumer preference for e-commerce platforms.
The growth of this segment is further driven by the expansion of online retail logistics and the increasing penetration of Internet services. Additionally, online platforms have been proactive in forming partnerships with hangover cure product manufacturers to expand their reach and consumer base.
The Offline distribution channel, while smaller in comparison to its online counterpart, remains vital due to consumer habits and the availability of products in physical stores. This segment includes supermarkets, drugstores, and convenience stores where consumers can immediately access hangover cure products.
Despite the growth of online sales, the offline segment benefits from consumer preference for physical shopping experiences, where they can receive immediate product access and in-person customer service. The strategic placement of these products in stores where alcoholic beverages are sold also contributes to sustained sales in this channel.
Key Market Segments
By Product
- Tablets/Capsules
- Solutions
- Powder
- Patches
By Type
- Hangover Remedies
- Hangover Prevention
By Distribution Channel
- Online
- Offline
Growth Opportunity
Demand for Remedies to Alleviate Hangover Symptoms
In 2023, the global hangover cure products market witnessed a robust increase in consumer demand for effective remedies to alleviate post-consumption symptoms. The escalation in social gatherings and alcohol consumption, particularly as global markets recover from pandemic restrictions, has significantly fueled this demand.
Consequently, there has been a surge in the development and commercialization of a variety of hangover cure products ranging from supplements to beverages, each promising swift relief from discomfort. Market trends indicate that consumers are increasingly prioritizing products that offer rapid symptom relief, convenience in usage, and minimal side effects, which in turn drives innovation and diversification in the offerings available in this sector.
Growing Preference for Herbal-Based Options
Parallel to the general demand for hangover cures, there has been a discernible shift towards herbal-based options within the market. This trend is influenced by a growing consumer inclination towards natural and organic products, perceived as safer and healthier alternatives to synthetic remedies. Herbal ingredients such as ginger, turmeric, and milk thistle are commonly integrated into formulations, valued for their natural anti-inflammatory and antioxidant properties.
The appeal of these herbal options is further enhanced by their dual benefits, offering detoxification effects alongside hangover relief. As a result, the market for herbal hangover cures is expanding, reflecting a broader consumer trend towards health-conscious lifestyle choices in personal health and wellness products.
Latest Trends
Development of Hydration-focused Hangover Remedies
In 2023, the global hangover cure products market has seen significant development in hydration-focused remedies. This trend capitalizes on the understanding that dehydration is a primary contributor to hangover symptoms, such as headaches and dizziness. Market leaders and new entrants alike have introduced a range of products, including electrolyte-infused drinks, hydration powders, and effervescent tablets, designed to rapidly restore hydration balance.
These products are often fortified with vitamins and minerals to support metabolic processes and enhance recovery. The effectiveness and immediate impact of these hydration solutions have led to their increased acceptance among consumers, thus driving market growth in this segment.
Innovation in Anti-inflammatory Hangover Solutions
Another prominent trend in 2023 involves the innovation in anti-inflammatory hangover solutions. Recognizing the role of inflammation in hangover symptoms, manufacturers have been focusing on developing products that contain natural anti-inflammatory agents. Ingredients such as curcumin from turmeric, omega-3 fatty acids, and antioxidants from berries are being increasingly used in formulations.
These ingredients not only help reduce inflammation but also combat oxidative stress associated with alcohol consumption. The market has also seen a rise in the development of supplements that target inflammation pathways more directly, offering consumers more specialized options. This focus on anti-inflammatory properties in hangover cures is enhancing the effectiveness of these products, contributing to the growth and diversification of the market.
Regional Analysis
In 2023, Asia Pacific dominated the hangover cure products market, accounting for 54.2% of global sales.
In 2023, the global market for hangover cure products demonstrated significant regional segmentation, with Asia Pacific leading at 54.2% market share. This dominance is largely attributed to a combination of high alcohol consumption rates and a robust consumer base increasingly seeking rapid and effective remedies for hangover symptoms. Additionally, cultural acceptance and the widespread availability of traditional and modern hangover cures contribute to the region's market strength.
North America also represents a substantial portion of the market, driven by lifestyle factors and a prevalence of social drinking cultures, particularly in the United States and Canada. The region sees continual growth in demand for both synthetic and natural hangover relief solutions, supported by strong marketing campaigns and consumer awareness about the benefits of such products.
Europe follows, with a market characterized by a preference for scientifically-backed hangover remedies. European consumers tend to favor products that offer hydration and anti-inflammatory properties, mirroring a broader regional focus on health and wellness.
The Middle East & Africa, though a smaller market segment, is experiencing gradual growth. Increasing urbanization and changing lifestyles contribute to a rising awareness and acceptance of hangover cure products. However, cultural norms and alcohol consumption patterns significantly influence the market dynamics in this region.
Latin America, with its vibrant cultural affinity for celebration, shows potential for market expansion. The increasing influence of Western drinking habits and the growing middle class are expected to drive demand for hangover cures in upcoming years, albeit from a smaller base compared to other regions.
Key Regions and Countries
North America
- The US
- Canada
- Rest of North America
Europe
- Germany
- France
- The UK
- Spain
- Netherlands
- Russia
- Italy
- Rest of Europe
Asia-Pacific
- China
- Japan
- Singapore
- Thailand
- South Korea
- Vietnam
- India
- New Zealand
- Rest of Asia Pacific
Latin America
- Mexico
- Brazil
- Rest of Latin America
Middle East & Africa
- Saudi Arabia
- South Africa
- UAE
- Rest of the Middle East & Africa
Key Players Analysis
In the global hangover cure products market in 2023, the competitive landscape is marked by a diverse mix of companies, ranging from established pharmaceutical giants to innovative startups focused on niche segments. Key players such as Abbott and Bayer AG bring significant R&D capabilities and extensive distribution networks, which allow them to maintain a strong market presence. These companies benefit from established brand recognition and trust, underpinning their competitive advantage in marketing over-the-counter remedies.
More Labs, The Himalaya Drug Company, and Rally Labs LLC (Blowfish) are noteworthy for their specialized offerings tailored to hangover relief. These key market players differentiate themselves through unique formulations that target specific symptoms of alcohol-induced discomfort, leveraging natural and scientifically backed ingredients to appeal to health-conscious consumers.
Emerging brands like Cheers Health, Liquid I.V., Inc., and DOTSHOT are capturing attention with innovative delivery systems, such as enhanced hydration solutions and electrolyte mixes, which promise rapid relief by addressing dehydration—a primary factor in hangovers. This segment’s steady growth can be attributed to increasing consumer preference for quick and effective solutions that fit seamlessly into social lifestyles.
Moreover, companies such as Toniiq and Purple Tree Labs are gaining traction by emphasizing clean, vegan, and non-GMO ingredients, aligning with broader consumer trends toward wellness and sustainability.
Lastly, the market has seen a proliferation of hangover patch companies like Bytox, Cheal Hangover Patch, and La Mend, Inc. (The Good Patch), which offer transdermal patches infused with vitamins and antioxidants. These products are marketed as convenient and discreet solutions, appealing particularly to younger demographics seeking innovative and hassle-free alternatives to traditional pills and drinks.
Market Key Players
- Abbott
- Bayer AG
- More Labs
- The Himalaya Drug Company
- Rally Labs LLC (Blowfish)
- Flyby
- Drinkwel, LLC
- Cheers Health
- Liquid I.V., Inc.
- DOTSHOT
- AfterDrink Ltd.
- Toniiq
- Purple Tree Labs
- No Days Wasted
- LES Labs (Detoxx)
- EZ Lifestyle (Over EZ)
- DrinkAde
- Kaplan Laboratory, LLC (H-PROOF)
- Bytox
- Cheal Hangover Patch
- Party Patch
- Rebound Hangover Patch
- TRIO Patch
- SmartPatches
- D-Tox Hangover Patches
- La Mend, Inc. (The Good Patch)
- RallyPatch, LLC
- Ozmo Patch
- Wet Buffalo Patch
- LiveToShine
- AWKN
Recent Development
- In December 2023, the Hangover cure market in South Korea thrived, valued at $241 million in 2022, driven by young consumers. Pending regulations aim to enforce scientific validation for product claims by 2025.
- In February 2021, the Hangover recovery market evolves with innovative brands like Zbiotics focusing on probiotic science, BrightFox's shift to broader hydration, Iluna's natural herbal approach, and LiveLife targeting responsible alcohol consumption for women.
- In February 2020, Baidyanath's Siddhesh Sharma pioneered Ayurveda-based modern health products. Naturedge Beverages launches Shunya, a zero-calorie drink infused with super-herbs, and ARMR, an anti-hangover shot made from 15 herbs, targeting global markets.
- In December 2017, No FDA-approved hangover remedies exist. Abstinence is the most effective prevention. Products like Morning Recovery and Mentis claim benefits, but lack conclusive evidence. Hydration, moderation, and NSAIDs are recommended.
Report Scope
Report Features Description Market Value (2023) USD 2.5 Billion Forecast Revenue (2033) USD 9.1 Billion CAGR (2024-2032) 14.2% Base Year for Estimation 2023 Historic Period 2016-2023 Forecast Period 2024-2033 Report Coverage Revenue Forecast, Market Dynamics, COVID-19 Impact, Competitive Landscape, Recent Developments Segments Covered By Product(Tablets/Capsules, Solutions, Powder, Patches), By Type(Hangover Remedies, Hangover Prevention), By Distribution Channel(Online, Offline) Regional Analysis North America - The US, Canada, Rest of North America, Europe - Germany, France, The UK, Spain, Italy, Russia, Netherlands, Rest of Europe, Asia-Pacific - China, Japan, South Korea, India, New Zealand, Singapore, Thailand, Vietnam, Rest of Asia Pacific, Latin America - Brazil, Mexico, Rest of Latin America, Middle East & Africa - South Africa, Saudi Arabia, UAE, Rest of Middle East & Africa Competitive Landscape Abbott, Bayer AG, More Labs, The Himalaya Drug Company, Rally Labs LLC (Blowfish), Flyby, Drinkwel, LLC, Cheers Health, Liquid I.V., Inc., DOTSHOT, AfterDrink Ltd., Toniiq, Purple Tree Labs, No Days Wasted, LES Labs (Detoxx), EZ Lifestyle (Over EZ), DrinkAde, Kaplan Laboratory, LLC (H-PROOF), Bytox, Cheal Hangover Patch, Party Patch, Rebound Hangover Patch, TRIO Patch, SmartPatches, D-Tox Hangover Patches, La Mend, Inc. (The Good Patch), RallyPatch, LLC, Ozmo Patch, Wet Buffalo Patch, LiveToShine, AWKN Customization Scope Customization for segments, region/country-level will be provided. Moreover, additional customization can be done based on the requirements. Purchase Options We have three licenses to opt for Single User License, Multi-User License (Up to 5 Users), Corporate Use License (Unlimited User and Printable PDF) -
-
- Abbott
- Bayer AG
- More Labs
- The Himalaya Drug Company
- Rally Labs LLC (Blowfish)
- Flyby
- Drinkwel, LLC
- Cheers Health
- Liquid I.V., Inc.
- DOTSHOT
- AfterDrink Ltd.
- Toniiq
- Purple Tree Labs
- No Days Wasted
- LES Labs (Detoxx)
- EZ Lifestyle (Over EZ)
- DrinkAde
- Kaplan Laboratory, LLC (H-PROOF)
- Bytox
- Cheal Hangover Patch
- Party Patch
- Rebound Hangover Patch
- TRIO Patch
- SmartPatches
- D-Tox Hangover Patches
- La Mend, Inc. (The Good Patch)
- RallyPatch, LLC
- Ozmo Patch
- Wet Buffalo Patch
- LiveToShine
- AWKN
Our Clients


View Our Licence Options
