Fuel Cell Market By Product(Proton Exchange Membrane Fuel Cell, Phosphoric Acid Fuel Cell, Solid Oxide Fuel Cell, Molten Carbonate Fuel Cell, Others), By Application(Stationary, Transportation, Portable) By Region And Companies - Industry Segment Outlook, Market Assessment, Competition Scenario, Trends, And Forecast 2024-2033
-
43064
-
Jan 2024
-
183
-


-
This report was compiled by Kalyani Khudsange Kalyani Khudsange is a Research Analyst at Prudour Pvt. Ltd. with 2.5 years of experience in market research and a strong technical background in Chemical Engineering and manufacturing. Correspondence Sr. Research Analyst Linkedin | Detailed Market research Methodology Our methodology involves a mix of primary research, including interviews with leading mental health experts, and secondary research from reputable medical journals and databases. View Detailed Methodology Page
-
Quick Navigation
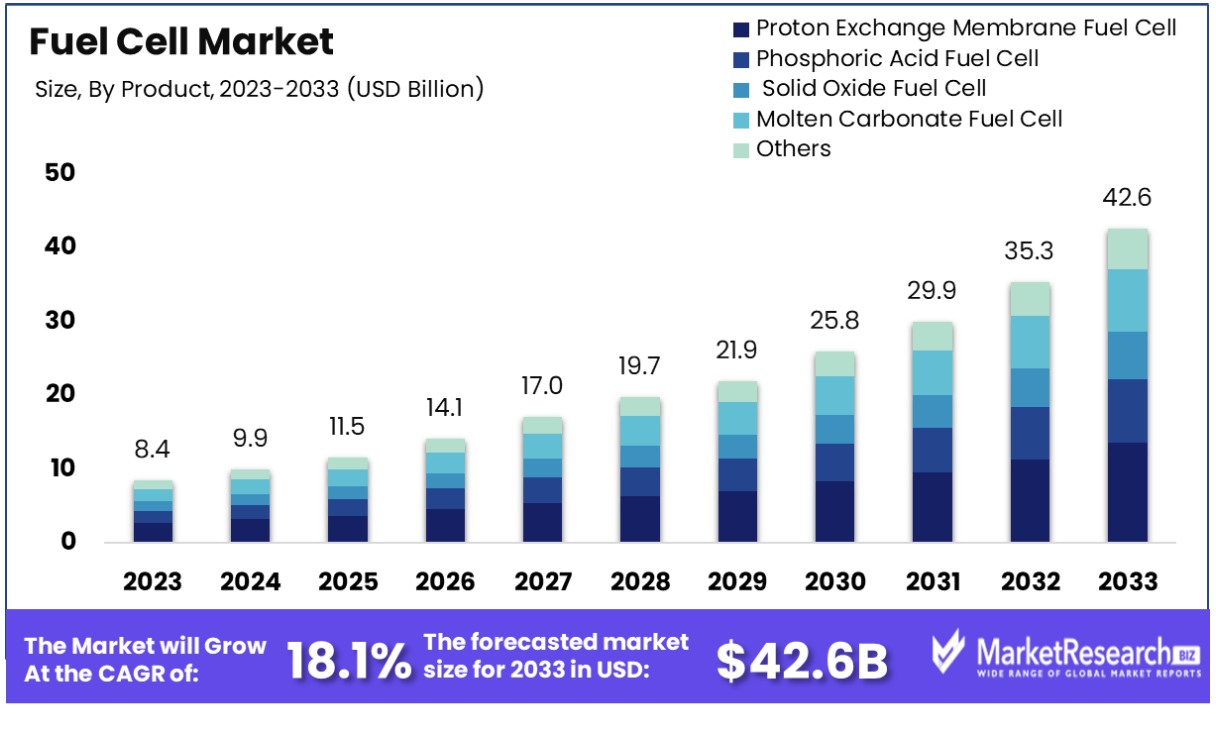
The fuel cell market was valued at USD 8.4 billion in 2023. It is expected to reach 42.6 billion, with a CAGR of 18.11% during the forecast period from 2024 to 2033.
The surge in demand for private-public collaboration and the rise in unconventional energy sources are some of the main key factors for the fuel cell market. Fuel cells are basically, any class of equipment that change the chemical energy of a fuel directly in the form of electricity. Fuel cells are used in the chemical energy of hydrogen or any other fuels to neatly and effectively generate electricity. These fuels are unique and have the potential that it can be used in various types of applications.
An article published by Energy Efficiency and Renewable Energy highlights that the Department of Energy (DOE) in the US is working closely with its industrial partners, universities, national laboratories, and other associates to conquer difficult technical hurdles to fuel cell development. In terms of durability, the applications of fuel cells usually need sufficient performance to be maintained for over longer period. DOE has set vital targets for fuel cell system lifetime under convincing operating situations at 8,000 hours for light-duty vehicles, 30,000 hours for heavy-duty vehicles, and 80,000 hours for distributed power systems.
Fuel cells are used in several types of applications that offer power for applications all across different sectors comprising transportation, residential or commercial buildings, and long-lasting energy storage for the grid in alterable systems. They have many more advantages over the conventional-based technologies that are presently used in different power plants and vehicles. It can be operated at higher efficacy than combustion engines and can transform the chemical energy into the fuels to electrical energy with efficacy which has the potential to reach 60%. These are lower and zero emission as compared to combustion engines.
These hydrogen fuel cells require only water, addressing severe climatic barriers as there are no carbon dioxide productions. There are not at all air pollutants that can make smog and can lead to critical health conditions at the point of operations. These cells are silent and quiet at the time of operations as they have fewer moving parts. The government is also focusing more on research and development to know and understand the fuel cell degradation methodology and making materials as well as the tactics to mitigate their effects. The demand for fuel cells will increase due to its several advantages in various industries that will help in market expansion in the coming years.
Driving Factors
Decarbonization Goals Accelerate Fuel Cell Adoption
The fuel cell market is markedly driven by the imperative to reduce carbon emissions, a central focus for both corporations and governments. Ambitious targets, like the EU's goal to reduce emissions by 55% by 2030 and the US's target of a 50-52% reduction by 2030, necessitate the adoption of clean energy technologies, including fuel cells. Moreover, major corporations, with 63% of Fortune Global 500 companies committing to 2050 emission reduction goals and 47% setting targets for 2030, are increasingly investing in fuel cell technology. This shift towards low-carbon solutions is a crucial factor propelling the growth of the fuel cell market, reflecting a global commitment to combat climate change.
Electric Vehicle Integration Spurs Fuel Cell Demand
The incorporation of fuel cells in electric vehicles, especially in heavy-duty transport, stands out as a major catalyst for growth in the market. Fuel cell electric vehicles (FCEVs) offer advantages like rapid refueling and extended range compared to traditional EVs. Initiatives like MG Motor India's introduction of third-generation hydrogen fuel cell technology and Hyundai's production of fuel cell trucks exemplify this trend. The U.S. Department of Energy's efforts to make hydrogen-powered vehicles a viable option underscores the potential of FCEVs in transforming the transportation sector.
Hydrogen Infrastructure Expansion Supports Fuel Cell Market
The growth of the fuel cell market hinges significantly on the crucial development of hydrogen infrastructure. With 59 hydrogen stations operational in the U.S. and more in planning, alongside significant government investments in hydrogen production and distribution, the groundwork for widespread fuel cell adoption is being laid. The U.S. Department of Energy's commitment to scaling up the clean hydrogen market from under 1 MMTpa to approximately 10 MMTpa by 2030 highlights the concerted effort to establish a robust hydrogen ecosystem, vital for fuel cell technology proliferation.
Advancements in Hydrogen Production Catalyze Fuel Cell Growth
Technological advancements in hydrogen production, such as alkaline and PEM electrolyzers, SOECs, and biomass gasifiers, are pivotal in driving the fuel cell market. Innovations like the NREL's STCH water-splitting technology promise more energy-efficient hydrogen production, essential for the widespread adoption of fuel cells. These advancements in producing green hydrogen, characterized by low cost and zero emissions, are crucial in facilitating the transition to fuel cell technologies across various sectors.
Restraining Factors
High Upfront Costs Limit Fuel Cell Market Accessibility
The fuel cell market is significantly constrained by the high initial purchase prices of fuel cell systems, which are notably higher compared to established technologies like internal combustion engines. This pricing disparity is a major barrier to adoption, especially for cost-sensitive consumers.
For instance, fuel cell systems for telecommunications and industrial applications can range from $9,000 to over $20,000 for a 2.5kW system, and start at under $200,000 for a 120kW system. Although manufacturers are actively working to reduce these costs, the current price points remain prohibitive. The US Department of Energy has set ambitious targets to lower costs to less than $100/kW for annual production exceeding 150,000 units, aiming for a cost reduction of 60-65%. Achieving this target is crucial for increasing the market penetration of fuel cells.
Competition from Established Technologies Challenges Fuel Cell Adoption
Fuel cells face intense competition from more mature technologies such as battery electric vehicles (EVs) and gas engines. These traditional technologies currently hold advantages in terms of cost, market familiarity, and established infrastructure. Overcoming these perceptions is a significant challenge for the fuel cell market.
Customers often prefer known and tested solutions, making it difficult for fuel cells to break into markets where batteries and gas engines have long been dominant. The fuel cell industry needs to demonstrate clear advantages over these established technologies in terms of efficiency, environmental impact, and long-term costs to gain a competitive edge and expand its market share.
Fuel Cell Market Segmentation Analysis
By Product Analysis
Proton Exchange Membrane Fuel Cell (PEMFC) is the dominant product segment in the fuel cell market. This dominance is largely due to PEMFC's high power density, low operating temperature, and quick start-up capabilities, making them suitable for a variety of applications, particularly in transportation and portable power. PEMFCs are widely used in vehicles, backup power systems, and for portable power in consumer electronics due to their compact size and efficiency. The development of hydrogen infrastructure and advancements in PEMFC technology have further solidified this segment's leading position.
Other types like Phosphoric Acid Fuel Cell (PAFC), Solid Oxide Fuel Cell (SOFC), Molten Carbonate Fuel Cell (MCFC), and others are also significant in the market. SOFCs, known for their high operating temperature and efficiency, are preferred in stationary applications. MCFCs are used in large stationary power generation due to their ability to utilize various fuel types. Nevertheless, the fuel cell market is predominantly influenced by the versatility and escalating adoption of Proton Exchange Membrane Fuel Cells (PEMFCs) across various sectors, solidifying their dominance in the industry.
By Application Analysis
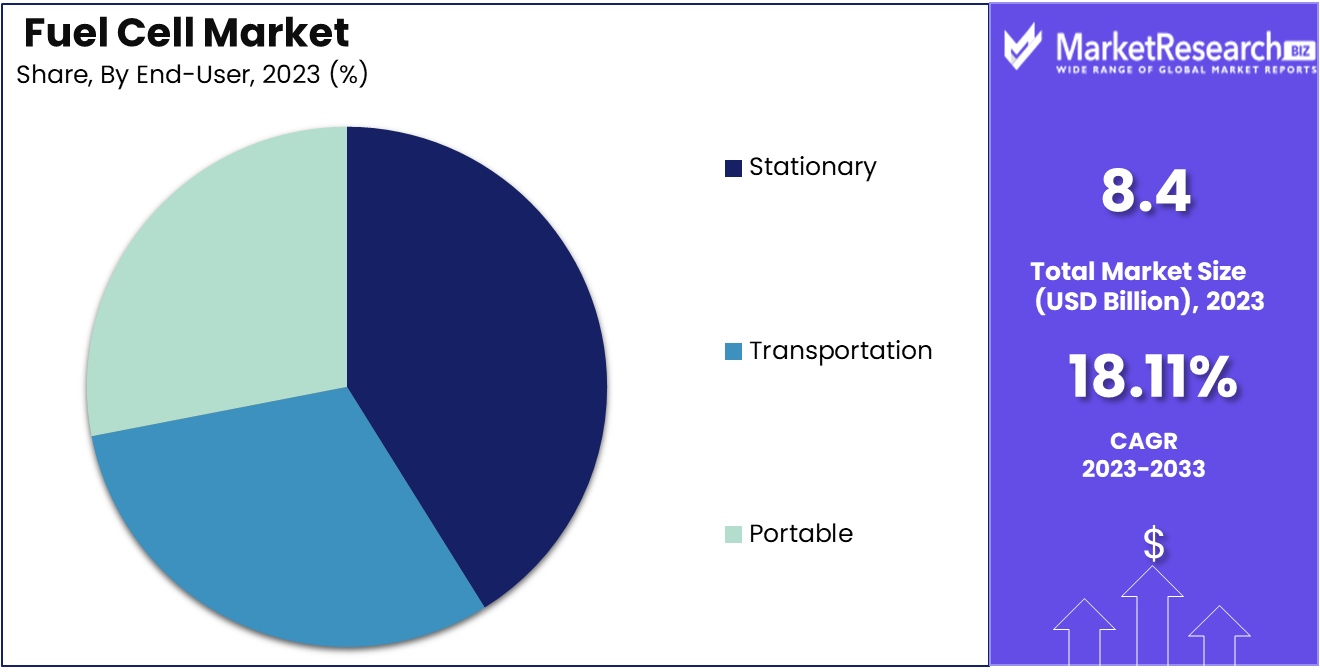
The predominant segment in the fuel cell market is stationary applications, constituting 67.5%. These stationary fuel cells find application in diverse settings such as residential, commercial, and industrial environments, serving both as primary and backup power sources. Their popularity is attributed to their capacity to deliver dependable, environmentally friendly, and efficient energy, particularly gaining traction in utilities and industrial power systems. The increasing focus on sustainable energy solutions and the decreasing costs of fuel cell technology play pivotal roles in driving growth within this segment.
Transportation and Portable are also crucial application segments. In transportation, fuel cells are used in vehicles, ranging from cars to buses, offering a clean alternative to traditional combustion engines. Portable fuel cells are emerging in consumer electronics, providing longer-lasting power sources for devices like laptops and cameras. However, the scale of deployment and diversity of use cases in stationary applications, combined with environmental regulations favoring clean energy, make it the most dominant segment in the fuel cell market.
Fuel Cell Industry Segments
By Product
- Proton Exchange Membrane Fuel Cell
- Phosphoric Acid Fuel Cell
- Solid Oxide Fuel Cell
- Molten Carbonate Fuel Cell
- Others
By Application
- Stationary
- Transportation
- Portable
Growth Opportunities
Off-Grid Power Solutions: Fuel Cells as a Reliable Alternative
The potential of fuel cells to provide off-grid power in remote areas or during disaster relief scenarios represents a significant growth opportunity in the fuel cell market. Fuel cells offer a more reliable and sustainable alternative to traditional power sources like diesel generators, especially in locations where grid infrastructure is non-existent or compromised.
The primary challenge lies in the higher costs associated with fuel cell technology compared to conventional diesel generators. However, as technological advancements continue to reduce costs and improve efficiency, fuel cells are becoming an increasingly viable solution for off-grid power needs, thus expanding their market potential.
Developing Economies: A Fertile Ground for Fuel Cell Adoption
The fuel cell market has considerable growth potential in developing economies like India and Indonesia, which require reliable power sources and are not deeply entrenched in legacy energy infrastructure. These markets present unique opportunities for the adoption of fuel cells as they seek to establish sustainable and efficient energy solutions.
The main challenges include the higher costs of fuel cell technology and a lack of local technical expertise. But now, with strategic investments and knowledge transfer, these barriers can be overcome, paving the way for the increased adoption of fuel cells in these rapidly developing markets.
Fuel Cell Market Regional Analysis
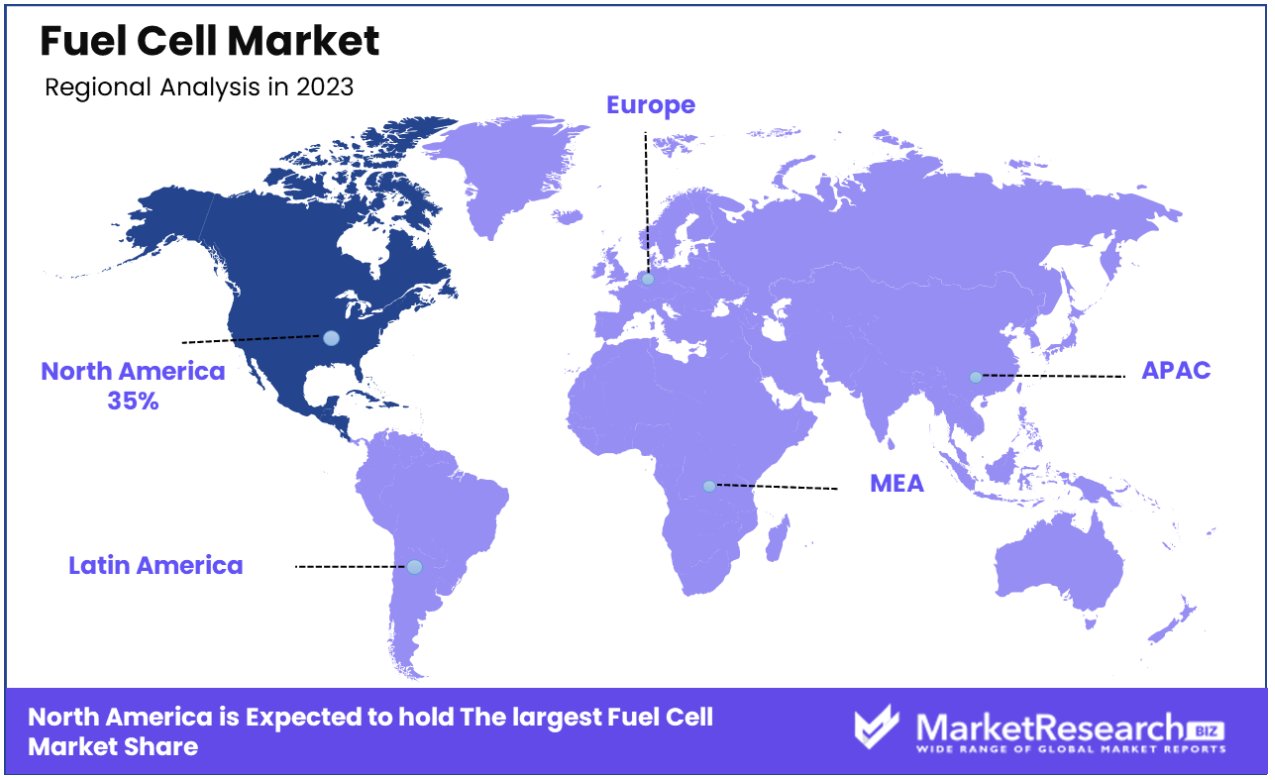
North America Dominates with 35% Market Share in Fuel Cell Market
North America's strong position in the global fuel cell market, holding 35% of the market share, is underpinned by several key factors. The region, especially the United States, has been a pioneer in the innovation and implementation of fuel cell technology. Significant investments in renewable energy and a growing focus on reducing carbon emissions have spurred the development and adoption of fuel cells.
Companies like Plug Power and Ballard Power Systems, leading in fuel cell technology, contribute to the region's dominance. Additionally, government initiatives and subsidies to promote clean energy technologies have played a crucial role in market growth.
The North American fuel cell market stands out for its varied applications across transportation, stationary power, and portable power sectors. The market is witnessing significant growth, primarily driven by the increasing adoption of fuel cell electric vehicles (FCEVs), with a notable emphasis in the United States and Canada. This increasing embrace of FCEVs serves as a significant driver for the market's expansion in the region. The region benefits from well-established infrastructure for fuel cell technology and a strong push towards decarbonizing the energy sector. The presence of a highly skilled workforce and advanced research facilities further strengthens the market dynamics in North America.
Europe: Commitment to Clean Energy Transition
Europe's fuel cell market is driven by the region's commitment to a clean energy transition. Countries like Germany and the UK are investing heavily in hydrogen infrastructure and fuel cell technology. The European Union’s green initiatives and funding for sustainable energy projects support the market growth in this region.
Asia-Pacific: Rapid Market Expansion
In the Asia-Pacific region, the fuel cell market is experiencing rapid expansion, spearheaded by nations such as Japan and South Korea. The region's commitment to reducing dependence on fossil fuels and improving energy security serves as a driving force for market growth. The substantial expansion is particularly propelled by the increasing adoption of fuel cell electric vehicles (FCEVs) and simultaneous efforts in developing hydrogen infrastructure in these countries.
Fuel Cell Industry By Region
North America
- The US
- Canada
- Rest of North America
Europe
- Germany
- France
- The UK
- Spain
- Italy
- Russia
- Netherlands
- Rest of Europe
Asia-Pacific
- China
- Japan
- South Korea
- India
- New Zealand
- Singapore
- Thailand
- Vietnam
- Rest of Asia Pacific
Latin America
- Brazil
- Mexico
- Rest of Latin America
Middle East & Africa
- South Africa
- Saudi Arabia
- UAE
- Rest of Middle East & Africa
Fuel Cell Market Key Player Analysis
In the dynamic Fuel Cell Market, a sector at the forefront of clean energy technology, the listed companies play a pivotal role in propelling innovation, fostering commercialization, and promoting diverse applications.Plug Power Inc. and FuelCell Energy are significant players, recognized for their advanced fuel cell technologies in power generation and storage solutions. Their strategic positioning emphasizes renewable energy solutions and scalability, significantly influencing the market's growth trajectory.
Panasonic Corporation and Toshiba Energy Systems & Solutions Corporation are renowned for their contributions to residential and commercial fuel cell applications. Their focus on integrating fuel cells into broader energy systems underscores the market's move towards sustainable and efficient energy solutions.
Fuel Cell Industry Key Players
- Ceres Power Holdings
- Hyster-Yale Group
- Doosan Fuel Cell
- Hydrogenics
- AFC Energy
- Cell Impact AB
- Hazer Group Limited
- HydroPhi Technologies Group, Inc.
- SunHydrogen, Inc.
- ITM Power PLC
- MagneGas Corporation
- McPhy Energy SA
- myFC Holding AB
- Nel ASA
- Nikola Corporation
- PowerCell Sweden AB
- PowerHouse Energy Group plc
- FuelCell Energy
- Intelligent Energy Ltd.
- Panasonic Corporation
- Plug Power Inc.
- Toshiba Energy Systems & Solutions Corporation
Fuel Cell Market Recent Development
- In October 2023, TECO 2030 developed hydrogen fuel cells that allow ships and other heavy-duty equipment to be completely emission-free. TECO 2030's top-of-the-line fuel cell is a technically advanced, clean energy generation system. The advantages of the flexible 400kW fuel cell system include top energy efficiency, an inherent safety design, the most advanced dimensions and design of components longevity, as well as quick dynamic load response.
- In June 2023, Bloom Energy signed a deal to implement 2.5 megawatts (MW) of Bloom's Fuel Cell technology in England together with Perenco the Independent oil and natural gas company.
- In May, 2023 Ballard Power Systems has recently received an order for 3.6 milliwatts of fuel cell technology from a European firm that specializes in green energy solutions for stationary power requirements. The contract will see the delivery of 36 100 kW units between 2023-2024.
- In January 2023, Ballard Power Systems has recently announced an order for a fuel cell system that will be used for the Hollandse Kust Noord offshore wind project of CrossWind which is a joint venture of Shell as well as Eneco. This Hollandse Kust Noord offshore wind development, which is located in the southeastern part of the Netherlands is expected to be able to handle 759 MW and generate at least 3.3 TWh per year. Ballard's fuel cell technology will be integrated with the project to aid the project's operations.
Report Scope
Report Features Description Market Value (2023) USD 8.4 Billion Forecast Revenue (2033) USD 42.6 Billion CAGR (2024-2032) 18.11% Base Year for Estimation 2023 Historic Period 2016-2023 Forecast Period 2024-2033 Report Coverage Revenue Forecast, Market Dynamics, COVID-19 Impact, Competitive Landscape, Recent Developments Segments Covered By Product(Proton Exchange Membrane Fuel Cell, Phosphoric Acid Fuel Cell, Solid Oxide Fuel Cell, Molten Carbonate Fuel Cell, Others), By Application(Stationary, Transportation, Portable) Regional Analysis North America - The US, Canada, Rest of North America, Europe - Germany, France, The UK, Spain, Italy, Russia, Netherlands, Rest of Europe, Asia-Pacific - China, Japan, South Korea, India, New Zealand, Singapore, Thailand, Vietnam, Rest of Asia Pacific, Latin America - Brazil, Mexico, Rest of Latin America, Middle East & Africa - South Africa, Saudi Arabia, UAE, Rest of Middle East & Africa Competitive Landscape Ceres Power Holdings, Hyster-Yale Group, Doosan Fuel Cell, Hydrogenics, AFC Energy, Cell Impact AB, Hazer Group Limited, HydroPhi Technologies Group, Inc., SunHydrogen, Inc., ITM Power PLC, MagneGas Corporation, McPhy Energy SA, myFC Holding AB, Nel ASA, Nikola Corporation, PowerCell Sweden AB, PowerHouse Energy Group plc, FuelCell Energy, Intelligent Energy Ltd., Panasonic Corporation, Plug Power Inc., Toshiba Energy Systems & Solutions Corporation Customization Scope Customization for segments, region/country-level will be provided. Moreover, additional customization can be done based on the requirements. Purchase Options We have three licenses to opt for Single User License, Multi-User License (Up to 5 Users), Corporate Use License (Unlimited User and Printable PDF) -
- 1. Executive Summary
- 1.1. Definition
- 1.2. Taxonomy
- 1.3. Research Scope
- 1.4. Key Analysis
- 1.5. Key Findings by Major Segments
- 1.6. Top strategies by Major Players
- 2. Global Fuel Cell Market Overview
- 2.1. Fuel Cell Market Dynamics
- 2.1.1. Drivers
- 2.1.2. Opportunities
- 2.1.3. Restraints
- 2.1.4. Challenges
- 2.2. Macro-economic Factors
- 2.3. Regulatory Framework
- 2.4. Market Investment Feasibility Index
- 2.5. PEST Analysis
- 2.6. PORTER’S Five Force Analysis
- 2.7. Drivers & Restraints Impact Analysis
- 2.8. Industry Chain Analysis
- 2.9. Cost Structure Analysis
- 2.10. Marketing Strategy
- 2.11. Russia-Ukraine War Impact Analysis
- 2.12. Opportunity Map Analysis
- 2.13. Market Competition Scenario Analysis
- 2.14. Product Life Cycle Analysis
- 2.15. Opportunity Orbits
- 2.16. Manufacturer Intensity Map
- 2.17. Major Companies sales by Value & Volume
- 2.1. Fuel Cell Market Dynamics
- 3. Global Fuel Cell Market Analysis, Opportunity and Forecast, 2016-2032
- 3.1. Global Fuel Cell Market Analysis, 2016-2021
- 3.2. Global Fuel Cell Market Opportunity and Forecast, 2023-2032
- 3.3. Global Fuel Cell Market Analysis, Opportunity and Forecast, By By Product, 2016-2032
- 3.3.1. Global Fuel Cell Market Analysis by By Product: Introduction
- 3.3.2. Market Size Absolute $ Opportunity Analysis and Forecast, By By Product, 2016-2032
- 3.3.3. Proton Exchange Membrane Fuel Cell
- 3.3.4. Phosphoric Acid Fuel Cell
- 3.3.5. Solid Oxide Fuel Cell
- 3.3.6. Molten Carbonate Fuel Cell
- 3.3.7. Others
- 3.4. Global Fuel Cell Market Analysis, Opportunity and Forecast, By By Application, 2016-2032
- 3.4.1. Global Fuel Cell Market Analysis by By Application: Introduction
- 3.4.2. Market Size Absolute $ Opportunity Analysis and Forecast, By By Application, 2016-2032
- 3.4.3. Stationary
- 3.4.4. Transportation
- 3.4.5. Portable
- 4. North America Fuel Cell Market Analysis, Opportunity and Forecast, 2016-2032
- 4.1. North America Fuel Cell Market Analysis, 2016-2021
- 4.2. North America Fuel Cell Market Opportunity and Forecast, 2023-2032
- 4.3. North America Fuel Cell Market Analysis, Opportunity and Forecast, By By Product, 2016-2032
- 4.3.1. North America Fuel Cell Market Analysis by By Product: Introduction
- 4.3.2. Market Size Absolute $ Opportunity Analysis and Forecast, By By Product, 2016-2032
- 4.3.3. Proton Exchange Membrane Fuel Cell
- 4.3.4. Phosphoric Acid Fuel Cell
- 4.3.5. Solid Oxide Fuel Cell
- 4.3.6. Molten Carbonate Fuel Cell
- 4.3.7. Others
- 4.4. North America Fuel Cell Market Analysis, Opportunity and Forecast, By By Application, 2016-2032
- 4.4.1. North America Fuel Cell Market Analysis by By Application: Introduction
- 4.4.2. Market Size Absolute $ Opportunity Analysis and Forecast, By By Application, 2016-2032
- 4.4.3. Stationary
- 4.4.4. Transportation
- 4.4.5. Portable
- 4.5. North America Fuel Cell Market Analysis, Opportunity and Forecast, By Country , 2016-2032
- 4.5.1. North America Fuel Cell Market Analysis by Country : Introduction
- 4.5.2. Market Size Absolute $ Opportunity Analysis and Forecast, Country , 2016-2032
- 4.5.2.1. The US
- 4.5.2.2. Canada
- 4.5.2.3. Mexico
- 5. Western Europe Fuel Cell Market Analysis, Opportunity and Forecast, 2016-2032
- 5.1. Western Europe Fuel Cell Market Analysis, 2016-2021
- 5.2. Western Europe Fuel Cell Market Opportunity and Forecast, 2023-2032
- 5.3. Western Europe Fuel Cell Market Analysis, Opportunity and Forecast, By By Product, 2016-2032
- 5.3.1. Western Europe Fuel Cell Market Analysis by By Product: Introduction
- 5.3.2. Market Size Absolute $ Opportunity Analysis and Forecast, By By Product, 2016-2032
- 5.3.3. Proton Exchange Membrane Fuel Cell
- 5.3.4. Phosphoric Acid Fuel Cell
- 5.3.5. Solid Oxide Fuel Cell
- 5.3.6. Molten Carbonate Fuel Cell
- 5.3.7. Others
- 5.4. Western Europe Fuel Cell Market Analysis, Opportunity and Forecast, By By Application, 2016-2032
- 5.4.1. Western Europe Fuel Cell Market Analysis by By Application: Introduction
- 5.4.2. Market Size Absolute $ Opportunity Analysis and Forecast, By By Application, 2016-2032
- 5.4.3. Stationary
- 5.4.4. Transportation
- 5.4.5. Portable
- 5.5. Western Europe Fuel Cell Market Analysis, Opportunity and Forecast, By Country , 2016-2032
- 5.5.1. Western Europe Fuel Cell Market Analysis by Country : Introduction
- 5.5.2. Market Size Absolute $ Opportunity Analysis and Forecast, Country , 2016-2032
- 5.5.2.1. Germany
- 5.5.2.2. France
- 5.5.2.3. The UK
- 5.5.2.4. Spain
- 5.5.2.5. Italy
- 5.5.2.6. Portugal
- 5.5.2.7. Ireland
- 5.5.2.8. Austria
- 5.5.2.9. Switzerland
- 5.5.2.10. Benelux
- 5.5.2.11. Nordic
- 5.5.2.12. Rest of Western Europe
- 6. Eastern Europe Fuel Cell Market Analysis, Opportunity and Forecast, 2016-2032
- 6.1. Eastern Europe Fuel Cell Market Analysis, 2016-2021
- 6.2. Eastern Europe Fuel Cell Market Opportunity and Forecast, 2023-2032
- 6.3. Eastern Europe Fuel Cell Market Analysis, Opportunity and Forecast, By By Product, 2016-2032
- 6.3.1. Eastern Europe Fuel Cell Market Analysis by By Product: Introduction
- 6.3.2. Market Size Absolute $ Opportunity Analysis and Forecast, By By Product, 2016-2032
- 6.3.3. Proton Exchange Membrane Fuel Cell
- 6.3.4. Phosphoric Acid Fuel Cell
- 6.3.5. Solid Oxide Fuel Cell
- 6.3.6. Molten Carbonate Fuel Cell
- 6.3.7. Others
- 6.4. Eastern Europe Fuel Cell Market Analysis, Opportunity and Forecast, By By Application, 2016-2032
- 6.4.1. Eastern Europe Fuel Cell Market Analysis by By Application: Introduction
- 6.4.2. Market Size Absolute $ Opportunity Analysis and Forecast, By By Application, 2016-2032
- 6.4.3. Stationary
- 6.4.4. Transportation
- 6.4.5. Portable
- 6.5. Eastern Europe Fuel Cell Market Analysis, Opportunity and Forecast, By Country , 2016-2032
- 6.5.1. Eastern Europe Fuel Cell Market Analysis by Country : Introduction
- 6.5.2. Market Size Absolute $ Opportunity Analysis and Forecast, Country , 2016-2032
- 6.5.2.1. Russia
- 6.5.2.2. Poland
- 6.5.2.3. The Czech Republic
- 6.5.2.4. Greece
- 6.5.2.5. Rest of Eastern Europe
- 7. APAC Fuel Cell Market Analysis, Opportunity and Forecast, 2016-2032
- 7.1. APAC Fuel Cell Market Analysis, 2016-2021
- 7.2. APAC Fuel Cell Market Opportunity and Forecast, 2023-2032
- 7.3. APAC Fuel Cell Market Analysis, Opportunity and Forecast, By By Product, 2016-2032
- 7.3.1. APAC Fuel Cell Market Analysis by By Product: Introduction
- 7.3.2. Market Size Absolute $ Opportunity Analysis and Forecast, By By Product, 2016-2032
- 7.3.3. Proton Exchange Membrane Fuel Cell
- 7.3.4. Phosphoric Acid Fuel Cell
- 7.3.5. Solid Oxide Fuel Cell
- 7.3.6. Molten Carbonate Fuel Cell
- 7.3.7. Others
- 7.4. APAC Fuel Cell Market Analysis, Opportunity and Forecast, By By Application, 2016-2032
- 7.4.1. APAC Fuel Cell Market Analysis by By Application: Introduction
- 7.4.2. Market Size Absolute $ Opportunity Analysis and Forecast, By By Application, 2016-2032
- 7.4.3. Stationary
- 7.4.4. Transportation
- 7.4.5. Portable
- 7.5. APAC Fuel Cell Market Analysis, Opportunity and Forecast, By Country , 2016-2032
- 7.5.1. APAC Fuel Cell Market Analysis by Country : Introduction
- 7.5.2. Market Size Absolute $ Opportunity Analysis and Forecast, Country , 2016-2032
- 7.5.2.1. China
- 7.5.2.2. Japan
- 7.5.2.3. South Korea
- 7.5.2.4. India
- 7.5.2.5. Australia & New Zeland
- 7.5.2.6. Indonesia
- 7.5.2.7. Malaysia
- 7.5.2.8. Philippines
- 7.5.2.9. Singapore
- 7.5.2.10. Thailand
- 7.5.2.11. Vietnam
- 7.5.2.12. Rest of APAC
- 8. Latin America Fuel Cell Market Analysis, Opportunity and Forecast, 2016-2032
- 8.1. Latin America Fuel Cell Market Analysis, 2016-2021
- 8.2. Latin America Fuel Cell Market Opportunity and Forecast, 2023-2032
- 8.3. Latin America Fuel Cell Market Analysis, Opportunity and Forecast, By By Product, 2016-2032
- 8.3.1. Latin America Fuel Cell Market Analysis by By Product: Introduction
- 8.3.2. Market Size Absolute $ Opportunity Analysis and Forecast, By By Product, 2016-2032
- 8.3.3. Proton Exchange Membrane Fuel Cell
- 8.3.4. Phosphoric Acid Fuel Cell
- 8.3.5. Solid Oxide Fuel Cell
- 8.3.6. Molten Carbonate Fuel Cell
- 8.3.7. Others
- 8.4. Latin America Fuel Cell Market Analysis, Opportunity and Forecast, By By Application, 2016-2032
- 8.4.1. Latin America Fuel Cell Market Analysis by By Application: Introduction
- 8.4.2. Market Size Absolute $ Opportunity Analysis and Forecast, By By Application, 2016-2032
- 8.4.3. Stationary
- 8.4.4. Transportation
- 8.4.5. Portable
- 8.5. Latin America Fuel Cell Market Analysis, Opportunity and Forecast, By Country , 2016-2032
- 8.5.1. Latin America Fuel Cell Market Analysis by Country : Introduction
- 8.5.2. Market Size Absolute $ Opportunity Analysis and Forecast, Country , 2016-2032
- 8.5.2.1. Brazil
- 8.5.2.2. Colombia
- 8.5.2.3. Chile
- 8.5.2.4. Argentina
- 8.5.2.5. Costa Rica
- 8.5.2.6. Rest of Latin America
- 9. Middle East & Africa Fuel Cell Market Analysis, Opportunity and Forecast, 2016-2032
- 9.1. Middle East & Africa Fuel Cell Market Analysis, 2016-2021
- 9.2. Middle East & Africa Fuel Cell Market Opportunity and Forecast, 2023-2032
- 9.3. Middle East & Africa Fuel Cell Market Analysis, Opportunity and Forecast, By By Product, 2016-2032
- 9.3.1. Middle East & Africa Fuel Cell Market Analysis by By Product: Introduction
- 9.3.2. Market Size Absolute $ Opportunity Analysis and Forecast, By By Product, 2016-2032
- 9.3.3. Proton Exchange Membrane Fuel Cell
- 9.3.4. Phosphoric Acid Fuel Cell
- 9.3.5. Solid Oxide Fuel Cell
- 9.3.6. Molten Carbonate Fuel Cell
- 9.3.7. Others
- 9.4. Middle East & Africa Fuel Cell Market Analysis, Opportunity and Forecast, By By Application, 2016-2032
- 9.4.1. Middle East & Africa Fuel Cell Market Analysis by By Application: Introduction
- 9.4.2. Market Size Absolute $ Opportunity Analysis and Forecast, By By Application, 2016-2032
- 9.4.3. Stationary
- 9.4.4. Transportation
- 9.4.5. Portable
- 9.5. Middle East & Africa Fuel Cell Market Analysis, Opportunity and Forecast, By Country , 2016-2032
- 9.5.1. Middle East & Africa Fuel Cell Market Analysis by Country : Introduction
- 9.5.2. Market Size Absolute $ Opportunity Analysis and Forecast, Country , 2016-2032
- 9.5.2.1. Algeria
- 9.5.2.2. Egypt
- 9.5.2.3. Israel
- 9.5.2.4. Kuwait
- 9.5.2.5. Nigeria
- 9.5.2.6. Saudi Arabia
- 9.5.2.7. South Africa
- 9.5.2.8. Turkey
- 9.5.2.9. The UAE
- 9.5.2.10. Rest of MEA
- 10. Global Fuel Cell Market Analysis, Opportunity and Forecast, By Region , 2016-2032
- 10.1. Global Fuel Cell Market Analysis by Region : Introduction
- 10.2. Market Size Absolute $ Opportunity Analysis and Forecast, By Region , 2016-2032
- 10.2.1. North America
- 10.2.2. Western Europe
- 10.2.3. Eastern Europe
- 10.2.4. APAC
- 10.2.5. Latin America
- 10.2.6. Middle East & Africa
- 11. Global Fuel Cell Market Competitive Landscape, Market Share Analysis, and Company Profiles
- 11.1. Market Share Analysis
- 11.2. Company Profiles
- 11.3. Ceres Power Holdings
- 11.3.1. Company Overview
- 11.3.2. Financial Highlights
- 11.3.3. Product Portfolio
- 11.3.4. SWOT Analysis
- 11.3.5. Key Strategies and Developments
- 11.4. Hyster-Yale Group
- 11.4.1. Company Overview
- 11.4.2. Financial Highlights
- 11.4.3. Product Portfolio
- 11.4.4. SWOT Analysis
- 11.4.5. Key Strategies and Developments
- 11.5. Doosan Fuel Cell
- 11.5.1. Company Overview
- 11.5.2. Financial Highlights
- 11.5.3. Product Portfolio
- 11.5.4. SWOT Analysis
- 11.5.5. Key Strategies and Developments
- 11.6. Hydrogenics
- 11.6.1. Company Overview
- 11.6.2. Financial Highlights
- 11.6.3. Product Portfolio
- 11.6.4. SWOT Analysis
- 11.6.5. Key Strategies and Developments
- 11.7. AFC Energy
- 11.7.1. Company Overview
- 11.7.2. Financial Highlights
- 11.7.3. Product Portfolio
- 11.7.4. SWOT Analysis
- 11.7.5. Key Strategies and Developments
- 11.8. Cell Impact AB
- 11.8.1. Company Overview
- 11.8.2. Financial Highlights
- 11.8.3. Product Portfolio
- 11.8.4. SWOT Analysis
- 11.8.5. Key Strategies and Developments
- 11.9. Hazer Group Limited
- 11.9.1. Company Overview
- 11.9.2. Financial Highlights
- 11.9.3. Product Portfolio
- 11.9.4. SWOT Analysis
- 11.9.5. Key Strategies and Developments
- 11.10. HydroPhi Technologies Group, Inc.
- 11.10.1. Company Overview
- 11.10.2. Financial Highlights
- 11.10.3. Product Portfolio
- 11.10.4. SWOT Analysis
- 11.10.5. Key Strategies and Developments
- 11.11. SunHydrogen, Inc.
- 11.11.1. Company Overview
- 11.11.2. Financial Highlights
- 11.11.3. Product Portfolio
- 11.11.4. SWOT Analysis
- 11.11.5. Key Strategies and Developments
- 11.12. ITM Power PLC
- 11.12.1. Company Overview
- 11.12.2. Financial Highlights
- 11.12.3. Product Portfolio
- 11.12.4. SWOT Analysis
- 11.12.5. Key Strategies and Developments
- 11.13.1. Company Overview
- 11.13.2. Financial Highlights
- 11.13.3. Product Portfolio
- 11.13.4. SWOT Analysis
- 11.13.5. Key Strategies and Developments
- 11.14. MagneGas Corporation
- 11.14.1. Company Overview
- 11.14.2. Financial Highlights
- 11.14.3. Product Portfolio
- 11.14.4. SWOT Analysis
- 11.14.5. Key Strategies and Developments
- 11.15. myFC Holding AB
- 11.15.1. Company Overview
- 11.15.2. Financial Highlights
- 11.15.3. Product Portfolio
- 11.15.4. SWOT Analysis
- 11.15.5. Key Strategies and Developments
- 11.16. Nel ASA
- 11.16.1. Company Overview
- 11.16.2. Financial Highlights
- 11.16.3. Product Portfolio
- 11.16.4. SWOT Analysis
- 11.16.5. Key Strategies and Developments
- 11.17. Nikola Corporation
- 11.17.1. Company Overview
- 11.17.2. Financial Highlights
- 11.17.3. Product Portfolio
- 11.17.4. SWOT Analysis
- 11.17.5. Key Strategies and Developments
- 11.18. PowerCell Sweden AB
- 11.18.1. Company Overview
- 11.18.2. Financial Highlights
- 11.18.3. Product Portfolio
- 11.18.4. SWOT Analysis
- 11.18.5. Key Strategies and Developments
- 11.19. PowerHouse Energy Group plc
- 11.19.1. Company Overview
- 11.19.2. Financial Highlights
- 11.19.3. Product Portfolio
- 11.19.4. SWOT Analysis
- 11.19.5. Key Strategies and Developments
- 11.20. FuelCell Energy
- 11.20.1. Company Overview
- 11.20.2. Financial Highlights
- 11.20.3. Product Portfolio
- 11.20.4. SWOT Analysis
- 11.20.5. Key Strategies and Developments
- 11.21. Intelligent Energy Ltd.
- 11.21.1. Company Overview
- 11.21.2. Financial Highlights
- 11.21.3. Product Portfolio
- 11.21.4. SWOT Analysis
- 11.21.5. Key Strategies and Developments
- 11.22. Panasonic Corporation
- 11.22.1. Company Overview
- 11.22.2. Financial Highlights
- 11.22.3. Product Portfolio
- 11.22.4. SWOT Analysis
- 11.22.5. Key Strategies and Developments
- 12. Assumptions and Acronyms
- 13. Research Methodology
- 14. Contact
"
- List of Figures
- "
- Figure 1: Global Fuel Cell Market Revenue (US$ Mn) Market Share by By Product in 2022
- Figure 2: Global Fuel Cell Market Market Attractiveness Analysis by By Product, 2016-2032
- Figure 3: Global Fuel Cell Market Revenue (US$ Mn) Market Share by By Applicationin 2022
- Figure 4: Global Fuel Cell Market Market Attractiveness Analysis by By Application, 2016-2032
- Figure 5: Global Fuel Cell Market Revenue (US$ Mn) Market Share by Region in 2022
- Figure 6: Global Fuel Cell Market Market Attractiveness Analysis by Region, 2016-2032
- Figure 7: Global Fuel Cell Market Market Revenue (US$ Mn) (2016-2032)
- Figure 8: Global Fuel Cell Market Market Revenue (US$ Mn) Comparison by Region (2016-2032)
- Figure 9: Global Fuel Cell Market Market Revenue (US$ Mn) Comparison by By Product (2016-2032)
- Figure 10: Global Fuel Cell Market Market Revenue (US$ Mn) Comparison by By Application (2016-2032)
- Figure 11: Global Fuel Cell Market Market Y-o-Y Growth Rate Comparison by Region (2016-2032)
- Figure 12: Global Fuel Cell Market Market Y-o-Y Growth Rate Comparison by By Product (2016-2032)
- Figure 13: Global Fuel Cell Market Market Y-o-Y Growth Rate Comparison by By Application (2016-2032)
- Figure 14: Global Fuel Cell Market Market Share Comparison by Region (2016-2032)
- Figure 15: Global Fuel Cell Market Market Share Comparison by By Product (2016-2032)
- Figure 16: Global Fuel Cell Market Market Share Comparison by By Application (2016-2032)
- Figure 17: North America Fuel Cell Market Revenue (US$ Mn) Market Share by By Productin 2022
- Figure 18: North America Fuel Cell Market Market Attractiveness Analysis by By Product, 2016-2032
- Figure 19: North America Fuel Cell Market Revenue (US$ Mn) Market Share by By Applicationin 2022
- Figure 20: North America Fuel Cell Market Market Attractiveness Analysis by By Application, 2016-2032
- Figure 21: North America Fuel Cell Market Revenue (US$ Mn) Market Share by Country in 2022
- Figure 22: North America Fuel Cell Market Market Attractiveness Analysis by Country, 2016-2032
- Figure 23: North America Fuel Cell Market Market Revenue (US$ Mn) (2016-2032)
- Figure 24: North America Fuel Cell Market Market Revenue (US$ Mn) Comparison by Country (2016-2032)
- Figure 25: North America Fuel Cell Market Market Revenue (US$ Mn) Comparison by By Product (2016-2032)
- Figure 26: North America Fuel Cell Market Market Revenue (US$ Mn) Comparison by By Application (2016-2032)
- Figure 27: North America Fuel Cell Market Market Y-o-Y Growth Rate Comparison by Country (2016-2032)
- Figure 28: North America Fuel Cell Market Market Y-o-Y Growth Rate Comparison by By Product (2016-2032)
- Figure 29: North America Fuel Cell Market Market Y-o-Y Growth Rate Comparison by By Application (2016-2032)
- Figure 30: North America Fuel Cell Market Market Share Comparison by Country (2016-2032)
- Figure 31: North America Fuel Cell Market Market Share Comparison by By Product (2016-2032)
- Figure 32: North America Fuel Cell Market Market Share Comparison by By Application (2016-2032)
- Figure 33: Western Europe Fuel Cell Market Revenue (US$ Mn) Market Share by By Productin 2022
- Figure 34: Western Europe Fuel Cell Market Market Attractiveness Analysis by By Product, 2016-2032
- Figure 35: Western Europe Fuel Cell Market Revenue (US$ Mn) Market Share by By Applicationin 2022
- Figure 36: Western Europe Fuel Cell Market Market Attractiveness Analysis by By Application, 2016-2032
- Figure 37: Western Europe Fuel Cell Market Revenue (US$ Mn) Market Share by Country in 2022
- Figure 38: Western Europe Fuel Cell Market Market Attractiveness Analysis by Country, 2016-2032
- Figure 39: Western Europe Fuel Cell Market Market Revenue (US$ Mn) (2016-2032)
- Figure 40: Western Europe Fuel Cell Market Market Revenue (US$ Mn) Comparison by Country (2016-2032)
- Figure 41: Western Europe Fuel Cell Market Market Revenue (US$ Mn) Comparison by By Product (2016-2032)
- Figure 42: Western Europe Fuel Cell Market Market Revenue (US$ Mn) Comparison by By Application (2016-2032)
- Figure 43: Western Europe Fuel Cell Market Market Y-o-Y Growth Rate Comparison by Country (2016-2032)
- Figure 44: Western Europe Fuel Cell Market Market Y-o-Y Growth Rate Comparison by By Product (2016-2032)
- Figure 45: Western Europe Fuel Cell Market Market Y-o-Y Growth Rate Comparison by By Application (2016-2032)
- Figure 46: Western Europe Fuel Cell Market Market Share Comparison by Country (2016-2032)
- Figure 47: Western Europe Fuel Cell Market Market Share Comparison by By Product (2016-2032)
- Figure 48: Western Europe Fuel Cell Market Market Share Comparison by By Application (2016-2032)
- Figure 49: Eastern Europe Fuel Cell Market Revenue (US$ Mn) Market Share by By Productin 2022
- Figure 50: Eastern Europe Fuel Cell Market Market Attractiveness Analysis by By Product, 2016-2032
- Figure 51: Eastern Europe Fuel Cell Market Revenue (US$ Mn) Market Share by By Applicationin 2022
- Figure 52: Eastern Europe Fuel Cell Market Market Attractiveness Analysis by By Application, 2016-2032
- Figure 53: Eastern Europe Fuel Cell Market Revenue (US$ Mn) Market Share by Country in 2022
- Figure 54: Eastern Europe Fuel Cell Market Market Attractiveness Analysis by Country, 2016-2032
- Figure 55: Eastern Europe Fuel Cell Market Market Revenue (US$ Mn) (2016-2032)
- Figure 56: Eastern Europe Fuel Cell Market Market Revenue (US$ Mn) Comparison by Country (2016-2032)
- Figure 57: Eastern Europe Fuel Cell Market Market Revenue (US$ Mn) Comparison by By Product (2016-2032)
- Figure 58: Eastern Europe Fuel Cell Market Market Revenue (US$ Mn) Comparison by By Application (2016-2032)
- Figure 59: Eastern Europe Fuel Cell Market Market Y-o-Y Growth Rate Comparison by Country (2016-2032)
- Figure 60: Eastern Europe Fuel Cell Market Market Y-o-Y Growth Rate Comparison by By Product (2016-2032)
- Figure 61: Eastern Europe Fuel Cell Market Market Y-o-Y Growth Rate Comparison by By Application (2016-2032)
- Figure 62: Eastern Europe Fuel Cell Market Market Share Comparison by Country (2016-2032)
- Figure 63: Eastern Europe Fuel Cell Market Market Share Comparison by By Product (2016-2032)
- Figure 64: Eastern Europe Fuel Cell Market Market Share Comparison by By Application (2016-2032)
- Figure 65: APAC Fuel Cell Market Revenue (US$ Mn) Market Share by By Productin 2022
- Figure 66: APAC Fuel Cell Market Market Attractiveness Analysis by By Product, 2016-2032
- Figure 67: APAC Fuel Cell Market Revenue (US$ Mn) Market Share by By Applicationin 2022
- Figure 68: APAC Fuel Cell Market Market Attractiveness Analysis by By Application, 2016-2032
- Figure 69: APAC Fuel Cell Market Revenue (US$ Mn) Market Share by Country in 2022
- Figure 70: APAC Fuel Cell Market Market Attractiveness Analysis by Country, 2016-2032
- Figure 71: APAC Fuel Cell Market Market Revenue (US$ Mn) (2016-2032)
- Figure 72: APAC Fuel Cell Market Market Revenue (US$ Mn) Comparison by Country (2016-2032)
- Figure 73: APAC Fuel Cell Market Market Revenue (US$ Mn) Comparison by By Product (2016-2032)
- Figure 74: APAC Fuel Cell Market Market Revenue (US$ Mn) Comparison by By Application (2016-2032)
- Figure 75: APAC Fuel Cell Market Market Y-o-Y Growth Rate Comparison by Country (2016-2032)
- Figure 76: APAC Fuel Cell Market Market Y-o-Y Growth Rate Comparison by By Product (2016-2032)
- Figure 77: APAC Fuel Cell Market Market Y-o-Y Growth Rate Comparison by By Application (2016-2032)
- Figure 78: APAC Fuel Cell Market Market Share Comparison by Country (2016-2032)
- Figure 79: APAC Fuel Cell Market Market Share Comparison by By Product (2016-2032)
- Figure 80: APAC Fuel Cell Market Market Share Comparison by By Application (2016-2032)
- Figure 81: Latin America Fuel Cell Market Revenue (US$ Mn) Market Share by By Productin 2022
- Figure 82: Latin America Fuel Cell Market Market Attractiveness Analysis by By Product, 2016-2032
- Figure 83: Latin America Fuel Cell Market Revenue (US$ Mn) Market Share by By Applicationin 2022
- Figure 84: Latin America Fuel Cell Market Market Attractiveness Analysis by By Application, 2016-2032
- Figure 85: Latin America Fuel Cell Market Revenue (US$ Mn) Market Share by Country in 2022
- Figure 86: Latin America Fuel Cell Market Market Attractiveness Analysis by Country, 2016-2032
- Figure 87: Latin America Fuel Cell Market Market Revenue (US$ Mn) (2016-2032)
- Figure 88: Latin America Fuel Cell Market Market Revenue (US$ Mn) Comparison by Country (2016-2032)
- Figure 89: Latin America Fuel Cell Market Market Revenue (US$ Mn) Comparison by By Product (2016-2032)
- Figure 90: Latin America Fuel Cell Market Market Revenue (US$ Mn) Comparison by By Application (2016-2032)
- Figure 91: Latin America Fuel Cell Market Market Y-o-Y Growth Rate Comparison by Country (2016-2032)
- Figure 92: Latin America Fuel Cell Market Market Y-o-Y Growth Rate Comparison by By Product (2016-2032)
- Figure 93: Latin America Fuel Cell Market Market Y-o-Y Growth Rate Comparison by By Application (2016-2032)
- Figure 94: Latin America Fuel Cell Market Market Share Comparison by Country (2016-2032)
- Figure 95: Latin America Fuel Cell Market Market Share Comparison by By Product (2016-2032)
- Figure 96: Latin America Fuel Cell Market Market Share Comparison by By Application (2016-2032)
- Figure 97: Middle East & Africa Fuel Cell Market Revenue (US$ Mn) Market Share by By Productin 2022
- Figure 98: Middle East & Africa Fuel Cell Market Market Attractiveness Analysis by By Product, 2016-2032
- Figure 99: Middle East & Africa Fuel Cell Market Revenue (US$ Mn) Market Share by By Applicationin 2022
- Figure 100: Middle East & Africa Fuel Cell Market Market Attractiveness Analysis by By Application, 2016-2032
- Figure 101: Middle East & Africa Fuel Cell Market Revenue (US$ Mn) Market Share by Country in 2022
- Figure 102: Middle East & Africa Fuel Cell Market Market Attractiveness Analysis by Country, 2016-2032
- Figure 103: Middle East & Africa Fuel Cell Market Market Revenue (US$ Mn) (2016-2032)
- Figure 104: Middle East & Africa Fuel Cell Market Market Revenue (US$ Mn) Comparison by Country (2016-2032)
- Figure 105: Middle East & Africa Fuel Cell Market Market Revenue (US$ Mn) Comparison by By Product (2016-2032)
- Figure 106: Middle East & Africa Fuel Cell Market Market Revenue (US$ Mn) Comparison by By Application (2016-2032)
- Figure 107: Middle East & Africa Fuel Cell Market Market Y-o-Y Growth Rate Comparison by Country (2016-2032)
- Figure 108: Middle East & Africa Fuel Cell Market Market Y-o-Y Growth Rate Comparison by By Product (2016-2032)
- Figure 109: Middle East & Africa Fuel Cell Market Market Y-o-Y Growth Rate Comparison by By Application (2016-2032)
- Figure 110: Middle East & Africa Fuel Cell Market Market Share Comparison by Country (2016-2032)
- Figure 111: Middle East & Africa Fuel Cell Market Market Share Comparison by By Product (2016-2032)
- Figure 112: Middle East & Africa Fuel Cell Market Market Share Comparison by By Application (2016-2032)
"
- List of Tables
- "
- Table 1: Global Fuel Cell Market Market Comparison by By Product (2016-2032)
- Table 2: Global Fuel Cell Market Market Comparison by By Application (2016-2032)
- Table 3: Global Fuel Cell Market Revenue (US$ Mn) Comparison by Region (2016-2032)
- Table 4: Global Fuel Cell Market Market Revenue (US$ Mn) (2016-2032)
- Table 5: Global Fuel Cell Market Market Revenue (US$ Mn) Comparison by Region (2016-2032)
- Table 6: Global Fuel Cell Market Market Revenue (US$ Mn) Comparison by By Product (2016-2032)
- Table 7: Global Fuel Cell Market Market Revenue (US$ Mn) Comparison by By Application (2016-2032)
- Table 8: Global Fuel Cell Market Market Y-o-Y Growth Rate Comparison by Region (2016-2032)
- Table 9: Global Fuel Cell Market Market Y-o-Y Growth Rate Comparison by By Product (2016-2032)
- Table 10: Global Fuel Cell Market Market Y-o-Y Growth Rate Comparison by By Application (2016-2032)
- Table 11: Global Fuel Cell Market Market Share Comparison by Region (2016-2032)
- Table 12: Global Fuel Cell Market Market Share Comparison by By Product (2016-2032)
- Table 13: Global Fuel Cell Market Market Share Comparison by By Application (2016-2032)
- Table 14: North America Fuel Cell Market Market Comparison by By Application (2016-2032)
- Table 15: North America Fuel Cell Market Revenue (US$ Mn) Comparison by Country (2016-2032)
- Table 16: North America Fuel Cell Market Market Revenue (US$ Mn) (2016-2032)
- Table 17: North America Fuel Cell Market Market Revenue (US$ Mn) Comparison by Country (2016-2032)
- Table 18: North America Fuel Cell Market Market Revenue (US$ Mn) Comparison by By Product (2016-2032)
- Table 19: North America Fuel Cell Market Market Revenue (US$ Mn) Comparison by By Application (2016-2032)
- Table 20: North America Fuel Cell Market Market Y-o-Y Growth Rate Comparison by Country (2016-2032)
- Table 21: North America Fuel Cell Market Market Y-o-Y Growth Rate Comparison by By Product (2016-2032)
- Table 22: North America Fuel Cell Market Market Y-o-Y Growth Rate Comparison by By Application (2016-2032)
- Table 23: North America Fuel Cell Market Market Share Comparison by Country (2016-2032)
- Table 24: North America Fuel Cell Market Market Share Comparison by By Product (2016-2032)
- Table 25: North America Fuel Cell Market Market Share Comparison by By Application (2016-2032)
- Table 26: Western Europe Fuel Cell Market Market Comparison by By Product (2016-2032)
- Table 27: Western Europe Fuel Cell Market Market Comparison by By Application (2016-2032)
- Table 28: Western Europe Fuel Cell Market Revenue (US$ Mn) Comparison by Country (2016-2032)
- Table 29: Western Europe Fuel Cell Market Market Revenue (US$ Mn) (2016-2032)
- Table 30: Western Europe Fuel Cell Market Market Revenue (US$ Mn) Comparison by Country (2016-2032)
- Table 31: Western Europe Fuel Cell Market Market Revenue (US$ Mn) Comparison by By Product (2016-2032)
- Table 32: Western Europe Fuel Cell Market Market Revenue (US$ Mn) Comparison by By Application (2016-2032)
- Table 33: Western Europe Fuel Cell Market Market Y-o-Y Growth Rate Comparison by Country (2016-2032)
- Table 34: Western Europe Fuel Cell Market Market Y-o-Y Growth Rate Comparison by By Product (2016-2032)
- Table 35: Western Europe Fuel Cell Market Market Y-o-Y Growth Rate Comparison by By Application (2016-2032)
- Table 36: Western Europe Fuel Cell Market Market Share Comparison by Country (2016-2032)
- Table 37: Western Europe Fuel Cell Market Market Share Comparison by By Product (2016-2032)
- Table 38: Western Europe Fuel Cell Market Market Share Comparison by By Application (2016-2032)
- Table 39: Eastern Europe Fuel Cell Market Market Comparison by By Product (2016-2032)
- Table 40: Eastern Europe Fuel Cell Market Market Comparison by By Application (2016-2032)
- Table 41: Eastern Europe Fuel Cell Market Revenue (US$ Mn) Comparison by Country (2016-2032)
- Table 42: Eastern Europe Fuel Cell Market Market Revenue (US$ Mn) (2016-2032)
- Table 43: Eastern Europe Fuel Cell Market Market Revenue (US$ Mn) Comparison by Country (2016-2032)
- Table 44: Eastern Europe Fuel Cell Market Market Revenue (US$ Mn) Comparison by By Product (2016-2032)
- Table 45: Eastern Europe Fuel Cell Market Market Revenue (US$ Mn) Comparison by By Application (2016-2032)
- Table 46: Eastern Europe Fuel Cell Market Market Y-o-Y Growth Rate Comparison by Country (2016-2032)
- Table 47: Eastern Europe Fuel Cell Market Market Y-o-Y Growth Rate Comparison by By Product (2016-2032)
- Table 48: Eastern Europe Fuel Cell Market Market Y-o-Y Growth Rate Comparison by By Application (2016-2032)
- Table 49: Eastern Europe Fuel Cell Market Market Share Comparison by Country (2016-2032)
- Table 50: Eastern Europe Fuel Cell Market Market Share Comparison by By Product (2016-2032)
- Table 51: Eastern Europe Fuel Cell Market Market Share Comparison by By Application (2016-2032)
- Table 52: APAC Fuel Cell Market Market Comparison by By Product (2016-2032)
- Table 53: APAC Fuel Cell Market Market Comparison by By Application (2016-2032)
- Table 54: APAC Fuel Cell Market Revenue (US$ Mn) Comparison by Country (2016-2032)
- Table 55: APAC Fuel Cell Market Market Revenue (US$ Mn) (2016-2032)
- Table 56: APAC Fuel Cell Market Market Revenue (US$ Mn) Comparison by Country (2016-2032)
- Table 57: APAC Fuel Cell Market Market Revenue (US$ Mn) Comparison by By Product (2016-2032)
- Table 58: APAC Fuel Cell Market Market Revenue (US$ Mn) Comparison by By Application (2016-2032)
- Table 59: APAC Fuel Cell Market Market Y-o-Y Growth Rate Comparison by Country (2016-2032)
- Table 60: APAC Fuel Cell Market Market Y-o-Y Growth Rate Comparison by By Product (2016-2032)
- Table 61: APAC Fuel Cell Market Market Y-o-Y Growth Rate Comparison by By Application (2016-2032)
- Table 62: APAC Fuel Cell Market Market Share Comparison by Country (2016-2032)
- Table 63: APAC Fuel Cell Market Market Share Comparison by By Product (2016-2032)
- Table 64: APAC Fuel Cell Market Market Share Comparison by By Application (2016-2032)
- Table 65: Latin America Fuel Cell Market Market Comparison by By Product (2016-2032)
- Table 66: Latin America Fuel Cell Market Market Comparison by By Application (2016-2032)
- Table 67: Latin America Fuel Cell Market Revenue (US$ Mn) Comparison by Country (2016-2032)
- Table 68: Latin America Fuel Cell Market Market Revenue (US$ Mn) (2016-2032)
- Table 69: Latin America Fuel Cell Market Market Revenue (US$ Mn) Comparison by Country (2016-2032)
- Table 70: Latin America Fuel Cell Market Market Revenue (US$ Mn) Comparison by By Product (2016-2032)
- Table 71: Latin America Fuel Cell Market Market Revenue (US$ Mn) Comparison by By Application (2016-2032)
- Table 72: Latin America Fuel Cell Market Market Y-o-Y Growth Rate Comparison by Country (2016-2032)
- Table 73: Latin America Fuel Cell Market Market Y-o-Y Growth Rate Comparison by By Product (2016-2032)
- Table 74: Latin America Fuel Cell Market Market Y-o-Y Growth Rate Comparison by By Application (2016-2032)
- Table 75: Latin America Fuel Cell Market Market Share Comparison by Country (2016-2032)
- Table 76: Latin America Fuel Cell Market Market Share Comparison by By Product (2016-2032)
- Table 77: Latin America Fuel Cell Market Market Share Comparison by By Application (2016-2032)
- Table 78: Middle East & Africa Fuel Cell Market Market Comparison by By Product (2016-2032)
- Table 79: Middle East & Africa Fuel Cell Market Market Comparison by By Application (2016-2032)
- Table 80: Middle East & Africa Fuel Cell Market Revenue (US$ Mn) Comparison by Country (2016-2032)
- Table 81: Middle East & Africa Fuel Cell Market Market Revenue (US$ Mn) (2016-2032)
- Table 82: Middle East & Africa Fuel Cell Market Market Revenue (US$ Mn) Comparison by Country (2016-2032)
- Table 83: Middle East & Africa Fuel Cell Market Market Revenue (US$ Mn) Comparison by By Product (2016-2032)
- Table 84: Middle East & Africa Fuel Cell Market Market Revenue (US$ Mn) Comparison by By Application (2016-2032)
- Table 85: Middle East & Africa Fuel Cell Market Market Y-o-Y Growth Rate Comparison by Country (2016-2032)
- Table 86: Middle East & Africa Fuel Cell Market Market Y-o-Y Growth Rate Comparison by By Product (2016-2032)
- Table 87: Middle East & Africa Fuel Cell Market Market Y-o-Y Growth Rate Comparison by By Application (2016-2032)
- Table 88: Middle East & Africa Fuel Cell Market Market Share Comparison by Country (2016-2032)
- Table 89: Middle East & Africa Fuel Cell Market Market Share Comparison by By Product (2016-2032)
- Table 90: Middle East & Africa Fuel Cell Market Market Share Comparison by By Application (2016-2032)
- 1. Executive Summary
-
- Ceres Power Holdings
- Hyster-Yale Group
- Doosan Fuel Cell
- Hydrogenics
- AFC Energy
- Cell Impact AB
- Hazer Group Limited
- HydroPhi Technologies Group, Inc.
- SunHydrogen, Inc.
- ITM Power PLC
- MagneGas Corporation
- McPhy Energy SA
- myFC Holding AB
- Nel ASA
- Nikola Corporation
- PowerCell Sweden AB
- PowerHouse Energy Group plc
- FuelCell Energy
- Intelligent Energy Ltd.
- Panasonic Corporation
- Plug Power Inc.
- Toshiba Energy Systems & Solutions Corporation
Our Clients


View Our Licence Options
