Glamping Market By Accommodation Type(Yurts, Cabins and Pods, Others), By Target(Families, Young couples), Age Group(18-32 years, 33-50 years, Above 65 years), By Region And Companies - Industry Segment Outlook, Market Assessment, Competition Scenario, Trends, And Forecast 2023-2032
-
15866
-
Nov 2023
-
181
-


-
This report was compiled by Research Team Research team of over 50 passionate professionals leverages advanced research methodologies and analytical expertise to deliver insightful, data-driven market intelligence that empowers businesses across diverse industries to make strategic, well-informed Correspondence Research Team Linkedin | Detailed Market research Methodology Our methodology involves a mix of primary research, including interviews with leading mental health experts, and secondary research from reputable medical journals and databases. View Detailed Methodology Page
-
Quick Navigation
Report Overview
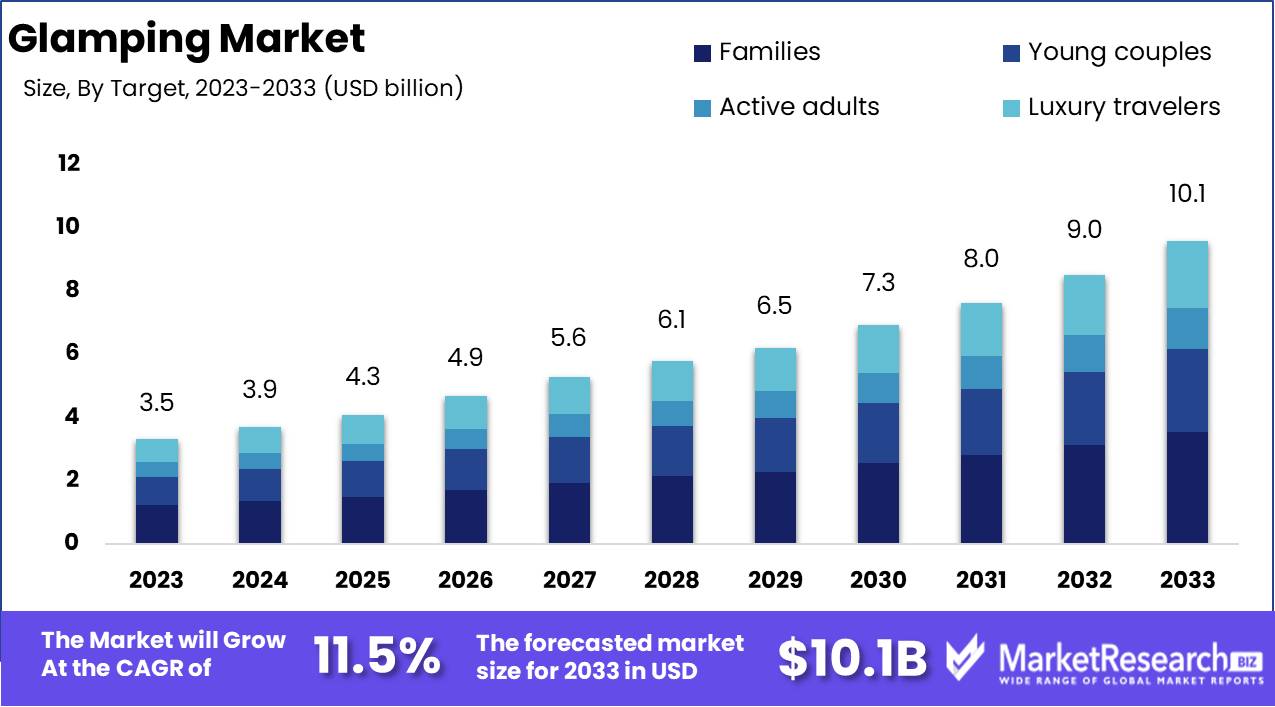
The Glamping Market was valued at USD 3.4 billion in 2023. It is expected to reach USD 10.1 billion by 2033, with a CAGR of 11.5% during the forecast period from 2024 to 2033.
The Glamping Market encompasses the luxury camping sector, offering unique outdoor experiences with the comfort and amenities of upscale accommodations. This market caters to consumers seeking an alternative to traditional camping, blending nature with modern conveniences such as fully furnished tents, cabins, and treehouses. Factors driving its growth include a rising interest in experiential travel, increased disposable income, and a desire for sustainable tourism. Glamping appeals to a broad demographic, from adventure enthusiasts to families and couples, making it a versatile segment within the travel and hospitality industry, poised for substantial expansion in the coming years.
The glamping market is witnessing a significant upsurge driven by the evolving preferences of experience-seeking travelers who prioritize unique and luxury accommodations. This trend is particularly prominent among millennials and Gen Z, who favor distinctive and memorable travel experiences over traditional hotel stays.
The market's expansion is further fueled by the integration of sustainability trends, with eco-friendly and sustainable travel options increasingly becoming a critical factor for consumers. The adoption of sustainable practices by glamping operators not only aligns with the environmental values of modern travelers but also enhances the market's appeal, contributing to its robust growth trajectory.
However, the market faces notable challenges, including the high costs associated with glamping, which deter approximately 30% of potential customers. Addressing this cost barrier will be crucial for market players aiming to broaden their customer base. Additionally, the integration of smart technology is anticipated to play a transformative role, with innovations expected to influence 25% of the market by 2028. This technological adoption ranges from smart tents equipped with advanced climate control systems to seamless connectivity features, enhancing the overall glamping experience.
Key Takeaways
- Market Growth: The Glamping Market was valued at USD 3.4 billion in 2023. It is expected to reach USD 10.1 billion by 2033, with a CAGR of 11.5% during the forecast period from 2024 to 2033.
- By Accommodation: Cabins and Pods Segment dominated the By Accommodation glamping segment.
- By Target: Families dominated the Glamping Market's By Target segment.
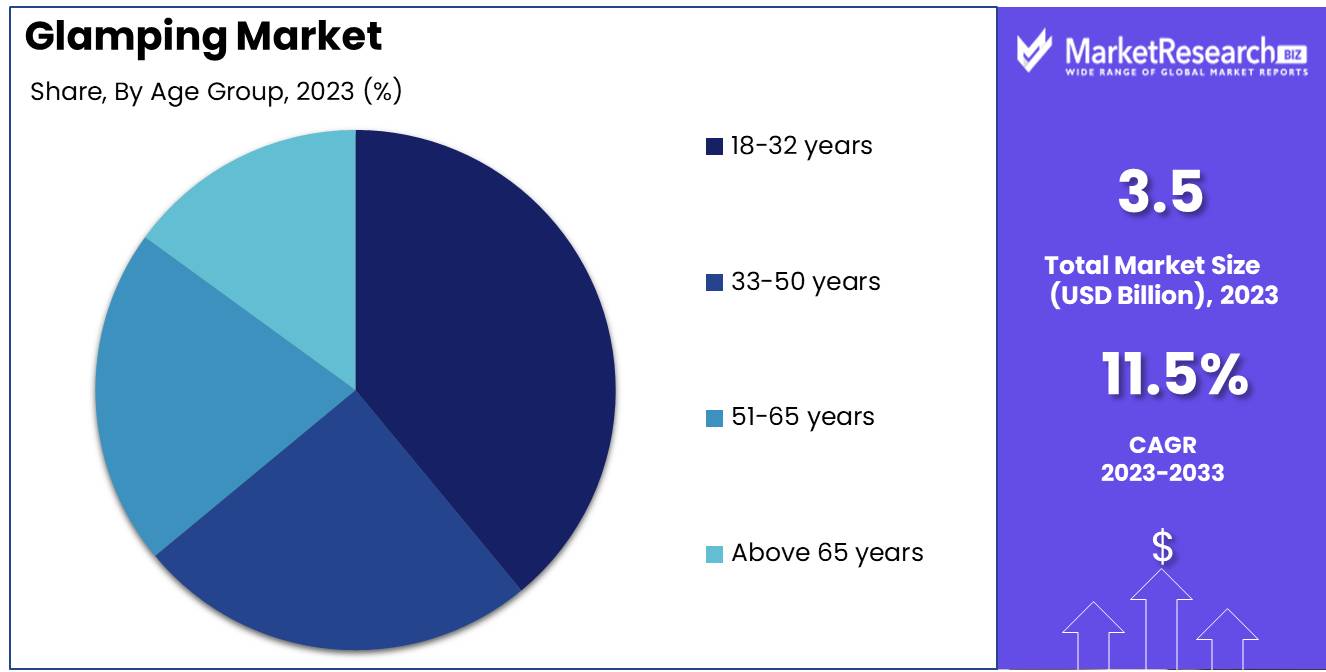
- By Age Group: The age group of 18-32 years dominates the glamping market, driven by experiential travel.
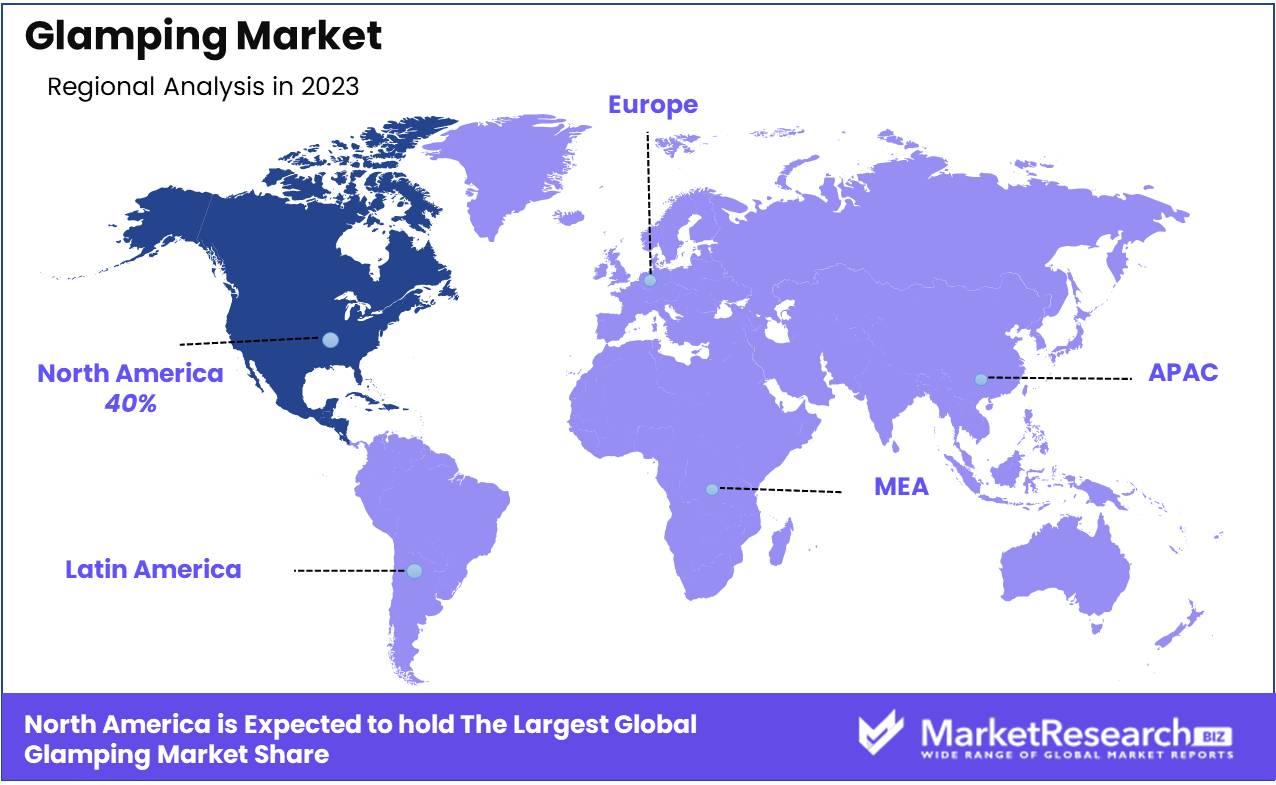
- Regional Dominance: North America dominates the glamping market with a 40% largest share.
- Growth Opportunity: The global glamping market's growth hinges on emerging markets expansion and offering sustainable, eco-friendly experiences for travelers.
Driving factors
Rising Desire for Luxury Outdoor Experiences
The glamping market has experienced significant growth due to an increasing desire among travelers for luxury outdoor experiences. This trend is driven by a shift in consumer preferences toward more unique and high-end travel experiences that combine the allure of nature with the comforts of luxury accommodations.
Glamping, which offers amenities such as comfortable beds, private bathrooms, and gourmet dining, caters to this demand by providing a seamless blend of nature and luxury. The market has benefited from this trend, with luxury travelers seeking out destinations that offer exclusivity and comfort in natural settings. According to recent data, the luxury segment of the outdoor hospitality industry has seen a steady annual growth rate of 15%, highlighting the strong demand for premium glamping experiences.
Significant Influence from Social Media
Social media has played a pivotal role in the growth of the glamping market by significantly influencing travel decisions. Platforms like Instagram, Facebook, and Pinterest have become essential tools for showcasing picturesque glamping sites, creating a desire among users to experience these unique accommodations firsthand. Influencers and travel bloggers often share their glamping experiences, generating widespread interest and inspiring their followers to seek similar adventures. This visual and narrative-driven promotion has increased the visibility and attractiveness of glamping as a travel option. It has been observed that travel-related social media posts can lead to a 30% increase in bookings for featured destinations, demonstrating the substantial impact of social media on market growth.
Increasing Eco-Consciousness Among Travelers
The rising eco-consciousness among travelers has also contributed to the expansion of the glamping market. As more individuals become aware of environmental issues and seek to minimize their ecological footprint, sustainable travel options have gained popularity. Glamping aligns with this trend by offering eco-friendly accommodations that utilize renewable energy sources, sustainable materials, and environmentally responsible practices. Many glamping sites emphasize their commitment to conservation and sustainable tourism, attracting eco-conscious travelers who value responsible travel. This shift towards sustainability has been significant, with eco-friendly travel options experiencing a 20% annual growth rate. The growing demand for sustainable travel experiences has made glamping an attractive choice for environmentally aware consumers.
Restraining Factors
Seasonal Demand: Limiting Year-Round Revenue Potential
The glamping market is significantly influenced by seasonal demand, which poses a primary restraining factor for sustained growth. Glamping, a luxury camping experience, is highly dependent on favorable weather conditions, often restricting operations to specific months of the year. This seasonality affects occupancy rates, leading to fluctuating revenue streams and creating financial instability for operators. For instance, a glamping site located in a region with harsh winters may only be operational for six to eight months annually, drastically reducing potential revenue and ROI compared to year-round hospitality options.
Operators must contend with the challenge of maintaining infrastructure and staff during off-seasons, further straining financial resources. Additionally, the high variability in demand across different seasons complicates inventory and capacity management, as well as marketing strategies, making it difficult to maintain a steady customer base. While some regions with milder climates may mitigate these effects to some extent, the overall growth trajectory of the glamping market remains hindered by this inherent seasonality.
Land Use Policies and Environmental Conservation Regulations: Restricting Expansion and Site Development
Land use policies and stringent environmental conservation regulations play a crucial role in shaping the growth of the glamping market. These regulations, designed to protect natural landscapes and ensure sustainable development, often impose significant constraints on where and how glamping sites can be developed. For example, in areas designated as protected habitats or zones of environmental significance, obtaining permits for new glamping sites can be an arduous and time-consuming process. These regulatory barriers can deter potential investors and developers due to the uncertainty and additional costs involved.
Moreover, existing glamping operators may face restrictions on expanding their facilities or adding new amenities, limiting their ability to scale operations and enhance guest experiences. Compliance with environmental regulations often requires substantial investment in eco-friendly infrastructure and practices, such as waste management systems and sustainable energy sources, which can increase initial capital expenditure and ongoing operational costs.
These regulatory challenges are compounded in regions with diverse and fragmented land use policies, where navigating the legal landscape becomes even more complex. While adherence to these regulations is vital for preserving the very natural settings that attract glamping enthusiasts, the restrictive nature of these policies ultimately curtails the market's growth potential by limiting site availability and increasing operational costs.
By Accommodation Type Analysis
In 2023, The Cabins and Pods Segment dominated the By Accommodation glamping segment.
In 2023, Cabins and Pods held a dominant market position in the By Accommodation segment of the Glamping Market. This segment is further categorized into Cabins & Pods, Yurts, Tents, Treehouses, and Others. Cabins and Pods are preferred due to their enhanced comfort and amenities, appealing to a wide range of glamping enthusiasts. Their market dominance is attributed to their sturdy structure, all-weather suitability, and luxurious interiors, which offer a hotel-like experience in a natural setting.
Yurts, originating from traditional Mongolian dwellings, have gained popularity for their unique design and spacious interiors, providing an exotic yet comfortable stay. Tents, the most traditional form of glamping accommodation, remain popular due to their versatility and affordability, catering to budget-conscious travelers seeking an immersive nature experience. Treehouses offer a distinctive glamping experience, often located in secluded areas, providing privacy and stunning views, making them a favored choice for romantic getaways and nature lovers.
The Others category includes innovative accommodations such as domes, airstreams, and wagons, catering to niche markets with unique preferences. The diverse options within the By Accommodation segment reflect the evolving preferences of glamping customers, contributing to the overall growth and dynamism of the Glamping Market.
By Target Analysis
In 2023, Families dominated the Glamping Market's Target segment.
In 2023, Families held a dominant market position in the By Target segment of the Glamping Market, driven by the increasing demand for unique and memorable vacation experiences that cater to both adults and children. Families accounted for the largest market share due to the rising trend of multi-generational travel, where grandparents, parents, and children embark on vacations together. This segment's growth can be attributed to the availability of family-friendly glamping accommodations, such as spacious safari tents, treehouses, and cabins equipped with modern amenities and safety features. Additionally, families are drawn to glamping for its blend of outdoor adventure and comfort, providing opportunities for children to engage in nature-based activities while ensuring a hassle-free experience for parents.
Young couples also contributed significantly to the glamping market, seeking romantic and secluded getaways that offer privacy and unique experiences. This segment is driven by the increasing preference for sustainable and eco-friendly travel options.
Active adults, often comprising individuals or groups seeking adventure and outdoor activities, are attracted to glamping for its access to hiking, kayaking, and other recreational pursuits without sacrificing comfort.
Luxury travelers represent a niche yet influential segment, with a preference for high-end, bespoke glamping experiences that offer exclusivity and premium services. This segment's growth is propelled by the demand for unique, high-quality travel experiences that combine luxury and nature immersion.
By Age Group Analysis
The age group of 18-32 years dominates the glamping market, driven by experiential travel.
In 2023, The age group of 18-32 years held a dominant market position in the Glamping Market, accounting for the largest share of the market. This demographic's preference for experiential travel and unique accommodations has significantly driven the growth of the glamping sector. The rise in disposable income among younger adults, coupled with their propensity for adventure and eco-friendly travel options, has further propelled this trend. Additionally, social media influence and the desire for Instagram-worthy travel experiences have made glamping a popular choice among this age group.
The 33-50 years age group also showcased a substantial market presence. This segment, often characterized by higher earning potential and family-oriented travel, has shown a growing interest in glamping as a luxurious yet nature-connected vacation option.
The 51-65 years age group exhibited steady growth, driven by retirees and older professionals seeking comfortable and serene travel experiences. This segment appreciates the blend of comfort and outdoor experiences offered by glamping.
The above 65-year-old age group, though the smallest segment, is gradually adopting glamping, attracted by the promise of relaxation and nature without sacrificing comfort. This age group’s market share is expected to grow as awareness and accessibility improve.
Key Market Segments
By Accommodation
- Cabins and Pods
- Yurts
- Tents
- Treehouses
- Others
By Target
- Families
- Young couples
- Active adults
- Luxury travelers
By Age Group
- 18-32 years
- 33-50 years
- 51-65 years
- Above 65 years
Growth Opportunity
Expanding into Emerging Markets
One of the foremost opportunities lies in expanding into emerging markets. The rising middle-class population and increasing disposable incomes in regions such as Asia-Pacific and Latin America create fertile ground for the glamping industry. These markets are witnessing a surge in domestic and international tourism, with travelers seeking unique and luxurious outdoor experiences. By tailoring offerings to local tastes and leveraging partnerships with regional tourism boards, glamping operators can tap into a new and lucrative customer base. Additionally, the availability of diverse natural landscapes in these regions provides ample opportunities to create distinctive glamping sites that cater to adventurous and eco-conscious travelers.
Offering Sustainable and Eco-friendly Glamping Options
Sustainability has become a crucial factor influencing consumer choices, and the glamping industry is no exception. Offering sustainable and eco-friendly glamping options can significantly enhance market appeal and customer loyalty. By integrating renewable energy sources, eco-friendly materials, and waste reduction practices, glamping operators can cater to the growing segment of environmentally conscious travelers. This not only aligns with global sustainability goals but also positions glamping as a premium, responsible travel choice. Furthermore, showcasing commitments to sustainability through certifications and partnerships with environmental organizations can enhance brand reputation and attract a wider audience.
Latest Trends
Nature as the Ultimate Remedy: The Growing Appeal of Natural Environments
The glamping market is anticipated to witness significant growth driven by an increasing societal shift towards nature as a remedy for urban stress and digital fatigue. This trend reflects a growing recognition of the mental and physical health benefits associated with spending time in natural environments. Modern consumers are seeking immersive experiences that allow them to disconnect from the hustle and bustle of city life and reconnect with nature.
Glamping, with its unique blend of comfort and adventure, offers an ideal solution for those looking to experience the tranquility and rejuvenation of the great outdoors without sacrificing modern amenities. This movement towards nature-centric tourism is expected to attract a broad demographic, from young professionals to retirees, boosting market demand.
The Synergy of Wellness Tourism and Glamping: A Perfect Blend for Holistic Well-being
The intersection of wellness tourism and glamping represents another key trend. As wellness tourism continues to gain traction globally, travelers are increasingly seeking destinations that offer not only physical luxury but also spiritual and mental rejuvenation. Glamping sites are uniquely positioned to cater to this demand by integrating wellness programs such as yoga retreats, meditation sessions, and spa treatments within natural settings. This fusion of wellness and nature provides a holistic experience that appeals to health-conscious travelers.
Moreover, the focus on sustainable and eco-friendly practices in glamping aligns seamlessly with the principles of wellness tourism, enhancing its appeal. This trend is expected to drive substantial growth, with glamping providers who offer comprehensive wellness packages likely to see increased occupancy rates and customer loyalty.
Regional Analysis
North America dominates the glamping market with a 40% largest share.
The global glamping market is experiencing significant growth, with distinct regional variations contributing to the overall market dynamics. North America dominates the market, accounting for a substantial percentage of the global share. In 2023, North America held approximately 40% of the market, driven by the increasing popularity of luxury camping experiences and the rise in disposable income. The United States, in particular, is a key contributor, with numerous glamping sites offering unique and upscale accommodations.
Europe follows as a significant player in the glamping market, with countries such as the United Kingdom, France, and Germany leading the way. The region's share is bolstered by the strong tourism infrastructure and the growing preference for eco-friendly and sustainable travel options. Europe's market share was estimated at 30% in 2023, reflecting its robust growth potential.
The Asia Pacific region is also witnessing rapid expansion in the glamping market, driven by increasing tourism and rising consumer interest in unique travel experiences. Countries such as Japan, Australia, and China are at the forefront of this growth, contributing to the region's 20% market share in 2023.
The Middle East & Africa and Latin America, while smaller in market size, are gradually emerging as potential growth areas. These regions collectively accounted for 10% of the global market share in 2023, with increasing investments in tourism infrastructure and the promotion of glamping as a niche segment within the broader travel industry.
Key Regions and Countries
North America
- The US
- Canada
- Rest of North America
Europe
- Germany
- France
- The UK
- Spain
- Netherlands
- Russia
- Italy
- Rest of Europe
Asia-Pacific
- China
- Japan
- Singapore
- Thailand
- South Korea
- Vietnam
- India
- New Zealand
- Rest of Asia Pacific
Latin America
- Mexico
- Brazil
- Rest of Latin America
Middle East & Africa
- Saudi Arabia
- South Africa
- UAE
- Rest of the Middle East & Africa
Key Players Analysis
The global Glamping Market in 2024 is expected to witness robust growth, driven by an increasing consumer preference for unique outdoor experiences combined with luxury and comfort. Key players such as Hilleberg AB and Johnson Outdoors Inc. are anticipated to maintain a strong market presence due to their innovative and high-quality product offerings. The North Face Inc. and AMG GROUP are likely to leverage their extensive distribution networks and brand recognition to capture significant market shares.
Newell Brands Inc. and The Coleman Company, known for their diverse range of outdoor products, are expected to benefit from their established market positions and ongoing product innovations. Oase Outdoors and Simex Outdoor International are projected to expand their market footprint through strategic partnerships and new product launches.
Kampa and Exxel Outdoors are likely to focus on enhancing customer experiences through premium glamping solutions, thus attracting a broader customer base. Bushtec Safari and Sawday’s Canopy & Stars Ltd. are expected to capitalize on the trend towards eco-friendly and sustainable glamping options.
Huttopia SA and Wigwam Holidays Ltd. are anticipated to continue their growth by offering distinctive and immersive glamping experiences. Arena Campsites, Nightfall Camp Pty Ltd., and Getaway House Inc. are poised to capture niche markets by catering to specific customer preferences and providing customized glamping packages. Overall, these key players are well-positioned to drive the growth of the glamping market through strategic initiatives and innovative offerings.
Market Key Players
- Hilleberg Ab.
- Johnson Outdoors Inc.
- The North Face Inc.
- AMG GROUP
- Newell Brands Inc.
- Oase Outdoors
- The Coleman Company
- Simex Outdoor International
- Kampa
- Exxel Outdoors
- Bushtec Safari
- Sawday’s Canopy & Stars Ltd.
- Huttopia SA
- Wigwam Holidays Ltd
- Arena Campsites
- Nightfall Camp Pty Ltd.
- Getaway House Inc.
Recent Development
- In June 2024, Autocamp unveiled a new glamping site in Joshua Tree, California. This site is designed to offer a blend of modern comforts and natural surroundings, featuring Airstream accommodations and communal spaces for social activities.
- In April 2024, Collective Retreats expanded its glamping offerings by launching a new retreat in Vail, Colorado. This new location includes luxury tents with premium amenities, catering to high-end travelers seeking unique outdoor experiences.
- In February 2024, Under Canvas, a leading glamping company in the United States, announced the opening of a new luxury glamping site near the Great Smoky Mountains National Park. This site features upscale tent accommodations and a range of outdoor activities, aiming to enhance the nature experience for guests.
Report Scope
Report Features Description Market Value (2023) USD 3.4 Billion Forecast Revenue (2033) USD 10.1 Billion CAGR (2024-2032) 11.5% Base Year for Estimation 2023 Historic Period 2016-2023 Forecast Period 2024-2033 Report Coverage Revenue Forecast, Market Dynamics, COVID-19 Impact, Competitive Landscape, Recent Developments Segments Covered By Accommodation Type (Cabins and Pods, Yurts, Tents, Treehouses, Others), By Target (Families, Young couples, Active adults, Luxury travelers), By Age Group (18-32 years, 33-50 years, 51-65 years, Above 65 years) Regional Analysis North America - The US, Canada, Rest of North America, Europe - Germany, France, The UK, Spain, Italy, Russia, Netherlands, Rest of Europe, Asia-Pacific - China, Japan, South Korea, India, New Zealand, Singapore, Thailand, Vietnam, Rest of Asia Pacific, Latin America - Brazil, Mexico, Rest of Latin America, Middle East & Africa - South Africa, Saudi Arabia, UAE, Rest of Middle East & Africa Competitive Landscape Hilleberg Ab., Johnson Outdoors Inc., The North Face Inc., AMG GROUP, Newell Brands Inc., Oase Outdoors, The Coleman Company, Simex Outdoor International, Kampa, Exxel Outdoors, Bushtec Safari, Sawday’s Canopy & Stars Ltd., Huttopia SA, Wigwam Holidays Ltd, Arena Campsites, Nightfall Camp Pty Ltd., Getaway House Inc. Customization Scope Customization for segments, region/country-level will be provided. Moreover, additional customization can be done based on the requirements. Purchase Options We have three licenses to opt for Single User License, Multi-User License (Up to 5 Users), Corporate Use License (Unlimited User and Printable PDF) -
- 1. Executive Summary
- 1.1. Definition
- 1.2. Taxonomy
- 1.3. Research Scope
- 1.4. Key Analysis
- 1.5. Key Findings by Major Segments
- 1.6. Top strategies by Major Players
- 2. Global Glamping Market Overview
- 2.1. Glamping Market Dynamics
- 2.1.1. Drivers
- 2.1.2. Opportunities
- 2.1.3. Restraints
- 2.1.4. Challenges
- 2.2. Macro-economic Factors
- 2.3. Regulatory Framework
- 2.4. Market Investment Feasibility Index
- 2.5. PEST Analysis
- 2.6. PORTER’S Five Force Analysis
- 2.7. Drivers & Restraints Impact Analysis
- 2.8. Industry Chain Analysis
- 2.9. Cost Structure Analysis
- 2.10. Marketing Strategy
- 2.11. Russia-Ukraine War Impact Analysis
- 2.12. Opportunity Map Analysis
- 2.13. Market Competition Scenario Analysis
- 2.14. Product Life Cycle Analysis
- 2.15. Opportunity Orbits
- 2.16. Manufacturer Intensity Map
- 2.17. Major Companies sales by Value & Volume
- 2.1. Glamping Market Dynamics
- 3. Global Glamping Market Analysis, Opportunity and Forecast, 2016-2032
- 3.1. Global Glamping Market Analysis, 2016-2021
- 3.2. Global Glamping Market Opportunity and Forecast, 2023-2032
- 3.3. Global Glamping Market Analysis, Opportunity and Forecast, By Accommodation, 2016-2032
- 3.3.1. Global Glamping Market Analysis by Accommodation: Introduction
- 3.3.2. Market Size Absolute $ Opportunity Analysis and Forecast, By Accommodation, 2016-2032
- 3.3.3. Cabins and Pods
- 3.3.4. Yurts
- 3.3.5. Tents
- 3.3.6. Treehouses
- 3.3.7. Others
- 3.4. Global Glamping Market Analysis, Opportunity and Forecast, By Target, 2016-2032
- 3.4.1. Global Glamping Market Analysis by Target: Introduction
- 3.4.2. Market Size Absolute $ Opportunity Analysis and Forecast, By Target, 2016-2032
- 3.4.3. Families
- 3.4.4. Young couples
- 3.4.5. Active adults
- 3.4.6. Luxury travelers
- 3.5. Global Glamping Market Analysis, Opportunity and Forecast, By Age Group, 2016-2032
- 3.5.1. Global Glamping Market Analysis by Age Group: Introduction
- 3.5.2. Market Size Absolute $ Opportunity Analysis and Forecast, By Age Group, 2016-2032
- 3.5.3. 18-32 years
- 3.5.4. 33-50 years
- 3.5.5. 51-65 years
- 3.5.6. above 65 years
- 4. North America Glamping Market Analysis, Opportunity and Forecast, 2016-2032
- 4.1. North America Glamping Market Analysis, 2016-2021
- 4.2. North America Glamping Market Opportunity and Forecast, 2023-2032
- 4.3. North America Glamping Market Analysis, Opportunity and Forecast, By Accommodation, 2016-2032
- 4.3.1. North America Glamping Market Analysis by Accommodation: Introduction
- 4.3.2. Market Size Absolute $ Opportunity Analysis and Forecast, By Accommodation, 2016-2032
- 4.3.3. Cabins and Pods
- 4.3.4. Yurts
- 4.3.5. Tents
- 4.3.6. Treehouses
- 4.3.7. Others
- 4.4. North America Glamping Market Analysis, Opportunity and Forecast, By Target, 2016-2032
- 4.4.1. North America Glamping Market Analysis by Target: Introduction
- 4.4.2. Market Size Absolute $ Opportunity Analysis and Forecast, By Target, 2016-2032
- 4.4.3. Families
- 4.4.4. Young couples
- 4.4.5. Active adults
- 4.4.6. Luxury travelers
- 4.5. North America Glamping Market Analysis, Opportunity and Forecast, By Age Group, 2016-2032
- 4.5.1. North America Glamping Market Analysis by Age Group: Introduction
- 4.5.2. Market Size Absolute $ Opportunity Analysis and Forecast, By Age Group, 2016-2032
- 4.5.3. 18-32 years
- 4.5.4. 33-50 years
- 4.5.5. 51-65 years
- 4.5.6. above 65 years
- 4.6. North America Glamping Market Analysis, Opportunity and Forecast, By Country , 2016-2032
- 4.6.1. North America Glamping Market Analysis by Country : Introduction
- 4.6.2. Market Size Absolute $ Opportunity Analysis and Forecast, Country , 2016-2032
- 4.6.2.1. The US
- 4.6.2.2. Canada
- 4.6.2.3. Mexico
- 5. Western Europe Glamping Market Analysis, Opportunity and Forecast, 2016-2032
- 5.1. Western Europe Glamping Market Analysis, 2016-2021
- 5.2. Western Europe Glamping Market Opportunity and Forecast, 2023-2032
- 5.3. Western Europe Glamping Market Analysis, Opportunity and Forecast, By Accommodation, 2016-2032
- 5.3.1. Western Europe Glamping Market Analysis by Accommodation: Introduction
- 5.3.2. Market Size Absolute $ Opportunity Analysis and Forecast, By Accommodation, 2016-2032
- 5.3.3. Cabins and Pods
- 5.3.4. Yurts
- 5.3.5. Tents
- 5.3.6. Treehouses
- 5.3.7. Others
- 5.4. Western Europe Glamping Market Analysis, Opportunity and Forecast, By Target, 2016-2032
- 5.4.1. Western Europe Glamping Market Analysis by Target: Introduction
- 5.4.2. Market Size Absolute $ Opportunity Analysis and Forecast, By Target, 2016-2032
- 5.4.3. Families
- 5.4.4. Young couples
- 5.4.5. Active adults
- 5.4.6. Luxury travelers
- 5.5. Western Europe Glamping Market Analysis, Opportunity and Forecast, By Age Group, 2016-2032
- 5.5.1. Western Europe Glamping Market Analysis by Age Group: Introduction
- 5.5.2. Market Size Absolute $ Opportunity Analysis and Forecast, By Age Group, 2016-2032
- 5.5.3. 18-32 years
- 5.5.4. 33-50 years
- 5.5.5. 51-65 years
- 5.5.6. above 65 years
- 5.6. Western Europe Glamping Market Analysis, Opportunity and Forecast, By Country , 2016-2032
- 5.6.1. Western Europe Glamping Market Analysis by Country : Introduction
- 5.6.2. Market Size Absolute $ Opportunity Analysis and Forecast, Country , 2016-2032
- 5.6.2.1. Germany
- 5.6.2.2. France
- 5.6.2.3. The UK
- 5.6.2.4. Spain
- 5.6.2.5. Italy
- 5.6.2.6. Portugal
- 5.6.2.7. Ireland
- 5.6.2.8. Austria
- 5.6.2.9. Switzerland
- 5.6.2.10. Benelux
- 5.6.2.11. Nordic
- 5.6.2.12. Rest of Western Europe
- 6. Eastern Europe Glamping Market Analysis, Opportunity and Forecast, 2016-2032
- 6.1. Eastern Europe Glamping Market Analysis, 2016-2021
- 6.2. Eastern Europe Glamping Market Opportunity and Forecast, 2023-2032
- 6.3. Eastern Europe Glamping Market Analysis, Opportunity and Forecast, By Accommodation, 2016-2032
- 6.3.1. Eastern Europe Glamping Market Analysis by Accommodation: Introduction
- 6.3.2. Market Size Absolute $ Opportunity Analysis and Forecast, By Accommodation, 2016-2032
- 6.3.3. Cabins and Pods
- 6.3.4. Yurts
- 6.3.5. Tents
- 6.3.6. Treehouses
- 6.3.7. Others
- 6.4. Eastern Europe Glamping Market Analysis, Opportunity and Forecast, By Target, 2016-2032
- 6.4.1. Eastern Europe Glamping Market Analysis by Target: Introduction
- 6.4.2. Market Size Absolute $ Opportunity Analysis and Forecast, By Target, 2016-2032
- 6.4.3. Families
- 6.4.4. Young couples
- 6.4.5. Active adults
- 6.4.6. Luxury travelers
- 6.5. Eastern Europe Glamping Market Analysis, Opportunity and Forecast, By Age Group, 2016-2032
- 6.5.1. Eastern Europe Glamping Market Analysis by Age Group: Introduction
- 6.5.2. Market Size Absolute $ Opportunity Analysis and Forecast, By Age Group, 2016-2032
- 6.5.3. 18-32 years
- 6.5.4. 33-50 years
- 6.5.5. 51-65 years
- 6.5.6. above 65 years
- 6.6. Eastern Europe Glamping Market Analysis, Opportunity and Forecast, By Country , 2016-2032
- 6.6.1. Eastern Europe Glamping Market Analysis by Country : Introduction
- 6.6.2. Market Size Absolute $ Opportunity Analysis and Forecast, Country , 2016-2032
- 6.6.2.1. Russia
- 6.6.2.2. Poland
- 6.6.2.3. The Czech Republic
- 6.6.2.4. Greece
- 6.6.2.5. Rest of Eastern Europe
- 7. APAC Glamping Market Analysis, Opportunity and Forecast, 2016-2032
- 7.1. APAC Glamping Market Analysis, 2016-2021
- 7.2. APAC Glamping Market Opportunity and Forecast, 2023-2032
- 7.3. APAC Glamping Market Analysis, Opportunity and Forecast, By Accommodation, 2016-2032
- 7.3.1. APAC Glamping Market Analysis by Accommodation: Introduction
- 7.3.2. Market Size Absolute $ Opportunity Analysis and Forecast, By Accommodation, 2016-2032
- 7.3.3. Cabins and Pods
- 7.3.4. Yurts
- 7.3.5. Tents
- 7.3.6. Treehouses
- 7.3.7. Others
- 7.4. APAC Glamping Market Analysis, Opportunity and Forecast, By Target, 2016-2032
- 7.4.1. APAC Glamping Market Analysis by Target: Introduction
- 7.4.2. Market Size Absolute $ Opportunity Analysis and Forecast, By Target, 2016-2032
- 7.4.3. Families
- 7.4.4. Young couples
- 7.4.5. Active adults
- 7.4.6. Luxury travelers
- 7.5. APAC Glamping Market Analysis, Opportunity and Forecast, By Age Group, 2016-2032
- 7.5.1. APAC Glamping Market Analysis by Age Group: Introduction
- 7.5.2. Market Size Absolute $ Opportunity Analysis and Forecast, By Age Group, 2016-2032
- 7.5.3. 18-32 years
- 7.5.4. 33-50 years
- 7.5.5. 51-65 years
- 7.5.6. above 65 years
- 7.6. APAC Glamping Market Analysis, Opportunity and Forecast, By Country , 2016-2032
- 7.6.1. APAC Glamping Market Analysis by Country : Introduction
- 7.6.2. Market Size Absolute $ Opportunity Analysis and Forecast, Country , 2016-2032
- 7.6.2.1. China
- 7.6.2.2. Japan
- 7.6.2.3. South Korea
- 7.6.2.4. India
- 7.6.2.5. Australia & New Zeland
- 7.6.2.6. Indonesia
- 7.6.2.7. Malaysia
- 7.6.2.8. Philippines
- 7.6.2.9. Singapore
- 7.6.2.10. Thailand
- 7.6.2.11. Vietnam
- 7.6.2.12. Rest of APAC
- 8. Latin America Glamping Market Analysis, Opportunity and Forecast, 2016-2032
- 8.1. Latin America Glamping Market Analysis, 2016-2021
- 8.2. Latin America Glamping Market Opportunity and Forecast, 2023-2032
- 8.3. Latin America Glamping Market Analysis, Opportunity and Forecast, By Accommodation, 2016-2032
- 8.3.1. Latin America Glamping Market Analysis by Accommodation: Introduction
- 8.3.2. Market Size Absolute $ Opportunity Analysis and Forecast, By Accommodation, 2016-2032
- 8.3.3. Cabins and Pods
- 8.3.4. Yurts
- 8.3.5. Tents
- 8.3.6. Treehouses
- 8.3.7. Others
- 8.4. Latin America Glamping Market Analysis, Opportunity and Forecast, By Target, 2016-2032
- 8.4.1. Latin America Glamping Market Analysis by Target: Introduction
- 8.4.2. Market Size Absolute $ Opportunity Analysis and Forecast, By Target, 2016-2032
- 8.4.3. Families
- 8.4.4. Young couples
- 8.4.5. Active adults
- 8.4.6. Luxury travelers
- 8.5. Latin America Glamping Market Analysis, Opportunity and Forecast, By Age Group, 2016-2032
- 8.5.1. Latin America Glamping Market Analysis by Age Group: Introduction
- 8.5.2. Market Size Absolute $ Opportunity Analysis and Forecast, By Age Group, 2016-2032
- 8.5.3. 18-32 years
- 8.5.4. 33-50 years
- 8.5.5. 51-65 years
- 8.5.6. above 65 years
- 8.6. Latin America Glamping Market Analysis, Opportunity and Forecast, By Country , 2016-2032
- 8.6.1. Latin America Glamping Market Analysis by Country : Introduction
- 8.6.2. Market Size Absolute $ Opportunity Analysis and Forecast, Country , 2016-2032
- 8.6.2.1. Brazil
- 8.6.2.2. Colombia
- 8.6.2.3. Chile
- 8.6.2.4. Argentina
- 8.6.2.5. Costa Rica
- 8.6.2.6. Rest of Latin America
- 9. Middle East & Africa Glamping Market Analysis, Opportunity and Forecast, 2016-2032
- 9.1. Middle East & Africa Glamping Market Analysis, 2016-2021
- 9.2. Middle East & Africa Glamping Market Opportunity and Forecast, 2023-2032
- 9.3. Middle East & Africa Glamping Market Analysis, Opportunity and Forecast, By Accommodation, 2016-2032
- 9.3.1. Middle East & Africa Glamping Market Analysis by Accommodation: Introduction
- 9.3.2. Market Size Absolute $ Opportunity Analysis and Forecast, By Accommodation, 2016-2032
- 9.3.3. Cabins and Pods
- 9.3.4. Yurts
- 9.3.5. Tents
- 9.3.6. Treehouses
- 9.3.7. Others
- 9.4. Middle East & Africa Glamping Market Analysis, Opportunity and Forecast, By Target, 2016-2032
- 9.4.1. Middle East & Africa Glamping Market Analysis by Target: Introduction
- 9.4.2. Market Size Absolute $ Opportunity Analysis and Forecast, By Target, 2016-2032
- 9.4.3. Families
- 9.4.4. Young couples
- 9.4.5. Active adults
- 9.4.6. Luxury travelers
- 9.5. Middle East & Africa Glamping Market Analysis, Opportunity and Forecast, By Age Group, 2016-2032
- 9.5.1. Middle East & Africa Glamping Market Analysis by Age Group: Introduction
- 9.5.2. Market Size Absolute $ Opportunity Analysis and Forecast, By Age Group, 2016-2032
- 9.5.3. 18-32 years
- 9.5.4. 33-50 years
- 9.5.5. 51-65 years
- 9.5.6. above 65 years
- 9.6. Middle East & Africa Glamping Market Analysis, Opportunity and Forecast, By Country , 2016-2032
- 9.6.1. Middle East & Africa Glamping Market Analysis by Country : Introduction
- 9.6.2. Market Size Absolute $ Opportunity Analysis and Forecast, Country , 2016-2032
- 9.6.2.1. Algeria
- 9.6.2.2. Egypt
- 9.6.2.3. Israel
- 9.6.2.4. Kuwait
- 9.6.2.5. Nigeria
- 9.6.2.6. Saudi Arabia
- 9.6.2.7. South Africa
- 9.6.2.8. Turkey
- 9.6.2.9. The UAE
- 9.6.2.10. Rest of MEA
- 10. Global Glamping Market Analysis, Opportunity and Forecast, By Region , 2016-2032
- 10.1. Global Glamping Market Analysis by Region : Introduction
- 10.2. Market Size Absolute $ Opportunity Analysis and Forecast, By Region , 2016-2032
- 10.2.1. North America
- 10.2.2. Western Europe
- 10.2.3. Eastern Europe
- 10.2.4. APAC
- 10.2.5. Latin America
- 10.2.6. Middle East & Africa
- 11. Global Glamping Market Competitive Landscape, Market Share Analysis, and Company Profiles
- 11.1. Market Share Analysis
- 11.2. Company Profiles
- 11.3. Hilleberg Ab.
- 11.3.1. Company Overview
- 11.3.2. Financial Highlights
- 11.3.3. Product Portfolio
- 11.3.4. SWOT Analysis
- 11.3.5. Key Strategies and Developments
- 11.4. Johnson Outdoors Inc.
- 11.4.1. Company Overview
- 11.4.2. Financial Highlights
- 11.4.3. Product Portfolio
- 11.4.4. SWOT Analysis
- 11.4.5. Key Strategies and Developments
- 11.5. The North Face Inc.
- 11.5.1. Company Overview
- 11.5.2. Financial Highlights
- 11.5.3. Product Portfolio
- 11.5.4. SWOT Analysis
- 11.5.5. Key Strategies and Developments
- 11.6. AMG GROUP
- 11.6.1. Company Overview
- 11.6.2. Financial Highlights
- 11.6.3. Product Portfolio
- 11.6.4. SWOT Analysis
- 11.6.5. Key Strategies and Developments
- 11.7. Newell Brands Inc.
- 11.7.1. Company Overview
- 11.7.2. Financial Highlights
- 11.7.3. Product Portfolio
- 11.7.4. SWOT Analysis
- 11.7.5. Key Strategies and Developments
- 11.8. Oase Outdoors
- 11.8.1. Company Overview
- 11.8.2. Financial Highlights
- 11.8.3. Product Portfolio
- 11.8.4. SWOT Analysis
- 11.8.5. Key Strategies and Developments
- 11.9. The Coleman Company
- 11.9.1. Company Overview
- 11.9.2. Financial Highlights
- 11.9.3. Product Portfolio
- 11.9.4. SWOT Analysis
- 11.9.5. Key Strategies and Developments
- 11.10. Simex Outdoor International
- 11.10.1. Company Overview
- 11.10.2. Financial Highlights
- 11.10.3. Product Portfolio
- 11.10.4. SWOT Analysis
- 11.10.5. Key Strategies and Developments
- 11.11. Kampa
- 11.11.1. Company Overview
- 11.11.2. Financial Highlights
- 11.11.3. Product Portfolio
- 11.11.4. SWOT Analysis
- 11.11.5. Key Strategies and Developments
- 11.12. Exxel Outdoors
- 11.12.1. Company Overview
- 11.12.2. Financial Highlights
- 11.12.3. Product Portfolio
- 11.12.4. SWOT Analysis
- 11.12.5. Key Strategies and Developments
- 11.13.1. Company Overview
- 11.13.2. Financial Highlights
- 11.13.3. Product Portfolio
- 11.13.4. SWOT Analysis
- 11.13.5. Key Strategies and Developments
- 11.14. Bushtec Safari
- 11.14.1. Company Overview
- 11.14.2. Financial Highlights
- 11.14.3. Product Portfolio
- 11.14.4. SWOT Analysis
- 11.14.5. Key Strategies and Developments
- 11.15. Huttopia SA
- 11.15.1. Company Overview
- 11.15.2. Financial Highlights
- 11.15.3. Product Portfolio
- 11.15.4. SWOT Analysis
- 11.15.5. Key Strategies and Developments
- 11.16. Wigwam Holidays Ltd
- 11.16.1. Company Overview
- 11.16.2. Financial Highlights
- 11.16.3. Product Portfolio
- 11.16.4. SWOT Analysis
- 11.16.5. Key Strategies and Developments
- 11.17. Arena Campsites
- 11.17.1. Company Overview
- 11.17.2. Financial Highlights
- 11.17.3. Product Portfolio
- 11.17.4. SWOT Analysis
- 11.17.5. Key Strategies and Developments
- 11.18. Nightfall Camp Pty Ltd.
- 11.18.1. Company Overview
- 11.18.2. Financial Highlights
- 11.18.3. Product Portfolio
- 11.18.4. SWOT Analysis
- 11.18.5. Key Strategies and Developments
- 11.19. Getaway House Inc.
- 11.19.1. Company Overview
- 11.19.2. Financial Highlights
- 11.19.3. Product Portfolio
- 11.19.4. SWOT Analysis
- 11.19.5. Key Strategies and Developments
- 12. Assumptions and Acronyms
- 13. Research Methodology
- 14. Contact
"
- List of Figures
- "
- Figure 1: Global Glamping Market Revenue (US$ Mn) Market Share by Accommodation in 2022
- Figure 2: Global Glamping Market Market Attractiveness Analysis by Accommodation, 2016-2032
- Figure 3: Global Glamping Market Revenue (US$ Mn) Market Share by Targetin 2022
- Figure 4: Global Glamping Market Market Attractiveness Analysis by Target, 2016-2032
- Figure 5: Global Glamping Market Revenue (US$ Mn) Market Share by Age Groupin 2022
- Figure 6: Global Glamping Market Market Attractiveness Analysis by Age Group, 2016-2032
- Figure 7: Global Glamping Market Revenue (US$ Mn) Market Share by Region in 2022
- Figure 8: Global Glamping Market Market Attractiveness Analysis by Region, 2016-2032
- Figure 9: Global Glamping Market Market Revenue (US$ Mn) (2016-2032)
- Figure 10: Global Glamping Market Market Revenue (US$ Mn) Comparison by Region (2016-2032)
- Figure 11: Global Glamping Market Market Revenue (US$ Mn) Comparison by Accommodation (2016-2032)
- Figure 12: Global Glamping Market Market Revenue (US$ Mn) Comparison by Target (2016-2032)
- Figure 13: Global Glamping Market Market Revenue (US$ Mn) Comparison by Age Group (2016-2032)
- Figure 14: Global Glamping Market Market Y-o-Y Growth Rate Comparison by Region (2016-2032)
- Figure 15: Global Glamping Market Market Y-o-Y Growth Rate Comparison by Accommodation (2016-2032)
- Figure 16: Global Glamping Market Market Y-o-Y Growth Rate Comparison by Target (2016-2032)
- Figure 17: Global Glamping Market Market Y-o-Y Growth Rate Comparison by Age Group (2016-2032)
- Figure 18: Global Glamping Market Market Share Comparison by Region (2016-2032)
- Figure 19: Global Glamping Market Market Share Comparison by Accommodation (2016-2032)
- Figure 20: Global Glamping Market Market Share Comparison by Target (2016-2032)
- Figure 21: Global Glamping Market Market Share Comparison by Age Group (2016-2032)
- Figure 22: North America Glamping Market Revenue (US$ Mn) Market Share by Accommodationin 2022
- Figure 23: North America Glamping Market Market Attractiveness Analysis by Accommodation, 2016-2032
- Figure 24: North America Glamping Market Revenue (US$ Mn) Market Share by Targetin 2022
- Figure 25: North America Glamping Market Market Attractiveness Analysis by Target, 2016-2032
- Figure 26: North America Glamping Market Revenue (US$ Mn) Market Share by Age Groupin 2022
- Figure 27: North America Glamping Market Market Attractiveness Analysis by Age Group, 2016-2032
- Figure 28: North America Glamping Market Revenue (US$ Mn) Market Share by Country in 2022
- Figure 29: North America Glamping Market Market Attractiveness Analysis by Country, 2016-2032
- Figure 30: North America Glamping Market Market Revenue (US$ Mn) (2016-2032)
- Figure 31: North America Glamping Market Market Revenue (US$ Mn) Comparison by Country (2016-2032)
- Figure 32: North America Glamping Market Market Revenue (US$ Mn) Comparison by Accommodation (2016-2032)
- Figure 33: North America Glamping Market Market Revenue (US$ Mn) Comparison by Target (2016-2032)
- Figure 34: North America Glamping Market Market Revenue (US$ Mn) Comparison by Age Group (2016-2032)
- Figure 35: North America Glamping Market Market Y-o-Y Growth Rate Comparison by Country (2016-2032)
- Figure 36: North America Glamping Market Market Y-o-Y Growth Rate Comparison by Accommodation (2016-2032)
- Figure 37: North America Glamping Market Market Y-o-Y Growth Rate Comparison by Target (2016-2032)
- Figure 38: North America Glamping Market Market Y-o-Y Growth Rate Comparison by Age Group (2016-2032)
- Figure 39: North America Glamping Market Market Share Comparison by Country (2016-2032)
- Figure 40: North America Glamping Market Market Share Comparison by Accommodation (2016-2032)
- Figure 41: North America Glamping Market Market Share Comparison by Target (2016-2032)
- Figure 42: North America Glamping Market Market Share Comparison by Age Group (2016-2032)
- Figure 43: Western Europe Glamping Market Revenue (US$ Mn) Market Share by Accommodationin 2022
- Figure 44: Western Europe Glamping Market Market Attractiveness Analysis by Accommodation, 2016-2032
- Figure 45: Western Europe Glamping Market Revenue (US$ Mn) Market Share by Targetin 2022
- Figure 46: Western Europe Glamping Market Market Attractiveness Analysis by Target, 2016-2032
- Figure 47: Western Europe Glamping Market Revenue (US$ Mn) Market Share by Age Groupin 2022
- Figure 48: Western Europe Glamping Market Market Attractiveness Analysis by Age Group, 2016-2032
- Figure 49: Western Europe Glamping Market Revenue (US$ Mn) Market Share by Country in 2022
- Figure 50: Western Europe Glamping Market Market Attractiveness Analysis by Country, 2016-2032
- Figure 51: Western Europe Glamping Market Market Revenue (US$ Mn) (2016-2032)
- Figure 52: Western Europe Glamping Market Market Revenue (US$ Mn) Comparison by Country (2016-2032)
- Figure 53: Western Europe Glamping Market Market Revenue (US$ Mn) Comparison by Accommodation (2016-2032)
- Figure 54: Western Europe Glamping Market Market Revenue (US$ Mn) Comparison by Target (2016-2032)
- Figure 55: Western Europe Glamping Market Market Revenue (US$ Mn) Comparison by Age Group (2016-2032)
- Figure 56: Western Europe Glamping Market Market Y-o-Y Growth Rate Comparison by Country (2016-2032)
- Figure 57: Western Europe Glamping Market Market Y-o-Y Growth Rate Comparison by Accommodation (2016-2032)
- Figure 58: Western Europe Glamping Market Market Y-o-Y Growth Rate Comparison by Target (2016-2032)
- Figure 59: Western Europe Glamping Market Market Y-o-Y Growth Rate Comparison by Age Group (2016-2032)
- Figure 60: Western Europe Glamping Market Market Share Comparison by Country (2016-2032)
- Figure 61: Western Europe Glamping Market Market Share Comparison by Accommodation (2016-2032)
- Figure 62: Western Europe Glamping Market Market Share Comparison by Target (2016-2032)
- Figure 63: Western Europe Glamping Market Market Share Comparison by Age Group (2016-2032)
- Figure 64: Eastern Europe Glamping Market Revenue (US$ Mn) Market Share by Accommodationin 2022
- Figure 65: Eastern Europe Glamping Market Market Attractiveness Analysis by Accommodation, 2016-2032
- Figure 66: Eastern Europe Glamping Market Revenue (US$ Mn) Market Share by Targetin 2022
- Figure 67: Eastern Europe Glamping Market Market Attractiveness Analysis by Target, 2016-2032
- Figure 68: Eastern Europe Glamping Market Revenue (US$ Mn) Market Share by Age Groupin 2022
- Figure 69: Eastern Europe Glamping Market Market Attractiveness Analysis by Age Group, 2016-2032
- Figure 70: Eastern Europe Glamping Market Revenue (US$ Mn) Market Share by Country in 2022
- Figure 71: Eastern Europe Glamping Market Market Attractiveness Analysis by Country, 2016-2032
- Figure 72: Eastern Europe Glamping Market Market Revenue (US$ Mn) (2016-2032)
- Figure 73: Eastern Europe Glamping Market Market Revenue (US$ Mn) Comparison by Country (2016-2032)
- Figure 74: Eastern Europe Glamping Market Market Revenue (US$ Mn) Comparison by Accommodation (2016-2032)
- Figure 75: Eastern Europe Glamping Market Market Revenue (US$ Mn) Comparison by Target (2016-2032)
- Figure 76: Eastern Europe Glamping Market Market Revenue (US$ Mn) Comparison by Age Group (2016-2032)
- Figure 77: Eastern Europe Glamping Market Market Y-o-Y Growth Rate Comparison by Country (2016-2032)
- Figure 78: Eastern Europe Glamping Market Market Y-o-Y Growth Rate Comparison by Accommodation (2016-2032)
- Figure 79: Eastern Europe Glamping Market Market Y-o-Y Growth Rate Comparison by Target (2016-2032)
- Figure 80: Eastern Europe Glamping Market Market Y-o-Y Growth Rate Comparison by Age Group (2016-2032)
- Figure 81: Eastern Europe Glamping Market Market Share Comparison by Country (2016-2032)
- Figure 82: Eastern Europe Glamping Market Market Share Comparison by Accommodation (2016-2032)
- Figure 83: Eastern Europe Glamping Market Market Share Comparison by Target (2016-2032)
- Figure 84: Eastern Europe Glamping Market Market Share Comparison by Age Group (2016-2032)
- Figure 85: APAC Glamping Market Revenue (US$ Mn) Market Share by Accommodationin 2022
- Figure 86: APAC Glamping Market Market Attractiveness Analysis by Accommodation, 2016-2032
- Figure 87: APAC Glamping Market Revenue (US$ Mn) Market Share by Targetin 2022
- Figure 88: APAC Glamping Market Market Attractiveness Analysis by Target, 2016-2032
- Figure 89: APAC Glamping Market Revenue (US$ Mn) Market Share by Age Groupin 2022
- Figure 90: APAC Glamping Market Market Attractiveness Analysis by Age Group, 2016-2032
- Figure 91: APAC Glamping Market Revenue (US$ Mn) Market Share by Country in 2022
- Figure 92: APAC Glamping Market Market Attractiveness Analysis by Country, 2016-2032
- Figure 93: APAC Glamping Market Market Revenue (US$ Mn) (2016-2032)
- Figure 94: APAC Glamping Market Market Revenue (US$ Mn) Comparison by Country (2016-2032)
- Figure 95: APAC Glamping Market Market Revenue (US$ Mn) Comparison by Accommodation (2016-2032)
- Figure 96: APAC Glamping Market Market Revenue (US$ Mn) Comparison by Target (2016-2032)
- Figure 97: APAC Glamping Market Market Revenue (US$ Mn) Comparison by Age Group (2016-2032)
- Figure 98: APAC Glamping Market Market Y-o-Y Growth Rate Comparison by Country (2016-2032)
- Figure 99: APAC Glamping Market Market Y-o-Y Growth Rate Comparison by Accommodation (2016-2032)
- Figure 100: APAC Glamping Market Market Y-o-Y Growth Rate Comparison by Target (2016-2032)
- Figure 101: APAC Glamping Market Market Y-o-Y Growth Rate Comparison by Age Group (2016-2032)
- Figure 102: APAC Glamping Market Market Share Comparison by Country (2016-2032)
- Figure 103: APAC Glamping Market Market Share Comparison by Accommodation (2016-2032)
- Figure 104: APAC Glamping Market Market Share Comparison by Target (2016-2032)
- Figure 105: APAC Glamping Market Market Share Comparison by Age Group (2016-2032)
- Figure 106: Latin America Glamping Market Revenue (US$ Mn) Market Share by Accommodationin 2022
- Figure 107: Latin America Glamping Market Market Attractiveness Analysis by Accommodation, 2016-2032
- Figure 108: Latin America Glamping Market Revenue (US$ Mn) Market Share by Targetin 2022
- Figure 109: Latin America Glamping Market Market Attractiveness Analysis by Target, 2016-2032
- Figure 110: Latin America Glamping Market Revenue (US$ Mn) Market Share by Age Groupin 2022
- Figure 111: Latin America Glamping Market Market Attractiveness Analysis by Age Group, 2016-2032
- Figure 112: Latin America Glamping Market Revenue (US$ Mn) Market Share by Country in 2022
- Figure 113: Latin America Glamping Market Market Attractiveness Analysis by Country, 2016-2032
- Figure 114: Latin America Glamping Market Market Revenue (US$ Mn) (2016-2032)
- Figure 115: Latin America Glamping Market Market Revenue (US$ Mn) Comparison by Country (2016-2032)
- Figure 116: Latin America Glamping Market Market Revenue (US$ Mn) Comparison by Accommodation (2016-2032)
- Figure 117: Latin America Glamping Market Market Revenue (US$ Mn) Comparison by Target (2016-2032)
- Figure 118: Latin America Glamping Market Market Revenue (US$ Mn) Comparison by Age Group (2016-2032)
- Figure 119: Latin America Glamping Market Market Y-o-Y Growth Rate Comparison by Country (2016-2032)
- Figure 120: Latin America Glamping Market Market Y-o-Y Growth Rate Comparison by Accommodation (2016-2032)
- Figure 121: Latin America Glamping Market Market Y-o-Y Growth Rate Comparison by Target (2016-2032)
- Figure 122: Latin America Glamping Market Market Y-o-Y Growth Rate Comparison by Age Group (2016-2032)
- Figure 123: Latin America Glamping Market Market Share Comparison by Country (2016-2032)
- Figure 124: Latin America Glamping Market Market Share Comparison by Accommodation (2016-2032)
- Figure 125: Latin America Glamping Market Market Share Comparison by Target (2016-2032)
- Figure 126: Latin America Glamping Market Market Share Comparison by Age Group (2016-2032)
- Figure 127: Middle East & Africa Glamping Market Revenue (US$ Mn) Market Share by Accommodationin 2022
- Figure 128: Middle East & Africa Glamping Market Market Attractiveness Analysis by Accommodation, 2016-2032
- Figure 129: Middle East & Africa Glamping Market Revenue (US$ Mn) Market Share by Targetin 2022
- Figure 130: Middle East & Africa Glamping Market Market Attractiveness Analysis by Target, 2016-2032
- Figure 131: Middle East & Africa Glamping Market Revenue (US$ Mn) Market Share by Age Groupin 2022
- Figure 132: Middle East & Africa Glamping Market Market Attractiveness Analysis by Age Group, 2016-2032
- Figure 133: Middle East & Africa Glamping Market Revenue (US$ Mn) Market Share by Country in 2022
- Figure 134: Middle East & Africa Glamping Market Market Attractiveness Analysis by Country, 2016-2032
- Figure 135: Middle East & Africa Glamping Market Market Revenue (US$ Mn) (2016-2032)
- Figure 136: Middle East & Africa Glamping Market Market Revenue (US$ Mn) Comparison by Country (2016-2032)
- Figure 137: Middle East & Africa Glamping Market Market Revenue (US$ Mn) Comparison by Accommodation (2016-2032)
- Figure 138: Middle East & Africa Glamping Market Market Revenue (US$ Mn) Comparison by Target (2016-2032)
- Figure 139: Middle East & Africa Glamping Market Market Revenue (US$ Mn) Comparison by Age Group (2016-2032)
- Figure 140: Middle East & Africa Glamping Market Market Y-o-Y Growth Rate Comparison by Country (2016-2032)
- Figure 141: Middle East & Africa Glamping Market Market Y-o-Y Growth Rate Comparison by Accommodation (2016-2032)
- Figure 142: Middle East & Africa Glamping Market Market Y-o-Y Growth Rate Comparison by Target (2016-2032)
- Figure 143: Middle East & Africa Glamping Market Market Y-o-Y Growth Rate Comparison by Age Group (2016-2032)
- Figure 144: Middle East & Africa Glamping Market Market Share Comparison by Country (2016-2032)
- Figure 145: Middle East & Africa Glamping Market Market Share Comparison by Accommodation (2016-2032)
- Figure 146: Middle East & Africa Glamping Market Market Share Comparison by Target (2016-2032)
- Figure 147: Middle East & Africa Glamping Market Market Share Comparison by Age Group (2016-2032)
"
- List of Tables
- "
- Table 1: Global Glamping Market Market Comparison by Accommodation (2016-2032)
- Table 2: Global Glamping Market Market Comparison by Target (2016-2032)
- Table 3: Global Glamping Market Market Comparison by Age Group (2016-2032)
- Table 4: Global Glamping Market Revenue (US$ Mn) Comparison by Region (2016-2032)
- Table 5: Global Glamping Market Market Revenue (US$ Mn) (2016-2032)
- Table 6: Global Glamping Market Market Revenue (US$ Mn) Comparison by Region (2016-2032)
- Table 7: Global Glamping Market Market Revenue (US$ Mn) Comparison by Accommodation (2016-2032)
- Table 8: Global Glamping Market Market Revenue (US$ Mn) Comparison by Target (2016-2032)
- Table 9: Global Glamping Market Market Revenue (US$ Mn) Comparison by Age Group (2016-2032)
- Table 10: Global Glamping Market Market Y-o-Y Growth Rate Comparison by Region (2016-2032)
- Table 11: Global Glamping Market Market Y-o-Y Growth Rate Comparison by Accommodation (2016-2032)
- Table 12: Global Glamping Market Market Y-o-Y Growth Rate Comparison by Target (2016-2032)
- Table 13: Global Glamping Market Market Y-o-Y Growth Rate Comparison by Age Group (2016-2032)
- Table 14: Global Glamping Market Market Share Comparison by Region (2016-2032)
- Table 15: Global Glamping Market Market Share Comparison by Accommodation (2016-2032)
- Table 16: Global Glamping Market Market Share Comparison by Target (2016-2032)
- Table 17: Global Glamping Market Market Share Comparison by Age Group (2016-2032)
- Table 18: North America Glamping Market Market Comparison by Target (2016-2032)
- Table 19: North America Glamping Market Market Comparison by Age Group (2016-2032)
- Table 20: North America Glamping Market Revenue (US$ Mn) Comparison by Country (2016-2032)
- Table 21: North America Glamping Market Market Revenue (US$ Mn) (2016-2032)
- Table 22: North America Glamping Market Market Revenue (US$ Mn) Comparison by Country (2016-2032)
- Table 23: North America Glamping Market Market Revenue (US$ Mn) Comparison by Accommodation (2016-2032)
- Table 24: North America Glamping Market Market Revenue (US$ Mn) Comparison by Target (2016-2032)
- Table 25: North America Glamping Market Market Revenue (US$ Mn) Comparison by Age Group (2016-2032)
- Table 26: North America Glamping Market Market Y-o-Y Growth Rate Comparison by Country (2016-2032)
- Table 27: North America Glamping Market Market Y-o-Y Growth Rate Comparison by Accommodation (2016-2032)
- Table 28: North America Glamping Market Market Y-o-Y Growth Rate Comparison by Target (2016-2032)
- Table 29: North America Glamping Market Market Y-o-Y Growth Rate Comparison by Age Group (2016-2032)
- Table 30: North America Glamping Market Market Share Comparison by Country (2016-2032)
- Table 31: North America Glamping Market Market Share Comparison by Accommodation (2016-2032)
- Table 32: North America Glamping Market Market Share Comparison by Target (2016-2032)
- Table 33: North America Glamping Market Market Share Comparison by Age Group (2016-2032)
- Table 34: Western Europe Glamping Market Market Comparison by Accommodation (2016-2032)
- Table 35: Western Europe Glamping Market Market Comparison by Target (2016-2032)
- Table 36: Western Europe Glamping Market Market Comparison by Age Group (2016-2032)
- Table 37: Western Europe Glamping Market Revenue (US$ Mn) Comparison by Country (2016-2032)
- Table 38: Western Europe Glamping Market Market Revenue (US$ Mn) (2016-2032)
- Table 39: Western Europe Glamping Market Market Revenue (US$ Mn) Comparison by Country (2016-2032)
- Table 40: Western Europe Glamping Market Market Revenue (US$ Mn) Comparison by Accommodation (2016-2032)
- Table 41: Western Europe Glamping Market Market Revenue (US$ Mn) Comparison by Target (2016-2032)
- Table 42: Western Europe Glamping Market Market Revenue (US$ Mn) Comparison by Age Group (2016-2032)
- Table 43: Western Europe Glamping Market Market Y-o-Y Growth Rate Comparison by Country (2016-2032)
- Table 44: Western Europe Glamping Market Market Y-o-Y Growth Rate Comparison by Accommodation (2016-2032)
- Table 45: Western Europe Glamping Market Market Y-o-Y Growth Rate Comparison by Target (2016-2032)
- Table 46: Western Europe Glamping Market Market Y-o-Y Growth Rate Comparison by Age Group (2016-2032)
- Table 47: Western Europe Glamping Market Market Share Comparison by Country (2016-2032)
- Table 48: Western Europe Glamping Market Market Share Comparison by Accommodation (2016-2032)
- Table 49: Western Europe Glamping Market Market Share Comparison by Target (2016-2032)
- Table 50: Western Europe Glamping Market Market Share Comparison by Age Group (2016-2032)
- Table 51: Eastern Europe Glamping Market Market Comparison by Accommodation (2016-2032)
- Table 52: Eastern Europe Glamping Market Market Comparison by Target (2016-2032)
- Table 53: Eastern Europe Glamping Market Market Comparison by Age Group (2016-2032)
- Table 54: Eastern Europe Glamping Market Revenue (US$ Mn) Comparison by Country (2016-2032)
- Table 55: Eastern Europe Glamping Market Market Revenue (US$ Mn) (2016-2032)
- Table 56: Eastern Europe Glamping Market Market Revenue (US$ Mn) Comparison by Country (2016-2032)
- Table 57: Eastern Europe Glamping Market Market Revenue (US$ Mn) Comparison by Accommodation (2016-2032)
- Table 58: Eastern Europe Glamping Market Market Revenue (US$ Mn) Comparison by Target (2016-2032)
- Table 59: Eastern Europe Glamping Market Market Revenue (US$ Mn) Comparison by Age Group (2016-2032)
- Table 60: Eastern Europe Glamping Market Market Y-o-Y Growth Rate Comparison by Country (2016-2032)
- Table 61: Eastern Europe Glamping Market Market Y-o-Y Growth Rate Comparison by Accommodation (2016-2032)
- Table 62: Eastern Europe Glamping Market Market Y-o-Y Growth Rate Comparison by Target (2016-2032)
- Table 63: Eastern Europe Glamping Market Market Y-o-Y Growth Rate Comparison by Age Group (2016-2032)
- Table 64: Eastern Europe Glamping Market Market Share Comparison by Country (2016-2032)
- Table 65: Eastern Europe Glamping Market Market Share Comparison by Accommodation (2016-2032)
- Table 66: Eastern Europe Glamping Market Market Share Comparison by Target (2016-2032)
- Table 67: Eastern Europe Glamping Market Market Share Comparison by Age Group (2016-2032)
- Table 68: APAC Glamping Market Market Comparison by Accommodation (2016-2032)
- Table 69: APAC Glamping Market Market Comparison by Target (2016-2032)
- Table 70: APAC Glamping Market Market Comparison by Age Group (2016-2032)
- Table 71: APAC Glamping Market Revenue (US$ Mn) Comparison by Country (2016-2032)
- Table 72: APAC Glamping Market Market Revenue (US$ Mn) (2016-2032)
- Table 73: APAC Glamping Market Market Revenue (US$ Mn) Comparison by Country (2016-2032)
- Table 74: APAC Glamping Market Market Revenue (US$ Mn) Comparison by Accommodation (2016-2032)
- Table 75: APAC Glamping Market Market Revenue (US$ Mn) Comparison by Target (2016-2032)
- Table 76: APAC Glamping Market Market Revenue (US$ Mn) Comparison by Age Group (2016-2032)
- Table 77: APAC Glamping Market Market Y-o-Y Growth Rate Comparison by Country (2016-2032)
- Table 78: APAC Glamping Market Market Y-o-Y Growth Rate Comparison by Accommodation (2016-2032)
- Table 79: APAC Glamping Market Market Y-o-Y Growth Rate Comparison by Target (2016-2032)
- Table 80: APAC Glamping Market Market Y-o-Y Growth Rate Comparison by Age Group (2016-2032)
- Table 81: APAC Glamping Market Market Share Comparison by Country (2016-2032)
- Table 82: APAC Glamping Market Market Share Comparison by Accommodation (2016-2032)
- Table 83: APAC Glamping Market Market Share Comparison by Target (2016-2032)
- Table 84: APAC Glamping Market Market Share Comparison by Age Group (2016-2032)
- Table 85: Latin America Glamping Market Market Comparison by Accommodation (2016-2032)
- Table 86: Latin America Glamping Market Market Comparison by Target (2016-2032)
- Table 87: Latin America Glamping Market Market Comparison by Age Group (2016-2032)
- Table 88: Latin America Glamping Market Revenue (US$ Mn) Comparison by Country (2016-2032)
- Table 89: Latin America Glamping Market Market Revenue (US$ Mn) (2016-2032)
- Table 90: Latin America Glamping Market Market Revenue (US$ Mn) Comparison by Country (2016-2032)
- Table 91: Latin America Glamping Market Market Revenue (US$ Mn) Comparison by Accommodation (2016-2032)
- Table 92: Latin America Glamping Market Market Revenue (US$ Mn) Comparison by Target (2016-2032)
- Table 93: Latin America Glamping Market Market Revenue (US$ Mn) Comparison by Age Group (2016-2032)
- Table 94: Latin America Glamping Market Market Y-o-Y Growth Rate Comparison by Country (2016-2032)
- Table 95: Latin America Glamping Market Market Y-o-Y Growth Rate Comparison by Accommodation (2016-2032)
- Table 96: Latin America Glamping Market Market Y-o-Y Growth Rate Comparison by Target (2016-2032)
- Table 97: Latin America Glamping Market Market Y-o-Y Growth Rate Comparison by Age Group (2016-2032)
- Table 98: Latin America Glamping Market Market Share Comparison by Country (2016-2032)
- Table 99: Latin America Glamping Market Market Share Comparison by Accommodation (2016-2032)
- Table 100: Latin America Glamping Market Market Share Comparison by Target (2016-2032)
- Table 101: Latin America Glamping Market Market Share Comparison by Age Group (2016-2032)
- Table 102: Middle East & Africa Glamping Market Market Comparison by Accommodation (2016-2032)
- Table 103: Middle East & Africa Glamping Market Market Comparison by Target (2016-2032)
- Table 104: Middle East & Africa Glamping Market Market Comparison by Age Group (2016-2032)
- Table 105: Middle East & Africa Glamping Market Revenue (US$ Mn) Comparison by Country (2016-2032)
- Table 106: Middle East & Africa Glamping Market Market Revenue (US$ Mn) (2016-2032)
- Table 107: Middle East & Africa Glamping Market Market Revenue (US$ Mn) Comparison by Country (2016-2032)
- Table 108: Middle East & Africa Glamping Market Market Revenue (US$ Mn) Comparison by Accommodation (2016-2032)
- Table 109: Middle East & Africa Glamping Market Market Revenue (US$ Mn) Comparison by Target (2016-2032)
- Table 110: Middle East & Africa Glamping Market Market Revenue (US$ Mn) Comparison by Age Group (2016-2032)
- Table 111: Middle East & Africa Glamping Market Market Y-o-Y Growth Rate Comparison by Country (2016-2032)
- Table 112: Middle East & Africa Glamping Market Market Y-o-Y Growth Rate Comparison by Accommodation (2016-2032)
- Table 113: Middle East & Africa Glamping Market Market Y-o-Y Growth Rate Comparison by Target (2016-2032)
- Table 114: Middle East & Africa Glamping Market Market Y-o-Y Growth Rate Comparison by Age Group (2016-2032)
- Table 115: Middle East & Africa Glamping Market Market Share Comparison by Country (2016-2032)
- Table 116: Middle East & Africa Glamping Market Market Share Comparison by Accommodation (2016-2032)
- Table 117: Middle East & Africa Glamping Market Market Share Comparison by Target (2016-2032)
- Table 118: Middle East & Africa Glamping Market Market Share Comparison by Age Group (2016-2032)
- 1. Executive Summary
-
- Hilleberg Ab.
- Johnson Outdoors Inc.
- The North Face Inc.
- AMG GROUP
- Newell Brands Inc.
- Oase Outdoors
- The Coleman Company
- Simex Outdoor International
- Kampa
- Exxel Outdoors
- Bushtec Safari
- Sawday’s Canopy & Stars Ltd.
- Huttopia SA
- Wigwam Holidays Ltd
- Arena Campsites
- Nightfall Camp Pty Ltd.
- Getaway House Inc.
Our Clients


View Our Licence Options
