
Generic Drugs Market Report By Type of Drug (Simple Generics, Complex Generics, Biosimilars), By Therapeutic Area (Cardiovascular, Central Nervous System, Oncology, Diabetes, Immunology, Respiratory, Others), By Route of Administration (Oral, Parenteral (Injectable), Topical, Others), By Distribution Channel (Retail Pharmacies, Hospital Pharmacies, Online Pharmacies, Others), By Region and Companies - Industry Segment Outlook, Market Assessment, Competition Scenario, Trends and Forecast 2024-2033
-
47333
-
June 2024
-
321
-


-
This report was compiled by Trishita Deb Trishita Deb is an experienced market research and consulting professional with over 7 years of expertise across healthcare, consumer goods, and materials, contributing to over 400 healthcare-related reports. Correspondence Team Lead- Healthcare Linkedin | Detailed Market research Methodology Our methodology involves a mix of primary research, including interviews with leading mental health experts, and secondary research from reputable medical journals and databases. View Detailed Methodology Page
-
Quick Navigation
Report Overview
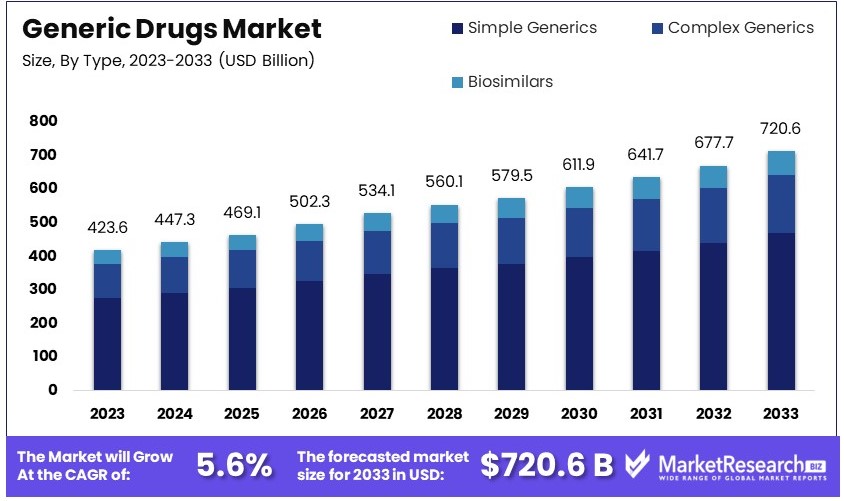
The Global Generic Drugs Market size is expected to be worth around USD 720.6 Billion by 2033, from USD 423.6 Billion in 2023, growing at a CAGR of 5.6% during the forecast period from 2024 to 2033.
The Generic Drugs Market comprises pharmaceuticals that are identical, or bioequivalent, to brand-name drugs but are available at a reduced cost. These drugs are marketed after the original patents expire and are regulated to ensure they meet rigorous safety, quality, and performance standards.
This market is crucial for reducing healthcare expenditures, increasing access to treatment, and supporting healthcare sustainability. Generic drugs typically enter the market at significantly lower prices, making them an essential choice for healthcare systems and consumers aiming to manage budget constraints while maintaining high-quality care standards.
The Generic Drugs Market is central to the global pharmaceutical industry, driven by a compelling need for cost-effective healthcare solutions. In the United States alone, generic drugs represent over 90% of all prescriptions dispensed, underscoring their critical role in making medicines accessible and affordable. Despite their widespread use, generics account for only 20-30% of total drug spending in the U.S., highlighting their significant impact on reducing healthcare costs.
The market dynamics are influenced by the predominant share of the U.S., which holds approximately 47.5% of the global market. This is largely attributed to a substantial patient base and a regulatory framework that favors generics through measures like the Hatch-Waxman Act, which encourages the introduction of generic competition to brand-name drugs. Other leading markets include China, Germany, India, and Japan, which collectively contribute to the global accessibility and affordability of pharmaceuticals.
Strategically, major players in this sector are leveraging expansive product portfolios and robust distribution networks to capitalize on these high-volume, lower-margin opportunities. Companies like Teva, Sandoz, and Mylan are at the forefront, continuously expanding their global footprint through strategic mergers, acquisitions, and partnerships. They are not only enhancing their market presence but are also investing in research and development to bring more complex generics and biosimilars to the market, aiming to offset the thinning pipelines of novel drugs.
In conclusion, the Generic Drugs Market is poised for sustained growth, fueled by the escalating demand for affordable medication and supportive governmental policies across key global markets. These factors, combined with strategic industry movements, suggest a robust outlook for the generics sector, making it a pivotal element of the broader pharmaceutical landscape.
Key Takeaways
- Market Value: The global generic drugs market is valued at USD 423.6 billion in 2023, projected to grow at a CAGR of 5.6%, reaching USD 720.6 billion by 2033.
- Type of Drug Analysis: Simple Generics hold a 65% market share, dominating due to their lower cost and broad acceptance, crucial for reducing healthcare expenses.
- Therapeutic Area Analysis: Cardiovascular drugs lead with a 30% share, essential for managing widespread cardiovascular conditions affordably.
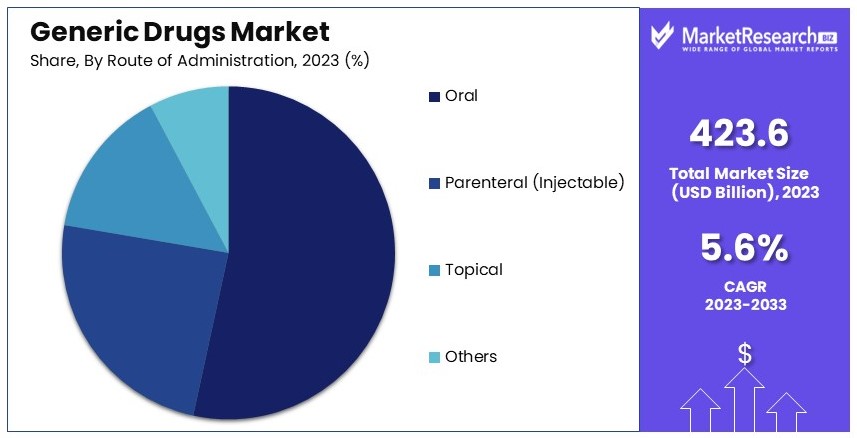
- Route of Administration Analysis: Oral administration dominates with a 55% share, favored for its ease and compliance, supporting widespread use in multiple therapies.
- Distribution Channel Analysis: Retail Pharmacies are predominant, accounting for 50% of the market, essential for their accessibility and extensive network.
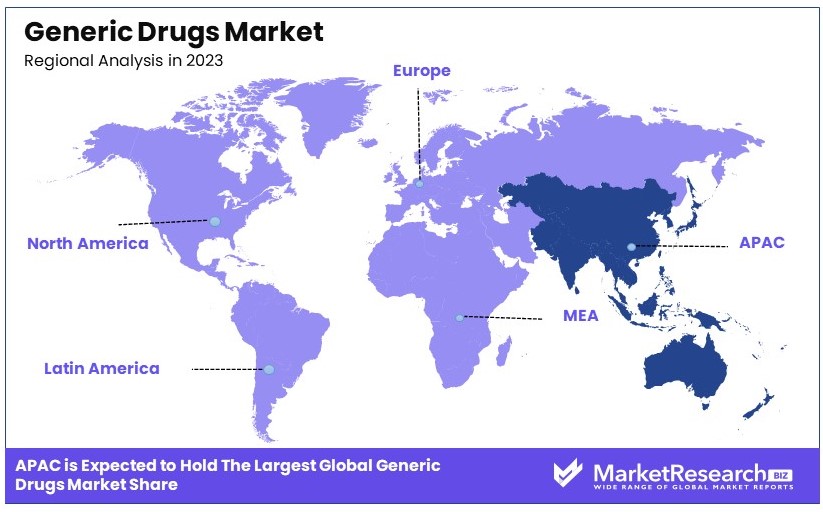
- Dominant Region: Asia Pacific holds a 45% share of the market, leading due to advanced healthcare infrastructure and high drug adoption rates.
- Analyst Viewpoint: The market exhibits moderate competition and saturation; future growth will depend on regulatory approvals and market penetration in developing regions.
- Growth Opportunities: Key players can differentiate by focusing on underserved therapeutic areas and expanding into emerging markets to capitalize on local growth dynamics.
Driving Factors
Patent Expiration Drives Market Growth
Patent expirations of branded drugs play a crucial role in the growth of the generic drugs market. When patents expire, generic manufacturers can produce and market less expensive versions of these drugs. This increased competition leads to more options for consumers and significant market expansion. For instance, the expiration of patents for blockbuster drugs like Lipitor (atorvastatin) and Nexium (esomeprazole) created substantial opportunities for generic drug companies. The availability of cheaper alternatives to these high-demand medications has led to a surge in market demand.
This growth is directly tied to the influx of generic versions of previously patented drugs. Additionally, the competitive pricing of generic drugs has made them a preferred choice among consumers, healthcare providers, and insurance companies, further driving market growth.
Rising Healthcare Costs Drive Market Growth
The rise in healthcare costs and the implementation of cost-containment measures have significantly driven the growth of the generic drugs market. Governments, insurance companies, and consumers are increasingly burdened by high healthcare expenses, prompting a demand for more affordable alternatives. Generic drugs offer a cost-effective solution, helping to reduce the financial strain on healthcare systems. Many healthcare providers and payers actively promote the use of generic drugs as a means to save costs.
This trend has led to a substantial increase in the adoption of generic medications. For example, the U.S. healthcare system saved approximately $313 billion in 2020 by using generic drugs. The promotion of generics as a cost-saving measure has resulted in a steady rise in market share.
Increasing Prevalence of Chronic Diseases Drives Market Growth
The rising prevalence of chronic diseases significantly contributes to the growth of the generic drugs market. Chronic disease management such as diabetes, cardiovascular disorders, and cancer require long-term medication, creating a steady demand for affordable treatment options. Generic drug manufacturers are well-positioned to meet this demand by offering cost-effective alternatives to branded medications.
As the incidence of chronic diseases continues to rise globally, the need for accessible and affordable medications has become more critical. In 2021, it was reported that around 463 million adults were living with diabetes, a number expected to reach 700 million by 2045. This growing patient population drives the demand for generic drugs, as patients seek sustainable and affordable treatment options. This trend underscores the importance of generic drugs in managing long-term health conditions and reducing overall healthcare costs.
Restraining Factors
Pricing Pressures and Competition Restrain Market Growth
Intense competition in the generic drug market creates significant pricing pressures. As more manufacturers enter the market, the increased supply of generic drugs leads to price erosion. This competition drives prices down, squeezing profit margins for manufacturers. Lower profits can limit the funds available for investment in research and development of new generic products.
According to recent industry reports, the price of many generic drugs has dropped by up to 90% once multiple competitors enter the market. This decline in prices makes it difficult for manufacturers to sustain high-quality production and invest in developing new generics. Consequently, this factor significantly restrains the growth potential of the market.
Challenges in Complex Generics Restrain Market Growth
Developing generic versions of complex drugs, including biologics and drug-device combinations, poses significant technical and regulatory challenges. These complexities slow down the introduction of new generic products in these segments. Biologics, which are made from living organisms, require intricate manufacturing processes and stringent regulatory approval.
The high cost and difficulty of producing these complex generics limit their market availability. For example, the biosimilars market, a subset of biologics, is projected to grow at a slower pace of 4.5% CAGR from 2023 to 2030 compared to simpler generics. Regulatory hurdles further complicate the market entry for complex generics, delaying their availability and limiting market growth. These challenges hinder the expansion of the generic drugs market, particularly in advanced drug categories.
Type of Drug Analysis
Simple Generics dominate with 65% due to lower costs and wide acceptance.
The Generic Drugs Market can be segmented by type into Simple Generics, Complex Generics, and Biosimilars. Among these, Simple Generics dominate the market, holding the largest share due to their lower cost and wide acceptance. Simple Generics, which are bioequivalent to branded drugs, are preferred for their affordability and availability. The market for Simple Generics is driven by the need to reduce healthcare costs and increase access to essential medicines. The widespread adoption of these drugs, especially in emerging markets, further boosts their demand.
Complex Generics, though a smaller segment, are gaining traction due to their ability to treat more complex conditions. These drugs are harder to develop and manufacture, but they offer higher profitability margins and face less competition. The segment's growth is propelled by advancements in drug formulation technologies and the expiration of patents for complex drugs.
Biosimilars, a nascent yet rapidly growing segment, represent generic versions of biologic drugs. Their market expansion is driven by the rising incidence of chronic diseases and the increasing acceptance of biologics in treatment protocols. The stringent regulatory pathway and higher development costs pose challenges, but the potential for cost savings and improved patient outcomes drive their adoption.
Therapeutic Area Analysis
Cardiovascular dominates with 30% due to high disease prevalence and affordability.
The Generic Drugs Market is also segmented by therapeutic area, including Cardiovascular, Central Nervous System, Oncology, Diabetes, Immunology, Respiratory, and Others. The Cardiovascular segment holds a dominant position, primarily due to the high prevalence of cardiovascular diseases globally. The aging population and rising incidence of lifestyle-related conditions such as hypertension and hyperlipidemia contribute to the sustained demand for cardiovascular generics. The affordability of these drugs ensures their continued use in managing chronic cardiovascular conditions.
Central Nervous System (CNS) drugs form another significant segment, driven by the increasing incidence of mental health disorders and neurological conditions. The demand for generic CNS drugs is boosted by the need for long-term treatment options and cost-effective therapies. Oncology drugs, though currently a smaller segment, are witnessing rapid growth due to the rising cancer burden and the high cost of branded oncology drugs. The introduction of generic oncology drugs has significantly reduced treatment costs, making cancer care more accessible. Diabetes, Immunology, and Respiratory segments also play crucial roles in the market, driven by the increasing prevalence of related conditions and the need for cost-effective treatment options.
Route of Administration Analysis
Oral dominates with 55% due to ease of administration and patient compliance.
Generic drugs are administered through various routes, including Oral, Parenteral (Injectable), Topical, and Others. The Oral route of administration dominates the market, accounting for the largest share due to ease of administration, patient compliance, and cost-effectiveness. Oral generics, available in forms such as tablets and capsules, are widely used for various therapeutic indications, making them the most preferred choice among patients and healthcare providers.
Parenteral generics, administered through injections, form the second-largest segment. These drugs are crucial for conditions requiring rapid onset of action or when oral administration is not feasible. The segment's growth is driven by the increasing prevalence of chronic diseases and the rising demand for injectable generics in hospital settings. Topical generics, used for skin conditions and localized treatments, are also significant, with growing demand driven by the increasing incidence of dermatological conditions and the preference for non-invasive treatment options.
Distribution Channel Analysis
Retail Pharmacies dominate with 50% due to widespread presence and convenience.
The distribution channels for generic drugs include Retail Pharmacies, Hospital Pharmacies, Online Pharmacies, and Others. Retail Pharmacies hold the largest market share, driven by their widespread presence and convenience for patients. Retail pharmacies play a crucial role in ensuring the availability and accessibility of generic drugs to the general population. The segment's dominance is also supported by the strong network of community pharmacies and the trust patients place in these establishments.
Hospital Pharmacies form the second-largest segment, driven by the high volume of generic drugs used in hospital settings for acute and chronic conditions. The increasing number of hospital admissions and the emphasis on cost-effective treatment options contribute to the growth of this segment. Online Pharmacies, though a smaller segment, are rapidly growing due to the convenience of home delivery, competitive pricing, and the increasing adoption of e-commerce. The COVID-19 pandemic has further accelerated the shift towards online pharmacies, highlighting their importance in the distribution of generic drugs.
Key Market Segments
By Type of Drug
- Simple Generics
- Complex Generics
- Biosimilars
By Therapeutic Area
- Cardiovascular
- Central Nervous System
- Oncology
- Diabetes
- Immunology
- Respiratory
- Others
By Route of Administration
- Oral
- Parenteral (Injectable)
- Topical
- Others
By Distribution Channel
- Retail Pharmacies
- Hospital Pharmacies
- Online Pharmacies
- Others
Growth Opportunities
Biosimilars and Complex Generics Offer Growth Opportunity
As patents on biologic drugs and complex drug-device combinations expire, there is significant growth potential for biosimilars and complex generics. This segment requires substantial investment and technical expertise, but the rewards are promising.
Complex generics, which include extended-release formulations and drug-device combinations, also present a lucrative opportunity. The technical challenges associated with these drugs can lead to higher barriers to entry, allowing manufacturers with the necessary expertise to capture significant market share. This growth potential is further supported by regulatory agencies' efforts to streamline approval processes for complex generics and biosimilars.
Specialty Generics Offer Growth Opportunity
Developing generic versions of specialty pharmacy services presents a significant growth opportunity. Specialty drugs, used to treat rare or complex conditions, are typically high-cost medications. As patents for these drugs expire, the market opens up for generic manufacturers willing to navigate the technical and regulatory challenges.
The specialty generics market is projected to grow at a CAGR of 6.5% from 2023 to 2030. This growth is driven by the increasing prevalence of rare diseases and the rising cost of specialty medications, which create a demand for more affordable alternatives. Manufacturers that successfully develop and market specialty generics can benefit from reduced competition and potentially higher profit margins.
Trending Factors
Vertical Integration Are Trending Factors
Vertical integration is a trending factor in the generic drugs market. Some manufacturers are acquiring or partnering with active pharmaceutical ingredient (API) suppliers to improve supply chain efficiency and reduce costs.
This strategy allows for greater control over the production process and ensures a stable supply of high-quality APIs. The move towards vertical integration is driven by the need to mitigate risks associated with API shortages and price volatility. By integrating vertically, generic drug manufacturers can enhance their competitive advantage, reduce dependency on third-party suppliers, and achieve cost savings, which can be passed on to consumers.
Innovative Drug Delivery Systems Are Trending Factors
Innovative drug delivery systems are a trending factor in the generic drugs market. Manufacturers are exploring advanced delivery technologies, such as extended-release formulations and novel dosage forms, to differentiate their products. These innovations can improve patient compliance, enhance therapeutic outcomes, and potentially command higher prices.
The global market for advanced drug delivery systems is projected to grow at a CAGR of 8.4% from 2023 to 2030. By incorporating these technologies, generic drug manufacturers can expand their product portfolios and capture new market segments. Innovations in drug delivery also allow for the development of more effective and patient-friendly generics.
Sustainable Manufacturing Practices Are Trending Factors
Sustainable manufacturing practices are becoming a trending factor in the generic drugs market. With increasing environmental concerns, manufacturers are adopting sustainable practices to improve operational efficiency and reduce costs while promoting environmental responsibility. This trend is driven by regulatory requirements, consumer demand for greener products, and the potential for cost savings through energy efficiency and waste reduction.
The adoption of sustainable practices can enhance a company's reputation and competitive positioning. According to industry reports, companies that implement sustainable manufacturing practices can achieve cost reductions of up to 20% and improve their market appeal to environmentally conscious consumers.
Regional Analysis
Asia Pacific Dominates with 45% Market Share in the Generic Drugs Market
Asia Pacific's leadership in the generic drugs market can be attributed to several factors. Primarily, the region benefits from robust manufacturing capabilities and a favorable regulatory environment, which streamline the production and approval of generic drugs. Furthermore, large pharmaceutical companies in countries like India and China capitalize on lower production costs compared to Western counterparts. The rising healthcare needs of a growing population also fuel demand for affordable medication options, reinforcing the region's dominance.
The dynamics of the Asia Pacific region are characterized by extensive collaborations between local manufacturers and global pharmaceutical giants, which enhance production capacities and market reach. Strategic initiatives, including partnerships for technology transfer and joint ventures, significantly boost the region's output and distribution networks. The proliferation of chronic diseases and increased healthcare expenditure also play a crucial role in shaping the industry's landscape, perpetuating the high consumption of generic drugs.
Looking ahead, Asia Pacific is poised to maintain, if not increase, its influence in the generic drugs market. Continuous improvements in healthcare infrastructure and policies aimed at promoting generic drug uptake are expected to drive further growth. Additionally, as patent cliffs loom for numerous blockbuster drugs, Asia Pacific manufacturers are well-positioned to capitalize on new opportunities, potentially increasing their market share.
Europe Holds 30% Market Share
Europe is another significant region, holding a 30% market share. The region's market is supported by government initiatives promoting generic drug use and stringent regulatory frameworks ensuring quality and safety. Countries like Germany, the UK, and France lead in generic drug consumption. The market is expected to grow at a CAGR of 5.3% from 2023 to 2030, driven by increasing healthcare expenditure and an aging population.
Middle East & Africa Capture 5% Market Share
The Middle East and Africa hold a smaller market share at 5%. The market in this region is driven by improving healthcare access and rising demand for affordable medications. Countries like Saudi Arabia and South Africa are leading the growth. The market is expected to grow at a CAGR of 6.2% from 2023 to 2030, supported by increasing healthcare investments and the adoption of generic drugs.
Latin America Maintains 5% Market Share
Latin America also holds a 5% market share. The region's market is driven by the growing prevalence of chronic diseases and efforts to reduce healthcare costs. Brazil and Mexico are key markets in the region. The market in Latin America is projected to grow at a CAGR of 6.0% from 2023 to 2030, fueled by government initiatives and increasing demand for cost-effective medications.
Key Regions and Countries
- North America
- The US
- Canada
- Mexico
- Western Europe
- Germany
- France
- The UK
- Spain
- Italy
- Portugal
- Ireland
- Austria
- Switzerland
- Benelux
- Nordic
- Rest of Western Europe
- Eastern Europe
- Russia
- Poland
- The Czech Republic
- Greece
- Rest of Eastern Europe
- APAC
- China
- Japan
- South Korea
- India
- Australia & New Zealand
- Indonesia
- Malaysia
- Philippines
- Singapore
- Thailand
- Vietnam
- Rest of APAC
- Latin America
- Brazil
- Colombia
- Chile
- Argentina
- Costa Rica
- Rest of Latin America
- Middle East & Africa
- Algeria
- Egypt
- Israel
- Kuwait
- Nigeria
- Saudi Arabia
- South Africa
- Turkey
- United Arab Emirates
- Rest of MEA
Key Players Analysis
The Generic Drugs Market features a competitive landscape dominated by several key players who influence the industry through strategic positioning and expansive product portfolios. Teva Pharmaceutical Industries Ltd. leads with a robust global presence, backed by extensive manufacturing capabilities and a diverse generics portfolio. Sandoz, a division of Novartis, closely follows, known for pioneering biosimilars and being at the forefront of innovation in generic medications.
Mylan N.V., now part of Viatris, has enhanced its market position through strategic mergers, broadening its geographical footprint and therapeutic range. Pfizer Inc., while primarily known for its branded pharmaceuticals, also plays a significant role in the generics market through its subsidiary Greenstone.
Sun Pharmaceutical Industries Ltd., the largest pharma company in India, leverages its extensive R&D capabilities to maintain a strong position in generics. Fresenius Kabi AG focuses on injectable generics, critical care, and oncology, catering to a niche yet vital market segment. Lupin Limited and Dr. Reddy's Laboratories Ltd. are distinguished by their focus on complex generics, biologics, and active pharmaceutical ingredients, driving their growth in both developed and emerging markets.
Cipla Ltd. and Aurobindo Pharma Ltd. are noted for their comprehensive portfolio of generics, including respiratory and antiretroviral therapies, which are critical in global health contexts. Stada Arzneimittel AG and Hikma Pharmaceuticals PLC enhance their market reach through targeted acquisitions and a focus on underserved markets. Endo International plc, Torrent Pharmaceuticals Ltd., and Zydus Cadila are recognized for their strategic market adaptations and consistent investment in generic product development.
Collectively, these companies drive the competitive dynamics of the Generic Drugs Market, contributing to its robust growth and resilience by focusing on cost-effective solutions, strategic global expansion, and addressing complex health challenges.
Market Key Players
- Teva Pharmaceutical Industries Ltd.
- Sandoz (a Novartis division)
- Mylan N.V. (part of Viatris)
- Pfizer Inc.
- Sun Pharmaceutical Industries Ltd.
- Fresenius Kabi AG
- Lupin Limited
- Dr. Reddy's Laboratories Ltd.
- Cipla Ltd.
- Aurobindo Pharma Ltd.
- Stada Arzneimittel AG
- Hikma Pharmaceuticals PLC
- Endo International plc
- Torrent Pharmaceuticals Ltd.
- Zydus Cadila
Recent Developments
- June 2024: Lupin received US FDA approvals for Doxycycline for Injection USP (generic equivalent of Pfizer's Vibramycin) and Letermovir Tablets (generic equivalent of Merck's Prevymis). The products are used to treat bacterial infections and prevent diseases caused by cytomegalovirus (CMV), respectively.
- April 2024: Zydus Lifesciences launched a generic drug for overactive bladder in the US market. The product is a generic equivalent of Myrbetriq (mirabegron extended-release tablets) and is used to treat overactive bladder with symptoms of urge urinary incontinence, urgency, and frequency.
- February 2024: Biocon Limited received US FDA approval to market a generic anti-cancer medication, expanding its portfolio of affordable medicines for patients worldwide. The company's commitment to innovative R&D and strategic partnerships drives its growth in the global biopharmaceutical industry.
- January 2024: Cosmos Health acquired a portfolio of 10 generic drugs for €3.2 million, enhancing its pharmaceutical portfolio and solidifying its status as a vertically integrated entity. The selected drugs address various health issues, including diabetes, cholesterol, and cardiac conditions.
Report Scope
Report Features Description Market Value (2023) USD 423.6 Billion Forecast Revenue (2033) USD 720.6 Billion CAGR (2024-2033) 5.6% Base Year for Estimation 2023 Historic Period 2018-2023 Forecast Period 2024-2033 Report Coverage Revenue Forecast, Market Dynamics, Competitive Landscape, Recent Developments Segments Covered By Type of Drug (Simple Generics, Complex Generics, Biosimilars), By Therapeutic Area (Cardiovascular, Central Nervous System, Oncology, Diabetes, Immunology, Respiratory, Others), By Route of Administration (Oral, Parenteral (Injectable), Topical, Others), By Distribution Channel (Retail Pharmacies, Hospital Pharmacies, Online Pharmacies, Others) Regional Analysis North America - The US, Canada, & Mexico; Western Europe - Germany, France, The UK, Spain, Italy, Portugal, Ireland, Austria, Switzerland, Benelux, Nordic, & Rest of Western Europe; Eastern Europe - Russia, Poland, The Czech Republic, Greece, & Rest of Eastern Europe; APAC - China, Japan, South Korea, India, Australia & New Zealand, Indonesia, Malaysia, Philippines, Singapore, Thailand, Vietnam, & Rest of APAC; Latin America - Brazil, Colombia, Chile, Argentina, Costa Rica, & Rest of Latin America; Middle East & Africa - Algeria, Egypt, Israel, Kuwait, Nigeria, Saudi Arabia, South Africa, Turkey, United Arab Emirates, & Rest of MEA Competitive Landscape Teva Pharmaceutical Industries Ltd., Sandoz (a Novartis division), Mylan N.V. (part of Viatris), Pfizer Inc., Sun Pharmaceutical Industries Ltd., Fresenius Kabi AG, Lupin Limited, Dr. Reddy's Laboratories Ltd., Cipla Ltd., Aurobindo Pharma Ltd., Stada Arzneimittel AG, Hikma Pharmaceuticals PLC, Endo International plc, Torrent Pharmaceuticals Ltd., Zydus Cadila Customization Scope Customization for segments, region/country-level will be provided. Moreover, additional customization can be done based on the requirements. Purchase Options We have three licenses to opt for: Single User License, Multi-User License (Up to 5 Users), Corporate Use License (Unlimited User and Printable PDF) -
- 1. Executive Summary
- 1.1. Definition
- 1.2. Taxonomy
- 1.3. Research Scope
- 1.4. Key Analysis
- 1.5. Key Findings by Major Segments
- 1.6. Top strategies by Major Players
- 2. Global Generic Drugs Market Overview
- 2.1. Generic Drugs Market Dynamics
- 2.1.1. Drivers
- 2.1.2. Opportunities
- 2.1.3. Restraints
- 2.1.4. Challenges
- 2.2. Macro-economic Factors
- 2.3. Regulatory Framework
- 2.4. Market Investment Feasibility Index
- 2.5. PEST Analysis
- 2.6. PORTER’S Five Force Analysis
- 2.7. Drivers & Restraints Impact Analysis
- 2.8. Industry Chain Analysis
- 2.9. Cost Structure Analysis
- 2.10. Marketing Strategy
- 2.11. Russia-Ukraine War Impact Analysis
- 2.12. Opportunity Map Analysis
- 2.13. Market Competition Scenario Analysis
- 2.14. Product Life Cycle Analysis
- 2.15. Opportunity Orbits
- 2.16. Manufacturer Intensity Map
- 2.17. Major Companies sales by Value & Volume
- 2.1. Generic Drugs Market Dynamics
- 3. Global Generic Drugs Market Analysis, Opportunity and Forecast, 2016-2032
- 3.1. Global Generic Drugs Market Analysis, 2016-2021
- 3.2. Global Generic Drugs Market Opportunity and Forecast, 2023-2032
- 3.3. Global Generic Drugs Market Analysis, Opportunity and Forecast, By Type of Drug, 2016-2032
- 3.3.1. Global Generic Drugs Market Analysis by Type of Drug: Introduction
- 3.3.2. Market Size Absolute $ Opportunity Analysis and Forecast, By Type of Drug, 2016-2032
- 3.3.3. Simple Generics
- 3.3.4. Complex Generics
- 3.3.5. Biosimilars
- 3.4. Global Generic Drugs Market Analysis, Opportunity and Forecast, By Therapeutic Area, 2016-2032
- 3.4.1. Global Generic Drugs Market Analysis by Therapeutic Area: Introduction
- 3.4.2. Market Size Absolute $ Opportunity Analysis and Forecast, By Therapeutic Area, 2016-2032
- 3.4.3. Cardiovascular
- 3.4.4. Central Nervous System
- 3.4.5. Oncology
- 3.4.6. Diabetes
- 3.4.7. Immunology
- 3.4.8. Respiratory
- 3.4.9. Others
- 3.5. Global Generic Drugs Market Analysis, Opportunity and Forecast, By Route of Administration, 2016-2032
- 3.5.1. Global Generic Drugs Market Analysis by Route of Administration: Introduction
- 3.5.2. Market Size Absolute $ Opportunity Analysis and Forecast, By Route of Administration, 2016-2032
- 3.5.3. Oral
- 3.5.4. Parenteral (Injectable)
- 3.5.5. Topical
- 3.5.6. Others
- 3.6. Global Generic Drugs Market Analysis, Opportunity and Forecast, By Distribution Channel, 2016-2032
- 3.6.1. Global Generic Drugs Market Analysis by Distribution Channel: Introduction
- 3.6.2. Market Size Absolute $ Opportunity Analysis and Forecast, By Distribution Channel, 2016-2032
- 3.6.3. Retail Pharmacies
- 3.6.4. Hospital Pharmacies
- 3.6.5. Online Pharmacies
- 3.6.6. Others
- 4. North America Generic Drugs Market Analysis, Opportunity and Forecast, 2016-2032
- 4.1. North America Generic Drugs Market Analysis, 2016-2021
- 4.2. North America Generic Drugs Market Opportunity and Forecast, 2023-2032
- 4.3. North America Generic Drugs Market Analysis, Opportunity and Forecast, By Type of Drug, 2016-2032
- 4.3.1. North America Generic Drugs Market Analysis by Type of Drug: Introduction
- 4.3.2. Market Size Absolute $ Opportunity Analysis and Forecast, By Type of Drug, 2016-2032
- 4.3.3. Simple Generics
- 4.3.4. Complex Generics
- 4.3.5. Biosimilars
- 4.4. North America Generic Drugs Market Analysis, Opportunity and Forecast, By Therapeutic Area, 2016-2032
- 4.4.1. North America Generic Drugs Market Analysis by Therapeutic Area: Introduction
- 4.4.2. Market Size Absolute $ Opportunity Analysis and Forecast, By Therapeutic Area, 2016-2032
- 4.4.3. Cardiovascular
- 4.4.4. Central Nervous System
- 4.4.5. Oncology
- 4.4.6. Diabetes
- 4.4.7. Immunology
- 4.4.8. Respiratory
- 4.4.9. Others
- 4.5. North America Generic Drugs Market Analysis, Opportunity and Forecast, By Route of Administration, 2016-2032
- 4.5.1. North America Generic Drugs Market Analysis by Route of Administration: Introduction
- 4.5.2. Market Size Absolute $ Opportunity Analysis and Forecast, By Route of Administration, 2016-2032
- 4.5.3. Oral
- 4.5.4. Parenteral (Injectable)
- 4.5.5. Topical
- 4.5.6. Others
- 4.6. North America Generic Drugs Market Analysis, Opportunity and Forecast, By Distribution Channel, 2016-2032
- 4.6.1. North America Generic Drugs Market Analysis by Distribution Channel: Introduction
- 4.6.2. Market Size Absolute $ Opportunity Analysis and Forecast, By Distribution Channel, 2016-2032
- 4.6.3. Retail Pharmacies
- 4.6.4. Hospital Pharmacies
- 4.6.5. Online Pharmacies
- 4.6.6. Others
- 4.7. North America Generic Drugs Market Analysis, Opportunity and Forecast, By Country , 2016-2032
- 4.7.1. North America Generic Drugs Market Analysis by Country : Introduction
- 4.7.2. Market Size Absolute $ Opportunity Analysis and Forecast, Country , 2016-2032
- 4.7.2.1. The US
- 4.7.2.2. Canada
- 4.7.2.3. Mexico
- 5. Western Europe Generic Drugs Market Analysis, Opportunity and Forecast, 2016-2032
- 5.1. Western Europe Generic Drugs Market Analysis, 2016-2021
- 5.2. Western Europe Generic Drugs Market Opportunity and Forecast, 2023-2032
- 5.3. Western Europe Generic Drugs Market Analysis, Opportunity and Forecast, By Type of Drug, 2016-2032
- 5.3.1. Western Europe Generic Drugs Market Analysis by Type of Drug: Introduction
- 5.3.2. Market Size Absolute $ Opportunity Analysis and Forecast, By Type of Drug, 2016-2032
- 5.3.3. Simple Generics
- 5.3.4. Complex Generics
- 5.3.5. Biosimilars
- 5.4. Western Europe Generic Drugs Market Analysis, Opportunity and Forecast, By Therapeutic Area, 2016-2032
- 5.4.1. Western Europe Generic Drugs Market Analysis by Therapeutic Area: Introduction
- 5.4.2. Market Size Absolute $ Opportunity Analysis and Forecast, By Therapeutic Area, 2016-2032
- 5.4.3. Cardiovascular
- 5.4.4. Central Nervous System
- 5.4.5. Oncology
- 5.4.6. Diabetes
- 5.4.7. Immunology
- 5.4.8. Respiratory
- 5.4.9. Others
- 5.5. Western Europe Generic Drugs Market Analysis, Opportunity and Forecast, By Route of Administration, 2016-2032
- 5.5.1. Western Europe Generic Drugs Market Analysis by Route of Administration: Introduction
- 5.5.2. Market Size Absolute $ Opportunity Analysis and Forecast, By Route of Administration, 2016-2032
- 5.5.3. Oral
- 5.5.4. Parenteral (Injectable)
- 5.5.5. Topical
- 5.5.6. Others
- 5.6. Western Europe Generic Drugs Market Analysis, Opportunity and Forecast, By Distribution Channel, 2016-2032
- 5.6.1. Western Europe Generic Drugs Market Analysis by Distribution Channel: Introduction
- 5.6.2. Market Size Absolute $ Opportunity Analysis and Forecast, By Distribution Channel, 2016-2032
- 5.6.3. Retail Pharmacies
- 5.6.4. Hospital Pharmacies
- 5.6.5. Online Pharmacies
- 5.6.6. Others
- 5.7. Western Europe Generic Drugs Market Analysis, Opportunity and Forecast, By Country , 2016-2032
- 5.7.1. Western Europe Generic Drugs Market Analysis by Country : Introduction
- 5.7.2. Market Size Absolute $ Opportunity Analysis and Forecast, Country , 2016-2032
- 5.7.2.1. Germany
- 5.7.2.2. France
- 5.7.2.3. The UK
- 5.7.2.4. Spain
- 5.7.2.5. Italy
- 5.7.2.6. Portugal
- 5.7.2.7. Ireland
- 5.7.2.8. Austria
- 5.7.2.9. Switzerland
- 5.7.2.10. Benelux
- 5.7.2.11. Nordic
- 5.7.2.12. Rest of Western Europe
- 6. Eastern Europe Generic Drugs Market Analysis, Opportunity and Forecast, 2016-2032
- 6.1. Eastern Europe Generic Drugs Market Analysis, 2016-2021
- 6.2. Eastern Europe Generic Drugs Market Opportunity and Forecast, 2023-2032
- 6.3. Eastern Europe Generic Drugs Market Analysis, Opportunity and Forecast, By Type of Drug, 2016-2032
- 6.3.1. Eastern Europe Generic Drugs Market Analysis by Type of Drug: Introduction
- 6.3.2. Market Size Absolute $ Opportunity Analysis and Forecast, By Type of Drug, 2016-2032
- 6.3.3. Simple Generics
- 6.3.4. Complex Generics
- 6.3.5. Biosimilars
- 6.4. Eastern Europe Generic Drugs Market Analysis, Opportunity and Forecast, By Therapeutic Area, 2016-2032
- 6.4.1. Eastern Europe Generic Drugs Market Analysis by Therapeutic Area: Introduction
- 6.4.2. Market Size Absolute $ Opportunity Analysis and Forecast, By Therapeutic Area, 2016-2032
- 6.4.3. Cardiovascular
- 6.4.4. Central Nervous System
- 6.4.5. Oncology
- 6.4.6. Diabetes
- 6.4.7. Immunology
- 6.4.8. Respiratory
- 6.4.9. Others
- 6.5. Eastern Europe Generic Drugs Market Analysis, Opportunity and Forecast, By Route of Administration, 2016-2032
- 6.5.1. Eastern Europe Generic Drugs Market Analysis by Route of Administration: Introduction
- 6.5.2. Market Size Absolute $ Opportunity Analysis and Forecast, By Route of Administration, 2016-2032
- 6.5.3. Oral
- 6.5.4. Parenteral (Injectable)
- 6.5.5. Topical
- 6.5.6. Others
- 6.6. Eastern Europe Generic Drugs Market Analysis, Opportunity and Forecast, By Distribution Channel, 2016-2032
- 6.6.1. Eastern Europe Generic Drugs Market Analysis by Distribution Channel: Introduction
- 6.6.2. Market Size Absolute $ Opportunity Analysis and Forecast, By Distribution Channel, 2016-2032
- 6.6.3. Retail Pharmacies
- 6.6.4. Hospital Pharmacies
- 6.6.5. Online Pharmacies
- 6.6.6. Others
- 6.7. Eastern Europe Generic Drugs Market Analysis, Opportunity and Forecast, By Country , 2016-2032
- 6.7.1. Eastern Europe Generic Drugs Market Analysis by Country : Introduction
- 6.7.2. Market Size Absolute $ Opportunity Analysis and Forecast, Country , 2016-2032
- 6.7.2.1. Russia
- 6.7.2.2. Poland
- 6.7.2.3. The Czech Republic
- 6.7.2.4. Greece
- 6.7.2.5. Rest of Eastern Europe
- 7. APAC Generic Drugs Market Analysis, Opportunity and Forecast, 2016-2032
- 7.1. APAC Generic Drugs Market Analysis, 2016-2021
- 7.2. APAC Generic Drugs Market Opportunity and Forecast, 2023-2032
- 7.3. APAC Generic Drugs Market Analysis, Opportunity and Forecast, By Type of Drug, 2016-2032
- 7.3.1. APAC Generic Drugs Market Analysis by Type of Drug: Introduction
- 7.3.2. Market Size Absolute $ Opportunity Analysis and Forecast, By Type of Drug, 2016-2032
- 7.3.3. Simple Generics
- 7.3.4. Complex Generics
- 7.3.5. Biosimilars
- 7.4. APAC Generic Drugs Market Analysis, Opportunity and Forecast, By Therapeutic Area, 2016-2032
- 7.4.1. APAC Generic Drugs Market Analysis by Therapeutic Area: Introduction
- 7.4.2. Market Size Absolute $ Opportunity Analysis and Forecast, By Therapeutic Area, 2016-2032
- 7.4.3. Cardiovascular
- 7.4.4. Central Nervous System
- 7.4.5. Oncology
- 7.4.6. Diabetes
- 7.4.7. Immunology
- 7.4.8. Respiratory
- 7.4.9. Others
- 7.5. APAC Generic Drugs Market Analysis, Opportunity and Forecast, By Route of Administration, 2016-2032
- 7.5.1. APAC Generic Drugs Market Analysis by Route of Administration: Introduction
- 7.5.2. Market Size Absolute $ Opportunity Analysis and Forecast, By Route of Administration, 2016-2032
- 7.5.3. Oral
- 7.5.4. Parenteral (Injectable)
- 7.5.5. Topical
- 7.5.6. Others
- 7.6. APAC Generic Drugs Market Analysis, Opportunity and Forecast, By Distribution Channel, 2016-2032
- 7.6.1. APAC Generic Drugs Market Analysis by Distribution Channel: Introduction
- 7.6.2. Market Size Absolute $ Opportunity Analysis and Forecast, By Distribution Channel, 2016-2032
- 7.6.3. Retail Pharmacies
- 7.6.4. Hospital Pharmacies
- 7.6.5. Online Pharmacies
- 7.6.6. Others
- 7.7. APAC Generic Drugs Market Analysis, Opportunity and Forecast, By Country , 2016-2032
- 7.7.1. APAC Generic Drugs Market Analysis by Country : Introduction
- 7.7.2. Market Size Absolute $ Opportunity Analysis and Forecast, Country , 2016-2032
- 7.7.2.1. China
- 7.7.2.2. Japan
- 7.7.2.3. South Korea
- 7.7.2.4. India
- 7.7.2.5. Australia & New Zeland
- 7.7.2.6. Indonesia
- 7.7.2.7. Malaysia
- 7.7.2.8. Philippines
- 7.7.2.9. Singapore
- 7.7.2.10. Thailand
- 7.7.2.11. Vietnam
- 7.7.2.12. Rest of APAC
- 8. Latin America Generic Drugs Market Analysis, Opportunity and Forecast, 2016-2032
- 8.1. Latin America Generic Drugs Market Analysis, 2016-2021
- 8.2. Latin America Generic Drugs Market Opportunity and Forecast, 2023-2032
- 8.3. Latin America Generic Drugs Market Analysis, Opportunity and Forecast, By Type of Drug, 2016-2032
- 8.3.1. Latin America Generic Drugs Market Analysis by Type of Drug: Introduction
- 8.3.2. Market Size Absolute $ Opportunity Analysis and Forecast, By Type of Drug, 2016-2032
- 8.3.3. Simple Generics
- 8.3.4. Complex Generics
- 8.3.5. Biosimilars
- 8.4. Latin America Generic Drugs Market Analysis, Opportunity and Forecast, By Therapeutic Area, 2016-2032
- 8.4.1. Latin America Generic Drugs Market Analysis by Therapeutic Area: Introduction
- 8.4.2. Market Size Absolute $ Opportunity Analysis and Forecast, By Therapeutic Area, 2016-2032
- 8.4.3. Cardiovascular
- 8.4.4. Central Nervous System
- 8.4.5. Oncology
- 8.4.6. Diabetes
- 8.4.7. Immunology
- 8.4.8. Respiratory
- 8.4.9. Others
- 8.5. Latin America Generic Drugs Market Analysis, Opportunity and Forecast, By Route of Administration, 2016-2032
- 8.5.1. Latin America Generic Drugs Market Analysis by Route of Administration: Introduction
- 8.5.2. Market Size Absolute $ Opportunity Analysis and Forecast, By Route of Administration, 2016-2032
- 8.5.3. Oral
- 8.5.4. Parenteral (Injectable)
- 8.5.5. Topical
- 8.5.6. Others
- 8.6. Latin America Generic Drugs Market Analysis, Opportunity and Forecast, By Distribution Channel, 2016-2032
- 8.6.1. Latin America Generic Drugs Market Analysis by Distribution Channel: Introduction
- 8.6.2. Market Size Absolute $ Opportunity Analysis and Forecast, By Distribution Channel, 2016-2032
- 8.6.3. Retail Pharmacies
- 8.6.4. Hospital Pharmacies
- 8.6.5. Online Pharmacies
- 8.6.6. Others
- 8.7. Latin America Generic Drugs Market Analysis, Opportunity and Forecast, By Country , 2016-2032
- 8.7.1. Latin America Generic Drugs Market Analysis by Country : Introduction
- 8.7.2. Market Size Absolute $ Opportunity Analysis and Forecast, Country , 2016-2032
- 8.7.2.1. Brazil
- 8.7.2.2. Colombia
- 8.7.2.3. Chile
- 8.7.2.4. Argentina
- 8.7.2.5. Costa Rica
- 8.7.2.6. Rest of Latin America
- 9. Middle East & Africa Generic Drugs Market Analysis, Opportunity and Forecast, 2016-2032
- 9.1. Middle East & Africa Generic Drugs Market Analysis, 2016-2021
- 9.2. Middle East & Africa Generic Drugs Market Opportunity and Forecast, 2023-2032
- 9.3. Middle East & Africa Generic Drugs Market Analysis, Opportunity and Forecast, By Type of Drug, 2016-2032
- 9.3.1. Middle East & Africa Generic Drugs Market Analysis by Type of Drug: Introduction
- 9.3.2. Market Size Absolute $ Opportunity Analysis and Forecast, By Type of Drug, 2016-2032
- 9.3.3. Simple Generics
- 9.3.4. Complex Generics
- 9.3.5. Biosimilars
- 9.4. Middle East & Africa Generic Drugs Market Analysis, Opportunity and Forecast, By Therapeutic Area, 2016-2032
- 9.4.1. Middle East & Africa Generic Drugs Market Analysis by Therapeutic Area: Introduction
- 9.4.2. Market Size Absolute $ Opportunity Analysis and Forecast, By Therapeutic Area, 2016-2032
- 9.4.3. Cardiovascular
- 9.4.4. Central Nervous System
- 9.4.5. Oncology
- 9.4.6. Diabetes
- 9.4.7. Immunology
- 9.4.8. Respiratory
- 9.4.9. Others
- 9.5. Middle East & Africa Generic Drugs Market Analysis, Opportunity and Forecast, By Route of Administration, 2016-2032
- 9.5.1. Middle East & Africa Generic Drugs Market Analysis by Route of Administration: Introduction
- 9.5.2. Market Size Absolute $ Opportunity Analysis and Forecast, By Route of Administration, 2016-2032
- 9.5.3. Oral
- 9.5.4. Parenteral (Injectable)
- 9.5.5. Topical
- 9.5.6. Others
- 9.6. Middle East & Africa Generic Drugs Market Analysis, Opportunity and Forecast, By Distribution Channel, 2016-2032
- 9.6.1. Middle East & Africa Generic Drugs Market Analysis by Distribution Channel: Introduction
- 9.6.2. Market Size Absolute $ Opportunity Analysis and Forecast, By Distribution Channel, 2016-2032
- 9.6.3. Retail Pharmacies
- 9.6.4. Hospital Pharmacies
- 9.6.5. Online Pharmacies
- 9.6.6. Others
- 9.7. Middle East & Africa Generic Drugs Market Analysis, Opportunity and Forecast, By Country , 2016-2032
- 9.7.1. Middle East & Africa Generic Drugs Market Analysis by Country : Introduction
- 9.7.2. Market Size Absolute $ Opportunity Analysis and Forecast, Country , 2016-2032
- 9.7.2.1. Algeria
- 9.7.2.2. Egypt
- 9.7.2.3. Israel
- 9.7.2.4. Kuwait
- 9.7.2.5. Nigeria
- 9.7.2.6. Saudi Arabia
- 9.7.2.7. South Africa
- 9.7.2.8. Turkey
- 9.7.2.9. The UAE
- 9.7.2.10. Rest of MEA
- 10. Global Generic Drugs Market Analysis, Opportunity and Forecast, By Region , 2016-2032
- 10.1. Global Generic Drugs Market Analysis by Region : Introduction
- 10.2. Market Size Absolute $ Opportunity Analysis and Forecast, By Region , 2016-2032
- 10.2.1. North America
- 10.2.2. Western Europe
- 10.2.3. Eastern Europe
- 10.2.4. APAC
- 10.2.5. Latin America
- 10.2.6. Middle East & Africa
- 11. Global Generic Drugs Market Competitive Landscape, Market Share Analysis, and Company Profiles
- 11.1. Market Share Analysis
- 11.2. Company Profiles
- 11.3. Teva Pharmaceutical Industries Ltd.
- 11.3.1. Company Overview
- 11.3.2. Financial Highlights
- 11.3.3. Product Portfolio
- 11.3.4. SWOT Analysis
- 11.3.5. Key Strategies and Developments
- 11.4. Sandoz (a Novartis division)
- 11.4.1. Company Overview
- 11.4.2. Financial Highlights
- 11.4.3. Product Portfolio
- 11.4.4. SWOT Analysis
- 11.4.5. Key Strategies and Developments
- 11.5. Mylan N.V. (part of Viatris)
- 11.5.1. Company Overview
- 11.5.2. Financial Highlights
- 11.5.3. Product Portfolio
- 11.5.4. SWOT Analysis
- 11.5.5. Key Strategies and Developments
- 11.6. Pfizer Inc.
- 11.6.1. Company Overview
- 11.6.2. Financial Highlights
- 11.6.3. Product Portfolio
- 11.6.4. SWOT Analysis
- 11.6.5. Key Strategies and Developments
- 11.7. Sun Pharmaceutical Industries Ltd.
- 11.7.1. Company Overview
- 11.7.2. Financial Highlights
- 11.7.3. Product Portfolio
- 11.7.4. SWOT Analysis
- 11.7.5. Key Strategies and Developments
- 11.8. Fresenius Kabi AG
- 11.8.1. Company Overview
- 11.8.2. Financial Highlights
- 11.8.3. Product Portfolio
- 11.8.4. SWOT Analysis
- 11.8.5. Key Strategies and Developments
- 11.9. Lupin Limited
- 11.9.1. Company Overview
- 11.9.2. Financial Highlights
- 11.9.3. Product Portfolio
- 11.9.4. SWOT Analysis
- 11.9.5. Key Strategies and Developments
- 11.10. Dr. Reddy's Laboratories Ltd.
- 11.10.1. Company Overview
- 11.10.2. Financial Highlights
- 11.10.3. Product Portfolio
- 11.10.4. SWOT Analysis
- 11.10.5. Key Strategies and Developments
- 11.11. Cipla Ltd.
- 11.11.1. Company Overview
- 11.11.2. Financial Highlights
- 11.11.3. Product Portfolio
- 11.11.4. SWOT Analysis
- 11.11.5. Key Strategies and Developments
- 11.12. Aurobindo Pharma Ltd.
- 11.12.1. Company Overview
- 11.12.2. Financial Highlights
- 11.12.3. Product Portfolio
- 11.12.4. SWOT Analysis
- 11.12.5. Key Strategies and Developments
- 11.13.1. Company Overview
- 11.13.2. Financial Highlights
- 11.13.3. Product Portfolio
- 11.13.4. SWOT Analysis
- 11.13.5. Key Strategies and Developments
- 11.14. Stada Arzneimittel AG
- 11.14.1. Company Overview
- 11.14.2. Financial Highlights
- 11.14.3. Product Portfolio
- 11.14.4. SWOT Analysis
- 11.14.5. Key Strategies and Developments
- 11.15. Endo International plc
- 11.15.1. Company Overview
- 11.15.2. Financial Highlights
- 11.15.3. Product Portfolio
- 11.15.4. SWOT Analysis
- 11.15.5. Key Strategies and Developments
- 11.16. Torrent Pharmaceuticals Ltd.
- 11.16.1. Company Overview
- 11.16.2. Financial Highlights
- 11.16.3. Product Portfolio
- 11.16.4. SWOT Analysis
- 11.16.5. Key Strategies and Developments
- 11.17. Zydus Cadila
- 11.17.1. Company Overview
- 11.17.2. Financial Highlights
- 11.17.3. Product Portfolio
- 11.17.4. SWOT Analysis
- 11.17.5. Key Strategies and Developments
- 12. Assumptions and Acronyms
- 13. Research Methodology
- 14. Contact
- List of Figures
- Figure 1: Global Generic Drugs Market Revenue (US$ Mn) Market Share by Type of Drug in 2022
- Figure 2: Global Generic Drugs Market Attractiveness Analysis by Type of Drug, 2016-2032
- Figure 3: Global Generic Drugs Market Revenue (US$ Mn) Market Share by Therapeutic Areain 2022
- Figure 4: Global Generic Drugs Market Attractiveness Analysis by Therapeutic Area, 2016-2032
- Figure 5: Global Generic Drugs Market Revenue (US$ Mn) Market Share by Route of Administrationin 2022
- Figure 6: Global Generic Drugs Market Attractiveness Analysis by Route of Administration, 2016-2032
- Figure 7: Global Generic Drugs Market Revenue (US$ Mn) Market Share by Distribution Channelin 2022
- Figure 8: Global Generic Drugs Market Attractiveness Analysis by Distribution Channel, 2016-2032
- Figure 9: Global Generic Drugs Market Revenue (US$ Mn) Market Share by Region in 2022
- Figure 10: Global Generic Drugs Market Attractiveness Analysis by Region, 2016-2032
- Figure 11: Global Generic Drugs Market Revenue (US$ Mn) (2016-2032)
- Figure 12: Global Generic Drugs Market Revenue (US$ Mn) Comparison by Region (2016-2032)
- Figure 13: Global Generic Drugs Market Revenue (US$ Mn) Comparison by Type of Drug (2016-2032)
- Figure 14: Global Generic Drugs Market Revenue (US$ Mn) Comparison by Therapeutic Area (2016-2032)
- Figure 15: Global Generic Drugs Market Revenue (US$ Mn) Comparison by Route of Administration (2016-2032)
- Figure 16: Global Generic Drugs Market Revenue (US$ Mn) Comparison by Distribution Channel (2016-2032)
- Figure 17: Global Generic Drugs Market Y-o-Y Growth Rate Comparison by Region (2016-2032)
- Figure 18: Global Generic Drugs Market Y-o-Y Growth Rate Comparison by Type of Drug (2016-2032)
- Figure 19: Global Generic Drugs Market Y-o-Y Growth Rate Comparison by Therapeutic Area (2016-2032)
- Figure 20: Global Generic Drugs Market Y-o-Y Growth Rate Comparison by Route of Administration (2016-2032)
- Figure 21: Global Generic Drugs Market Y-o-Y Growth Rate Comparison by Distribution Channel (2016-2032)
- Figure 22: Global Generic Drugs Market Share Comparison by Region (2016-2032)
- Figure 23: Global Generic Drugs Market Share Comparison by Type of Drug (2016-2032)
- Figure 24: Global Generic Drugs Market Share Comparison by Therapeutic Area (2016-2032)
- Figure 25: Global Generic Drugs Market Share Comparison by Route of Administration (2016-2032)
- Figure 26: Global Generic Drugs Market Share Comparison by Distribution Channel (2016-2032)
- Figure 27: North America Generic Drugs Market Revenue (US$ Mn) Market Share by Type of Drugin 2022
- Figure 28: North America Generic Drugs Market Attractiveness Analysis by Type of Drug, 2016-2032
- Figure 29: North America Generic Drugs Market Revenue (US$ Mn) Market Share by Therapeutic Areain 2022
- Figure 30: North America Generic Drugs Market Attractiveness Analysis by Therapeutic Area, 2016-2032
- Figure 31: North America Generic Drugs Market Revenue (US$ Mn) Market Share by Route of Administrationin 2022
- Figure 32: North America Generic Drugs Market Attractiveness Analysis by Route of Administration, 2016-2032
- Figure 33: North America Generic Drugs Market Revenue (US$ Mn) Market Share by Distribution Channelin 2022
- Figure 34: North America Generic Drugs Market Attractiveness Analysis by Distribution Channel, 2016-2032
- Figure 35: North America Generic Drugs Market Revenue (US$ Mn) Market Share by Country in 2022
- Figure 36: North America Generic Drugs Market Attractiveness Analysis by Country, 2016-2032
- Figure 37: North America Generic Drugs Market Revenue (US$ Mn) (2016-2032)
- Figure 38: North America Generic Drugs Market Revenue (US$ Mn) Comparison by Country (2016-2032)
- Figure 39: North America Generic Drugs Market Revenue (US$ Mn) Comparison by Type of Drug (2016-2032)
- Figure 40: North America Generic Drugs Market Revenue (US$ Mn) Comparison by Therapeutic Area (2016-2032)
- Figure 41: North America Generic Drugs Market Revenue (US$ Mn) Comparison by Route of Administration (2016-2032)
- Figure 42: North America Generic Drugs Market Revenue (US$ Mn) Comparison by Distribution Channel (2016-2032)
- Figure 43: North America Generic Drugs Market Y-o-Y Growth Rate Comparison by Country (2016-2032)
- Figure 44: North America Generic Drugs Market Y-o-Y Growth Rate Comparison by Type of Drug (2016-2032)
- Figure 45: North America Generic Drugs Market Y-o-Y Growth Rate Comparison by Therapeutic Area (2016-2032)
- Figure 46: North America Generic Drugs Market Y-o-Y Growth Rate Comparison by Route of Administration (2016-2032)
- Figure 47: North America Generic Drugs Market Y-o-Y Growth Rate Comparison by Distribution Channel (2016-2032)
- Figure 48: North America Generic Drugs Market Share Comparison by Country (2016-2032)
- Figure 49: North America Generic Drugs Market Share Comparison by Type of Drug (2016-2032)
- Figure 50: North America Generic Drugs Market Share Comparison by Therapeutic Area (2016-2032)
- Figure 51: North America Generic Drugs Market Share Comparison by Route of Administration (2016-2032)
- Figure 52: North America Generic Drugs Market Share Comparison by Distribution Channel (2016-2032)
- Figure 53: Western Europe Generic Drugs Market Revenue (US$ Mn) Market Share by Type of Drugin 2022
- Figure 54: Western Europe Generic Drugs Market Attractiveness Analysis by Type of Drug, 2016-2032
- Figure 55: Western Europe Generic Drugs Market Revenue (US$ Mn) Market Share by Therapeutic Areain 2022
- Figure 56: Western Europe Generic Drugs Market Attractiveness Analysis by Therapeutic Area, 2016-2032
- Figure 57: Western Europe Generic Drugs Market Revenue (US$ Mn) Market Share by Route of Administrationin 2022
- Figure 58: Western Europe Generic Drugs Market Attractiveness Analysis by Route of Administration, 2016-2032
- Figure 59: Western Europe Generic Drugs Market Revenue (US$ Mn) Market Share by Distribution Channelin 2022
- Figure 60: Western Europe Generic Drugs Market Attractiveness Analysis by Distribution Channel, 2016-2032
- Figure 61: Western Europe Generic Drugs Market Revenue (US$ Mn) Market Share by Country in 2022
- Figure 62: Western Europe Generic Drugs Market Attractiveness Analysis by Country, 2016-2032
- Figure 63: Western Europe Generic Drugs Market Revenue (US$ Mn) (2016-2032)
- Figure 64: Western Europe Generic Drugs Market Revenue (US$ Mn) Comparison by Country (2016-2032)
- Figure 65: Western Europe Generic Drugs Market Revenue (US$ Mn) Comparison by Type of Drug (2016-2032)
- Figure 66: Western Europe Generic Drugs Market Revenue (US$ Mn) Comparison by Therapeutic Area (2016-2032)
- Figure 67: Western Europe Generic Drugs Market Revenue (US$ Mn) Comparison by Route of Administration (2016-2032)
- Figure 68: Western Europe Generic Drugs Market Revenue (US$ Mn) Comparison by Distribution Channel (2016-2032)
- Figure 69: Western Europe Generic Drugs Market Y-o-Y Growth Rate Comparison by Country (2016-2032)
- Figure 70: Western Europe Generic Drugs Market Y-o-Y Growth Rate Comparison by Type of Drug (2016-2032)
- Figure 71: Western Europe Generic Drugs Market Y-o-Y Growth Rate Comparison by Therapeutic Area (2016-2032)
- Figure 72: Western Europe Generic Drugs Market Y-o-Y Growth Rate Comparison by Route of Administration (2016-2032)
- Figure 73: Western Europe Generic Drugs Market Y-o-Y Growth Rate Comparison by Distribution Channel (2016-2032)
- Figure 74: Western Europe Generic Drugs Market Share Comparison by Country (2016-2032)
- Figure 75: Western Europe Generic Drugs Market Share Comparison by Type of Drug (2016-2032)
- Figure 76: Western Europe Generic Drugs Market Share Comparison by Therapeutic Area (2016-2032)
- Figure 77: Western Europe Generic Drugs Market Share Comparison by Route of Administration (2016-2032)
- Figure 78: Western Europe Generic Drugs Market Share Comparison by Distribution Channel (2016-2032)
- Figure 79: Eastern Europe Generic Drugs Market Revenue (US$ Mn) Market Share by Type of Drugin 2022
- Figure 80: Eastern Europe Generic Drugs Market Attractiveness Analysis by Type of Drug, 2016-2032
- Figure 81: Eastern Europe Generic Drugs Market Revenue (US$ Mn) Market Share by Therapeutic Areain 2022
- Figure 82: Eastern Europe Generic Drugs Market Attractiveness Analysis by Therapeutic Area, 2016-2032
- Figure 83: Eastern Europe Generic Drugs Market Revenue (US$ Mn) Market Share by Route of Administrationin 2022
- Figure 84: Eastern Europe Generic Drugs Market Attractiveness Analysis by Route of Administration, 2016-2032
- Figure 85: Eastern Europe Generic Drugs Market Revenue (US$ Mn) Market Share by Distribution Channelin 2022
- Figure 86: Eastern Europe Generic Drugs Market Attractiveness Analysis by Distribution Channel, 2016-2032
- Figure 87: Eastern Europe Generic Drugs Market Revenue (US$ Mn) Market Share by Country in 2022
- Figure 88: Eastern Europe Generic Drugs Market Attractiveness Analysis by Country, 2016-2032
- Figure 89: Eastern Europe Generic Drugs Market Revenue (US$ Mn) (2016-2032)
- Figure 90: Eastern Europe Generic Drugs Market Revenue (US$ Mn) Comparison by Country (2016-2032)
- Figure 91: Eastern Europe Generic Drugs Market Revenue (US$ Mn) Comparison by Type of Drug (2016-2032)
- Figure 92: Eastern Europe Generic Drugs Market Revenue (US$ Mn) Comparison by Therapeutic Area (2016-2032)
- Figure 93: Eastern Europe Generic Drugs Market Revenue (US$ Mn) Comparison by Route of Administration (2016-2032)
- Figure 94: Eastern Europe Generic Drugs Market Revenue (US$ Mn) Comparison by Distribution Channel (2016-2032)
- Figure 95: Eastern Europe Generic Drugs Market Y-o-Y Growth Rate Comparison by Country (2016-2032)
- Figure 96: Eastern Europe Generic Drugs Market Y-o-Y Growth Rate Comparison by Type of Drug (2016-2032)
- Figure 97: Eastern Europe Generic Drugs Market Y-o-Y Growth Rate Comparison by Therapeutic Area (2016-2032)
- Figure 98: Eastern Europe Generic Drugs Market Y-o-Y Growth Rate Comparison by Route of Administration (2016-2032)
- Figure 99: Eastern Europe Generic Drugs Market Y-o-Y Growth Rate Comparison by Distribution Channel (2016-2032)
- Figure 100: Eastern Europe Generic Drugs Market Share Comparison by Country (2016-2032)
- Figure 101: Eastern Europe Generic Drugs Market Share Comparison by Type of Drug (2016-2032)
- Figure 102: Eastern Europe Generic Drugs Market Share Comparison by Therapeutic Area (2016-2032)
- Figure 103: Eastern Europe Generic Drugs Market Share Comparison by Route of Administration (2016-2032)
- Figure 104: Eastern Europe Generic Drugs Market Share Comparison by Distribution Channel (2016-2032)
- Figure 105: APAC Generic Drugs Market Revenue (US$ Mn) Market Share by Type of Drugin 2022
- Figure 106: APAC Generic Drugs Market Attractiveness Analysis by Type of Drug, 2016-2032
- Figure 107: APAC Generic Drugs Market Revenue (US$ Mn) Market Share by Therapeutic Areain 2022
- Figure 108: APAC Generic Drugs Market Attractiveness Analysis by Therapeutic Area, 2016-2032
- Figure 109: APAC Generic Drugs Market Revenue (US$ Mn) Market Share by Route of Administrationin 2022
- Figure 110: APAC Generic Drugs Market Attractiveness Analysis by Route of Administration, 2016-2032
- Figure 111: APAC Generic Drugs Market Revenue (US$ Mn) Market Share by Distribution Channelin 2022
- Figure 112: APAC Generic Drugs Market Attractiveness Analysis by Distribution Channel, 2016-2032
- Figure 113: APAC Generic Drugs Market Revenue (US$ Mn) Market Share by Country in 2022
- Figure 114: APAC Generic Drugs Market Attractiveness Analysis by Country, 2016-2032
- Figure 115: APAC Generic Drugs Market Revenue (US$ Mn) (2016-2032)
- Figure 116: APAC Generic Drugs Market Revenue (US$ Mn) Comparison by Country (2016-2032)
- Figure 117: APAC Generic Drugs Market Revenue (US$ Mn) Comparison by Type of Drug (2016-2032)
- Figure 118: APAC Generic Drugs Market Revenue (US$ Mn) Comparison by Therapeutic Area (2016-2032)
- Figure 119: APAC Generic Drugs Market Revenue (US$ Mn) Comparison by Route of Administration (2016-2032)
- Figure 120: APAC Generic Drugs Market Revenue (US$ Mn) Comparison by Distribution Channel (2016-2032)
- Figure 121: APAC Generic Drugs Market Y-o-Y Growth Rate Comparison by Country (2016-2032)
- Figure 122: APAC Generic Drugs Market Y-o-Y Growth Rate Comparison by Type of Drug (2016-2032)
- Figure 123: APAC Generic Drugs Market Y-o-Y Growth Rate Comparison by Therapeutic Area (2016-2032)
- Figure 124: APAC Generic Drugs Market Y-o-Y Growth Rate Comparison by Route of Administration (2016-2032)
- Figure 125: APAC Generic Drugs Market Y-o-Y Growth Rate Comparison by Distribution Channel (2016-2032)
- Figure 126: APAC Generic Drugs Market Share Comparison by Country (2016-2032)
- Figure 127: APAC Generic Drugs Market Share Comparison by Type of Drug (2016-2032)
- Figure 128: APAC Generic Drugs Market Share Comparison by Therapeutic Area (2016-2032)
- Figure 129: APAC Generic Drugs Market Share Comparison by Route of Administration (2016-2032)
- Figure 130: APAC Generic Drugs Market Share Comparison by Distribution Channel (2016-2032)
- Figure 131: Latin America Generic Drugs Market Revenue (US$ Mn) Market Share by Type of Drugin 2022
- Figure 132: Latin America Generic Drugs Market Attractiveness Analysis by Type of Drug, 2016-2032
- Figure 133: Latin America Generic Drugs Market Revenue (US$ Mn) Market Share by Therapeutic Areain 2022
- Figure 134: Latin America Generic Drugs Market Attractiveness Analysis by Therapeutic Area, 2016-2032
- Figure 135: Latin America Generic Drugs Market Revenue (US$ Mn) Market Share by Route of Administrationin 2022
- Figure 136: Latin America Generic Drugs Market Attractiveness Analysis by Route of Administration, 2016-2032
- Figure 137: Latin America Generic Drugs Market Revenue (US$ Mn) Market Share by Distribution Channelin 2022
- Figure 138: Latin America Generic Drugs Market Attractiveness Analysis by Distribution Channel, 2016-2032
- Figure 139: Latin America Generic Drugs Market Revenue (US$ Mn) Market Share by Country in 2022
- Figure 140: Latin America Generic Drugs Market Attractiveness Analysis by Country, 2016-2032
- Figure 141: Latin America Generic Drugs Market Revenue (US$ Mn) (2016-2032)
- Figure 142: Latin America Generic Drugs Market Revenue (US$ Mn) Comparison by Country (2016-2032)
- Figure 143: Latin America Generic Drugs Market Revenue (US$ Mn) Comparison by Type of Drug (2016-2032)
- Figure 144: Latin America Generic Drugs Market Revenue (US$ Mn) Comparison by Therapeutic Area (2016-2032)
- Figure 145: Latin America Generic Drugs Market Revenue (US$ Mn) Comparison by Route of Administration (2016-2032)
- Figure 146: Latin America Generic Drugs Market Revenue (US$ Mn) Comparison by Distribution Channel (2016-2032)
- Figure 147: Latin America Generic Drugs Market Y-o-Y Growth Rate Comparison by Country (2016-2032)
- Figure 148: Latin America Generic Drugs Market Y-o-Y Growth Rate Comparison by Type of Drug (2016-2032)
- Figure 149: Latin America Generic Drugs Market Y-o-Y Growth Rate Comparison by Therapeutic Area (2016-2032)
- Figure 150: Latin America Generic Drugs Market Y-o-Y Growth Rate Comparison by Route of Administration (2016-2032)
- Figure 151: Latin America Generic Drugs Market Y-o-Y Growth Rate Comparison by Distribution Channel (2016-2032)
- Figure 152: Latin America Generic Drugs Market Share Comparison by Country (2016-2032)
- Figure 153: Latin America Generic Drugs Market Share Comparison by Type of Drug (2016-2032)
- Figure 154: Latin America Generic Drugs Market Share Comparison by Therapeutic Area (2016-2032)
- Figure 155: Latin America Generic Drugs Market Share Comparison by Route of Administration (2016-2032)
- Figure 156: Latin America Generic Drugs Market Share Comparison by Distribution Channel (2016-2032)
- Figure 157: Middle East & Africa Generic Drugs Market Revenue (US$ Mn) Market Share by Type of Drugin 2022
- Figure 158: Middle East & Africa Generic Drugs Market Attractiveness Analysis by Type of Drug, 2016-2032
- Figure 159: Middle East & Africa Generic Drugs Market Revenue (US$ Mn) Market Share by Therapeutic Areain 2022
- Figure 160: Middle East & Africa Generic Drugs Market Attractiveness Analysis by Therapeutic Area, 2016-2032
- Figure 161: Middle East & Africa Generic Drugs Market Revenue (US$ Mn) Market Share by Route of Administrationin 2022
- Figure 162: Middle East & Africa Generic Drugs Market Attractiveness Analysis by Route of Administration, 2016-2032
- Figure 163: Middle East & Africa Generic Drugs Market Revenue (US$ Mn) Market Share by Distribution Channelin 2022
- Figure 164: Middle East & Africa Generic Drugs Market Attractiveness Analysis by Distribution Channel, 2016-2032
- Figure 165: Middle East & Africa Generic Drugs Market Revenue (US$ Mn) Market Share by Country in 2022
- Figure 166: Middle East & Africa Generic Drugs Market Attractiveness Analysis by Country, 2016-2032
- Figure 167: Middle East & Africa Generic Drugs Market Revenue (US$ Mn) (2016-2032)
- Figure 168: Middle East & Africa Generic Drugs Market Revenue (US$ Mn) Comparison by Country (2016-2032)
- Figure 169: Middle East & Africa Generic Drugs Market Revenue (US$ Mn) Comparison by Type of Drug (2016-2032)
- Figure 170: Middle East & Africa Generic Drugs Market Revenue (US$ Mn) Comparison by Therapeutic Area (2016-2032)
- Figure 171: Middle East & Africa Generic Drugs Market Revenue (US$ Mn) Comparison by Route of Administration (2016-2032)
- Figure 172: Middle East & Africa Generic Drugs Market Revenue (US$ Mn) Comparison by Distribution Channel (2016-2032)
- Figure 173: Middle East & Africa Generic Drugs Market Y-o-Y Growth Rate Comparison by Country (2016-2032)
- Figure 174: Middle East & Africa Generic Drugs Market Y-o-Y Growth Rate Comparison by Type of Drug (2016-2032)
- Figure 175: Middle East & Africa Generic Drugs Market Y-o-Y Growth Rate Comparison by Therapeutic Area (2016-2032)
- Figure 176: Middle East & Africa Generic Drugs Market Y-o-Y Growth Rate Comparison by Route of Administration (2016-2032)
- Figure 177: Middle East & Africa Generic Drugs Market Y-o-Y Growth Rate Comparison by Distribution Channel (2016-2032)
- Figure 178: Middle East & Africa Generic Drugs Market Share Comparison by Country (2016-2032)
- Figure 179: Middle East & Africa Generic Drugs Market Share Comparison by Type of Drug (2016-2032)
- Figure 180: Middle East & Africa Generic Drugs Market Share Comparison by Therapeutic Area (2016-2032)
- Figure 181: Middle East & Africa Generic Drugs Market Share Comparison by Route of Administration (2016-2032)
- Figure 182: Middle East & Africa Generic Drugs Market Share Comparison by Distribution Channel (2016-2032)
- List of Tables
- Table 1: Global Generic Drugs Market Comparison by Type of Drug (2016-2032)
- Table 2: Global Generic Drugs Market Comparison by Therapeutic Area (2016-2032)
- Table 3: Global Generic Drugs Market Comparison by Route of Administration (2016-2032)
- Table 4: Global Generic Drugs Market Comparison by Distribution Channel (2016-2032)
- Table 5: Global Generic Drugs Market Revenue (US$ Mn) Comparison by Region (2016-2032)
- Table 6: Global Generic Drugs Market Revenue (US$ Mn) (2016-2032)
- Table 7: Global Generic Drugs Market Revenue (US$ Mn) Comparison by Region (2016-2032)
- Table 8: Global Generic Drugs Market Revenue (US$ Mn) Comparison by Type of Drug (2016-2032)
- Table 9: Global Generic Drugs Market Revenue (US$ Mn) Comparison by Therapeutic Area (2016-2032)
- Table 10: Global Generic Drugs Market Revenue (US$ Mn) Comparison by Route of Administration (2016-2032)
- Table 11: Global Generic Drugs Market Revenue (US$ Mn) Comparison by Distribution Channel (2016-2032)
- Table 12: Global Generic Drugs Market Y-o-Y Growth Rate Comparison by Region (2016-2032)
- Table 13: Global Generic Drugs Market Y-o-Y Growth Rate Comparison by Type of Drug (2016-2032)
- Table 14: Global Generic Drugs Market Y-o-Y Growth Rate Comparison by Therapeutic Area (2016-2032)
- Table 15: Global Generic Drugs Market Y-o-Y Growth Rate Comparison by Route of Administration (2016-2032)
- Table 16: Global Generic Drugs Market Y-o-Y Growth Rate Comparison by Distribution Channel (2016-2032)
- Table 17: Global Generic Drugs Market Share Comparison by Region (2016-2032)
- Table 18: Global Generic Drugs Market Share Comparison by Type of Drug (2016-2032)
- Table 19: Global Generic Drugs Market Share Comparison by Therapeutic Area (2016-2032)
- Table 20: Global Generic Drugs Market Share Comparison by Route of Administration (2016-2032)
- Table 21: Global Generic Drugs Market Share Comparison by Distribution Channel (2016-2032)
- Table 22: North America Generic Drugs Market Comparison by Therapeutic Area (2016-2032)
- Table 23: North America Generic Drugs Market Comparison by Route of Administration (2016-2032)
- Table 24: North America Generic Drugs Market Comparison by Distribution Channel (2016-2032)
- Table 25: North America Generic Drugs Market Revenue (US$ Mn) Comparison by Country (2016-2032)
- Table 26: North America Generic Drugs Market Revenue (US$ Mn) (2016-2032)
- Table 27: North America Generic Drugs Market Revenue (US$ Mn) Comparison by Country (2016-2032)
- Table 28: North America Generic Drugs Market Revenue (US$ Mn) Comparison by Type of Drug (2016-2032)
- Table 29: North America Generic Drugs Market Revenue (US$ Mn) Comparison by Therapeutic Area (2016-2032)
- Table 30: North America Generic Drugs Market Revenue (US$ Mn) Comparison by Route of Administration (2016-2032)
- Table 31: North America Generic Drugs Market Revenue (US$ Mn) Comparison by Distribution Channel (2016-2032)
- Table 32: North America Generic Drugs Market Y-o-Y Growth Rate Comparison by Country (2016-2032)
- Table 33: North America Generic Drugs Market Y-o-Y Growth Rate Comparison by Type of Drug (2016-2032)
- Table 34: North America Generic Drugs Market Y-o-Y Growth Rate Comparison by Therapeutic Area (2016-2032)
- Table 35: North America Generic Drugs Market Y-o-Y Growth Rate Comparison by Route of Administration (2016-2032)
- Table 36: North America Generic Drugs Market Y-o-Y Growth Rate Comparison by Distribution Channel (2016-2032)
- Table 37: North America Generic Drugs Market Share Comparison by Country (2016-2032)
- Table 38: North America Generic Drugs Market Share Comparison by Type of Drug (2016-2032)
- Table 39: North America Generic Drugs Market Share Comparison by Therapeutic Area (2016-2032)
- Table 40: North America Generic Drugs Market Share Comparison by Route of Administration (2016-2032)
- Table 41: North America Generic Drugs Market Share Comparison by Distribution Channel (2016-2032)
- Table 42: Western Europe Generic Drugs Market Comparison by Type of Drug (2016-2032)
- Table 43: Western Europe Generic Drugs Market Comparison by Therapeutic Area (2016-2032)
- Table 44: Western Europe Generic Drugs Market Comparison by Route of Administration (2016-2032)
- Table 45: Western Europe Generic Drugs Market Comparison by Distribution Channel (2016-2032)
- Table 46: Western Europe Generic Drugs Market Revenue (US$ Mn) Comparison by Country (2016-2032)
- Table 47: Western Europe Generic Drugs Market Revenue (US$ Mn) (2016-2032)
- Table 48: Western Europe Generic Drugs Market Revenue (US$ Mn) Comparison by Country (2016-2032)
- Table 49: Western Europe Generic Drugs Market Revenue (US$ Mn) Comparison by Type of Drug (2016-2032)
- Table 50: Western Europe Generic Drugs Market Revenue (US$ Mn) Comparison by Therapeutic Area (2016-2032)
- Table 51: Western Europe Generic Drugs Market Revenue (US$ Mn) Comparison by Route of Administration (2016-2032)
- Table 52: Western Europe Generic Drugs Market Revenue (US$ Mn) Comparison by Distribution Channel (2016-2032)
- Table 53: Western Europe Generic Drugs Market Y-o-Y Growth Rate Comparison by Country (2016-2032)
- Table 54: Western Europe Generic Drugs Market Y-o-Y Growth Rate Comparison by Type of Drug (2016-2032)
- Table 55: Western Europe Generic Drugs Market Y-o-Y Growth Rate Comparison by Therapeutic Area (2016-2032)
- Table 56: Western Europe Generic Drugs Market Y-o-Y Growth Rate Comparison by Route of Administration (2016-2032)
- Table 57: Western Europe Generic Drugs Market Y-o-Y Growth Rate Comparison by Distribution Channel (2016-2032)
- Table 58: Western Europe Generic Drugs Market Share Comparison by Country (2016-2032)
- Table 59: Western Europe Generic Drugs Market Share Comparison by Type of Drug (2016-2032)
- Table 60: Western Europe Generic Drugs Market Share Comparison by Therapeutic Area (2016-2032)
- Table 61: Western Europe Generic Drugs Market Share Comparison by Route of Administration (2016-2032)
- Table 62: Western Europe Generic Drugs Market Share Comparison by Distribution Channel (2016-2032)
- Table 63: Eastern Europe Generic Drugs Market Comparison by Type of Drug (2016-2032)
- Table 64: Eastern Europe Generic Drugs Market Comparison by Therapeutic Area (2016-2032)
- Table 65: Eastern Europe Generic Drugs Market Comparison by Route of Administration (2016-2032)
- Table 66: Eastern Europe Generic Drugs Market Comparison by Distribution Channel (2016-2032)
- Table 67: Eastern Europe Generic Drugs Market Revenue (US$ Mn) Comparison by Country (2016-2032)
- Table 68: Eastern Europe Generic Drugs Market Revenue (US$ Mn) (2016-2032)
- Table 69: Eastern Europe Generic Drugs Market Revenue (US$ Mn) Comparison by Country (2016-2032)
- Table 70: Eastern Europe Generic Drugs Market Revenue (US$ Mn) Comparison by Type of Drug (2016-2032)
- Table 71: Eastern Europe Generic Drugs Market Revenue (US$ Mn) Comparison by Therapeutic Area (2016-2032)
- Table 72: Eastern Europe Generic Drugs Market Revenue (US$ Mn) Comparison by Route of Administration (2016-2032)
- Table 73: Eastern Europe Generic Drugs Market Revenue (US$ Mn) Comparison by Distribution Channel (2016-2032)
- Table 74: Eastern Europe Generic Drugs Market Y-o-Y Growth Rate Comparison by Country (2016-2032)
- Table 75: Eastern Europe Generic Drugs Market Y-o-Y Growth Rate Comparison by Type of Drug (2016-2032)
- Table 76: Eastern Europe Generic Drugs Market Y-o-Y Growth Rate Comparison by Therapeutic Area (2016-2032)
- Table 77: Eastern Europe Generic Drugs Market Y-o-Y Growth Rate Comparison by Route of Administration (2016-2032)
- Table 78: Eastern Europe Generic Drugs Market Y-o-Y Growth Rate Comparison by Distribution Channel (2016-2032)
- Table 79: Eastern Europe Generic Drugs Market Share Comparison by Country (2016-2032)
- Table 80: Eastern Europe Generic Drugs Market Share Comparison by Type of Drug (2016-2032)
- Table 81: Eastern Europe Generic Drugs Market Share Comparison by Therapeutic Area (2016-2032)
- Table 82: Eastern Europe Generic Drugs Market Share Comparison by Route of Administration (2016-2032)
- Table 83: Eastern Europe Generic Drugs Market Share Comparison by Distribution Channel (2016-2032)
- Table 84: APAC Generic Drugs Market Comparison by Type of Drug (2016-2032)
- Table 85: APAC Generic Drugs Market Comparison by Therapeutic Area (2016-2032)
- Table 86: APAC Generic Drugs Market Comparison by Route of Administration (2016-2032)
- Table 87: APAC Generic Drugs Market Comparison by Distribution Channel (2016-2032)
- Table 88: APAC Generic Drugs Market Revenue (US$ Mn) Comparison by Country (2016-2032)
- Table 89: APAC Generic Drugs Market Revenue (US$ Mn) (2016-2032)
- Table 90: APAC Generic Drugs Market Revenue (US$ Mn) Comparison by Country (2016-2032)
- Table 91: APAC Generic Drugs Market Revenue (US$ Mn) Comparison by Type of Drug (2016-2032)
- Table 92: APAC Generic Drugs Market Revenue (US$ Mn) Comparison by Therapeutic Area (2016-2032)
- Table 93: APAC Generic Drugs Market Revenue (US$ Mn) Comparison by Route of Administration (2016-2032)
- Table 94: APAC Generic Drugs Market Revenue (US$ Mn) Comparison by Distribution Channel (2016-2032)
- Table 95: APAC Generic Drugs Market Y-o-Y Growth Rate Comparison by Country (2016-2032)
- Table 96: APAC Generic Drugs Market Y-o-Y Growth Rate Comparison by Type of Drug (2016-2032)
- Table 97: APAC Generic Drugs Market Y-o-Y Growth Rate Comparison by Therapeutic Area (2016-2032)
- Table 98: APAC Generic Drugs Market Y-o-Y Growth Rate Comparison by Route of Administration (2016-2032)
- Table 99: APAC Generic Drugs Market Y-o-Y Growth Rate Comparison by Distribution Channel (2016-2032)
- Table 100: APAC Generic Drugs Market Share Comparison by Country (2016-2032)
- Table 101: APAC Generic Drugs Market Share Comparison by Type of Drug (2016-2032)
- Table 102: APAC Generic Drugs Market Share Comparison by Therapeutic Area (2016-2032)
- Table 103: APAC Generic Drugs Market Share Comparison by Route of Administration (2016-2032)
- Table 104: APAC Generic Drugs Market Share Comparison by Distribution Channel (2016-2032)
- Table 105: Latin America Generic Drugs Market Comparison by Type of Drug (2016-2032)
- Table 106: Latin America Generic Drugs Market Comparison by Therapeutic Area (2016-2032)
- Table 107: Latin America Generic Drugs Market Comparison by Route of Administration (2016-2032)
- Table 108: Latin America Generic Drugs Market Comparison by Distribution Channel (2016-2032)
- Table 109: Latin America Generic Drugs Market Revenue (US$ Mn) Comparison by Country (2016-2032)
- Table 110: Latin America Generic Drugs Market Revenue (US$ Mn) (2016-2032)
- Table 111: Latin America Generic Drugs Market Revenue (US$ Mn) Comparison by Country (2016-2032)
- Table 112: Latin America Generic Drugs Market Revenue (US$ Mn) Comparison by Type of Drug (2016-2032)
- Table 113: Latin America Generic Drugs Market Revenue (US$ Mn) Comparison by Therapeutic Area (2016-2032)
- Table 114: Latin America Generic Drugs Market Revenue (US$ Mn) Comparison by Route of Administration (2016-2032)
- Table 115: Latin America Generic Drugs Market Revenue (US$ Mn) Comparison by Distribution Channel (2016-2032)
- Table 116: Latin America Generic Drugs Market Y-o-Y Growth Rate Comparison by Country (2016-2032)
- Table 117: Latin America Generic Drugs Market Y-o-Y Growth Rate Comparison by Type of Drug (2016-2032)
- Table 118: Latin America Generic Drugs Market Y-o-Y Growth Rate Comparison by Therapeutic Area (2016-2032)
- Table 119: Latin America Generic Drugs Market Y-o-Y Growth Rate Comparison by Route of Administration (2016-2032)
- Table 120: Latin America Generic Drugs Market Y-o-Y Growth Rate Comparison by Distribution Channel (2016-2032)
- Table 121: Latin America Generic Drugs Market Share Comparison by Country (2016-2032)
- Table 122: Latin America Generic Drugs Market Share Comparison by Type of Drug (2016-2032)
- Table 123: Latin America Generic Drugs Market Share Comparison by Therapeutic Area (2016-2032)
- Table 124: Latin America Generic Drugs Market Share Comparison by Route of Administration (2016-2032)
- Table 125: Latin America Generic Drugs Market Share Comparison by Distribution Channel (2016-2032)
- Table 126: Middle East & Africa Generic Drugs Market Comparison by Type of Drug (2016-2032)
- Table 127: Middle East & Africa Generic Drugs Market Comparison by Therapeutic Area (2016-2032)
- Table 128: Middle East & Africa Generic Drugs Market Comparison by Route of Administration (2016-2032)
- Table 129: Middle East & Africa Generic Drugs Market Comparison by Distribution Channel (2016-2032)
- Table 130: Middle East & Africa Generic Drugs Market Revenue (US$ Mn) Comparison by Country (2016-2032)
- Table 131: Middle East & Africa Generic Drugs Market Revenue (US$ Mn) (2016-2032)
- Table 132: Middle East & Africa Generic Drugs Market Revenue (US$ Mn) Comparison by Country (2016-2032)
- Table 133: Middle East & Africa Generic Drugs Market Revenue (US$ Mn) Comparison by Type of Drug (2016-2032)
- Table 134: Middle East & Africa Generic Drugs Market Revenue (US$ Mn) Comparison by Therapeutic Area (2016-2032)
- Table 135: Middle East & Africa Generic Drugs Market Revenue (US$ Mn) Comparison by Route of Administration (2016-2032)
- Table 136: Middle East & Africa Generic Drugs Market Revenue (US$ Mn) Comparison by Distribution Channel (2016-2032)
- Table 137: Middle East & Africa Generic Drugs Market Y-o-Y Growth Rate Comparison by Country (2016-2032)
- Table 138: Middle East & Africa Generic Drugs Market Y-o-Y Growth Rate Comparison by Type of Drug (2016-2032)
- Table 139: Middle East & Africa Generic Drugs Market Y-o-Y Growth Rate Comparison by Therapeutic Area (2016-2032)
- Table 140: Middle East & Africa Generic Drugs Market Y-o-Y Growth Rate Comparison by Route of Administration (2016-2032)
- Table 141: Middle East & Africa Generic Drugs Market Y-o-Y Growth Rate Comparison by Distribution Channel (2016-2032)
- Table 142: Middle East & Africa Generic Drugs Market Share Comparison by Country (2016-2032)
- Table 143: Middle East & Africa Generic Drugs Market Share Comparison by Type of Drug (2016-2032)
- Table 144: Middle East & Africa Generic Drugs Market Share Comparison by Therapeutic Area (2016-2032)
- Table 145: Middle East & Africa Generic Drugs Market Share Comparison by Route of Administration (2016-2032)
- Table 146: Middle East & Africa Generic Drugs Market Share Comparison by Distribution Channel (2016-2032)
- 1. Executive Summary
-
- Teva Pharmaceutical Industries Ltd.
- Sandoz (a Novartis division)
- Mylan N.V. (part of Viatris)
- Pfizer Inc.
- Sun Pharmaceutical Industries Ltd.
- Fresenius Kabi AG
- Lupin Limited
- Dr. Reddy's Laboratories Ltd.
- Cipla Ltd.
- Aurobindo Pharma Ltd.
- Stada Arzneimittel AG
- Hikma Pharmaceuticals PLC
- Endo International plc
- Torrent Pharmaceuticals Ltd.
- Zydus Cadila
Our Clients


View Our Licence Options
