
Generative AI in Waste Management Market By Component(Solution, Services), By Application(Waste Sorting and Segregation, Predictive Maintenance, Route Optimization, Other Applications), By End-User(Waste Management Companies, Municipalities & Local Governments, Other End-Users), By Region And Companies - Industry Segment Outlook, Market Assessment, Competition Scenario, Trends, And Forecast 2024-2033
-
43997
-
March 2024
-
179
-


-
This report was compiled by Vishwa Gaul Vishwa is an experienced market research and consulting professional with over 8 years of expertise in the ICT industry, contributing to over 700 reports across telecommunications, software, hardware, and digital solutions. Correspondence Team Lead- ICT Linkedin | Detailed Market research Methodology Our methodology involves a mix of primary research, including interviews with leading mental health experts, and secondary research from reputable medical journals and databases. View Detailed Methodology Page
-
Quick Navigation
Report Overview
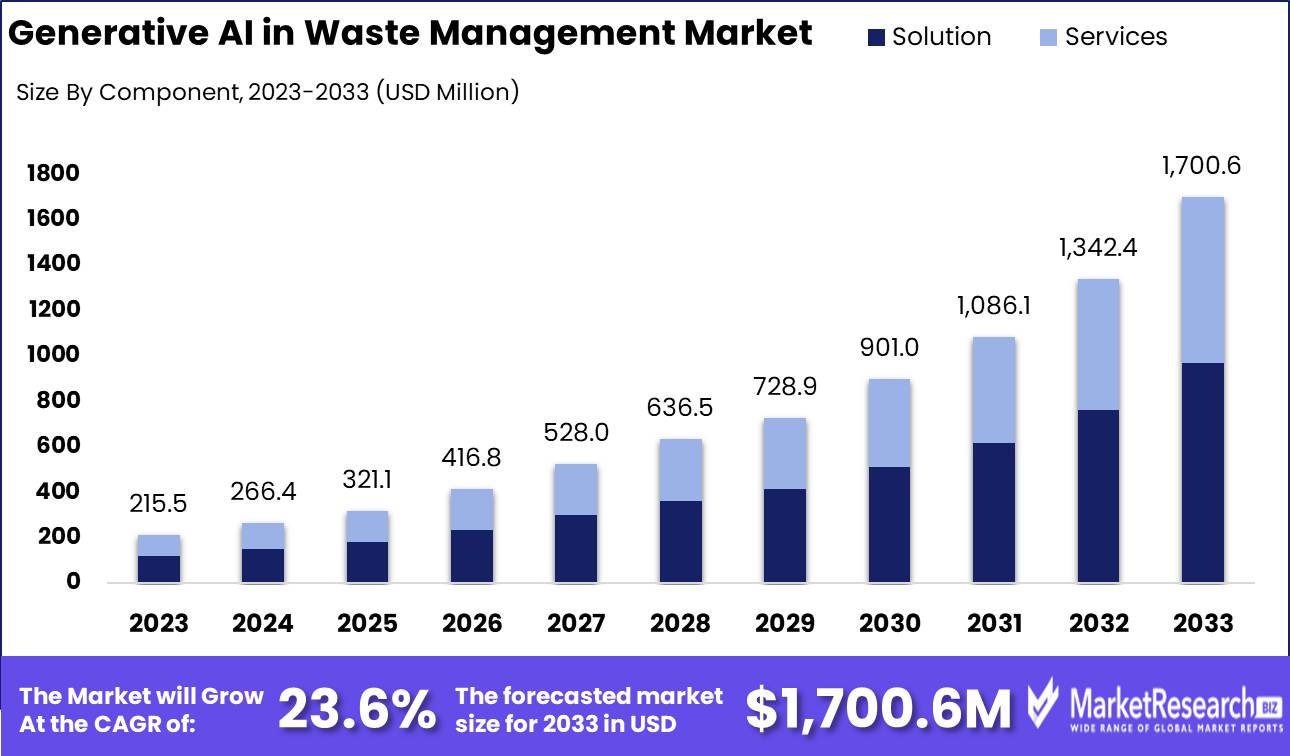
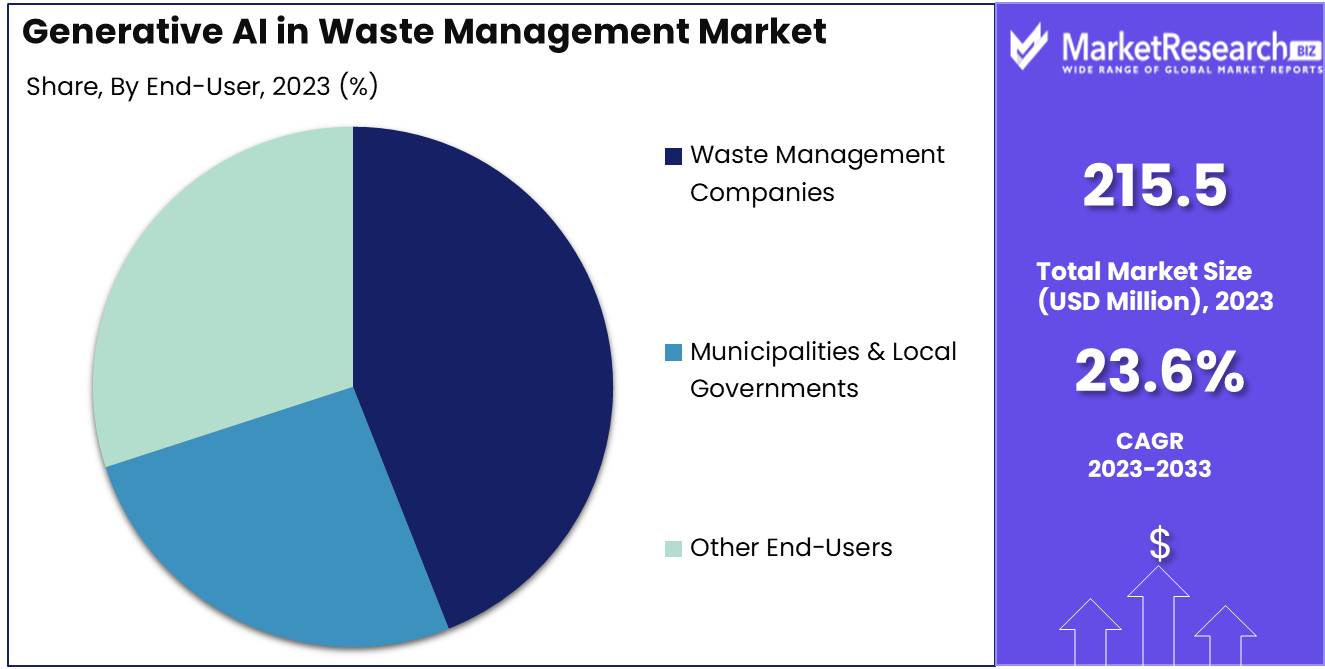
The generative AI in waste management market was valued at USD 215.5 Million in 2023. It is expected to reach USD 1,700.6 Million by 2033, with a CAGR of 23.6% during the forecast period from 2024 to 2033. The surge in demand for advanced technologies and the rise in manufacturing and production plants are some of the main key driving factors for generative AI in waste management process market.
The generative AI in waste management is defined as the usage of artificial intelligence algorithms to enhance different aspects of waste handling methods from gathering to disposal. This advanced technology uses machine learning models to analyze huge quantities of data produced by sensors, digital cameras, and other IoT devices that are installed in waste management systems. By understanding structures in waste generation, movements, and compositions, generative AI can improve route enhancement for garbage collections, forecast potential waste overflow and equipment failures, and even advise new innovative recycling industry techniques.
Moreover, it makes real-time supervision and maintains waste industry processing operations that lead to boost efficacy, decrease expenses, and lessen environmental impact. Gen AI modernizes waste management by changing it into smarter, more adaptive, and sustainable techniques by contributing to global efforts toward waste minimization and resource preservation.
Suez in March 2024, highlights that generative AI and other digital solutions are transforming the work production and the waste management sector. By using the latest facilities, the Suez recycling and recovery firm has achieved an exceptional recovery rate of up to 90% by producing top-notch secondary raw materials that can meet the requirements of industrial clients. The manual sampling generally covers 1% of the waste stream and informs government policies as well as operational decision-making.
with advanced scanners and AI software analysis, Suez has achieved 99% visibility. In 2023, according study conducted by GreyParrot revealed that residue streams all across Europe, the US, and Asia have explored a confounding 37% of recycled paper and cardboard and the recyclable plastics that are made up of another 26%.
Generative AI in waste management has gained much attention due to its ability to enhance landfill space utilization. By analyzing data on the waste composition and decomposition rates, genAI can forecast how various types of waste will compact over time. This permits for more efficient packing and amassing of waste in landfills by increasing their potentiality and longing for their lifespan.
Moreover, this leads to a decrease in the demand for new landfill sites and reduces the environmental impact related to waste disposal. Generous AI for waste management will increase due to its necessity in large manufacturing and production facilities, aiding market expansion in the coming years.
Key Takeaways
- Market Growth: Generative AI in Waste Management Market was valued at USD 215.5 Million in 2023. It is expected to reach USD 1,700.6 Million by 2033, with a CAGR of 23.6% during the forecast period from 2024 to 2033.
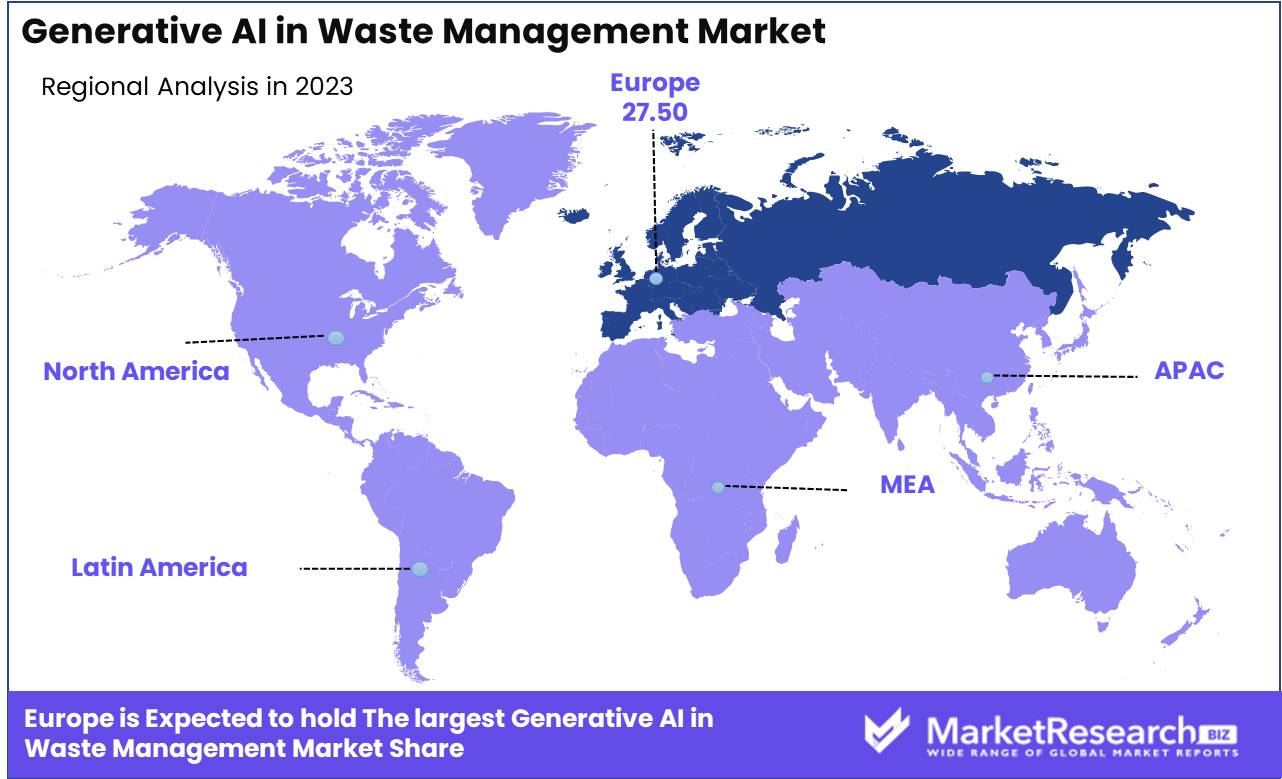
- Regional Dominance: Generative AI is projected to capture a substantial market share of 27.50% in the waste management sector in Europe.
- By Component: The Solution segment dominated Generative AI in Waste Management Market in 2023.
- By Application: Waste Sorting and Segregation emerged as the dominant segment in 2023.
- By End-User: Waste Management Companies were the dominant segment in the Generative AI market.
- Growth Opportunity: Generative AI in waste management offers optimized routes, predictive maintenance, and automation to tackle rising labor costs and leverage digitization trends, driving efficiency and cost savings.
Driving factors
Cost Reduction through Optimized Routing and Logistics
Generative AI plays a pivotal role in cost reduction within the Waste Management Market by optimizing routing and logistics, thereby mitigating fuel costs and minimizing staffing requirements. Through sophisticated algorithms, AI systems can analyze diverse variables such as traffic patterns, waste collection points, and vehicle capacities to devise the most efficient routes.
For instance, a UK waste company leveraged AI solutions, resulting in a notable 13% reduction in fuel consumption. By minimizing fuel usage and streamlining routes, waste management firms can achieve substantial cost savings, enhancing their overall profitability.
Efficiency Gains through Data Analysis
Generative AI facilitates efficiency gains in waste management operations by harnessing vast datasets to identify and address inefficiencies. By scrutinizing factors like historical collection data, customer demand patterns, and equipment performance metrics, AI systems can optimize resource allocation, streamline operations, and enhance service delivery.
For instance, a US recycling firm witnessed a remarkable 25% improvement in route efficiency by implementing AI-driven solutions. Through route optimization, predictive maintenance, and dynamic scheduling, waste management companies can maximize operational efficiency, ultimately boosting productivity and profitability.
Enhanced Recycling Capabilities with AI Sorting
Generative AI revolutionizes waste recycling by enabling precise waste sorting, thereby augmenting recycling rates and minimizing contamination. By deploying advanced sensors and machine learning algorithms, AI-powered systems can accurately categorize waste into distinct streams based on material composition. This capability significantly enhances recycling processes, ensuring higher purity levels and reducing the likelihood of cross-contamination.
Consequently, waste management entities can achieve elevated recycling rates, aligning with sustainability goals and regulatory mandates. Through the integration of Generative AI technologies, the waste management industry can foster a more circular economy, driving environmental stewardship while simultaneously optimizing operational efficiency and cost-effectiveness.
Restraining Factors
Challenges of High Upfront Costs in AI Implementation
The adoption of Generative AI in the Waste Management Market faces hurdles due to the high upfront costs associated with implementation. The integration of AI necessitates substantial investments in data infrastructure, software development, and system integration. However, such capital-intensive endeavors may pose challenges for smaller waste management firms with limited financial resources.
Despite recognizing the long-term benefits of AI in optimizing operations and enhancing efficiency, these companies may encounter barriers in financing the initial setup costs, hindering widespread adoption across the industry. Consequently, the market growth of Generative AI in waste management may experience a slowdown as smaller players struggle to overcome financial constraints.
Navigating Workforce Resistance for AI Adoption
Another key barrier to Generative AI adoption in waste management is workforce resistance to automation. Employees may perceive AI technologies as threats to job security, fearing potential layoffs or displacement. Addressing this apprehension requires proactive change management strategies and ongoing training initiatives to alleviate concerns and foster a supportive work environment. By emphasizing the complementary nature of AI technologies and human labor, waste management firms can mitigate resistance and promote acceptance of AI-driven solutions among their workforce.
Moreover, showcasing the tangible benefits of AI, such as enhanced safety, productivity, and job enrichment opportunities, can further incentivize employee buy-in and facilitate smoother integration of Generative AI into existing operational frameworks. Thus, effectively managing workforce perceptions and facilitating a culture of collaboration between humans and AI is essential for driving widespread adoption and realizing the full potential of Generative AI in waste management.
By Component Analysis
AI Algorithms and Solutions dominate the Generative AI in Waste Management Market.
Solution held a leading market position in 2023 in the Generative AI in Waste Management Market's By Component segment. This segment encompasses all core components necessary for integrating and deploying artificial intelligence solutions within waste management systems, while Solution Services emerged as an important player providing pivotal services that enabled effective deployment and optimization of Generative AI technologies within these infrastructures.
Solution Services specializes in offering tailored solutions catering to the unique requirements of waste management entities. Their comprehensive suite of services encompasses consultancy, implementation, training, and support, ensuring seamless integration and operation of generative AI systems across diverse waste management scenarios. Leveraging advanced data analytics and industry expertise, Solution Services empowers waste management stakeholders to harness the full potential of generative AI, optimizing resource allocation, waste processing efficiency, and environmental sustainability.
The growth of Solution Services within the By Component segment underscores the increasing demand for specialized expertise in deploying AI-driven solutions to address complex waste management challenges. Their commitment to delivering holistic services tailored to client needs positions them as a key enabler of innovation and efficiency within the waste management landscape. As the market continues to evolve, Solution Services remains poised to drive further advancements in generative AI adoption, fostering a more sustainable and resilient waste management ecosystem.
By Application Analysis
Waste Sorting and Segregation is the dominant segment in applications.
Waste Sorting and Segregation was the dominant market player in 2023 for Generative AI Waste Management Market by Application segment. Waste sorting, powered by advanced AI algorithms, emerged as an indispensable solution in optimizing waste management processes and garnered a significant share due to its ability to streamline sorting procedures, enhance resource recovery rates, and mitigate environmental impacts.
Predictive maintenance also emerged as a notable application within the Generative AI framework. Leveraging predictive analytics, AI algorithms forecast equipment failures, enabling proactive maintenance strategies to minimize downtime and optimize operational efficiency. This segment witnessed substantial growth driven by the increasing adoption of AI-powered predictive maintenance solutions across waste management facilities.
Route optimization emerged as another key application segment in the Generative AI in Waste Management Market. By employing AI algorithms to analyze data on waste collection routes, companies can optimize collection schedules, reduce fuel consumption, and enhance overall operational efficiency. This segment experienced notable traction as waste management organizations sought to optimize logistics and reduce costs.
By End-User Analysis
Waste Management Companies dominate the market in end-user segmentation.
Waste Management Companies took the lead in 2023 in terms of end-user adoption for Generative AI Waste Management technologies. Their primary objectives included optimizing operational processes, resource recovery enhancement, and increasing environmental sustainability - with these organizations quickly adapting AI technologies as they recognized its revolutionary potential in revolutionizing waste management practices while increasing operational efficiencies.
Following closely behind, Municipalities & Local Governments constituted another significant segment within the Generative AI in Waste Management Market. Municipalities and local governments leveraged AI-powered solutions to address the challenges of waste collection, disposal, and recycling within their jurisdictions. The adoption of generative AI technologies enabled these entities to optimize waste management processes, reduce costs, and enhance service delivery to their constituents.
Additionally, other end-users, including commercial enterprises and industrial facilities, contributed to the market's growth. These entities recognized the value proposition of generative AI in improving waste management efficiency, reducing environmental impact, and complying with regulatory requirements. As a result, they increasingly integrated AI-powered solutions into their waste management strategies, further expanding the market's reach and potential.
Key Market Segments
By Component
- Solution
- Services
By Application
- Waste Sorting and Segregation
- Predictive Maintenance
- Route Optimization
- Other Applications
By End-User
- Waste Management Companies
- Municipalities & Local Governments
- Other End-Users
Growth Opportunity
Optimized Collection Routes: Enhancing Efficiency and Cost Savings
Generative AI presents a significant growth opportunity for the global waste management market in 2023 through optimized collection routes. By leveraging sophisticated algorithms, AI systems analyze diverse variables such as traffic patterns, demographics, and container volumes to devise the most efficient routes for waste collection. This optimization not only reduces mileage but also minimizes fuel costs and mitigates wear-and-tear on collection vehicles. Consequently, waste management companies can achieve substantial cost savings while simultaneously improving operational efficiency and service delivery.
Predictive Maintenance: Mitigating Downtime and Enhancing Reliability
The integration of Generative AI enables predictive maintenance in waste management operations, offering proactive insights into equipment health and performance. By detecting anomalies in sensor data, AI systems can forecast potential failures before they occur, allowing for timely maintenance and repair interventions. This predictive approach minimizes costly downtime, enhances equipment reliability, and prolongs asset lifespan, thereby optimizing overall operational efficiency and reducing maintenance expenses.
Rising Labor Costs: Driving Adoption of AI Automation
The escalating labor costs and shrinking workforce availability in the waste management sector present a compelling incentive for firms to adopt AI-driven automation solutions. Generative AI technologies enable the automation of various tasks, from route optimization to equipment maintenance, helping companies control labor expenses while maintaining operational efficacy. As wage pressures continue to mount, the adoption of AI becomes increasingly imperative for waste management entities seeking to remain competitive and sustainable in the evolving market landscape.
Increased Digitization: Facilitating AI Integration and Optimization
The growing trend toward digitization within the waste management industry provides a fertile ground for the expansion of Generative AI applications. Companies are embracing sensor-equipped trucks, bins, and facilities to generate vast amounts of data for AI systems to analyze and optimize operations. However, the lack of digitization remains a significant obstacle to widespread AI adoption, emphasizing the importance of accelerating digital transformation initiatives to fully leverage the potential of Generative AI in waste management. As digitization efforts gain momentum, the synergy between data-driven insights and AI-driven solutions will drive enhanced efficiency, sustainability, and profitability across the waste management value chain.
Latest Trends
Driving Efficiency and Sustainability: Emerging Trends in Generative AI for Waste Management
In 2023, the global waste management industry is witnessing a transformative shift driven by the latest trends in Generative AI technology. One prominent trend is the emphasis on driving efficiency and sustainability through AI-powered solutions. Waste management companies are increasingly leveraging Generative AI to optimize collection routes, predict equipment maintenance needs, and enhance recycling processes.
By harnessing sophisticated algorithms, AI systems can analyze vast datasets to identify inefficiencies, minimize operational costs, and maximize resource utilization. This focus on efficiency not only improves profitability but also reduces environmental impact by optimizing waste management practices. Additionally, there is a growing emphasis on sustainability within the waste management sector, propelled by Generative AI advancements.
AI-driven sorting technologies enable more accurate waste categorization, leading to higher recycling rates and reduced contamination levels. Furthermore, the integration of AI facilitates proactive environmental monitoring and compliance management, ensuring adherence to regulatory standards and fostering a more eco-conscious approach to waste management practices. As sustainability becomes increasingly paramount in corporate agendas, Generative AI emerges as a pivotal enabler of transformative change within the waste management landscape.
Empowering Decision-Making: Generative AI's Role in Shaping the Future of Waste Management
Generative AI is revolutionizing the waste management industry by empowering data-driven decision-making processes. In 2023, one of the latest trends shaping the global market is the integration of AI-powered analytics platforms to extract actionable insights from complex datasets. Waste management companies are leveraging Generative AI to analyze operational data, customer behavior patterns, and environmental factors to optimize strategic decision-making.
By harnessing predictive analytics, AI systems can anticipate demand fluctuations, identify cost-saving opportunities, and mitigate operational risks, enabling waste management firms to make informed decisions that drive business growth and sustainability.Moreover, Generative AI facilitates real-time monitoring and control of waste management operations, enabling proactive interventions to address emerging challenges promptly.
From dynamic route optimization to predictive maintenance scheduling, AI-driven solutions enhance operational agility, minimize downtime, and improve service quality. As the demand for efficient waste management solutions continues to escalate, Generative AI emerges as a critical enabler of agility and resilience in navigating evolving market dynamics. By embracing AI-driven decision support tools, waste management companies can stay ahead of the curve, capitalize on emerging opportunities, and drive innovation in the pursuit of operational excellence.
Regional Analysis
Generative AI is projected to capture a market share of 27.50% in Waste Management in Europe.
In the Waste Management market, Generative AI is poised for significant growth across various regions, including North America, Europe, Asia Pacific, the Middle East & Africa, and Latin America.
In Europe, Generative AI is expected to dominate with a market share of 27.50%. This dominance is driven by the region's stringent environmental regulations, increasing focus on sustainability, and technological advancements in waste management practices. Europe's waste management sector is characterized by robust investment in innovative solutions to optimize operational efficiency and minimize environmental impact. For instance, countries like Germany and Sweden have been at the forefront of implementing advanced waste management technologies, including AI-driven systems for route optimization and predictive maintenance.
In North America, Generative AI adoption is also on the rise, albeit at a slightly lower rate compared to Europe. With a growing emphasis on reducing carbon footprint and improving resource efficiency, waste management companies in the region are increasingly turning to AI solutions to streamline operations and enhance service delivery. The market in North America is driven by factors such as the growing urban population, rising waste generation rates, and the need for cost-effective waste management solutions.
Similarly, in the Asia Pacific region, Generative AI holds significant potential for transforming waste management practices. Rapid urbanization, industrialization, and population growth have led to escalating waste generation levels, prompting governments and industry players to explore AI-powered solutions for efficient waste collection, sorting, and disposal. Countries like China, Japan, and India are witnessing increasing investments in AI-enabled waste management infrastructure to address these challenges.
In the Middle East & Africa and Latin America, Generative AI adoption in waste management is still in its nascent stages but is expected to gain traction in the coming years as governments and businesses recognize the benefits of AI-driven optimization and automation in tackling waste management challenges. Overall, Generative AI presents a promising opportunity for enhancing operational efficiency, reducing costs, and promoting sustainability across the global waste management landscape.
Key Regions and Countries
North America
- The US
- Canada
- Rest of North America
Europe
- Germany
- France
- The UK
- Spain
- Netherlands
- Russia
- Italy
- Rest of Europe
Asia-Pacific
- China
- Japan
- Singapore
- Thailand
- South Korea
- Vietnam
- India
- New Zealand
- Rest of Asia Pacific
Latin America
- Mexico
- Brazil
- Rest of Latin America
Middle East & Africa
- Saudi Arabia
- South Africa
- UAE
- Rest of the Middle East & Africa
Key Players Analysis
In 2023, the global Generative AI in Waste Management Market witnessed significant traction, primarily driven by key players such as IBM Corporation, Amazon Web Services, Inc., and Microsoft Corporation. These industry giants, with their expansive resources and technological prowess, have spearheaded the integration of generative AI solutions into waste management processes worldwide.
IBM Corporation, renowned for its innovation and expertise in artificial intelligence, has played a pivotal role in advancing generative AI applications for waste management. By leveraging its Watson AI platform, IBM has developed sophisticated solutions for optimizing waste collection, sorting, and recycling processes, thereby enhancing efficiency and sustainability.
Similarly, Amazon Web Services (AWS) and Microsoft Corporation have made substantial investments in AI-driven waste management solutions, capitalizing on their cloud computing infrastructure and vast customer base. Through initiatives like AWS AI and Azure AI, these companies have empowered waste management organizations with scalable and customizable AI tools to streamline operations and minimize environmental impact.
Emerging players such as CleanRobotics, Greyparrot AI, and Recycleye have also made noteworthy contributions to the market landscape. Their innovative AI-powered technologies, focused on waste sorting, recycling optimization, and resource recovery, have garnered attention from industry stakeholders and investors alike.
While IBM, AWS, and Microsoft dominate the market with their established presence and comprehensive offerings, smaller players like Bine sp. z o. o., Intuitive AI, and Recycleye bring niche expertise and agile solutions to address specific challenges in waste management.
Market Key Players
- IBM Corporation
- Amazon Web Services, Inc.
- Microsoft Corporation
- CleanRobotics
- Greyparrot AI
- Bine sp. z o. o.
- Intuitive AI
- Recycleye
- Other Key Players
Recent Development
- In March 2024, the Communications Association of Hong Kong (CAHK) organizes Green Tech ICT Open Day 2024, connecting students with leading ICT enterprises like China Mobile HK, CITIC Telecom, and HKT, promoting sustainability and tech innovation.
- In February 2024, ZenRobotics unveils ZenRobotics 4.0, revolutionizing waste sorting with AI. Enhancements include Heavy Picker 4.0 for bulky materials and Fast Picker 4.0 for high-speed sorting, promising efficiency and customization in recycling.
- In February 2024, Microsoft introduces sustainability data solutions in Microsoft Fabric, enhancing ESG data management and reporting. Features include ESG data estate and Azure emissions insights, empowering organizations in sustainability tracking and analysis.
- In January 2024, The European Commission introduces measures to support AI startups and SMEs in developing trustworthy AI, including AI Factories and an AI Office. €4 billion investment and infrastructure consortia also announced.
Report Scope
Report Features Description Market Value (2023) USD 215.5 Million Forecast Revenue (2033) USD 1,700.6 Million CAGR (2024-2032) 23.6% Base Year for Estimation 2023 Historic Period 2016-2023 Forecast Period 2024-2033 Report Coverage Revenue Forecast, Market Dynamics, COVID-19 Impact, Competitive Landscape, Recent Developments Segments Covered By Component(Solution, Services), By Application(Waste Sorting and Segregation, Predictive Maintenance, Route Optimization, Other Applications), By End-User(Waste Management Companies, Municipalities & Local Governments, Other End-Users) Regional Analysis North America - The US, Canada, Rest of North America, Europe - Germany, France, The UK, Spain, Italy, Russia, Netherlands, Rest of Europe, Asia-Pacific - China, Japan, South Korea, India, New Zealand, Singapore, Thailand, Vietnam, Rest of Asia Pacific, Latin America - Brazil, Mexico, Rest of Latin America, Middle East & Africa - South Africa, Saudi Arabia, UAE, Rest of Middle East & Africa Competitive Landscape IBM Corporation, Amazon Web Services, Inc., Microsoft Corporation, CleanRobotics, Greyparrot AI, Bine sp. z o. o., Intuitive AI, Recycleye, Other Key Players Customization Scope Customization for segments, region/country-level will be provided. Moreover, additional customization can be done based on the requirements. Purchase Options We have three licenses to opt for Single User License, Multi-User License (Up to 5 Users), Corporate Use License (Unlimited User and Printable PDF) -
- 1. Executive Summary
- 1.1. Definition
- 1.2. Taxonomy
- 1.3. Research Scope
- 1.4. Key Analysis
- 1.5. Key Findings by Major Segments
- 1.6. Top strategies by Major Players
- 2. Global Generative AI in Waste Management Market Overview
- 2.1. Generative AI in Waste Management Market Dynamics
- 2.1.1. Drivers
- 2.1.2. Opportunities
- 2.1.3. Restraints
- 2.1.4. Challenges
- 2.2. Macro-economic Factors
- 2.3. Regulatory Framework
- 2.4. Market Investment Feasibility Index
- 2.5. PEST Analysis
- 2.6. PORTER’S Five Force Analysis
- 2.7. Drivers & Restraints Impact Analysis
- 2.8. Industry Chain Analysis
- 2.9. Cost Structure Analysis
- 2.10. Marketing Strategy
- 2.11. Russia-Ukraine War Impact Analysis
- 2.12. Opportunity Map Analysis
- 2.13. Market Competition Scenario Analysis
- 2.14. Product Life Cycle Analysis
- 2.15. Opportunity Orbits
- 2.16. Manufacturer Intensity Map
- 2.17. Major Companies sales by Value & Volume
- 2.1. Generative AI in Waste Management Market Dynamics
- 3. Global Generative AI in Waste Management Market Analysis, Opportunity and Forecast, 2016-2032
- 3.1. Global Generative AI in Waste Management Market Analysis, 2016-2021
- 3.2. Global Generative AI in Waste Management Market Opportunity and Forecast, 2023-2032
- 3.3. Global Generative AI in Waste Management Market Analysis, Opportunity and Forecast, By By Component, 2016-2032
- 3.3.1. Global Generative AI in Waste Management Market Analysis by By Component: Introduction
- 3.3.2. Market Size Absolute $ Opportunity Analysis and Forecast, By By Component, 2016-2032
- 3.3.3. Solution
- 3.3.4. Services
- 3.4. Global Generative AI in Waste Management Market Analysis, Opportunity and Forecast, By By Application, 2016-2032
- 3.4.1. Global Generative AI in Waste Management Market Analysis by By Application: Introduction
- 3.4.2. Market Size Absolute $ Opportunity Analysis and Forecast, By By Application, 2016-2032
- 3.4.3. Waste Sorting and Segregation
- 3.4.4. Predictive Maintenance
- 3.4.5. Route Optimization
- 3.4.6. Other Applications
- 3.5. Global Generative AI in Waste Management Market Analysis, Opportunity and Forecast, By By End-User, 2016-2032
- 3.5.1. Global Generative AI in Waste Management Market Analysis by By End-User: Introduction
- 3.5.2. Market Size Absolute $ Opportunity Analysis and Forecast, By By End-User, 2016-2032
- 3.5.3. Waste Management Companies
- 3.5.4. Municipalities & Local Governments
- 3.5.5. Other End-Users
- 4. North America Generative AI in Waste Management Market Analysis, Opportunity and Forecast, 2016-2032
- 4.1. North America Generative AI in Waste Management Market Analysis, 2016-2021
- 4.2. North America Generative AI in Waste Management Market Opportunity and Forecast, 2023-2032
- 4.3. North America Generative AI in Waste Management Market Analysis, Opportunity and Forecast, By By Component, 2016-2032
- 4.3.1. North America Generative AI in Waste Management Market Analysis by By Component: Introduction
- 4.3.2. Market Size Absolute $ Opportunity Analysis and Forecast, By By Component, 2016-2032
- 4.3.3. Solution
- 4.3.4. Services
- 4.4. North America Generative AI in Waste Management Market Analysis, Opportunity and Forecast, By By Application, 2016-2032
- 4.4.1. North America Generative AI in Waste Management Market Analysis by By Application: Introduction
- 4.4.2. Market Size Absolute $ Opportunity Analysis and Forecast, By By Application, 2016-2032
- 4.4.3. Waste Sorting and Segregation
- 4.4.4. Predictive Maintenance
- 4.4.5. Route Optimization
- 4.4.6. Other Applications
- 4.5. North America Generative AI in Waste Management Market Analysis, Opportunity and Forecast, By By End-User, 2016-2032
- 4.5.1. North America Generative AI in Waste Management Market Analysis by By End-User: Introduction
- 4.5.2. Market Size Absolute $ Opportunity Analysis and Forecast, By By End-User, 2016-2032
- 4.5.3. Waste Management Companies
- 4.5.4. Municipalities & Local Governments
- 4.5.5. Other End-Users
- 4.6. North America Generative AI in Waste Management Market Analysis, Opportunity and Forecast, By Country , 2016-2032
- 4.6.1. North America Generative AI in Waste Management Market Analysis by Country : Introduction
- 4.6.2. Market Size Absolute $ Opportunity Analysis and Forecast, Country , 2016-2032
- 4.6.2.1. The US
- 4.6.2.2. Canada
- 4.6.2.3. Mexico
- 5. Western Europe Generative AI in Waste Management Market Analysis, Opportunity and Forecast, 2016-2032
- 5.1. Western Europe Generative AI in Waste Management Market Analysis, 2016-2021
- 5.2. Western Europe Generative AI in Waste Management Market Opportunity and Forecast, 2023-2032
- 5.3. Western Europe Generative AI in Waste Management Market Analysis, Opportunity and Forecast, By By Component, 2016-2032
- 5.3.1. Western Europe Generative AI in Waste Management Market Analysis by By Component: Introduction
- 5.3.2. Market Size Absolute $ Opportunity Analysis and Forecast, By By Component, 2016-2032
- 5.3.3. Solution
- 5.3.4. Services
- 5.4. Western Europe Generative AI in Waste Management Market Analysis, Opportunity and Forecast, By By Application, 2016-2032
- 5.4.1. Western Europe Generative AI in Waste Management Market Analysis by By Application: Introduction
- 5.4.2. Market Size Absolute $ Opportunity Analysis and Forecast, By By Application, 2016-2032
- 5.4.3. Waste Sorting and Segregation
- 5.4.4. Predictive Maintenance
- 5.4.5. Route Optimization
- 5.4.6. Other Applications
- 5.5. Western Europe Generative AI in Waste Management Market Analysis, Opportunity and Forecast, By By End-User, 2016-2032
- 5.5.1. Western Europe Generative AI in Waste Management Market Analysis by By End-User: Introduction
- 5.5.2. Market Size Absolute $ Opportunity Analysis and Forecast, By By End-User, 2016-2032
- 5.5.3. Waste Management Companies
- 5.5.4. Municipalities & Local Governments
- 5.5.5. Other End-Users
- 5.6. Western Europe Generative AI in Waste Management Market Analysis, Opportunity and Forecast, By Country , 2016-2032
- 5.6.1. Western Europe Generative AI in Waste Management Market Analysis by Country : Introduction
- 5.6.2. Market Size Absolute $ Opportunity Analysis and Forecast, Country , 2016-2032
- 5.6.2.1. Germany
- 5.6.2.2. France
- 5.6.2.3. The UK
- 5.6.2.4. Spain
- 5.6.2.5. Italy
- 5.6.2.6. Portugal
- 5.6.2.7. Ireland
- 5.6.2.8. Austria
- 5.6.2.9. Switzerland
- 5.6.2.10. Benelux
- 5.6.2.11. Nordic
- 5.6.2.12. Rest of Western Europe
- 6. Eastern Europe Generative AI in Waste Management Market Analysis, Opportunity and Forecast, 2016-2032
- 6.1. Eastern Europe Generative AI in Waste Management Market Analysis, 2016-2021
- 6.2. Eastern Europe Generative AI in Waste Management Market Opportunity and Forecast, 2023-2032
- 6.3. Eastern Europe Generative AI in Waste Management Market Analysis, Opportunity and Forecast, By By Component, 2016-2032
- 6.3.1. Eastern Europe Generative AI in Waste Management Market Analysis by By Component: Introduction
- 6.3.2. Market Size Absolute $ Opportunity Analysis and Forecast, By By Component, 2016-2032
- 6.3.3. Solution
- 6.3.4. Services
- 6.4. Eastern Europe Generative AI in Waste Management Market Analysis, Opportunity and Forecast, By By Application, 2016-2032
- 6.4.1. Eastern Europe Generative AI in Waste Management Market Analysis by By Application: Introduction
- 6.4.2. Market Size Absolute $ Opportunity Analysis and Forecast, By By Application, 2016-2032
- 6.4.3. Waste Sorting and Segregation
- 6.4.4. Predictive Maintenance
- 6.4.5. Route Optimization
- 6.4.6. Other Applications
- 6.5. Eastern Europe Generative AI in Waste Management Market Analysis, Opportunity and Forecast, By By End-User, 2016-2032
- 6.5.1. Eastern Europe Generative AI in Waste Management Market Analysis by By End-User: Introduction
- 6.5.2. Market Size Absolute $ Opportunity Analysis and Forecast, By By End-User, 2016-2032
- 6.5.3. Waste Management Companies
- 6.5.4. Municipalities & Local Governments
- 6.5.5. Other End-Users
- 6.6. Eastern Europe Generative AI in Waste Management Market Analysis, Opportunity and Forecast, By Country , 2016-2032
- 6.6.1. Eastern Europe Generative AI in Waste Management Market Analysis by Country : Introduction
- 6.6.2. Market Size Absolute $ Opportunity Analysis and Forecast, Country , 2016-2032
- 6.6.2.1. Russia
- 6.6.2.2. Poland
- 6.6.2.3. The Czech Republic
- 6.6.2.4. Greece
- 6.6.2.5. Rest of Eastern Europe
- 7. APAC Generative AI in Waste Management Market Analysis, Opportunity and Forecast, 2016-2032
- 7.1. APAC Generative AI in Waste Management Market Analysis, 2016-2021
- 7.2. APAC Generative AI in Waste Management Market Opportunity and Forecast, 2023-2032
- 7.3. APAC Generative AI in Waste Management Market Analysis, Opportunity and Forecast, By By Component, 2016-2032
- 7.3.1. APAC Generative AI in Waste Management Market Analysis by By Component: Introduction
- 7.3.2. Market Size Absolute $ Opportunity Analysis and Forecast, By By Component, 2016-2032
- 7.3.3. Solution
- 7.3.4. Services
- 7.4. APAC Generative AI in Waste Management Market Analysis, Opportunity and Forecast, By By Application, 2016-2032
- 7.4.1. APAC Generative AI in Waste Management Market Analysis by By Application: Introduction
- 7.4.2. Market Size Absolute $ Opportunity Analysis and Forecast, By By Application, 2016-2032
- 7.4.3. Waste Sorting and Segregation
- 7.4.4. Predictive Maintenance
- 7.4.5. Route Optimization
- 7.4.6. Other Applications
- 7.5. APAC Generative AI in Waste Management Market Analysis, Opportunity and Forecast, By By End-User, 2016-2032
- 7.5.1. APAC Generative AI in Waste Management Market Analysis by By End-User: Introduction
- 7.5.2. Market Size Absolute $ Opportunity Analysis and Forecast, By By End-User, 2016-2032
- 7.5.3. Waste Management Companies
- 7.5.4. Municipalities & Local Governments
- 7.5.5. Other End-Users
- 7.6. APAC Generative AI in Waste Management Market Analysis, Opportunity and Forecast, By Country , 2016-2032
- 7.6.1. APAC Generative AI in Waste Management Market Analysis by Country : Introduction
- 7.6.2. Market Size Absolute $ Opportunity Analysis and Forecast, Country , 2016-2032
- 7.6.2.1. China
- 7.6.2.2. Japan
- 7.6.2.3. South Korea
- 7.6.2.4. India
- 7.6.2.5. Australia & New Zeland
- 7.6.2.6. Indonesia
- 7.6.2.7. Malaysia
- 7.6.2.8. Philippines
- 7.6.2.9. Singapore
- 7.6.2.10. Thailand
- 7.6.2.11. Vietnam
- 7.6.2.12. Rest of APAC
- 8. Latin America Generative AI in Waste Management Market Analysis, Opportunity and Forecast, 2016-2032
- 8.1. Latin America Generative AI in Waste Management Market Analysis, 2016-2021
- 8.2. Latin America Generative AI in Waste Management Market Opportunity and Forecast, 2023-2032
- 8.3. Latin America Generative AI in Waste Management Market Analysis, Opportunity and Forecast, By By Component, 2016-2032
- 8.3.1. Latin America Generative AI in Waste Management Market Analysis by By Component: Introduction
- 8.3.2. Market Size Absolute $ Opportunity Analysis and Forecast, By By Component, 2016-2032
- 8.3.3. Solution
- 8.3.4. Services
- 8.4. Latin America Generative AI in Waste Management Market Analysis, Opportunity and Forecast, By By Application, 2016-2032
- 8.4.1. Latin America Generative AI in Waste Management Market Analysis by By Application: Introduction
- 8.4.2. Market Size Absolute $ Opportunity Analysis and Forecast, By By Application, 2016-2032
- 8.4.3. Waste Sorting and Segregation
- 8.4.4. Predictive Maintenance
- 8.4.5. Route Optimization
- 8.4.6. Other Applications
- 8.5. Latin America Generative AI in Waste Management Market Analysis, Opportunity and Forecast, By By End-User, 2016-2032
- 8.5.1. Latin America Generative AI in Waste Management Market Analysis by By End-User: Introduction
- 8.5.2. Market Size Absolute $ Opportunity Analysis and Forecast, By By End-User, 2016-2032
- 8.5.3. Waste Management Companies
- 8.5.4. Municipalities & Local Governments
- 8.5.5. Other End-Users
- 8.6. Latin America Generative AI in Waste Management Market Analysis, Opportunity and Forecast, By Country , 2016-2032
- 8.6.1. Latin America Generative AI in Waste Management Market Analysis by Country : Introduction
- 8.6.2. Market Size Absolute $ Opportunity Analysis and Forecast, Country , 2016-2032
- 8.6.2.1. Brazil
- 8.6.2.2. Colombia
- 8.6.2.3. Chile
- 8.6.2.4. Argentina
- 8.6.2.5. Costa Rica
- 8.6.2.6. Rest of Latin America
- 9. Middle East & Africa Generative AI in Waste Management Market Analysis, Opportunity and Forecast, 2016-2032
- 9.1. Middle East & Africa Generative AI in Waste Management Market Analysis, 2016-2021
- 9.2. Middle East & Africa Generative AI in Waste Management Market Opportunity and Forecast, 2023-2032
- 9.3. Middle East & Africa Generative AI in Waste Management Market Analysis, Opportunity and Forecast, By By Component, 2016-2032
- 9.3.1. Middle East & Africa Generative AI in Waste Management Market Analysis by By Component: Introduction
- 9.3.2. Market Size Absolute $ Opportunity Analysis and Forecast, By By Component, 2016-2032
- 9.3.3. Solution
- 9.3.4. Services
- 9.4. Middle East & Africa Generative AI in Waste Management Market Analysis, Opportunity and Forecast, By By Application, 2016-2032
- 9.4.1. Middle East & Africa Generative AI in Waste Management Market Analysis by By Application: Introduction
- 9.4.2. Market Size Absolute $ Opportunity Analysis and Forecast, By By Application, 2016-2032
- 9.4.3. Waste Sorting and Segregation
- 9.4.4. Predictive Maintenance
- 9.4.5. Route Optimization
- 9.4.6. Other Applications
- 9.5. Middle East & Africa Generative AI in Waste Management Market Analysis, Opportunity and Forecast, By By End-User, 2016-2032
- 9.5.1. Middle East & Africa Generative AI in Waste Management Market Analysis by By End-User: Introduction
- 9.5.2. Market Size Absolute $ Opportunity Analysis and Forecast, By By End-User, 2016-2032
- 9.5.3. Waste Management Companies
- 9.5.4. Municipalities & Local Governments
- 9.5.5. Other End-Users
- 9.6. Middle East & Africa Generative AI in Waste Management Market Analysis, Opportunity and Forecast, By Country , 2016-2032
- 9.6.1. Middle East & Africa Generative AI in Waste Management Market Analysis by Country : Introduction
- 9.6.2. Market Size Absolute $ Opportunity Analysis and Forecast, Country , 2016-2032
- 9.6.2.1. Algeria
- 9.6.2.2. Egypt
- 9.6.2.3. Israel
- 9.6.2.4. Kuwait
- 9.6.2.5. Nigeria
- 9.6.2.6. Saudi Arabia
- 9.6.2.7. South Africa
- 9.6.2.8. Turkey
- 9.6.2.9. The UAE
- 9.6.2.10. Rest of MEA
- 10. Global Generative AI in Waste Management Market Analysis, Opportunity and Forecast, By Region , 2016-2032
- 10.1. Global Generative AI in Waste Management Market Analysis by Region : Introduction
- 10.2. Market Size Absolute $ Opportunity Analysis and Forecast, By Region , 2016-2032
- 10.2.1. North America
- 10.2.2. Western Europe
- 10.2.3. Eastern Europe
- 10.2.4. APAC
- 10.2.5. Latin America
- 10.2.6. Middle East & Africa
- 11. Global Generative AI in Waste Management Market Competitive Landscape, Market Share Analysis, and Company Profiles
- 11.1. Market Share Analysis
- 11.2. Company Profiles
- 11.3. IBM Corporation
- 11.3.1. Company Overview
- 11.3.2. Financial Highlights
- 11.3.3. Product Portfolio
- 11.3.4. SWOT Analysis
- 11.3.5. Key Strategies and Developments
- 11.4. Amazon Web Services, Inc.
- 11.4.1. Company Overview
- 11.4.2. Financial Highlights
- 11.4.3. Product Portfolio
- 11.4.4. SWOT Analysis
- 11.4.5. Key Strategies and Developments
- 11.5. Microsoft Corporation
- 11.5.1. Company Overview
- 11.5.2. Financial Highlights
- 11.5.3. Product Portfolio
- 11.5.4. SWOT Analysis
- 11.5.5. Key Strategies and Developments
- 11.6. CleanRobotics
- 11.6.1. Company Overview
- 11.6.2. Financial Highlights
- 11.6.3. Product Portfolio
- 11.6.4. SWOT Analysis
- 11.6.5. Key Strategies and Developments
- 11.7. Greyparrot AI
- 11.7.1. Company Overview
- 11.7.2. Financial Highlights
- 11.7.3. Product Portfolio
- 11.7.4. SWOT Analysis
- 11.7.5. Key Strategies and Developments
- 11.8. Bine sp. z o. o.
- 11.8.1. Company Overview
- 11.8.2. Financial Highlights
- 11.8.3. Product Portfolio
- 11.8.4. SWOT Analysis
- 11.8.5. Key Strategies and Developments
- 11.9. Intuitive AI
- 11.9.1. Company Overview
- 11.9.2. Financial Highlights
- 11.9.3. Product Portfolio
- 11.9.4. SWOT Analysis
- 11.9.5. Key Strategies and Developments
- 11.10. Recycleye
- 11.10.1. Company Overview
- 11.10.2. Financial Highlights
- 11.10.3. Product Portfolio
- 11.10.4. SWOT Analysis
- 11.10.5. Key Strategies and Developments
- 11.11. Other Key Players
- 11.11.1. Company Overview
- 11.11.2. Financial Highlights
- 11.11.3. Product Portfolio
- 11.11.4. SWOT Analysis
- 11.11.5. Key Strategies and Developments
- 11.13.1. Company Overview
- 11.13.2. Financial Highlights
- 11.13.3. Product Portfolio
- 11.13.4. SWOT Analysis
- 11.13.5. Key Strategies and Developments
- 12. Assumptions and Acronyms
- 13. Research Methodology
- 14. Contact
"
- List of Figures
- "
- Figure 1: Global Generative AI in Waste Management Market Revenue (US$ Mn) Market Share by By Component in 2022
- Figure 2: Global Generative AI in Waste Management Market Market Attractiveness Analysis by By Component, 2016-2032
- Figure 3: Global Generative AI in Waste Management Market Revenue (US$ Mn) Market Share by By Applicationin 2022
- Figure 4: Global Generative AI in Waste Management Market Market Attractiveness Analysis by By Application, 2016-2032
- Figure 5: Global Generative AI in Waste Management Market Revenue (US$ Mn) Market Share by By End-Userin 2022
- Figure 6: Global Generative AI in Waste Management Market Market Attractiveness Analysis by By End-User, 2016-2032
- Figure 7: Global Generative AI in Waste Management Market Revenue (US$ Mn) Market Share by Region in 2022
- Figure 8: Global Generative AI in Waste Management Market Market Attractiveness Analysis by Region, 2016-2032
- Figure 9: Global Generative AI in Waste Management Market Market Revenue (US$ Mn) (2016-2032)
- Figure 10: Global Generative AI in Waste Management Market Market Revenue (US$ Mn) Comparison by Region (2016-2032)
- Figure 11: Global Generative AI in Waste Management Market Market Revenue (US$ Mn) Comparison by By Component (2016-2032)
- Figure 12: Global Generative AI in Waste Management Market Market Revenue (US$ Mn) Comparison by By Application (2016-2032)
- Figure 13: Global Generative AI in Waste Management Market Market Revenue (US$ Mn) Comparison by By End-User (2016-2032)
- Figure 14: Global Generative AI in Waste Management Market Market Y-o-Y Growth Rate Comparison by Region (2016-2032)
- Figure 15: Global Generative AI in Waste Management Market Market Y-o-Y Growth Rate Comparison by By Component (2016-2032)
- Figure 16: Global Generative AI in Waste Management Market Market Y-o-Y Growth Rate Comparison by By Application (2016-2032)
- Figure 17: Global Generative AI in Waste Management Market Market Y-o-Y Growth Rate Comparison by By End-User (2016-2032)
- Figure 18: Global Generative AI in Waste Management Market Market Share Comparison by Region (2016-2032)
- Figure 19: Global Generative AI in Waste Management Market Market Share Comparison by By Component (2016-2032)
- Figure 20: Global Generative AI in Waste Management Market Market Share Comparison by By Application (2016-2032)
- Figure 21: Global Generative AI in Waste Management Market Market Share Comparison by By End-User (2016-2032)
- Figure 22: North America Generative AI in Waste Management Market Revenue (US$ Mn) Market Share by By Componentin 2022
- Figure 23: North America Generative AI in Waste Management Market Market Attractiveness Analysis by By Component, 2016-2032
- Figure 24: North America Generative AI in Waste Management Market Revenue (US$ Mn) Market Share by By Applicationin 2022
- Figure 25: North America Generative AI in Waste Management Market Market Attractiveness Analysis by By Application, 2016-2032
- Figure 26: North America Generative AI in Waste Management Market Revenue (US$ Mn) Market Share by By End-Userin 2022
- Figure 27: North America Generative AI in Waste Management Market Market Attractiveness Analysis by By End-User, 2016-2032
- Figure 28: North America Generative AI in Waste Management Market Revenue (US$ Mn) Market Share by Country in 2022
- Figure 29: North America Generative AI in Waste Management Market Market Attractiveness Analysis by Country, 2016-2032
- Figure 30: North America Generative AI in Waste Management Market Market Revenue (US$ Mn) (2016-2032)
- Figure 31: North America Generative AI in Waste Management Market Market Revenue (US$ Mn) Comparison by Country (2016-2032)
- Figure 32: North America Generative AI in Waste Management Market Market Revenue (US$ Mn) Comparison by By Component (2016-2032)
- Figure 33: North America Generative AI in Waste Management Market Market Revenue (US$ Mn) Comparison by By Application (2016-2032)
- Figure 34: North America Generative AI in Waste Management Market Market Revenue (US$ Mn) Comparison by By End-User (2016-2032)
- Figure 35: North America Generative AI in Waste Management Market Market Y-o-Y Growth Rate Comparison by Country (2016-2032)
- Figure 36: North America Generative AI in Waste Management Market Market Y-o-Y Growth Rate Comparison by By Component (2016-2032)
- Figure 37: North America Generative AI in Waste Management Market Market Y-o-Y Growth Rate Comparison by By Application (2016-2032)
- Figure 38: North America Generative AI in Waste Management Market Market Y-o-Y Growth Rate Comparison by By End-User (2016-2032)
- Figure 39: North America Generative AI in Waste Management Market Market Share Comparison by Country (2016-2032)
- Figure 40: North America Generative AI in Waste Management Market Market Share Comparison by By Component (2016-2032)
- Figure 41: North America Generative AI in Waste Management Market Market Share Comparison by By Application (2016-2032)
- Figure 42: North America Generative AI in Waste Management Market Market Share Comparison by By End-User (2016-2032)
- Figure 43: Western Europe Generative AI in Waste Management Market Revenue (US$ Mn) Market Share by By Componentin 2022
- Figure 44: Western Europe Generative AI in Waste Management Market Market Attractiveness Analysis by By Component, 2016-2032
- Figure 45: Western Europe Generative AI in Waste Management Market Revenue (US$ Mn) Market Share by By Applicationin 2022
- Figure 46: Western Europe Generative AI in Waste Management Market Market Attractiveness Analysis by By Application, 2016-2032
- Figure 47: Western Europe Generative AI in Waste Management Market Revenue (US$ Mn) Market Share by By End-Userin 2022
- Figure 48: Western Europe Generative AI in Waste Management Market Market Attractiveness Analysis by By End-User, 2016-2032
- Figure 49: Western Europe Generative AI in Waste Management Market Revenue (US$ Mn) Market Share by Country in 2022
- Figure 50: Western Europe Generative AI in Waste Management Market Market Attractiveness Analysis by Country, 2016-2032
- Figure 51: Western Europe Generative AI in Waste Management Market Market Revenue (US$ Mn) (2016-2032)
- Figure 52: Western Europe Generative AI in Waste Management Market Market Revenue (US$ Mn) Comparison by Country (2016-2032)
- Figure 53: Western Europe Generative AI in Waste Management Market Market Revenue (US$ Mn) Comparison by By Component (2016-2032)
- Figure 54: Western Europe Generative AI in Waste Management Market Market Revenue (US$ Mn) Comparison by By Application (2016-2032)
- Figure 55: Western Europe Generative AI in Waste Management Market Market Revenue (US$ Mn) Comparison by By End-User (2016-2032)
- Figure 56: Western Europe Generative AI in Waste Management Market Market Y-o-Y Growth Rate Comparison by Country (2016-2032)
- Figure 57: Western Europe Generative AI in Waste Management Market Market Y-o-Y Growth Rate Comparison by By Component (2016-2032)
- Figure 58: Western Europe Generative AI in Waste Management Market Market Y-o-Y Growth Rate Comparison by By Application (2016-2032)
- Figure 59: Western Europe Generative AI in Waste Management Market Market Y-o-Y Growth Rate Comparison by By End-User (2016-2032)
- Figure 60: Western Europe Generative AI in Waste Management Market Market Share Comparison by Country (2016-2032)
- Figure 61: Western Europe Generative AI in Waste Management Market Market Share Comparison by By Component (2016-2032)
- Figure 62: Western Europe Generative AI in Waste Management Market Market Share Comparison by By Application (2016-2032)
- Figure 63: Western Europe Generative AI in Waste Management Market Market Share Comparison by By End-User (2016-2032)
- Figure 64: Eastern Europe Generative AI in Waste Management Market Revenue (US$ Mn) Market Share by By Componentin 2022
- Figure 65: Eastern Europe Generative AI in Waste Management Market Market Attractiveness Analysis by By Component, 2016-2032
- Figure 66: Eastern Europe Generative AI in Waste Management Market Revenue (US$ Mn) Market Share by By Applicationin 2022
- Figure 67: Eastern Europe Generative AI in Waste Management Market Market Attractiveness Analysis by By Application, 2016-2032
- Figure 68: Eastern Europe Generative AI in Waste Management Market Revenue (US$ Mn) Market Share by By End-Userin 2022
- Figure 69: Eastern Europe Generative AI in Waste Management Market Market Attractiveness Analysis by By End-User, 2016-2032
- Figure 70: Eastern Europe Generative AI in Waste Management Market Revenue (US$ Mn) Market Share by Country in 2022
- Figure 71: Eastern Europe Generative AI in Waste Management Market Market Attractiveness Analysis by Country, 2016-2032
- Figure 72: Eastern Europe Generative AI in Waste Management Market Market Revenue (US$ Mn) (2016-2032)
- Figure 73: Eastern Europe Generative AI in Waste Management Market Market Revenue (US$ Mn) Comparison by Country (2016-2032)
- Figure 74: Eastern Europe Generative AI in Waste Management Market Market Revenue (US$ Mn) Comparison by By Component (2016-2032)
- Figure 75: Eastern Europe Generative AI in Waste Management Market Market Revenue (US$ Mn) Comparison by By Application (2016-2032)
- Figure 76: Eastern Europe Generative AI in Waste Management Market Market Revenue (US$ Mn) Comparison by By End-User (2016-2032)
- Figure 77: Eastern Europe Generative AI in Waste Management Market Market Y-o-Y Growth Rate Comparison by Country (2016-2032)
- Figure 78: Eastern Europe Generative AI in Waste Management Market Market Y-o-Y Growth Rate Comparison by By Component (2016-2032)
- Figure 79: Eastern Europe Generative AI in Waste Management Market Market Y-o-Y Growth Rate Comparison by By Application (2016-2032)
- Figure 80: Eastern Europe Generative AI in Waste Management Market Market Y-o-Y Growth Rate Comparison by By End-User (2016-2032)
- Figure 81: Eastern Europe Generative AI in Waste Management Market Market Share Comparison by Country (2016-2032)
- Figure 82: Eastern Europe Generative AI in Waste Management Market Market Share Comparison by By Component (2016-2032)
- Figure 83: Eastern Europe Generative AI in Waste Management Market Market Share Comparison by By Application (2016-2032)
- Figure 84: Eastern Europe Generative AI in Waste Management Market Market Share Comparison by By End-User (2016-2032)
- Figure 85: APAC Generative AI in Waste Management Market Revenue (US$ Mn) Market Share by By Componentin 2022
- Figure 86: APAC Generative AI in Waste Management Market Market Attractiveness Analysis by By Component, 2016-2032
- Figure 87: APAC Generative AI in Waste Management Market Revenue (US$ Mn) Market Share by By Applicationin 2022
- Figure 88: APAC Generative AI in Waste Management Market Market Attractiveness Analysis by By Application, 2016-2032
- Figure 89: APAC Generative AI in Waste Management Market Revenue (US$ Mn) Market Share by By End-Userin 2022
- Figure 90: APAC Generative AI in Waste Management Market Market Attractiveness Analysis by By End-User, 2016-2032
- Figure 91: APAC Generative AI in Waste Management Market Revenue (US$ Mn) Market Share by Country in 2022
- Figure 92: APAC Generative AI in Waste Management Market Market Attractiveness Analysis by Country, 2016-2032
- Figure 93: APAC Generative AI in Waste Management Market Market Revenue (US$ Mn) (2016-2032)
- Figure 94: APAC Generative AI in Waste Management Market Market Revenue (US$ Mn) Comparison by Country (2016-2032)
- Figure 95: APAC Generative AI in Waste Management Market Market Revenue (US$ Mn) Comparison by By Component (2016-2032)
- Figure 96: APAC Generative AI in Waste Management Market Market Revenue (US$ Mn) Comparison by By Application (2016-2032)
- Figure 97: APAC Generative AI in Waste Management Market Market Revenue (US$ Mn) Comparison by By End-User (2016-2032)
- Figure 98: APAC Generative AI in Waste Management Market Market Y-o-Y Growth Rate Comparison by Country (2016-2032)
- Figure 99: APAC Generative AI in Waste Management Market Market Y-o-Y Growth Rate Comparison by By Component (2016-2032)
- Figure 100: APAC Generative AI in Waste Management Market Market Y-o-Y Growth Rate Comparison by By Application (2016-2032)
- Figure 101: APAC Generative AI in Waste Management Market Market Y-o-Y Growth Rate Comparison by By End-User (2016-2032)
- Figure 102: APAC Generative AI in Waste Management Market Market Share Comparison by Country (2016-2032)
- Figure 103: APAC Generative AI in Waste Management Market Market Share Comparison by By Component (2016-2032)
- Figure 104: APAC Generative AI in Waste Management Market Market Share Comparison by By Application (2016-2032)
- Figure 105: APAC Generative AI in Waste Management Market Market Share Comparison by By End-User (2016-2032)
- Figure 106: Latin America Generative AI in Waste Management Market Revenue (US$ Mn) Market Share by By Componentin 2022
- Figure 107: Latin America Generative AI in Waste Management Market Market Attractiveness Analysis by By Component, 2016-2032
- Figure 108: Latin America Generative AI in Waste Management Market Revenue (US$ Mn) Market Share by By Applicationin 2022
- Figure 109: Latin America Generative AI in Waste Management Market Market Attractiveness Analysis by By Application, 2016-2032
- Figure 110: Latin America Generative AI in Waste Management Market Revenue (US$ Mn) Market Share by By End-Userin 2022
- Figure 111: Latin America Generative AI in Waste Management Market Market Attractiveness Analysis by By End-User, 2016-2032
- Figure 112: Latin America Generative AI in Waste Management Market Revenue (US$ Mn) Market Share by Country in 2022
- Figure 113: Latin America Generative AI in Waste Management Market Market Attractiveness Analysis by Country, 2016-2032
- Figure 114: Latin America Generative AI in Waste Management Market Market Revenue (US$ Mn) (2016-2032)
- Figure 115: Latin America Generative AI in Waste Management Market Market Revenue (US$ Mn) Comparison by Country (2016-2032)
- Figure 116: Latin America Generative AI in Waste Management Market Market Revenue (US$ Mn) Comparison by By Component (2016-2032)
- Figure 117: Latin America Generative AI in Waste Management Market Market Revenue (US$ Mn) Comparison by By Application (2016-2032)
- Figure 118: Latin America Generative AI in Waste Management Market Market Revenue (US$ Mn) Comparison by By End-User (2016-2032)
- Figure 119: Latin America Generative AI in Waste Management Market Market Y-o-Y Growth Rate Comparison by Country (2016-2032)
- Figure 120: Latin America Generative AI in Waste Management Market Market Y-o-Y Growth Rate Comparison by By Component (2016-2032)
- Figure 121: Latin America Generative AI in Waste Management Market Market Y-o-Y Growth Rate Comparison by By Application (2016-2032)
- Figure 122: Latin America Generative AI in Waste Management Market Market Y-o-Y Growth Rate Comparison by By End-User (2016-2032)
- Figure 123: Latin America Generative AI in Waste Management Market Market Share Comparison by Country (2016-2032)
- Figure 124: Latin America Generative AI in Waste Management Market Market Share Comparison by By Component (2016-2032)
- Figure 125: Latin America Generative AI in Waste Management Market Market Share Comparison by By Application (2016-2032)
- Figure 126: Latin America Generative AI in Waste Management Market Market Share Comparison by By End-User (2016-2032)
- Figure 127: Middle East & Africa Generative AI in Waste Management Market Revenue (US$ Mn) Market Share by By Componentin 2022
- Figure 128: Middle East & Africa Generative AI in Waste Management Market Market Attractiveness Analysis by By Component, 2016-2032
- Figure 129: Middle East & Africa Generative AI in Waste Management Market Revenue (US$ Mn) Market Share by By Applicationin 2022
- Figure 130: Middle East & Africa Generative AI in Waste Management Market Market Attractiveness Analysis by By Application, 2016-2032
- Figure 131: Middle East & Africa Generative AI in Waste Management Market Revenue (US$ Mn) Market Share by By End-Userin 2022
- Figure 132: Middle East & Africa Generative AI in Waste Management Market Market Attractiveness Analysis by By End-User, 2016-2032
- Figure 133: Middle East & Africa Generative AI in Waste Management Market Revenue (US$ Mn) Market Share by Country in 2022
- Figure 134: Middle East & Africa Generative AI in Waste Management Market Market Attractiveness Analysis by Country, 2016-2032
- Figure 135: Middle East & Africa Generative AI in Waste Management Market Market Revenue (US$ Mn) (2016-2032)
- Figure 136: Middle East & Africa Generative AI in Waste Management Market Market Revenue (US$ Mn) Comparison by Country (2016-2032)
- Figure 137: Middle East & Africa Generative AI in Waste Management Market Market Revenue (US$ Mn) Comparison by By Component (2016-2032)
- Figure 138: Middle East & Africa Generative AI in Waste Management Market Market Revenue (US$ Mn) Comparison by By Application (2016-2032)
- Figure 139: Middle East & Africa Generative AI in Waste Management Market Market Revenue (US$ Mn) Comparison by By End-User (2016-2032)
- Figure 140: Middle East & Africa Generative AI in Waste Management Market Market Y-o-Y Growth Rate Comparison by Country (2016-2032)
- Figure 141: Middle East & Africa Generative AI in Waste Management Market Market Y-o-Y Growth Rate Comparison by By Component (2016-2032)
- Figure 142: Middle East & Africa Generative AI in Waste Management Market Market Y-o-Y Growth Rate Comparison by By Application (2016-2032)
- Figure 143: Middle East & Africa Generative AI in Waste Management Market Market Y-o-Y Growth Rate Comparison by By End-User (2016-2032)
- Figure 144: Middle East & Africa Generative AI in Waste Management Market Market Share Comparison by Country (2016-2032)
- Figure 145: Middle East & Africa Generative AI in Waste Management Market Market Share Comparison by By Component (2016-2032)
- Figure 146: Middle East & Africa Generative AI in Waste Management Market Market Share Comparison by By Application (2016-2032)
- Figure 147: Middle East & Africa Generative AI in Waste Management Market Market Share Comparison by By End-User (2016-2032)
"
- List of Tables
- "
- Table 1: Global Generative AI in Waste Management Market Market Comparison by By Component (2016-2032)
- Table 2: Global Generative AI in Waste Management Market Market Comparison by By Application (2016-2032)
- Table 3: Global Generative AI in Waste Management Market Market Comparison by By End-User (2016-2032)
- Table 4: Global Generative AI in Waste Management Market Revenue (US$ Mn) Comparison by Region (2016-2032)
- Table 5: Global Generative AI in Waste Management Market Market Revenue (US$ Mn) (2016-2032)
- Table 6: Global Generative AI in Waste Management Market Market Revenue (US$ Mn) Comparison by Region (2016-2032)
- Table 7: Global Generative AI in Waste Management Market Market Revenue (US$ Mn) Comparison by By Component (2016-2032)
- Table 8: Global Generative AI in Waste Management Market Market Revenue (US$ Mn) Comparison by By Application (2016-2032)
- Table 9: Global Generative AI in Waste Management Market Market Revenue (US$ Mn) Comparison by By End-User (2016-2032)
- Table 10: Global Generative AI in Waste Management Market Market Y-o-Y Growth Rate Comparison by Region (2016-2032)
- Table 11: Global Generative AI in Waste Management Market Market Y-o-Y Growth Rate Comparison by By Component (2016-2032)
- Table 12: Global Generative AI in Waste Management Market Market Y-o-Y Growth Rate Comparison by By Application (2016-2032)
- Table 13: Global Generative AI in Waste Management Market Market Y-o-Y Growth Rate Comparison by By End-User (2016-2032)
- Table 14: Global Generative AI in Waste Management Market Market Share Comparison by Region (2016-2032)
- Table 15: Global Generative AI in Waste Management Market Market Share Comparison by By Component (2016-2032)
- Table 16: Global Generative AI in Waste Management Market Market Share Comparison by By Application (2016-2032)
- Table 17: Global Generative AI in Waste Management Market Market Share Comparison by By End-User (2016-2032)
- Table 18: North America Generative AI in Waste Management Market Market Comparison by By Application (2016-2032)
- Table 19: North America Generative AI in Waste Management Market Market Comparison by By End-User (2016-2032)
- Table 20: North America Generative AI in Waste Management Market Revenue (US$ Mn) Comparison by Country (2016-2032)
- Table 21: North America Generative AI in Waste Management Market Market Revenue (US$ Mn) (2016-2032)
- Table 22: North America Generative AI in Waste Management Market Market Revenue (US$ Mn) Comparison by Country (2016-2032)
- Table 23: North America Generative AI in Waste Management Market Market Revenue (US$ Mn) Comparison by By Component (2016-2032)
- Table 24: North America Generative AI in Waste Management Market Market Revenue (US$ Mn) Comparison by By Application (2016-2032)
- Table 25: North America Generative AI in Waste Management Market Market Revenue (US$ Mn) Comparison by By End-User (2016-2032)
- Table 26: North America Generative AI in Waste Management Market Market Y-o-Y Growth Rate Comparison by Country (2016-2032)
- Table 27: North America Generative AI in Waste Management Market Market Y-o-Y Growth Rate Comparison by By Component (2016-2032)
- Table 28: North America Generative AI in Waste Management Market Market Y-o-Y Growth Rate Comparison by By Application (2016-2032)
- Table 29: North America Generative AI in Waste Management Market Market Y-o-Y Growth Rate Comparison by By End-User (2016-2032)
- Table 30: North America Generative AI in Waste Management Market Market Share Comparison by Country (2016-2032)
- Table 31: North America Generative AI in Waste Management Market Market Share Comparison by By Component (2016-2032)
- Table 32: North America Generative AI in Waste Management Market Market Share Comparison by By Application (2016-2032)
- Table 33: North America Generative AI in Waste Management Market Market Share Comparison by By End-User (2016-2032)
- Table 34: Western Europe Generative AI in Waste Management Market Market Comparison by By Component (2016-2032)
- Table 35: Western Europe Generative AI in Waste Management Market Market Comparison by By Application (2016-2032)
- Table 36: Western Europe Generative AI in Waste Management Market Market Comparison by By End-User (2016-2032)
- Table 37: Western Europe Generative AI in Waste Management Market Revenue (US$ Mn) Comparison by Country (2016-2032)
- Table 38: Western Europe Generative AI in Waste Management Market Market Revenue (US$ Mn) (2016-2032)
- Table 39: Western Europe Generative AI in Waste Management Market Market Revenue (US$ Mn) Comparison by Country (2016-2032)
- Table 40: Western Europe Generative AI in Waste Management Market Market Revenue (US$ Mn) Comparison by By Component (2016-2032)
- Table 41: Western Europe Generative AI in Waste Management Market Market Revenue (US$ Mn) Comparison by By Application (2016-2032)
- Table 42: Western Europe Generative AI in Waste Management Market Market Revenue (US$ Mn) Comparison by By End-User (2016-2032)
- Table 43: Western Europe Generative AI in Waste Management Market Market Y-o-Y Growth Rate Comparison by Country (2016-2032)
- Table 44: Western Europe Generative AI in Waste Management Market Market Y-o-Y Growth Rate Comparison by By Component (2016-2032)
- Table 45: Western Europe Generative AI in Waste Management Market Market Y-o-Y Growth Rate Comparison by By Application (2016-2032)
- Table 46: Western Europe Generative AI in Waste Management Market Market Y-o-Y Growth Rate Comparison by By End-User (2016-2032)
- Table 47: Western Europe Generative AI in Waste Management Market Market Share Comparison by Country (2016-2032)
- Table 48: Western Europe Generative AI in Waste Management Market Market Share Comparison by By Component (2016-2032)
- Table 49: Western Europe Generative AI in Waste Management Market Market Share Comparison by By Application (2016-2032)
- Table 50: Western Europe Generative AI in Waste Management Market Market Share Comparison by By End-User (2016-2032)
- Table 51: Eastern Europe Generative AI in Waste Management Market Market Comparison by By Component (2016-2032)
- Table 52: Eastern Europe Generative AI in Waste Management Market Market Comparison by By Application (2016-2032)
- Table 53: Eastern Europe Generative AI in Waste Management Market Market Comparison by By End-User (2016-2032)
- Table 54: Eastern Europe Generative AI in Waste Management Market Revenue (US$ Mn) Comparison by Country (2016-2032)
- Table 55: Eastern Europe Generative AI in Waste Management Market Market Revenue (US$ Mn) (2016-2032)
- Table 56: Eastern Europe Generative AI in Waste Management Market Market Revenue (US$ Mn) Comparison by Country (2016-2032)
- Table 57: Eastern Europe Generative AI in Waste Management Market Market Revenue (US$ Mn) Comparison by By Component (2016-2032)
- Table 58: Eastern Europe Generative AI in Waste Management Market Market Revenue (US$ Mn) Comparison by By Application (2016-2032)
- Table 59: Eastern Europe Generative AI in Waste Management Market Market Revenue (US$ Mn) Comparison by By End-User (2016-2032)
- Table 60: Eastern Europe Generative AI in Waste Management Market Market Y-o-Y Growth Rate Comparison by Country (2016-2032)
- Table 61: Eastern Europe Generative AI in Waste Management Market Market Y-o-Y Growth Rate Comparison by By Component (2016-2032)
- Table 62: Eastern Europe Generative AI in Waste Management Market Market Y-o-Y Growth Rate Comparison by By Application (2016-2032)
- Table 63: Eastern Europe Generative AI in Waste Management Market Market Y-o-Y Growth Rate Comparison by By End-User (2016-2032)
- Table 64: Eastern Europe Generative AI in Waste Management Market Market Share Comparison by Country (2016-2032)
- Table 65: Eastern Europe Generative AI in Waste Management Market Market Share Comparison by By Component (2016-2032)
- Table 66: Eastern Europe Generative AI in Waste Management Market Market Share Comparison by By Application (2016-2032)
- Table 67: Eastern Europe Generative AI in Waste Management Market Market Share Comparison by By End-User (2016-2032)
- Table 68: APAC Generative AI in Waste Management Market Market Comparison by By Component (2016-2032)
- Table 69: APAC Generative AI in Waste Management Market Market Comparison by By Application (2016-2032)
- Table 70: APAC Generative AI in Waste Management Market Market Comparison by By End-User (2016-2032)
- Table 71: APAC Generative AI in Waste Management Market Revenue (US$ Mn) Comparison by Country (2016-2032)
- Table 72: APAC Generative AI in Waste Management Market Market Revenue (US$ Mn) (2016-2032)
- Table 73: APAC Generative AI in Waste Management Market Market Revenue (US$ Mn) Comparison by Country (2016-2032)
- Table 74: APAC Generative AI in Waste Management Market Market Revenue (US$ Mn) Comparison by By Component (2016-2032)
- Table 75: APAC Generative AI in Waste Management Market Market Revenue (US$ Mn) Comparison by By Application (2016-2032)
- Table 76: APAC Generative AI in Waste Management Market Market Revenue (US$ Mn) Comparison by By End-User (2016-2032)
- Table 77: APAC Generative AI in Waste Management Market Market Y-o-Y Growth Rate Comparison by Country (2016-2032)
- Table 78: APAC Generative AI in Waste Management Market Market Y-o-Y Growth Rate Comparison by By Component (2016-2032)
- Table 79: APAC Generative AI in Waste Management Market Market Y-o-Y Growth Rate Comparison by By Application (2016-2032)
- Table 80: APAC Generative AI in Waste Management Market Market Y-o-Y Growth Rate Comparison by By End-User (2016-2032)
- Table 81: APAC Generative AI in Waste Management Market Market Share Comparison by Country (2016-2032)
- Table 82: APAC Generative AI in Waste Management Market Market Share Comparison by By Component (2016-2032)
- Table 83: APAC Generative AI in Waste Management Market Market Share Comparison by By Application (2016-2032)
- Table 84: APAC Generative AI in Waste Management Market Market Share Comparison by By End-User (2016-2032)
- Table 85: Latin America Generative AI in Waste Management Market Market Comparison by By Component (2016-2032)
- Table 86: Latin America Generative AI in Waste Management Market Market Comparison by By Application (2016-2032)
- Table 87: Latin America Generative AI in Waste Management Market Market Comparison by By End-User (2016-2032)
- Table 88: Latin America Generative AI in Waste Management Market Revenue (US$ Mn) Comparison by Country (2016-2032)
- Table 89: Latin America Generative AI in Waste Management Market Market Revenue (US$ Mn) (2016-2032)
- Table 90: Latin America Generative AI in Waste Management Market Market Revenue (US$ Mn) Comparison by Country (2016-2032)
- Table 91: Latin America Generative AI in Waste Management Market Market Revenue (US$ Mn) Comparison by By Component (2016-2032)
- Table 92: Latin America Generative AI in Waste Management Market Market Revenue (US$ Mn) Comparison by By Application (2016-2032)
- Table 93: Latin America Generative AI in Waste Management Market Market Revenue (US$ Mn) Comparison by By End-User (2016-2032)
- Table 94: Latin America Generative AI in Waste Management Market Market Y-o-Y Growth Rate Comparison by Country (2016-2032)
- Table 95: Latin America Generative AI in Waste Management Market Market Y-o-Y Growth Rate Comparison by By Component (2016-2032)
- Table 96: Latin America Generative AI in Waste Management Market Market Y-o-Y Growth Rate Comparison by By Application (2016-2032)
- Table 97: Latin America Generative AI in Waste Management Market Market Y-o-Y Growth Rate Comparison by By End-User (2016-2032)
- Table 98: Latin America Generative AI in Waste Management Market Market Share Comparison by Country (2016-2032)
- Table 99: Latin America Generative AI in Waste Management Market Market Share Comparison by By Component (2016-2032)
- Table 100: Latin America Generative AI in Waste Management Market Market Share Comparison by By Application (2016-2032)
- Table 101: Latin America Generative AI in Waste Management Market Market Share Comparison by By End-User (2016-2032)
- Table 102: Middle East & Africa Generative AI in Waste Management Market Market Comparison by By Component (2016-2032)
- Table 103: Middle East & Africa Generative AI in Waste Management Market Market Comparison by By Application (2016-2032)
- Table 104: Middle East & Africa Generative AI in Waste Management Market Market Comparison by By End-User (2016-2032)
- Table 105: Middle East & Africa Generative AI in Waste Management Market Revenue (US$ Mn) Comparison by Country (2016-2032)
- Table 106: Middle East & Africa Generative AI in Waste Management Market Market Revenue (US$ Mn) (2016-2032)
- Table 107: Middle East & Africa Generative AI in Waste Management Market Market Revenue (US$ Mn) Comparison by Country (2016-2032)
- Table 108: Middle East & Africa Generative AI in Waste Management Market Market Revenue (US$ Mn) Comparison by By Component (2016-2032)
- Table 109: Middle East & Africa Generative AI in Waste Management Market Market Revenue (US$ Mn) Comparison by By Application (2016-2032)
- Table 110: Middle East & Africa Generative AI in Waste Management Market Market Revenue (US$ Mn) Comparison by By End-User (2016-2032)
- Table 111: Middle East & Africa Generative AI in Waste Management Market Market Y-o-Y Growth Rate Comparison by Country (2016-2032)
- Table 112: Middle East & Africa Generative AI in Waste Management Market Market Y-o-Y Growth Rate Comparison by By Component (2016-2032)
- Table 113: Middle East & Africa Generative AI in Waste Management Market Market Y-o-Y Growth Rate Comparison by By Application (2016-2032)
- Table 114: Middle East & Africa Generative AI in Waste Management Market Market Y-o-Y Growth Rate Comparison by By End-User (2016-2032)
- Table 115: Middle East & Africa Generative AI in Waste Management Market Market Share Comparison by Country (2016-2032)
- Table 116: Middle East & Africa Generative AI in Waste Management Market Market Share Comparison by By Component (2016-2032)
- Table 117: Middle East & Africa Generative AI in Waste Management Market Market Share Comparison by By Application (2016-2032)
- Table 118: Middle East & Africa Generative AI in Waste Management Market Market Share Comparison by By End-User (2016-2032)
- 1. Executive Summary
-
- IBM Corporation
- Amazon Web Services, Inc.
- Microsoft Corporation
- CleanRobotics
- Greyparrot AI
- Bine sp. z o. o.
- Intuitive AI
- Recycleye
- Other Key Players
Our Clients


View Our Licence Options
