Generative AI in Virtual Reality Market Report By Component (Software, Hardware), By Application (Entertainment and Gaming, Healthcare, Education and Training, Retail and E-Commerce, Manufacturing and Design, Other Applications), By End-User (Enterprises, Individuals)By Region and Companies - Industry Segment Outlook, Market Assessment, Competition Scenario, Trends and Forecast 2024-2033
-
44214
-
March 2024
-
270
-


-
This report was compiled by Vishwa Gaul Vishwa is an experienced market research and consulting professional with over 8 years of expertise in the ICT industry, contributing to over 700 reports across telecommunications, software, hardware, and digital solutions. Correspondence Team Lead- ICT Linkedin | Detailed Market research Methodology Our methodology involves a mix of primary research, including interviews with leading mental health experts, and secondary research from reputable medical journals and databases. View Detailed Methodology Page
-
Quick Navigation
Report Overview
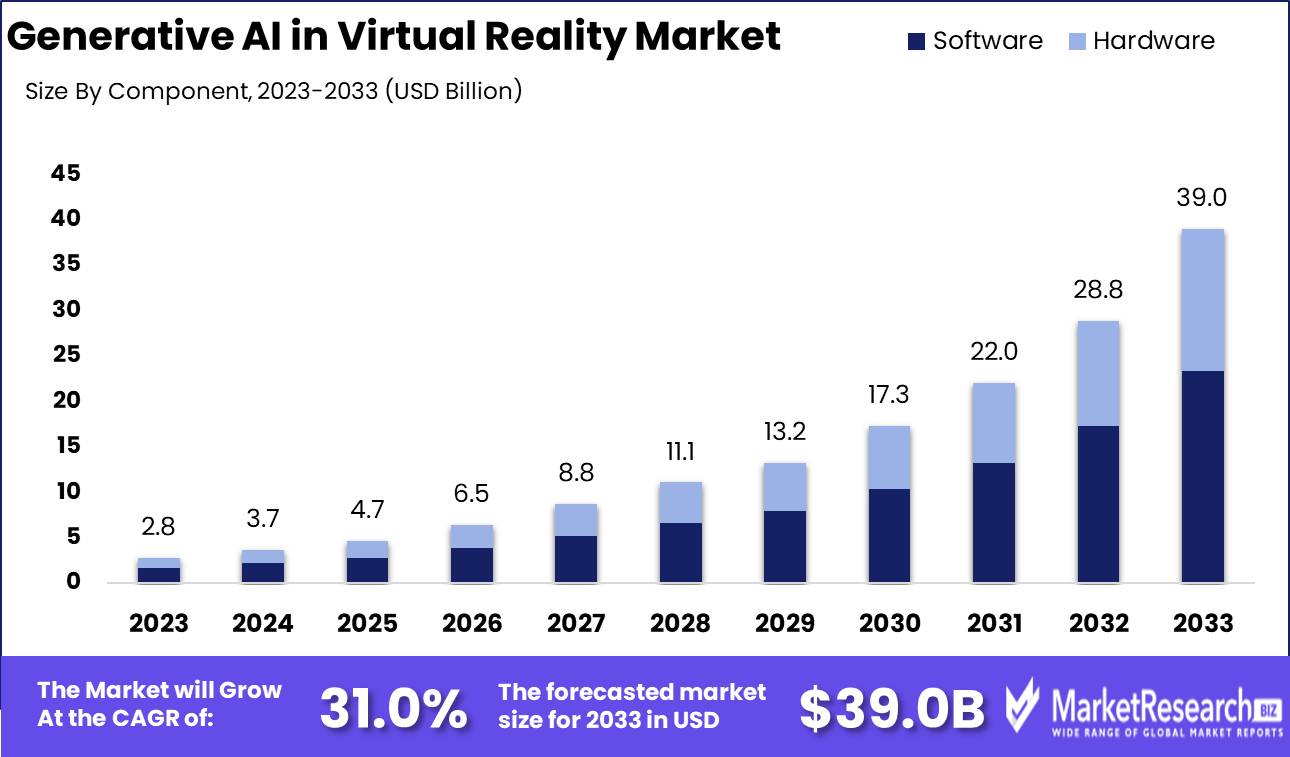
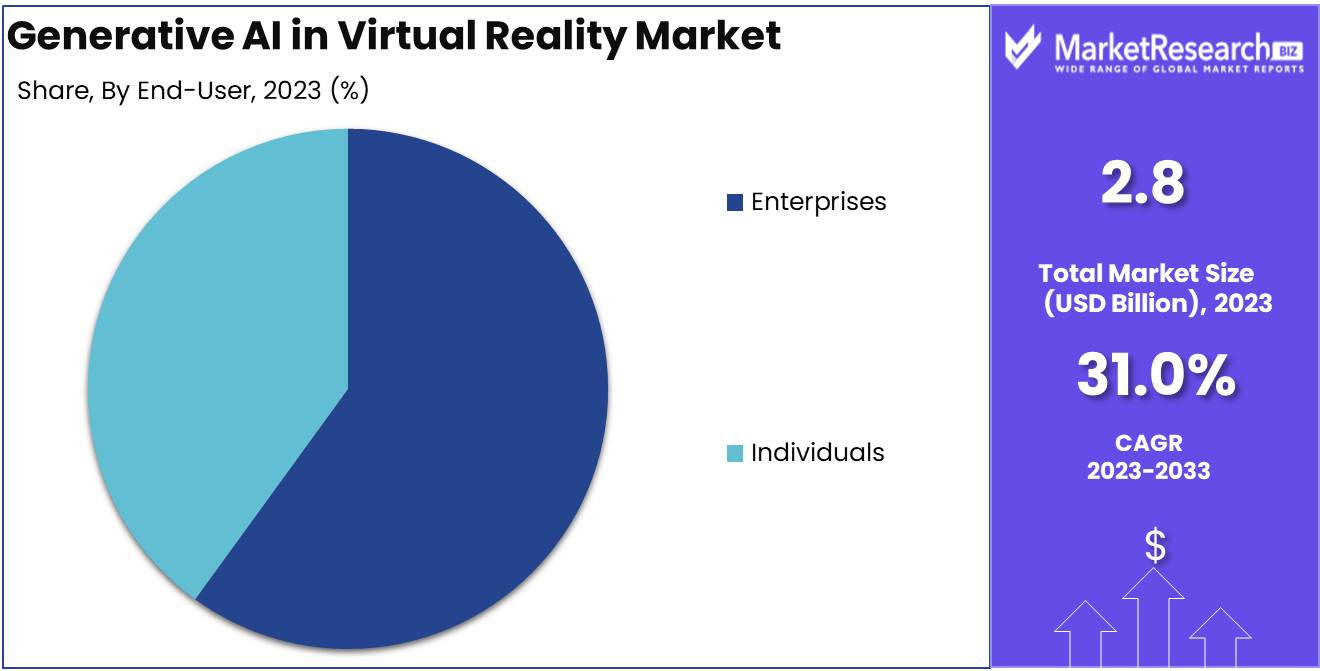
The Global Generative AI in Virtual Reality Market size is expected to be worth around USD 39.0 Billion by 2033, from USD 2.8 Billion in 2023, growing at a CAGR of 31.0% during the forecast period from 2024 to 2033.
The surge in demand for the new advanced technologies and rise in customer interest for VRs are some of the main key driving factors for the generative AI in virtual reality.
The generative AI in the virtual reality is defined as the advanced technologies that uses machine learning algorithms to unconventionally produce immersive and interactive virtual surroundings, objects and experiences. It uses deep learning methods to analyze user interactions, choices and environmental information by making the creation of dynamic and realistic VR content in real-time.
In the VR market, it improves the development techniques by automating tasks like scene production, object manipulation and spatial navigation, thereby decreasing generation time and expenses. It also makes the building of customized VR experience customized to individual user choices by leading to more engaging and impacting interactions.
Gen AI in VR nurtures new innovations by encouraging developers to discover new design chances and experiments with novel concepts. Moreover, it simplifies the combination of AI-driven features like intelligent NPCs, adaptive storytelling and practical content production, improving the immersion and realism of VR surroundings. Generative AI is transforming the VR market by propelling the boundaries of creativity, interactivity and user engagement in virtual experience.
According to an article published by Queppelin in June 2023, highlights that in 2023, there are 65.9 million virtual reality users and 110.1 million VR users in the US. Additionally, 75% of the firms that have implemented large scale VR and AR technologies that witnesses 10% surge in operations. Boeing is using VR in the manufacturing of its 737 Max 10.
Moreover, the VR has led to 275% improvement in workforce confidence regarding the lessons learned and helps minimize the staff attrition rates, nurturing greater job attachments. NVIDIA, the American multinational in using generative AI to make its 3D virtual world more realistic and engaging.
Generative AI in VR provides fastening of the content creation by making dynamic and immersive surrounding. It provides customization by personalizing virtual environments to individual user choices. Moreover, it nurtures new innovations through the automation of design tasks and the development of interactive and realistic VR content by ultimately enhancing user engagement, satisfaction and experience. The demand for the generative AI in VR will increase due to its requirement in the graphics and rise in 3D models by various industries will help in market expansion in the coming years.
Key Takeaways
- Market Value: The Global Generative AI in Virtual Reality (VR) Market is projected to reach USD 39.0 Billion by 2033, showing substantial growth from USD 2.8 Billion in 2023 , with a CAGR of 31.0% during the forecast period from 2024 to 2033.
- Dominant Segments:
- Component Analysis: Software, Emerges as the dominant sub-segment, driven by increasing demand for sophisticated AI algorithms to create immersive virtual environments across various industries.
- Application Analysis: Entertainment and Gaming, Stands out as the dominant market driver, leveraging generative AI to create immersive gaming experiences, attracting significant investment and consumer interest.
- Regional Analysis:
- North America: Dominates the market with a 42% market share, driven by technological innovation and substantial investment in VR technologies.
- Europe: Follows closely with approximately 28% market share, supported by strong academic and research infrastructure in AI and VR, along with favorable government policies promoting innovation.
- Analyst Viewpoint: The market's growth is fueled by the increasing demand for immersive and interactive experiences across industries, with VR technologies powered by generative AI leading innovation. Opportunities lie in addressing hardware challenges, expanding application areas, and enhancing user experiences to drive broader adoption.
- Market Key Players: Major players include Unity Technologies, NVIDIA Corporation, Google, Oculus VR (Facebook Technologies), Microsoft Corporation, Adobe Inc., IBM Corporation, Epic Games, Magic Leap, and others, driving innovation and investment in generative AI-driven VR technologies across industries, shaping the future of immersive experiences.
Driving Factors
Immersive Content Creation Fuels VR Innovation
Generative AI is transforming the Virtual Reality (VR) industry by enabling the creation of highly realistic and immersive content. It can generate intricate virtual environments, characters, and objects from simple textual descriptions or existing assets, paving the way for more rich and engaging VR experiences.
This capability significantly reduces the time and effort required to produce detailed virtual worlds, democratizing content creation and allowing developers to focus on innovation and storytelling. The ability to rapidly create content with Generative AI not only attracts more creators to the VR field but also enhances user engagement, driving market growth by expanding the possibilities for VR applications across entertainment, education, and training.
Personalized and Adaptive VR Experiences Increase User Engagement
Generative AI's capacity to analyze user data, preferences, and behavior to tailor VR experiences to individual users marks a significant advancement in personalization. This personalization enhances user engagement and immersion, making virtual experiences more relevant and impactful for each user.
The ability to offer adaptive VR experiences that cater to the unique interests and needs of users can significantly improve satisfaction and retention rates, contributing to the growth of the VR market. As VR becomes increasingly integrated into various sectors, the demand for personalized and adaptive experiences will likely rise, positioning Generative AI as a key driver of market expansion.
Real-time Environment Generation Elevates Interactive VR
The development of dynamic and responsive virtual environments through Generative AI enables VR experiences that are not just immersive but also interactive and evolving in real-time. This innovation allows VR environments to adapt to user actions and choices, creating a more engaging and lifelike experience.
The capability for real-time environment generation transforms VR from a static, pre-designed experience to an interactive journey that can change and evolve, providing endless possibilities for exploration and interaction. Such interactive experiences are crucial for the application of VR in gaming, simulations, and educational tools, promoting user engagement and driving the growth of the VR market. Generative AI's role in enabling real-time adaptability and evolution of VR content underscores its significance in the industry's expansion, offering a glimpse into the future of virtual interactions.
Restraining Factors
Ethical and Societal Concerns Restrain Market Growth
The integration of Generative AI into virtual reality (VR) is significantly hindered by ethical and societal concerns. These concerns primarily revolve around the potential misuse of AI technologies to craft immersive VR experiences that could promote harmful stereotypes, spread extremist ideologies, or expose users to unsettling content.
Moreover, the realism offered by Generative AI-powered VR has the potential to obscure the boundary between reality and virtual realms, posing risks of addiction or mental health issues such as dissociative disorders among users. The apprehension over these ethical issues invites stringent regulatory scrutiny, which could stifle innovation and adoption within the market. While specific statistics on the impact of these concerns are scarce, it's evident that the industry faces a delicate balance in fostering technological advancement while ensuring ethical use and safeguarding users' well-being.
Technical Limitations and Performance Constraints Restrain Market Growth
Technical limitations and performance constraints serve as significant barriers to the widespread adoption of Generative AI in VR. Despite the promise of creating detailed and realistic virtual environments, the requisite computational power exceeds the capabilities of most consumer-grade VR hardware available today. The creation of high-fidelity virtual assets in real-time demands extensive processing power and advanced AI algorithms, which are currently beyond the reach of average consumers.
Furthermore, the visual realism and natural behavior of AI-generated content often fall short when compared to human-crafted assets, diminishing the user experience. These technical hurdles not only impede the development of high-quality VR applications but also limit their accessibility to a broader audience. As such, the advancement of Generative AI in the VR market is curtailed, awaiting technological breakthroughs that can overcome these performance constraints.
Component Analysis
In the rapidly evolving Generative AI in Virtual Reality (VR) market, the component segment is bifurcated into software and hardware, with software emerging as the dominant sub-segment. This dominance can be attributed to the increasing demand for sophisticated AI algorithms and applications capable of creating immersive, realistic virtual environments.
Software solutions are at the core of generative AI, enabling the development of content that is not only innovative but also customizable to a wide range of VR experiences. The proliferation of software-centric AI applications across various industries, from gaming to healthcare, underscores its pivotal role in driving market growth.
Hardware, while essential for delivering VR experiences, has not evolved at the same pace as software solutions. The high costs associated with advanced VR hardware and the rapid obsolescence of technology pose challenges to its market growth. However, hardware developments remain crucial for enhancing the immersive experience of VR by improving the interface and interaction mechanisms within virtual environments. As such, advancements in VR hardware are expected to complement software developments, facilitating broader adoption and usage of generative AI in VR across different sectors.
Application Analysis
Among the various applications of Generative AI in VR, the Entertainment and Gaming segment stands out as the dominant market driver. This segment's growth is fueled by the gaming industry's continuous search for more immersive and engaging experiences, leveraging generative AI to create dynamic, unpredictable game environments and narratives. The appeal of highly realistic and interactive VR gaming experiences has not only captivated a vast consumer base but also attracted significant investment from major tech companies, further propelling the segment's growth.
Other notable applications of generative AI in VR include Healthcare, Education and Training, Retail and E-Commerce, and Manufacturing and Design. In healthcare, VR applications are transforming surgical training and patient care, offering simulations that provide hands-on experience without real-world risks. Education and training sectors benefit from VR's immersive learning environments, enhancing understanding and retention.
Retail and e-commerce are leveraging VR to offer virtual try-ons and immersive shopping experiences, while manufacturing and design use VR for product visualization and prototyping, significantly reducing development time and costs. Each of these segments contributes to the overall growth of the generative AI in VR market, albeit to varying extents.
End-User Analysis
The Generative AI in VR market caters to two primary end-user groups: enterprises and individuals, with enterprises emerging as the dominant segment. This predominance is driven by businesses' growing recognition of VR's potential to revolutionize industries by enabling immersive training environments, enhancing product design and visualization, and offering new ways to engage with customers. Enterprises are increasingly investing in VR technologies to gain a competitive edge, improve operational efficiency, and create novel customer experiences.
Individual consumers, while forming a significant market segment, have seen slower adoption rates due to the high costs of VR hardware and the niche appeal of certain VR applications. However, this segment is expected to grow as VR technologies become more accessible and as generative AI-driven content broadens the appeal of VR experiences beyond gaming and entertainment to include educational and social applications. As technological advancements continue to lower barriers to entry, individual adoption of generative AI in VR is poised to increase, further diversifying the market's end-user base.
Key Market Segments
By Component
- Software
- Hardware
By Application
- Entertainment and Gaming
- Healthcare
- Education and Training
- Retail and E-Commerce
- Manufacturing and Design
- Other Applications
By End-User
- Enterprises
- Individuals
Growth Opportunities
Personalized and Adaptive VR Experiences Offer Growth Opportunity
Personalization in virtual reality (VR) powered by Generative AI models presents a significant growth opportunity within the market. By leveraging user data and behaviors, these AI models can create VR experiences that are uniquely tailored to individual preferences and needs, significantly enhancing user engagement and immersion. This personalized approach not only increases the value proposition of VR applications but also encourages longer usage times and greater satisfaction among users.
The ability to dynamically adjust content based on real-time feedback further strengthens the relationship between users and the virtual environment, making VR experiences more relevant and impactful. As demand for customized experiences rises, the segment poised to benefit the most is the entertainment and gaming industry, where personalization can lead to deeper emotional connections with content. Although specific statistics on adoption rates and market growth due to personalization are not provided, the trend towards customization in digital experiences suggests a promising avenue for expansion in the VR market.
Real-time Environment Generation Offers Growth Opportunity
The capability of Generative AI to produce dynamic and responsive virtual environments in real-time is revolutionizing the VR industry, offering unparalleled growth opportunities. This real-time adaptability creates a more immersive and interactive experience, as virtual scenarios evolve in response to user actions, making each VR journey unique. Such interactivity is crucial for sectors like training and education, where the realism and responsiveness of the environment can greatly enhance learning outcomes.
Moreover, the entertainment sector stands to gain significantly, as real-time environment generation can lead to more engaging and unpredictable gaming experiences. This technology's ability to create detailed and interactive worlds without extensive manual input reduces development times and costs, making high-quality VR experiences more accessible. While detailed statistics on market expansion due to real-time environment generation are not specified, the increasing demand for interactive and immersive VR experiences suggests a substantial potential for growth in this area.
Trending Factors
Intelligent Virtual Agents and Avatars Are Trending Factors
Intelligent virtual agents and avatars, powered by Generative AI, are becoming pivotal in shaping the future of virtual reality (VR). Their ability to mimic human-like interactions through natural language, realistic facial expressions, and behaviors significantly enhances social interaction and storytelling within VR environments.
This leap towards creating deeply immersive experiences is why intelligent agents and avatars are trending in the VR market. They bridge the gap between digital and real-world interactions, making virtual experiences more relatable and engaging. The demand for such advanced interaction capabilities in VR applications is on the rise, indicating a significant trend towards more socially interactive and narrative-rich virtual environments.
Procedural Content Generation Are Trending Factors
Procedural content generation stands as a major trending factor in the Generative AI in Virtual Reality market. This technology's ability to create limitless and unique virtual worlds, landscapes, and environments on the fly revolutionizes the way VR content is produced and experienced.
By eliminating the need for extensive manual labor in content creation, procedural generation enables the rapid development of expansive and diverse virtual realms. This not only significantly reduces production costs but also offers users an ever-evolving array of experiences, making VR more dynamic and engaging. The growing interest in exploring vast virtual spaces without experiencing repetition underscores the importance of procedural content generation as a trendsetter in the VR industry.
Regional Analysis
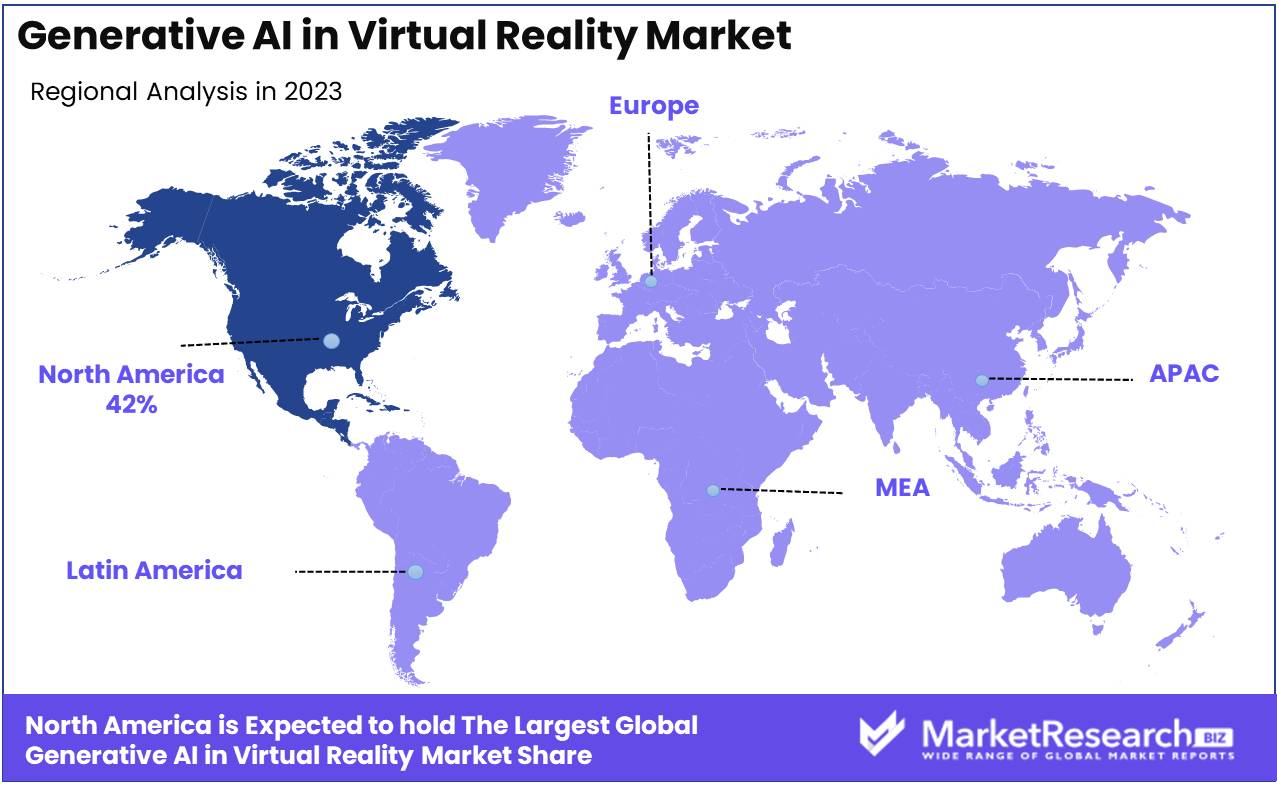
North America Dominates with 42% Market Share
North America holds a commanding 42% share of the Generative AI in Virtual Reality Market, primarily driven by its advanced technological infrastructure, robust investment in AI and VR research, and a strong ecosystem of tech giants and innovative startups. The region's dominance is further supported by its quick adoption of new technologies and the high spending power of its consumer base, which is keen on embracing advanced VR experiences.
The market dynamics in North America are characterized by a proactive approach towards technology adoption and a favorable regulatory environment that encourages innovation in AI and VR technologies. The presence of leading tech companies in this region, alongside significant investments in R&D, has created a fertile ground for the growth of the Generative AI in VR market.
North America is expected to maintain its leadership position due to ongoing technological advancements and the increasing integration of VR in various sectors like healthcare, education, and entertainment. The region's market share is a testament to its pivotal role in shaping the future of VR technologies and its potential to drive further innovations in the Generative AI landscape.
Other regions also contribute to the global market:
- Europe follows North America with a significant market share, attributed to its strong academic and research base in AI and VR, along with supportive government policies promoting technological innovation. Europe's market share stands at approximately 28%.
- Asia Pacific is rapidly growing, with a market share of around 20%, driven by its large population, increasing technological adoption, and investments in digital infrastructure, particularly in countries like China, Japan, and South Korea.
- Middle East & Africa and Latin America are emerging markets in the Generative AI in VR sector, holding smaller shares of 5% and 5% respectively. These regions show potential for growth due to increasing internet penetration and a growing interest in advanced technologies.
Key Regions and Countries
- North America
- The US
- Canada
- Mexico
- Western Europe
- Germany
- France
- The UK
- Spain
- Italy
- Portugal
- Ireland
- Austria
- Switzerland
- Benelux
- Nordic
- Rest of Western Europe
- Eastern Europe
- Russia
- Poland
- The Czech Republic
- Greece
- Rest of Eastern Europe
- APAC
- China
- Japan
- South Korea
- India
- Australia & New Zealand
- Indonesia
- Malaysia
- Philippines
- Singapore
- Thailand
- Vietnam
- Rest of APAC
- Latin America
- Brazil
- Colombia
- Chile
- Argentina
- Costa Rica
- Rest of Latin America
- Middle East & Africa
- Algeria
- Egypt
- Israel
- Kuwait
- Nigeria
- Saudi Arabia
- South Africa
- Turkey
- United Arab Emirates
- Rest of MEA
Key Players Analysis
In the Generative AI in Virtual Reality Market, major players like Unity Technologies, NVIDIA Corporation, and Google wield significant influence by leveraging artificial intelligence (AI) to enhance immersive experiences. Through AI technology, these companies optimize 3D models and digital content creation, providing users with cutting-edge virtual reality (VR) experiences tailored to their preferences.
Unity Technologies, with its robust platform, enables developers to integrate AI-driven tools for creating virtual characters and immersive environments. Similarly, NVIDIA Corporation provides powerful AI technology that enhances the realism of VR environments by generating lifelike textures and lighting effects.
Google utilizes AI algorithms to analyze vast amounts of data and user preferences, enabling personalized VR experiences and content recommendations. Additionally, Oculus VR (Facebook Technologies) and Microsoft Corporation leverage AI to improve user interactions within VR environments, enhancing the overall immersion and engagement.
Adobe Inc. and IBM Corporation offer AI-powered tools for content creation and optimization, enabling designers to generate high-quality digital assets for VR applications. Meanwhile, Epic Games utilizes AI technology to enhance the realism of virtual worlds and optimize performance in VR experiences.
Magic Leap and other key players contribute to the market by developing innovative AI-driven solutions that push the boundaries of immersive technology. By leveraging neural networks and AI algorithms, these companies provide users with captivating VR experiences that surpass traditional gaming and entertainment.
Market Key Players
- Unity Technologies
- NVIDIA Corporation
- Oculus VR (Facebook Technologies)
- Microsoft Corporation
- Adobe Inc.
- IBM Corporation
- Epic Games
- Magic Leap
- Other Key Players
Recent Developments
- On March, 2024, BrainBox AI unveiled ARIA, the world's first virtual building assistant powered by generative AI technology. ARIA, also known as the Artificial Responsive Intelligent Assistant, is designed to revolutionize building efficiency by seamlessly integrating into daily building management processes.
- On March, 2024, a collaborative effort between Google DeepMind and the University of British Columbia resulted in the development of Genie, a groundbreaking generative AI model that represents a revolutionary leap in creating interactive virtual worlds.
- On March, 2024, NVIDIA introduced LATTE3D, a cutting-edge text-to-3D generative AI model that has been likened to a virtual 3D printer. This innovative technology enables the rapid transformation of text prompts into complete 3D models in less than a second, showcasing NVIDIA's commitment to advancing generative AI capabilities.
Report Scope
Report Features Description Market Value (2023) USD 2.8 Billion Forecast Revenue (2033) USD 39.0 Billion CAGR (2024-2033) 31.0% Base Year for Estimation 2023 Historic Period 2018-2023 Forecast Period 2024-2033 Report Coverage Revenue Forecast, Market Dynamics, Competitive Landscape, Recent Developments Segments Covered By Component (Software, Hardware), By Application (Entertainment and Gaming, Healthcare, Education and Training, Retail and E-Commerce, Manufacturing and Design, Other Applications), By End-User (Enterprises, Individuals) Regional Analysis North America - The US, Canada, & Mexico; Western Europe - Germany, France, The UK, Spain, Italy, Portugal, Ireland, Austria, Switzerland, Benelux, Nordic, & Rest of Western Europe; Eastern Europe - Russia, Poland, The Czech Republic, Greece, & Rest of Eastern Europe; APAC - China, Japan, South Korea, India, Australia & New Zealand, Indonesia, Malaysia, Philippines, Singapore, Thailand, Vietnam, & Rest of APAC; Latin America - Brazil, Colombia, Chile, Argentina, Costa Rica, & Rest of Latin America; Middle East & Africa - Algeria, Egypt, Israel, Kuwait, Nigeria, Saudi Arabia, South Africa, Turkey, United Arab Emirates, & Rest of MEA Competitive Landscape Unity Technologies, NVIDIA Corporation, Google, Oculus VR (Facebook Technologies), Microsoft Corporation, Adobe Inc., IBM Corporation, Epic Games, Magic Leap, Other Key Players Customization Scope Customization for segments, region/country-level will be provided. Moreover, additional customization can be done based on the requirements. Purchase Options We have three licenses to opt for: Single User License, Multi-User License (Up to 5 Users), Corporate Use License (Unlimited User and Printable PDF) -
- 1. Executive Summary
- 1.1. Definition
- 1.2. Taxonomy
- 1.3. Research Scope
- 1.4. Key Analysis
- 1.5. Key Findings by Major Segments
- 1.6. Top strategies by Major Players
- 2. Global Generative AI in Virtual Reality Market Overview
- 2.1. Generative AI in Virtual Reality Market Dynamics
- 2.1.1. Drivers
- 2.1.2. Opportunities
- 2.1.3. Restraints
- 2.1.4. Challenges
- 2.2. Macro-economic Factors
- 2.3. Regulatory Framework
- 2.4. Market Investment Feasibility Index
- 2.5. PEST Analysis
- 2.6. PORTER’S Five Force Analysis
- 2.7. Drivers & Restraints Impact Analysis
- 2.8. Industry Chain Analysis
- 2.9. Cost Structure Analysis
- 2.10. Marketing Strategy
- 2.11. Russia-Ukraine War Impact Analysis
- 2.12. Opportunity Map Analysis
- 2.13. Market Competition Scenario Analysis
- 2.14. Product Life Cycle Analysis
- 2.15. Opportunity Orbits
- 2.16. Manufacturer Intensity Map
- 2.17. Major Companies sales by Value & Volume
- 2.1. Generative AI in Virtual Reality Market Dynamics
- 3. Global Generative AI in Virtual Reality Market Analysis, Opportunity and Forecast, 2016-2032
- 3.1. Global Generative AI in Virtual Reality Market Analysis, 2016-2021
- 3.2. Global Generative AI in Virtual Reality Market Opportunity and Forecast, 2023-2032
- 3.3. Global Generative AI in Virtual Reality Market Analysis, Opportunity and Forecast, By Component, 2016-2032
- 3.3.1. Global Generative AI in Virtual Reality Market Analysis by Component: Introduction
- 3.3.2. Market Size Absolute $ Opportunity Analysis and Forecast, By Component, 2016-2032
- 3.3.3. Software
- 3.3.4. Hardware
- 3.4. Global Generative AI in Virtual Reality Market Analysis, Opportunity and Forecast, By Application, 2016-2032
- 3.4.1. Global Generative AI in Virtual Reality Market Analysis by Application: Introduction
- 3.4.2. Market Size Absolute $ Opportunity Analysis and Forecast, By Application, 2016-2032
- 3.4.3. Entertainment and Gaming
- 3.4.4. Healthcare
- 3.4.5. Education and Training
- 3.4.6. Retail and E-Commerce
- 3.4.7. Manufacturing and Design
- 3.4.8. Other Applications
- 3.5. Global Generative AI in Virtual Reality Market Analysis, Opportunity and Forecast, By End-User, 2016-2032
- 3.5.1. Global Generative AI in Virtual Reality Market Analysis by End-User: Introduction
- 3.5.2. Market Size Absolute $ Opportunity Analysis and Forecast, By End-User, 2016-2032
- 3.5.3. Enterprises
- 3.5.4. Individuals
- 4. North America Generative AI in Virtual Reality Market Analysis, Opportunity and Forecast, 2016-2032
- 4.1. North America Generative AI in Virtual Reality Market Analysis, 2016-2021
- 4.2. North America Generative AI in Virtual Reality Market Opportunity and Forecast, 2023-2032
- 4.3. North America Generative AI in Virtual Reality Market Analysis, Opportunity and Forecast, By Component, 2016-2032
- 4.3.1. North America Generative AI in Virtual Reality Market Analysis by Component: Introduction
- 4.3.2. Market Size Absolute $ Opportunity Analysis and Forecast, By Component, 2016-2032
- 4.3.3. Software
- 4.3.4. Hardware
- 4.4. North America Generative AI in Virtual Reality Market Analysis, Opportunity and Forecast, By Application, 2016-2032
- 4.4.1. North America Generative AI in Virtual Reality Market Analysis by Application: Introduction
- 4.4.2. Market Size Absolute $ Opportunity Analysis and Forecast, By Application, 2016-2032
- 4.4.3. Entertainment and Gaming
- 4.4.4. Healthcare
- 4.4.5. Education and Training
- 4.4.6. Retail and E-Commerce
- 4.4.7. Manufacturing and Design
- 4.4.8. Other Applications
- 4.5. North America Generative AI in Virtual Reality Market Analysis, Opportunity and Forecast, By End-User, 2016-2032
- 4.5.1. North America Generative AI in Virtual Reality Market Analysis by End-User: Introduction
- 4.5.2. Market Size Absolute $ Opportunity Analysis and Forecast, By End-User, 2016-2032
- 4.5.3. Enterprises
- 4.5.4. Individuals
- 4.6. North America Generative AI in Virtual Reality Market Analysis, Opportunity and Forecast, By Country , 2016-2032
- 4.6.1. North America Generative AI in Virtual Reality Market Analysis by Country : Introduction
- 4.6.2. Market Size Absolute $ Opportunity Analysis and Forecast, Country , 2016-2032
- 4.6.2.1. The US
- 4.6.2.2. Canada
- 4.6.2.3. Mexico
- 5. Western Europe Generative AI in Virtual Reality Market Analysis, Opportunity and Forecast, 2016-2032
- 5.1. Western Europe Generative AI in Virtual Reality Market Analysis, 2016-2021
- 5.2. Western Europe Generative AI in Virtual Reality Market Opportunity and Forecast, 2023-2032
- 5.3. Western Europe Generative AI in Virtual Reality Market Analysis, Opportunity and Forecast, By Component, 2016-2032
- 5.3.1. Western Europe Generative AI in Virtual Reality Market Analysis by Component: Introduction
- 5.3.2. Market Size Absolute $ Opportunity Analysis and Forecast, By Component, 2016-2032
- 5.3.3. Software
- 5.3.4. Hardware
- 5.4. Western Europe Generative AI in Virtual Reality Market Analysis, Opportunity and Forecast, By Application, 2016-2032
- 5.4.1. Western Europe Generative AI in Virtual Reality Market Analysis by Application: Introduction
- 5.4.2. Market Size Absolute $ Opportunity Analysis and Forecast, By Application, 2016-2032
- 5.4.3. Entertainment and Gaming
- 5.4.4. Healthcare
- 5.4.5. Education and Training
- 5.4.6. Retail and E-Commerce
- 5.4.7. Manufacturing and Design
- 5.4.8. Other Applications
- 5.5. Western Europe Generative AI in Virtual Reality Market Analysis, Opportunity and Forecast, By End-User, 2016-2032
- 5.5.1. Western Europe Generative AI in Virtual Reality Market Analysis by End-User: Introduction
- 5.5.2. Market Size Absolute $ Opportunity Analysis and Forecast, By End-User, 2016-2032
- 5.5.3. Enterprises
- 5.5.4. Individuals
- 5.6. Western Europe Generative AI in Virtual Reality Market Analysis, Opportunity and Forecast, By Country , 2016-2032
- 5.6.1. Western Europe Generative AI in Virtual Reality Market Analysis by Country : Introduction
- 5.6.2. Market Size Absolute $ Opportunity Analysis and Forecast, Country , 2016-2032
- 5.6.2.1. Germany
- 5.6.2.2. France
- 5.6.2.3. The UK
- 5.6.2.4. Spain
- 5.6.2.5. Italy
- 5.6.2.6. Portugal
- 5.6.2.7. Ireland
- 5.6.2.8. Austria
- 5.6.2.9. Switzerland
- 5.6.2.10. Benelux
- 5.6.2.11. Nordic
- 5.6.2.12. Rest of Western Europe
- 6. Eastern Europe Generative AI in Virtual Reality Market Analysis, Opportunity and Forecast, 2016-2032
- 6.1. Eastern Europe Generative AI in Virtual Reality Market Analysis, 2016-2021
- 6.2. Eastern Europe Generative AI in Virtual Reality Market Opportunity and Forecast, 2023-2032
- 6.3. Eastern Europe Generative AI in Virtual Reality Market Analysis, Opportunity and Forecast, By Component, 2016-2032
- 6.3.1. Eastern Europe Generative AI in Virtual Reality Market Analysis by Component: Introduction
- 6.3.2. Market Size Absolute $ Opportunity Analysis and Forecast, By Component, 2016-2032
- 6.3.3. Software
- 6.3.4. Hardware
- 6.4. Eastern Europe Generative AI in Virtual Reality Market Analysis, Opportunity and Forecast, By Application, 2016-2032
- 6.4.1. Eastern Europe Generative AI in Virtual Reality Market Analysis by Application: Introduction
- 6.4.2. Market Size Absolute $ Opportunity Analysis and Forecast, By Application, 2016-2032
- 6.4.3. Entertainment and Gaming
- 6.4.4. Healthcare
- 6.4.5. Education and Training
- 6.4.6. Retail and E-Commerce
- 6.4.7. Manufacturing and Design
- 6.4.8. Other Applications
- 6.5. Eastern Europe Generative AI in Virtual Reality Market Analysis, Opportunity and Forecast, By End-User, 2016-2032
- 6.5.1. Eastern Europe Generative AI in Virtual Reality Market Analysis by End-User: Introduction
- 6.5.2. Market Size Absolute $ Opportunity Analysis and Forecast, By End-User, 2016-2032
- 6.5.3. Enterprises
- 6.5.4. Individuals
- 6.6. Eastern Europe Generative AI in Virtual Reality Market Analysis, Opportunity and Forecast, By Country , 2016-2032
- 6.6.1. Eastern Europe Generative AI in Virtual Reality Market Analysis by Country : Introduction
- 6.6.2. Market Size Absolute $ Opportunity Analysis and Forecast, Country , 2016-2032
- 6.6.2.1. Russia
- 6.6.2.2. Poland
- 6.6.2.3. The Czech Republic
- 6.6.2.4. Greece
- 6.6.2.5. Rest of Eastern Europe
- 7. APAC Generative AI in Virtual Reality Market Analysis, Opportunity and Forecast, 2016-2032
- 7.1. APAC Generative AI in Virtual Reality Market Analysis, 2016-2021
- 7.2. APAC Generative AI in Virtual Reality Market Opportunity and Forecast, 2023-2032
- 7.3. APAC Generative AI in Virtual Reality Market Analysis, Opportunity and Forecast, By Component, 2016-2032
- 7.3.1. APAC Generative AI in Virtual Reality Market Analysis by Component: Introduction
- 7.3.2. Market Size Absolute $ Opportunity Analysis and Forecast, By Component, 2016-2032
- 7.3.3. Software
- 7.3.4. Hardware
- 7.4. APAC Generative AI in Virtual Reality Market Analysis, Opportunity and Forecast, By Application, 2016-2032
- 7.4.1. APAC Generative AI in Virtual Reality Market Analysis by Application: Introduction
- 7.4.2. Market Size Absolute $ Opportunity Analysis and Forecast, By Application, 2016-2032
- 7.4.3. Entertainment and Gaming
- 7.4.4. Healthcare
- 7.4.5. Education and Training
- 7.4.6. Retail and E-Commerce
- 7.4.7. Manufacturing and Design
- 7.4.8. Other Applications
- 7.5. APAC Generative AI in Virtual Reality Market Analysis, Opportunity and Forecast, By End-User, 2016-2032
- 7.5.1. APAC Generative AI in Virtual Reality Market Analysis by End-User: Introduction
- 7.5.2. Market Size Absolute $ Opportunity Analysis and Forecast, By End-User, 2016-2032
- 7.5.3. Enterprises
- 7.5.4. Individuals
- 7.6. APAC Generative AI in Virtual Reality Market Analysis, Opportunity and Forecast, By Country , 2016-2032
- 7.6.1. APAC Generative AI in Virtual Reality Market Analysis by Country : Introduction
- 7.6.2. Market Size Absolute $ Opportunity Analysis and Forecast, Country , 2016-2032
- 7.6.2.1. China
- 7.6.2.2. Japan
- 7.6.2.3. South Korea
- 7.6.2.4. India
- 7.6.2.5. Australia & New Zeland
- 7.6.2.6. Indonesia
- 7.6.2.7. Malaysia
- 7.6.2.8. Philippines
- 7.6.2.9. Singapore
- 7.6.2.10. Thailand
- 7.6.2.11. Vietnam
- 7.6.2.12. Rest of APAC
- 8. Latin America Generative AI in Virtual Reality Market Analysis, Opportunity and Forecast, 2016-2032
- 8.1. Latin America Generative AI in Virtual Reality Market Analysis, 2016-2021
- 8.2. Latin America Generative AI in Virtual Reality Market Opportunity and Forecast, 2023-2032
- 8.3. Latin America Generative AI in Virtual Reality Market Analysis, Opportunity and Forecast, By Component, 2016-2032
- 8.3.1. Latin America Generative AI in Virtual Reality Market Analysis by Component: Introduction
- 8.3.2. Market Size Absolute $ Opportunity Analysis and Forecast, By Component, 2016-2032
- 8.3.3. Software
- 8.3.4. Hardware
- 8.4. Latin America Generative AI in Virtual Reality Market Analysis, Opportunity and Forecast, By Application, 2016-2032
- 8.4.1. Latin America Generative AI in Virtual Reality Market Analysis by Application: Introduction
- 8.4.2. Market Size Absolute $ Opportunity Analysis and Forecast, By Application, 2016-2032
- 8.4.3. Entertainment and Gaming
- 8.4.4. Healthcare
- 8.4.5. Education and Training
- 8.4.6. Retail and E-Commerce
- 8.4.7. Manufacturing and Design
- 8.4.8. Other Applications
- 8.5. Latin America Generative AI in Virtual Reality Market Analysis, Opportunity and Forecast, By End-User, 2016-2032
- 8.5.1. Latin America Generative AI in Virtual Reality Market Analysis by End-User: Introduction
- 8.5.2. Market Size Absolute $ Opportunity Analysis and Forecast, By End-User, 2016-2032
- 8.5.3. Enterprises
- 8.5.4. Individuals
- 8.6. Latin America Generative AI in Virtual Reality Market Analysis, Opportunity and Forecast, By Country , 2016-2032
- 8.6.1. Latin America Generative AI in Virtual Reality Market Analysis by Country : Introduction
- 8.6.2. Market Size Absolute $ Opportunity Analysis and Forecast, Country , 2016-2032
- 8.6.2.1. Brazil
- 8.6.2.2. Colombia
- 8.6.2.3. Chile
- 8.6.2.4. Argentina
- 8.6.2.5. Costa Rica
- 8.6.2.6. Rest of Latin America
- 9. Middle East & Africa Generative AI in Virtual Reality Market Analysis, Opportunity and Forecast, 2016-2032
- 9.1. Middle East & Africa Generative AI in Virtual Reality Market Analysis, 2016-2021
- 9.2. Middle East & Africa Generative AI in Virtual Reality Market Opportunity and Forecast, 2023-2032
- 9.3. Middle East & Africa Generative AI in Virtual Reality Market Analysis, Opportunity and Forecast, By Component, 2016-2032
- 9.3.1. Middle East & Africa Generative AI in Virtual Reality Market Analysis by Component: Introduction
- 9.3.2. Market Size Absolute $ Opportunity Analysis and Forecast, By Component, 2016-2032
- 9.3.3. Software
- 9.3.4. Hardware
- 9.4. Middle East & Africa Generative AI in Virtual Reality Market Analysis, Opportunity and Forecast, By Application, 2016-2032
- 9.4.1. Middle East & Africa Generative AI in Virtual Reality Market Analysis by Application: Introduction
- 9.4.2. Market Size Absolute $ Opportunity Analysis and Forecast, By Application, 2016-2032
- 9.4.3. Entertainment and Gaming
- 9.4.4. Healthcare
- 9.4.5. Education and Training
- 9.4.6. Retail and E-Commerce
- 9.4.7. Manufacturing and Design
- 9.4.8. Other Applications
- 9.5. Middle East & Africa Generative AI in Virtual Reality Market Analysis, Opportunity and Forecast, By End-User, 2016-2032
- 9.5.1. Middle East & Africa Generative AI in Virtual Reality Market Analysis by End-User: Introduction
- 9.5.2. Market Size Absolute $ Opportunity Analysis and Forecast, By End-User, 2016-2032
- 9.5.3. Enterprises
- 9.5.4. Individuals
- 9.6. Middle East & Africa Generative AI in Virtual Reality Market Analysis, Opportunity and Forecast, By Country , 2016-2032
- 9.6.1. Middle East & Africa Generative AI in Virtual Reality Market Analysis by Country : Introduction
- 9.6.2. Market Size Absolute $ Opportunity Analysis and Forecast, Country , 2016-2032
- 9.6.2.1. Algeria
- 9.6.2.2. Egypt
- 9.6.2.3. Israel
- 9.6.2.4. Kuwait
- 9.6.2.5. Nigeria
- 9.6.2.6. Saudi Arabia
- 9.6.2.7. South Africa
- 9.6.2.8. Turkey
- 9.6.2.9. The UAE
- 9.6.2.10. Rest of MEA
- 10. Global Generative AI in Virtual Reality Market Analysis, Opportunity and Forecast, By Region , 2016-2032
- 10.1. Global Generative AI in Virtual Reality Market Analysis by Region : Introduction
- 10.2. Market Size Absolute $ Opportunity Analysis and Forecast, By Region , 2016-2032
- 10.2.1. North America
- 10.2.2. Western Europe
- 10.2.3. Eastern Europe
- 10.2.4. APAC
- 10.2.5. Latin America
- 10.2.6. Middle East & Africa
- 11. Global Generative AI in Virtual Reality Market Competitive Landscape, Market Share Analysis, and Company Profiles
- 11.1. Market Share Analysis
- 11.2. Company Profiles
- 11.3. (US$ Mn & Units)y Technologies
- 11.3.1. Company Overview
- 11.3.2. Financial Highlights
- 11.3.3. Product Portfolio
- 11.3.4. SWOT Analysis
- 11.3.5. Key Strategies and Developments
- 11.4. NVIDIA Corporation
- 11.4.1. Company Overview
- 11.4.2. Financial Highlights
- 11.4.3. Product Portfolio
- 11.4.4. SWOT Analysis
- 11.4.5. Key Strategies and Developments
- 11.5. Google
- 11.5.1. Company Overview
- 11.5.2. Financial Highlights
- 11.5.3. Product Portfolio
- 11.5.4. SWOT Analysis
- 11.5.5. Key Strategies and Developments
- 11.6. Oculus VR (Facebook Technologies)
- 11.6.1. Company Overview
- 11.6.2. Financial Highlights
- 11.6.3. Product Portfolio
- 11.6.4. SWOT Analysis
- 11.6.5. Key Strategies and Developments
- 11.7. Microsoft Corporation
- 11.7.1. Company Overview
- 11.7.2. Financial Highlights
- 11.7.3. Product Portfolio
- 11.7.4. SWOT Analysis
- 11.7.5. Key Strategies and Developments
- 11.8. Adobe Inc.
- 11.8.1. Company Overview
- 11.8.2. Financial Highlights
- 11.8.3. Product Portfolio
- 11.8.4. SWOT Analysis
- 11.8.5. Key Strategies and Developments
- 11.9. IBM Corporation
- 11.9.1. Company Overview
- 11.9.2. Financial Highlights
- 11.9.3. Product Portfolio
- 11.9.4. SWOT Analysis
- 11.9.5. Key Strategies and Developments
- 11.10. Epic Games
- 11.10.1. Company Overview
- 11.10.2. Financial Highlights
- 11.10.3. Product Portfolio
- 11.10.4. SWOT Analysis
- 11.10.5. Key Strategies and Developments
- 11.11. Magic Leap
- 11.11.1. Company Overview
- 11.11.2. Financial Highlights
- 11.11.3. Product Portfolio
- 11.11.4. SWOT Analysis
- 11.11.5. Key Strategies and Developments
- 11.12. Other Key Players
- 11.12.1. Company Overview
- 11.12.2. Financial Highlights
- 11.12.3. Product Portfolio
- 11.12.4. SWOT Analysis
- 11.12.5. Key Strategies and Developments
- 11.13.1. Company Overview
- 11.13.2. Financial Highlights
- 11.13.3. Product Portfolio
- 11.13.4. SWOT Analysis
- 11.13.5. Key Strategies and Developments
- 12. Assumptions and Acronyms
- 13. Research Methodology
- 14. Contact
- List of Figures
- Figure 1: Global Generative AI in Virtual Reality Market Revenue (US$ Mn) Market Share by Component in 2022
- Figure 2: Global Generative AI in Virtual Reality Market Attractiveness Analysis by Component, 2016-2032
- Figure 3: Global Generative AI in Virtual Reality Market Revenue (US$ Mn) Market Share by Applicationin 2022
- Figure 4: Global Generative AI in Virtual Reality Market Attractiveness Analysis by Application, 2016-2032
- Figure 5: Global Generative AI in Virtual Reality Market Revenue (US$ Mn) Market Share by End-Userin 2022
- Figure 6: Global Generative AI in Virtual Reality Market Attractiveness Analysis by End-User, 2016-2032
- Figure 7: Global Generative AI in Virtual Reality Market Revenue (US$ Mn) Market Share by Region in 2022
- Figure 8: Global Generative AI in Virtual Reality Market Attractiveness Analysis by Region, 2016-2032
- Figure 9: Global Generative AI in Virtual Reality Market Revenue (US$ Mn) (2016-2032)
- Figure 10: Global Generative AI in Virtual Reality Market Revenue (US$ Mn) Comparison by Region (2016-2032)
- Figure 11: Global Generative AI in Virtual Reality Market Revenue (US$ Mn) Comparison by Component (2016-2032)
- Figure 12: Global Generative AI in Virtual Reality Market Revenue (US$ Mn) Comparison by Application (2016-2032)
- Figure 13: Global Generative AI in Virtual Reality Market Revenue (US$ Mn) Comparison by End-User (2016-2032)
- Figure 14: Global Generative AI in Virtual Reality Market Y-o-Y Growth Rate Comparison by Region (2016-2032)
- Figure 15: Global Generative AI in Virtual Reality Market Y-o-Y Growth Rate Comparison by Component (2016-2032)
- Figure 16: Global Generative AI in Virtual Reality Market Y-o-Y Growth Rate Comparison by Application (2016-2032)
- Figure 17: Global Generative AI in Virtual Reality Market Y-o-Y Growth Rate Comparison by End-User (2016-2032)
- Figure 18: Global Generative AI in Virtual Reality Market Share Comparison by Region (2016-2032)
- Figure 19: Global Generative AI in Virtual Reality Market Share Comparison by Component (2016-2032)
- Figure 20: Global Generative AI in Virtual Reality Market Share Comparison by Application (2016-2032)
- Figure 21: Global Generative AI in Virtual Reality Market Share Comparison by End-User (2016-2032)
- Figure 22: North America Generative AI in Virtual Reality Market Revenue (US$ Mn) Market Share by Componentin 2022
- Figure 23: North America Generative AI in Virtual Reality Market Attractiveness Analysis by Component, 2016-2032
- Figure 24: North America Generative AI in Virtual Reality Market Revenue (US$ Mn) Market Share by Applicationin 2022
- Figure 25: North America Generative AI in Virtual Reality Market Attractiveness Analysis by Application, 2016-2032
- Figure 26: North America Generative AI in Virtual Reality Market Revenue (US$ Mn) Market Share by End-Userin 2022
- Figure 27: North America Generative AI in Virtual Reality Market Attractiveness Analysis by End-User, 2016-2032
- Figure 28: North America Generative AI in Virtual Reality Market Revenue (US$ Mn) Market Share by Country in 2022
- Figure 29: North America Generative AI in Virtual Reality Market Attractiveness Analysis by Country, 2016-2032
- Figure 30: North America Generative AI in Virtual Reality Market Revenue (US$ Mn) (2016-2032)
- Figure 31: North America Generative AI in Virtual Reality Market Revenue (US$ Mn) Comparison by Country (2016-2032)
- Figure 32: North America Generative AI in Virtual Reality Market Revenue (US$ Mn) Comparison by Component (2016-2032)
- Figure 33: North America Generative AI in Virtual Reality Market Revenue (US$ Mn) Comparison by Application (2016-2032)
- Figure 34: North America Generative AI in Virtual Reality Market Revenue (US$ Mn) Comparison by End-User (2016-2032)
- Figure 35: North America Generative AI in Virtual Reality Market Y-o-Y Growth Rate Comparison by Country (2016-2032)
- Figure 36: North America Generative AI in Virtual Reality Market Y-o-Y Growth Rate Comparison by Component (2016-2032)
- Figure 37: North America Generative AI in Virtual Reality Market Y-o-Y Growth Rate Comparison by Application (2016-2032)
- Figure 38: North America Generative AI in Virtual Reality Market Y-o-Y Growth Rate Comparison by End-User (2016-2032)
- Figure 39: North America Generative AI in Virtual Reality Market Share Comparison by Country (2016-2032)
- Figure 40: North America Generative AI in Virtual Reality Market Share Comparison by Component (2016-2032)
- Figure 41: North America Generative AI in Virtual Reality Market Share Comparison by Application (2016-2032)
- Figure 42: North America Generative AI in Virtual Reality Market Share Comparison by End-User (2016-2032)
- Figure 43: Western Europe Generative AI in Virtual Reality Market Revenue (US$ Mn) Market Share by Componentin 2022
- Figure 44: Western Europe Generative AI in Virtual Reality Market Attractiveness Analysis by Component, 2016-2032
- Figure 45: Western Europe Generative AI in Virtual Reality Market Revenue (US$ Mn) Market Share by Applicationin 2022
- Figure 46: Western Europe Generative AI in Virtual Reality Market Attractiveness Analysis by Application, 2016-2032
- Figure 47: Western Europe Generative AI in Virtual Reality Market Revenue (US$ Mn) Market Share by End-Userin 2022
- Figure 48: Western Europe Generative AI in Virtual Reality Market Attractiveness Analysis by End-User, 2016-2032
- Figure 49: Western Europe Generative AI in Virtual Reality Market Revenue (US$ Mn) Market Share by Country in 2022
- Figure 50: Western Europe Generative AI in Virtual Reality Market Attractiveness Analysis by Country, 2016-2032
- Figure 51: Western Europe Generative AI in Virtual Reality Market Revenue (US$ Mn) (2016-2032)
- Figure 52: Western Europe Generative AI in Virtual Reality Market Revenue (US$ Mn) Comparison by Country (2016-2032)
- Figure 53: Western Europe Generative AI in Virtual Reality Market Revenue (US$ Mn) Comparison by Component (2016-2032)
- Figure 54: Western Europe Generative AI in Virtual Reality Market Revenue (US$ Mn) Comparison by Application (2016-2032)
- Figure 55: Western Europe Generative AI in Virtual Reality Market Revenue (US$ Mn) Comparison by End-User (2016-2032)
- Figure 56: Western Europe Generative AI in Virtual Reality Market Y-o-Y Growth Rate Comparison by Country (2016-2032)
- Figure 57: Western Europe Generative AI in Virtual Reality Market Y-o-Y Growth Rate Comparison by Component (2016-2032)
- Figure 58: Western Europe Generative AI in Virtual Reality Market Y-o-Y Growth Rate Comparison by Application (2016-2032)
- Figure 59: Western Europe Generative AI in Virtual Reality Market Y-o-Y Growth Rate Comparison by End-User (2016-2032)
- Figure 60: Western Europe Generative AI in Virtual Reality Market Share Comparison by Country (2016-2032)
- Figure 61: Western Europe Generative AI in Virtual Reality Market Share Comparison by Component (2016-2032)
- Figure 62: Western Europe Generative AI in Virtual Reality Market Share Comparison by Application (2016-2032)
- Figure 63: Western Europe Generative AI in Virtual Reality Market Share Comparison by End-User (2016-2032)
- Figure 64: Eastern Europe Generative AI in Virtual Reality Market Revenue (US$ Mn) Market Share by Componentin 2022
- Figure 65: Eastern Europe Generative AI in Virtual Reality Market Attractiveness Analysis by Component, 2016-2032
- Figure 66: Eastern Europe Generative AI in Virtual Reality Market Revenue (US$ Mn) Market Share by Applicationin 2022
- Figure 67: Eastern Europe Generative AI in Virtual Reality Market Attractiveness Analysis by Application, 2016-2032
- Figure 68: Eastern Europe Generative AI in Virtual Reality Market Revenue (US$ Mn) Market Share by End-Userin 2022
- Figure 69: Eastern Europe Generative AI in Virtual Reality Market Attractiveness Analysis by End-User, 2016-2032
- Figure 70: Eastern Europe Generative AI in Virtual Reality Market Revenue (US$ Mn) Market Share by Country in 2022
- Figure 71: Eastern Europe Generative AI in Virtual Reality Market Attractiveness Analysis by Country, 2016-2032
- Figure 72: Eastern Europe Generative AI in Virtual Reality Market Revenue (US$ Mn) (2016-2032)
- Figure 73: Eastern Europe Generative AI in Virtual Reality Market Revenue (US$ Mn) Comparison by Country (2016-2032)
- Figure 74: Eastern Europe Generative AI in Virtual Reality Market Revenue (US$ Mn) Comparison by Component (2016-2032)
- Figure 75: Eastern Europe Generative AI in Virtual Reality Market Revenue (US$ Mn) Comparison by Application (2016-2032)
- Figure 76: Eastern Europe Generative AI in Virtual Reality Market Revenue (US$ Mn) Comparison by End-User (2016-2032)
- Figure 77: Eastern Europe Generative AI in Virtual Reality Market Y-o-Y Growth Rate Comparison by Country (2016-2032)
- Figure 78: Eastern Europe Generative AI in Virtual Reality Market Y-o-Y Growth Rate Comparison by Component (2016-2032)
- Figure 79: Eastern Europe Generative AI in Virtual Reality Market Y-o-Y Growth Rate Comparison by Application (2016-2032)
- Figure 80: Eastern Europe Generative AI in Virtual Reality Market Y-o-Y Growth Rate Comparison by End-User (2016-2032)
- Figure 81: Eastern Europe Generative AI in Virtual Reality Market Share Comparison by Country (2016-2032)
- Figure 82: Eastern Europe Generative AI in Virtual Reality Market Share Comparison by Component (2016-2032)
- Figure 83: Eastern Europe Generative AI in Virtual Reality Market Share Comparison by Application (2016-2032)
- Figure 84: Eastern Europe Generative AI in Virtual Reality Market Share Comparison by End-User (2016-2032)
- Figure 85: APAC Generative AI in Virtual Reality Market Revenue (US$ Mn) Market Share by Componentin 2022
- Figure 86: APAC Generative AI in Virtual Reality Market Attractiveness Analysis by Component, 2016-2032
- Figure 87: APAC Generative AI in Virtual Reality Market Revenue (US$ Mn) Market Share by Applicationin 2022
- Figure 88: APAC Generative AI in Virtual Reality Market Attractiveness Analysis by Application, 2016-2032
- Figure 89: APAC Generative AI in Virtual Reality Market Revenue (US$ Mn) Market Share by End-Userin 2022
- Figure 90: APAC Generative AI in Virtual Reality Market Attractiveness Analysis by End-User, 2016-2032
- Figure 91: APAC Generative AI in Virtual Reality Market Revenue (US$ Mn) Market Share by Country in 2022
- Figure 92: APAC Generative AI in Virtual Reality Market Attractiveness Analysis by Country, 2016-2032
- Figure 93: APAC Generative AI in Virtual Reality Market Revenue (US$ Mn) (2016-2032)
- Figure 94: APAC Generative AI in Virtual Reality Market Revenue (US$ Mn) Comparison by Country (2016-2032)
- Figure 95: APAC Generative AI in Virtual Reality Market Revenue (US$ Mn) Comparison by Component (2016-2032)
- Figure 96: APAC Generative AI in Virtual Reality Market Revenue (US$ Mn) Comparison by Application (2016-2032)
- Figure 97: APAC Generative AI in Virtual Reality Market Revenue (US$ Mn) Comparison by End-User (2016-2032)
- Figure 98: APAC Generative AI in Virtual Reality Market Y-o-Y Growth Rate Comparison by Country (2016-2032)
- Figure 99: APAC Generative AI in Virtual Reality Market Y-o-Y Growth Rate Comparison by Component (2016-2032)
- Figure 100: APAC Generative AI in Virtual Reality Market Y-o-Y Growth Rate Comparison by Application (2016-2032)
- Figure 101: APAC Generative AI in Virtual Reality Market Y-o-Y Growth Rate Comparison by End-User (2016-2032)
- Figure 102: APAC Generative AI in Virtual Reality Market Share Comparison by Country (2016-2032)
- Figure 103: APAC Generative AI in Virtual Reality Market Share Comparison by Component (2016-2032)
- Figure 104: APAC Generative AI in Virtual Reality Market Share Comparison by Application (2016-2032)
- Figure 105: APAC Generative AI in Virtual Reality Market Share Comparison by End-User (2016-2032)
- Figure 106: Latin America Generative AI in Virtual Reality Market Revenue (US$ Mn) Market Share by Componentin 2022
- Figure 107: Latin America Generative AI in Virtual Reality Market Attractiveness Analysis by Component, 2016-2032
- Figure 108: Latin America Generative AI in Virtual Reality Market Revenue (US$ Mn) Market Share by Applicationin 2022
- Figure 109: Latin America Generative AI in Virtual Reality Market Attractiveness Analysis by Application, 2016-2032
- Figure 110: Latin America Generative AI in Virtual Reality Market Revenue (US$ Mn) Market Share by End-Userin 2022
- Figure 111: Latin America Generative AI in Virtual Reality Market Attractiveness Analysis by End-User, 2016-2032
- Figure 112: Latin America Generative AI in Virtual Reality Market Revenue (US$ Mn) Market Share by Country in 2022
- Figure 113: Latin America Generative AI in Virtual Reality Market Attractiveness Analysis by Country, 2016-2032
- Figure 114: Latin America Generative AI in Virtual Reality Market Revenue (US$ Mn) (2016-2032)
- Figure 115: Latin America Generative AI in Virtual Reality Market Revenue (US$ Mn) Comparison by Country (2016-2032)
- Figure 116: Latin America Generative AI in Virtual Reality Market Revenue (US$ Mn) Comparison by Component (2016-2032)
- Figure 117: Latin America Generative AI in Virtual Reality Market Revenue (US$ Mn) Comparison by Application (2016-2032)
- Figure 118: Latin America Generative AI in Virtual Reality Market Revenue (US$ Mn) Comparison by End-User (2016-2032)
- Figure 119: Latin America Generative AI in Virtual Reality Market Y-o-Y Growth Rate Comparison by Country (2016-2032)
- Figure 120: Latin America Generative AI in Virtual Reality Market Y-o-Y Growth Rate Comparison by Component (2016-2032)
- Figure 121: Latin America Generative AI in Virtual Reality Market Y-o-Y Growth Rate Comparison by Application (2016-2032)
- Figure 122: Latin America Generative AI in Virtual Reality Market Y-o-Y Growth Rate Comparison by End-User (2016-2032)
- Figure 123: Latin America Generative AI in Virtual Reality Market Share Comparison by Country (2016-2032)
- Figure 124: Latin America Generative AI in Virtual Reality Market Share Comparison by Component (2016-2032)
- Figure 125: Latin America Generative AI in Virtual Reality Market Share Comparison by Application (2016-2032)
- Figure 126: Latin America Generative AI in Virtual Reality Market Share Comparison by End-User (2016-2032)
- Figure 127: Middle East & Africa Generative AI in Virtual Reality Market Revenue (US$ Mn) Market Share by Componentin 2022
- Figure 128: Middle East & Africa Generative AI in Virtual Reality Market Attractiveness Analysis by Component, 2016-2032
- Figure 129: Middle East & Africa Generative AI in Virtual Reality Market Revenue (US$ Mn) Market Share by Applicationin 2022
- Figure 130: Middle East & Africa Generative AI in Virtual Reality Market Attractiveness Analysis by Application, 2016-2032
- Figure 131: Middle East & Africa Generative AI in Virtual Reality Market Revenue (US$ Mn) Market Share by End-Userin 2022
- Figure 132: Middle East & Africa Generative AI in Virtual Reality Market Attractiveness Analysis by End-User, 2016-2032
- Figure 133: Middle East & Africa Generative AI in Virtual Reality Market Revenue (US$ Mn) Market Share by Country in 2022
- Figure 134: Middle East & Africa Generative AI in Virtual Reality Market Attractiveness Analysis by Country, 2016-2032
- Figure 135: Middle East & Africa Generative AI in Virtual Reality Market Revenue (US$ Mn) (2016-2032)
- Figure 136: Middle East & Africa Generative AI in Virtual Reality Market Revenue (US$ Mn) Comparison by Country (2016-2032)
- Figure 137: Middle East & Africa Generative AI in Virtual Reality Market Revenue (US$ Mn) Comparison by Component (2016-2032)
- Figure 138: Middle East & Africa Generative AI in Virtual Reality Market Revenue (US$ Mn) Comparison by Application (2016-2032)
- Figure 139: Middle East & Africa Generative AI in Virtual Reality Market Revenue (US$ Mn) Comparison by End-User (2016-2032)
- Figure 140: Middle East & Africa Generative AI in Virtual Reality Market Y-o-Y Growth Rate Comparison by Country (2016-2032)
- Figure 141: Middle East & Africa Generative AI in Virtual Reality Market Y-o-Y Growth Rate Comparison by Component (2016-2032)
- Figure 142: Middle East & Africa Generative AI in Virtual Reality Market Y-o-Y Growth Rate Comparison by Application (2016-2032)
- Figure 143: Middle East & Africa Generative AI in Virtual Reality Market Y-o-Y Growth Rate Comparison by End-User (2016-2032)
- Figure 144: Middle East & Africa Generative AI in Virtual Reality Market Share Comparison by Country (2016-2032)
- Figure 145: Middle East & Africa Generative AI in Virtual Reality Market Share Comparison by Component (2016-2032)
- Figure 146: Middle East & Africa Generative AI in Virtual Reality Market Share Comparison by Application (2016-2032)
- Figure 147: Middle East & Africa Generative AI in Virtual Reality Market Share Comparison by End-User (2016-2032)
- List of Tables
- Table 1: Global Generative AI in Virtual Reality Market Comparison by Component (2016-2032)
- Table 2: Global Generative AI in Virtual Reality Market Comparison by Application (2016-2032)
- Table 3: Global Generative AI in Virtual Reality Market Comparison by End-User (2016-2032)
- Table 4: Global Generative AI in Virtual Reality Market Revenue (US$ Mn) Comparison by Region (2016-2032)
- Table 5: Global Generative AI in Virtual Reality Market Revenue (US$ Mn) (2016-2032)
- Table 6: Global Generative AI in Virtual Reality Market Revenue (US$ Mn) Comparison by Region (2016-2032)
- Table 7: Global Generative AI in Virtual Reality Market Revenue (US$ Mn) Comparison by Component (2016-2032)
- Table 8: Global Generative AI in Virtual Reality Market Revenue (US$ Mn) Comparison by Application (2016-2032)
- Table 9: Global Generative AI in Virtual Reality Market Revenue (US$ Mn) Comparison by End-User (2016-2032)
- Table 10: Global Generative AI in Virtual Reality Market Y-o-Y Growth Rate Comparison by Region (2016-2032)
- Table 11: Global Generative AI in Virtual Reality Market Y-o-Y Growth Rate Comparison by Component (2016-2032)
- Table 12: Global Generative AI in Virtual Reality Market Y-o-Y Growth Rate Comparison by Application (2016-2032)
- Table 13: Global Generative AI in Virtual Reality Market Y-o-Y Growth Rate Comparison by End-User (2016-2032)
- Table 14: Global Generative AI in Virtual Reality Market Share Comparison by Region (2016-2032)
- Table 15: Global Generative AI in Virtual Reality Market Share Comparison by Component (2016-2032)
- Table 16: Global Generative AI in Virtual Reality Market Share Comparison by Application (2016-2032)
- Table 17: Global Generative AI in Virtual Reality Market Share Comparison by End-User (2016-2032)
- Table 18: North America Generative AI in Virtual Reality Market Comparison by Application (2016-2032)
- Table 19: North America Generative AI in Virtual Reality Market Comparison by End-User (2016-2032)
- Table 20: North America Generative AI in Virtual Reality Market Revenue (US$ Mn) Comparison by Country (2016-2032)
- Table 21: North America Generative AI in Virtual Reality Market Revenue (US$ Mn) (2016-2032)
- Table 22: North America Generative AI in Virtual Reality Market Revenue (US$ Mn) Comparison by Country (2016-2032)
- Table 23: North America Generative AI in Virtual Reality Market Revenue (US$ Mn) Comparison by Component (2016-2032)
- Table 24: North America Generative AI in Virtual Reality Market Revenue (US$ Mn) Comparison by Application (2016-2032)
- Table 25: North America Generative AI in Virtual Reality Market Revenue (US$ Mn) Comparison by End-User (2016-2032)
- Table 26: North America Generative AI in Virtual Reality Market Y-o-Y Growth Rate Comparison by Country (2016-2032)
- Table 27: North America Generative AI in Virtual Reality Market Y-o-Y Growth Rate Comparison by Component (2016-2032)
- Table 28: North America Generative AI in Virtual Reality Market Y-o-Y Growth Rate Comparison by Application (2016-2032)
- Table 29: North America Generative AI in Virtual Reality Market Y-o-Y Growth Rate Comparison by End-User (2016-2032)
- Table 30: North America Generative AI in Virtual Reality Market Share Comparison by Country (2016-2032)
- Table 31: North America Generative AI in Virtual Reality Market Share Comparison by Component (2016-2032)
- Table 32: North America Generative AI in Virtual Reality Market Share Comparison by Application (2016-2032)
- Table 33: North America Generative AI in Virtual Reality Market Share Comparison by End-User (2016-2032)
- Table 34: Western Europe Generative AI in Virtual Reality Market Comparison by Component (2016-2032)
- Table 35: Western Europe Generative AI in Virtual Reality Market Comparison by Application (2016-2032)
- Table 36: Western Europe Generative AI in Virtual Reality Market Comparison by End-User (2016-2032)
- Table 37: Western Europe Generative AI in Virtual Reality Market Revenue (US$ Mn) Comparison by Country (2016-2032)
- Table 38: Western Europe Generative AI in Virtual Reality Market Revenue (US$ Mn) (2016-2032)
- Table 39: Western Europe Generative AI in Virtual Reality Market Revenue (US$ Mn) Comparison by Country (2016-2032)
- Table 40: Western Europe Generative AI in Virtual Reality Market Revenue (US$ Mn) Comparison by Component (2016-2032)
- Table 41: Western Europe Generative AI in Virtual Reality Market Revenue (US$ Mn) Comparison by Application (2016-2032)
- Table 42: Western Europe Generative AI in Virtual Reality Market Revenue (US$ Mn) Comparison by End-User (2016-2032)
- Table 43: Western Europe Generative AI in Virtual Reality Market Y-o-Y Growth Rate Comparison by Country (2016-2032)
- Table 44: Western Europe Generative AI in Virtual Reality Market Y-o-Y Growth Rate Comparison by Component (2016-2032)
- Table 45: Western Europe Generative AI in Virtual Reality Market Y-o-Y Growth Rate Comparison by Application (2016-2032)
- Table 46: Western Europe Generative AI in Virtual Reality Market Y-o-Y Growth Rate Comparison by End-User (2016-2032)
- Table 47: Western Europe Generative AI in Virtual Reality Market Share Comparison by Country (2016-2032)
- Table 48: Western Europe Generative AI in Virtual Reality Market Share Comparison by Component (2016-2032)
- Table 49: Western Europe Generative AI in Virtual Reality Market Share Comparison by Application (2016-2032)
- Table 50: Western Europe Generative AI in Virtual Reality Market Share Comparison by End-User (2016-2032)
- Table 51: Eastern Europe Generative AI in Virtual Reality Market Comparison by Component (2016-2032)
- Table 52: Eastern Europe Generative AI in Virtual Reality Market Comparison by Application (2016-2032)
- Table 53: Eastern Europe Generative AI in Virtual Reality Market Comparison by End-User (2016-2032)
- Table 54: Eastern Europe Generative AI in Virtual Reality Market Revenue (US$ Mn) Comparison by Country (2016-2032)
- Table 55: Eastern Europe Generative AI in Virtual Reality Market Revenue (US$ Mn) (2016-2032)
- Table 56: Eastern Europe Generative AI in Virtual Reality Market Revenue (US$ Mn) Comparison by Country (2016-2032)
- Table 57: Eastern Europe Generative AI in Virtual Reality Market Revenue (US$ Mn) Comparison by Component (2016-2032)
- Table 58: Eastern Europe Generative AI in Virtual Reality Market Revenue (US$ Mn) Comparison by Application (2016-2032)
- Table 59: Eastern Europe Generative AI in Virtual Reality Market Revenue (US$ Mn) Comparison by End-User (2016-2032)
- Table 60: Eastern Europe Generative AI in Virtual Reality Market Y-o-Y Growth Rate Comparison by Country (2016-2032)
- Table 61: Eastern Europe Generative AI in Virtual Reality Market Y-o-Y Growth Rate Comparison by Component (2016-2032)
- Table 62: Eastern Europe Generative AI in Virtual Reality Market Y-o-Y Growth Rate Comparison by Application (2016-2032)
- Table 63: Eastern Europe Generative AI in Virtual Reality Market Y-o-Y Growth Rate Comparison by End-User (2016-2032)
- Table 64: Eastern Europe Generative AI in Virtual Reality Market Share Comparison by Country (2016-2032)
- Table 65: Eastern Europe Generative AI in Virtual Reality Market Share Comparison by Component (2016-2032)
- Table 66: Eastern Europe Generative AI in Virtual Reality Market Share Comparison by Application (2016-2032)
- Table 67: Eastern Europe Generative AI in Virtual Reality Market Share Comparison by End-User (2016-2032)
- Table 68: APAC Generative AI in Virtual Reality Market Comparison by Component (2016-2032)
- Table 69: APAC Generative AI in Virtual Reality Market Comparison by Application (2016-2032)
- Table 70: APAC Generative AI in Virtual Reality Market Comparison by End-User (2016-2032)
- Table 71: APAC Generative AI in Virtual Reality Market Revenue (US$ Mn) Comparison by Country (2016-2032)
- Table 72: APAC Generative AI in Virtual Reality Market Revenue (US$ Mn) (2016-2032)
- Table 73: APAC Generative AI in Virtual Reality Market Revenue (US$ Mn) Comparison by Country (2016-2032)
- Table 74: APAC Generative AI in Virtual Reality Market Revenue (US$ Mn) Comparison by Component (2016-2032)
- Table 75: APAC Generative AI in Virtual Reality Market Revenue (US$ Mn) Comparison by Application (2016-2032)
- Table 76: APAC Generative AI in Virtual Reality Market Revenue (US$ Mn) Comparison by End-User (2016-2032)
- Table 77: APAC Generative AI in Virtual Reality Market Y-o-Y Growth Rate Comparison by Country (2016-2032)
- Table 78: APAC Generative AI in Virtual Reality Market Y-o-Y Growth Rate Comparison by Component (2016-2032)
- Table 79: APAC Generative AI in Virtual Reality Market Y-o-Y Growth Rate Comparison by Application (2016-2032)
- Table 80: APAC Generative AI in Virtual Reality Market Y-o-Y Growth Rate Comparison by End-User (2016-2032)
- Table 81: APAC Generative AI in Virtual Reality Market Share Comparison by Country (2016-2032)
- Table 82: APAC Generative AI in Virtual Reality Market Share Comparison by Component (2016-2032)
- Table 83: APAC Generative AI in Virtual Reality Market Share Comparison by Application (2016-2032)
- Table 84: APAC Generative AI in Virtual Reality Market Share Comparison by End-User (2016-2032)
- Table 85: Latin America Generative AI in Virtual Reality Market Comparison by Component (2016-2032)
- Table 86: Latin America Generative AI in Virtual Reality Market Comparison by Application (2016-2032)
- Table 87: Latin America Generative AI in Virtual Reality Market Comparison by End-User (2016-2032)
- Table 88: Latin America Generative AI in Virtual Reality Market Revenue (US$ Mn) Comparison by Country (2016-2032)
- Table 89: Latin America Generative AI in Virtual Reality Market Revenue (US$ Mn) (2016-2032)
- Table 90: Latin America Generative AI in Virtual Reality Market Revenue (US$ Mn) Comparison by Country (2016-2032)
- Table 91: Latin America Generative AI in Virtual Reality Market Revenue (US$ Mn) Comparison by Component (2016-2032)
- Table 92: Latin America Generative AI in Virtual Reality Market Revenue (US$ Mn) Comparison by Application (2016-2032)
- Table 93: Latin America Generative AI in Virtual Reality Market Revenue (US$ Mn) Comparison by End-User (2016-2032)
- Table 94: Latin America Generative AI in Virtual Reality Market Y-o-Y Growth Rate Comparison by Country (2016-2032)
- Table 95: Latin America Generative AI in Virtual Reality Market Y-o-Y Growth Rate Comparison by Component (2016-2032)
- Table 96: Latin America Generative AI in Virtual Reality Market Y-o-Y Growth Rate Comparison by Application (2016-2032)
- Table 97: Latin America Generative AI in Virtual Reality Market Y-o-Y Growth Rate Comparison by End-User (2016-2032)
- Table 98: Latin America Generative AI in Virtual Reality Market Share Comparison by Country (2016-2032)
- Table 99: Latin America Generative AI in Virtual Reality Market Share Comparison by Component (2016-2032)
- Table 100: Latin America Generative AI in Virtual Reality Market Share Comparison by Application (2016-2032)
- Table 101: Latin America Generative AI in Virtual Reality Market Share Comparison by End-User (2016-2032)
- Table 102: Middle East & Africa Generative AI in Virtual Reality Market Comparison by Component (2016-2032)
- Table 103: Middle East & Africa Generative AI in Virtual Reality Market Comparison by Application (2016-2032)
- Table 104: Middle East & Africa Generative AI in Virtual Reality Market Comparison by End-User (2016-2032)
- Table 105: Middle East & Africa Generative AI in Virtual Reality Market Revenue (US$ Mn) Comparison by Country (2016-2032)
- Table 106: Middle East & Africa Generative AI in Virtual Reality Market Revenue (US$ Mn) (2016-2032)
- Table 107: Middle East & Africa Generative AI in Virtual Reality Market Revenue (US$ Mn) Comparison by Country (2016-2032)
- Table 108: Middle East & Africa Generative AI in Virtual Reality Market Revenue (US$ Mn) Comparison by Component (2016-2032)
- Table 109: Middle East & Africa Generative AI in Virtual Reality Market Revenue (US$ Mn) Comparison by Application (2016-2032)
- Table 110: Middle East & Africa Generative AI in Virtual Reality Market Revenue (US$ Mn) Comparison by End-User (2016-2032)
- Table 111: Middle East & Africa Generative AI in Virtual Reality Market Y-o-Y Growth Rate Comparison by Country (2016-2032)
- Table 112: Middle East & Africa Generative AI in Virtual Reality Market Y-o-Y Growth Rate Comparison by Component (2016-2032)
- Table 113: Middle East & Africa Generative AI in Virtual Reality Market Y-o-Y Growth Rate Comparison by Application (2016-2032)
- Table 114: Middle East & Africa Generative AI in Virtual Reality Market Y-o-Y Growth Rate Comparison by End-User (2016-2032)
- Table 115: Middle East & Africa Generative AI in Virtual Reality Market Share Comparison by Country (2016-2032)
- Table 116: Middle East & Africa Generative AI in Virtual Reality Market Share Comparison by Component (2016-2032)
- Table 117: Middle East & Africa Generative AI in Virtual Reality Market Share Comparison by Application (2016-2032)
- Table 118: Middle East & Africa Generative AI in Virtual Reality Market Share Comparison by End-User (2016-2032)
- 1. Executive Summary
-
- Unity Technologies
- NVIDIA Corporation
- Oculus VR (Facebook Technologies)
- Microsoft Corporation
- Adobe Inc.
- IBM Corporation
- Epic Games
- Magic Leap
- Other Key Players
Our Clients


View Our Licence Options
