
Generative AI in Public Sector Market By Deployment Mode (Cloud-based, On-premises, and Edge), By Technology (Generative Adversarial Networks, Recurrent Neural Networks, Reinforcement Learning, Variational Autoencoders, and Transformer Models) By End-User, By Region and Companies - Industry Segment Outlook, Market Assessment, Competition Scenario, Trends, and Forecast 2023-2032
39112
July 2023
136
Report Overview
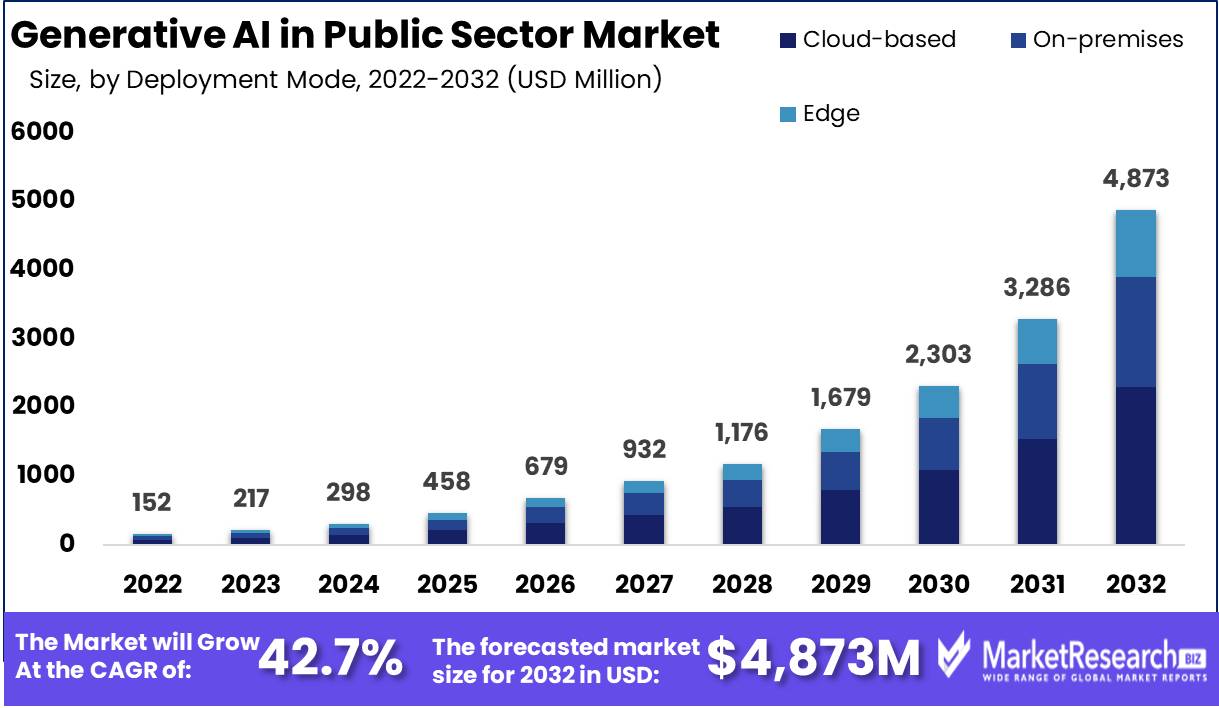
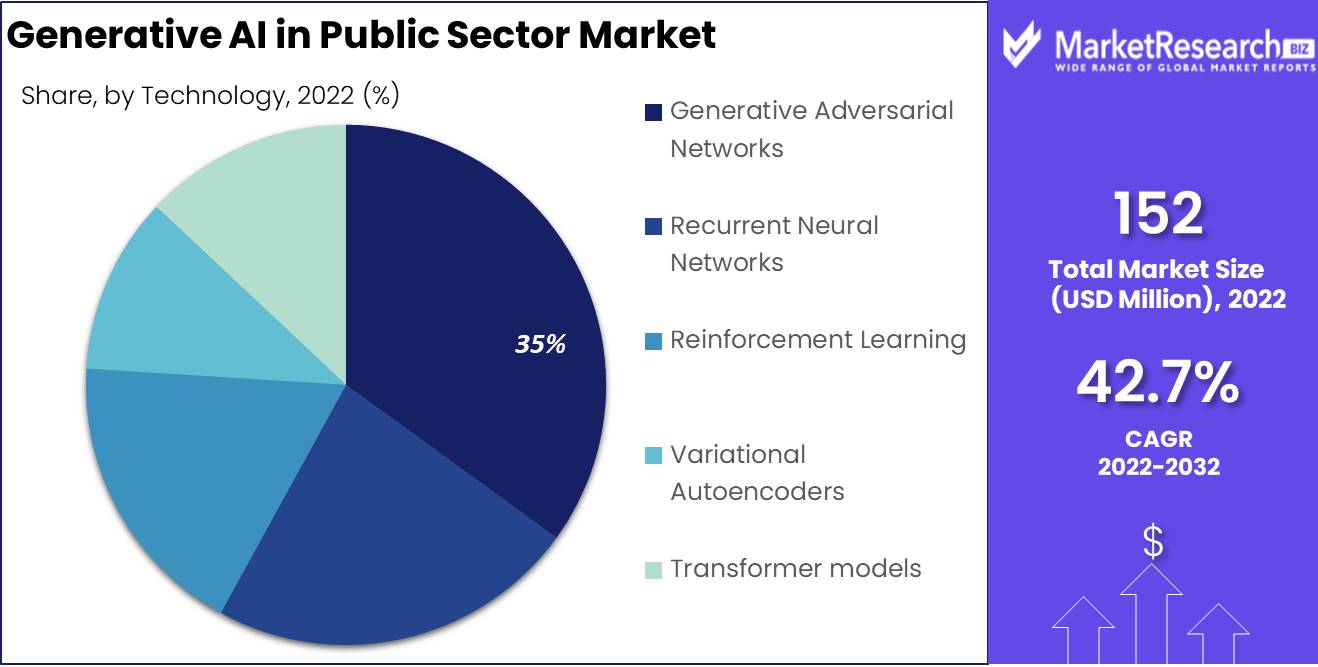
Generative AI in Public Sector Market size is expected to be worth around USD 4,873 Mn by 2032 from USD 152 Mn in 2022, growing at a CAGR of 42.7% during the forecast period from 2023 to 2032.
The global generative AI in public sector market refers to the global marketplace for solutions utilizing generative artificial intelligence (AI). Generative AI refers to an area of AI that uses algorithms and models to generate content, ideas, or solutions from scratch; its applications in government services, policy development, law enforcement, healthcare delivery systems, transportation planning, and urban planning may include automating tasks, analyzing large datasets for insights, providing intelligent recommendations and automating tasks for efficient operations.
The global generative AI in public sector market encompasses the demand, supply, and adoption of generative AI solutions among government agencies, public organizations, and institutions worldwide. Public sector AI deployment encompasses designing, deploying, and using generative AI technologies, platforms, and services to increase operational efficiencies, strengthen decision-making processes, and find innovative solutions to societal problems.
Market analysis of global Generative AI In Public Sector Market includes considering factors like market size, growth potential, key players, emerging trends, and regulatory environment, as well as its effect on public sector operations. This analysis assists businesses, policymakers, and investors in understanding market dynamics while recognizing opportunities and making informed decisions regarding the implementation and utilization of generative AI technology within this sector.
Driving factors
Technological Advancements and Increasing Data Availability
Several key factors are driving the global generative AI in Public Sector Market. First and foremost, digitization has generated vast quantities of public services data that can be effectively analyzed using generative AI solutions. Governments and public organizations are beginning to understand the potential of AI-powered insights in improving decision-making, optimizing resource allocation, and improving service delivery. Second, public sector processes' demand for automation and efficiency has driven AI adoption in public services.
AI-powered systems can automate repetitive tasks, streamline administrative procedures and reduce human error resulting in cost savings and increased productivity - particularly useful in areas like document processing, data analysis, and customer service. Another driving factor is proactive decision-making and policy planning. Generative AI In Public Sector Market can analyze complex datasets, identify patterns, and generate predictive models to assist governments in anticipating and addressing emerging challenges more quickly. Public sector organizations are using Artificial Intelligence (AI) to make data-driven decisions, allocate resources efficiently and develop proactive policies to meet societal needs.
Citizen engagement and personalized services are pushing them to leverage AI more than ever. By analyzing citizen data and preferences, artificial intelligence (AI) algorithms can generate personalized recommendations, tailored information, and interactive interfaces to improve user experience and citizen satisfaction. Collaborations between public and private entities are also driving the advancement and deployment of generative AI in public service applications. Partnerships between AI technology providers, research institutions, and startups help facilitate knowledge transfer, innovation, and co-creating of AI solutions to address specific public sector challenges.
Restraining Factors
Data Privacy and Security Concerns
The growth and implementation of generative AI in the public sector face several restraining factors that need to be addressed. One of the major challenges is data privacy & security concerns. The public sector deals with vast amounts of sensitive and confidential data, including citizens' personal information. The potential risks of data breaches, unauthorized access, or misuse of data pose significant barriers to the adoption of generative AI solutions. To overcome this, robust data protection measures, encryption techniques, and strict compliance with privacy regulations must be implemented.
Another restraining factor is the lack of a skilled workforce. Developing & deploying generative AI solutions require expertise in AI algorithms, data analysis, and model training. However, there is a shortage of professionals with the necessary skills and knowledge in the public sector. Training existing staff and attracting AI talent to the public sector can be a challenge. Addressing this restraint requires investment in AI education and training programs, partnerships with academia and industry, and initiatives to attract AI talent to public sector organizations.
Additionally, ethical considerations and biases in AI algorithms pose a significant challenge. Generative AI models are trained on historical data, which can contain inherent biases and perpetuate discrimination when used in decision-making processes. Ensuring fairness, transparency, and accountability in AI systems is crucial. Implementing ethical guidelines, conducting regular audits, and fostering diverse and inclusive AI development teams can help address these concerns.
Moreover, the complexity of integrating generative AI into existing public sector infrastructure and workflows can be a restraining factor. Legacy systems, interoperability issues, and resistance to change may hinder the seamless integration of generative AI solutions. To overcome this challenge, a comprehensive strategy that considers the existing technological landscape, scalability, and interoperability.
Covid-19 Impact on Generative AI in Public Sector Market
The COVID-19 pandemic has significantly impacted the adoption and implementation of generative AI in the public sector. On the one hand, the pandemic has highlighted the potential benefits of AI-driven technologies in addressing various challenges governments and public organizations face. Generative AI has been instrumental in analyzing large volumes of data related to the spread of the virus, predicting trends, and supporting decision-making processes for public health interventions.
However, the pandemic has also presented certain challenges that have restrained the full potential of generative AI in the public sector. The disruption caused by COVID-19 has diverted resources and attention away from implementing new technologies, including Generative AI In Public Sector Market. Governments and public organizations have had to prioritize immediate public health and crisis response measures, which may have delayed or slowed down the adoption of generative AI initiatives.
Furthermore, the economic impact of the pandemic has led to budgetary constraints for many public sector entities. Limited financial resources and competing priorities have made it challenging to allocate funds toward AI investments, including generative AI. This has hindered the implementation of AI-driven solutions that could enhance operational efficiency, optimize resource allocation, and improve service delivery in the public sector.
The pandemic has also highlighted the importance of ethical considerations and transparency in AI applications. With the urgency to develop AI solutions, there is a risk of overlooking potential biases or unintended consequences in generative AI models. Ensuring fairness, accountability, and transparency in AI algorithms and decision-making processes becomes crucial as they impact public trust and acceptance of AI technologies. However, despite these challenges, the COVID-19 pandemic has also catalyzed innovation and digital transformation in the public sector.
The crisis has accelerated the adoption of digital technologies, including generative AI, as governments and public organizations recognize the need for agile and data-driven approaches to tackle complex challenges. The pandemic has highlighted the value of Generative AI In Public Sector Market in areas such as remote service delivery, data analysis, and predictive modeling, which may drive further investments and advancements in the field.
By Deployment Mode Analysis
The Cloud-Based Segment Holds a Significant Share in the Deployment Mode Segment in the Generative AI in Public Sector Market.
Based on deployment mode, the market is divided into cloud-based, on-premises, and edge. Among these, the cloud-based segment is dominant in the deployment mode segment in Generative AI In Public Sector Market, with a market share of 47%. Owing to their scalability, flexibility, and ease of implementation. The cloud infrastructure provides the computational power and storage capacity to process large datasets and run complex AI algorithms.
Additionally, cloud-based solutions offer accessibility from anywhere with an internet connection, seamless integration with existing systems, and easy updates and maintenance of AI models. Cloud-based solutions also address the challenges of on-premises infrastructure management and reduce the need for substantial upfront investments in hardware and expertise. This makes cloud-based generative AI more accessible and cost-effective for public sector organizations, especially those with limited IT resources.
By Technology Analysis
The Generative Adversarial Networks Segment Holds a Significant Share in the Technology Segment in the Generative AI in Public Sector Market.
Based on technology, the market is divided into generative adversarial networks, recurrent neural networks, reinforcement learning, variational autoencoders, and transformer models. Among these technologies, the generative adversarial networks segment is dominant in the technology segment of Generative AI In Public Sector Market, with a market share of 35%. Owing to the significant reason for their dominance is their ability to generate highly realistic and diverse outputs.
GANs operate through a competitive framework where a generator network learns to produce data samples that are difficult for a discriminator network to distinguish from real data. This adversarial training process drives the generator to improve its output quality continuously, resulting in outputs that closely resemble the training data distribution. This capability has made GANs a preferred choice in applications such as image synthesis, video generation, and text-to-image conversion. Another reason for the dominance of GANs is their versatility and broad applicability across various domains. GANs have been successfully applied in computer vision, natural language processing, and many other fields.
By End-User Analysis
Government Agencies & Departments Hold a Significant Share of the End-User Segment of Generative AI in the Drug Discovery Market.
Based on end-user, the market is divided into government agencies & departments, public service providers, law enforcement & security agencies, research & policy institutions, citizen engagement platforms, and other end-users. Among these, the government agencies & departments segment dominates the market with a revenue share of 29% in the forecasted period.
Government entities have a broad scope of operations and responsibilities, ranging from policy development to service delivery and resource management. Generative AI can be applied across various domains within government agencies, such as healthcare, transportation, public safety, and urban planning. The versatility of generative AI solutions enables governments to address a wide range of challenges and optimize their operations effectively.
Government agencies typically handle large volumes of data, including demographic information, administrative records, and public service data. Generative AI can analyze and extract insights from these data sets, helping governments make data-driven decisions and enhance their services. By leveraging generative AI, government agencies can streamline processes, allocate resources efficiently, and improve the quality and accessibility of citizen services.
Key Market Segments
Based on the Deployment Mode
- Cloud-based
- On-premises
- Edge
Based on Technology
- Generative Adversarial Networks
- Recurrent Neural Networks
- Reinforcement Learning
- Variational Autoencoders
- Transformer models
Based on End-User
- Government Agencies & Departments
- Public Service Providers
- Law Enforcement & Security Agencies
- Research & Policy Institutions
- Citizen Engagement Platforms
- Other End-Users
Growth Opportunity
Increasing Digital Transformation
The market for generative AI in the public sector offers tremendous growth potential due to various factors. One such opportunity lies in greater recognition of AI technologies for improving public sector operations. Governments and public organizations are quickly realizing the advantages of generative AI for streamlining processes, improving decision-making capabilities, and expanding service delivery. As our understanding deepens, there will be increased demand for generative AI solutions across various domains within the public sector. Furthermore, an exponentially expanding amount of data represents another growth opportunity in this space.
Government agencies and departments possess vast amounts of data ranging from administrative records to citizen-generated records, making Generative AI an invaluable tool in unlocking its value by extracting insights, predicting trends, and creating innovative solutions. Given today's emphasis on evidence-based policymaking and data-driven decision-making processes, Generative AI offers government entities and departments all of the tools and capabilities required to leverage its wealth of data resources available within public services.
Demand for citizen-centric services and improved citizen engagement creates an impressive growth opportunity for generative AI in the public sector. Citizens expect personalized and tailored interactions when engaging with government services. Generative AI technologies can assist public sector organizations in accomplishing this objective by offering personalized recommendations, interactive interfaces, and responsive communication services that enhance citizen satisfaction, engagement, and trust.
Innovations in AI technologies also contribute to the rise of generative AI in public sector applications. As AI algorithms and models continue to advance, their accuracy, efficiency, and capabilities of generative AI solutions will become ever more impressive - opening up new possibilities for creating realistic outputs while tackling complex challenges or automating intelligent processes within public institutions.
Latest Trends
Ethical AI and Responsible AI Governance
The field of generative AI in the public sector is witnessing several latest trends that are shaping the landscape. One prominent trend is the increasing emphasis on ethical AI and responsible AI governance. Governments and public organizations are recognizing the importance of ensuring fairness, transparency, and accountability in generative AI systems. Efforts are being made to address biases, privacy concerns, and the potential societal impact of AI. Ethical guidelines, regulatory frameworks, and AI audit processes are being developed to guide the public sector's responsible and trustworthy use of generative AI.
Explainable AI is another significant trend in generative AI. As AI systems become more complex, there is a growing demand for transparency and interpretability. Stakeholders in the public sector require explanations for AI-generated outputs and decisions to understand the underlying reasoning. Researchers and developers are exploring methods to make generative AI models more interpretable, enabling users to understand how the models arrive at their outputs and providing insights into the decision-making process.
The integration of generative AI with other emerging technologies is also an emerging trend. For example, the combination of generative AI with blockchain technology can enhance data privacy, security, and trust in the public sector. Blockchain can enable secure and immutable storage of AI-generated outputs, ensuring the integrity and traceability of data. This integration opens up possibilities for applications such as secure data sharing, smart contracts, and transparent decision-making.
The use of generative AI in augmented reality (AR) and virtual reality (VR) applications is gaining momentum. Generative AI algorithms can generate realistic and immersive virtual environments, objects, and characters. This trend has implications for training simulations, urban planning, architecture, and cultural heritage preservation. The combination of generative AI and AR/VR technologies has the potential to revolutionize the way public sector entities visualize and interact with data and virtual environments.
Regional Analysis
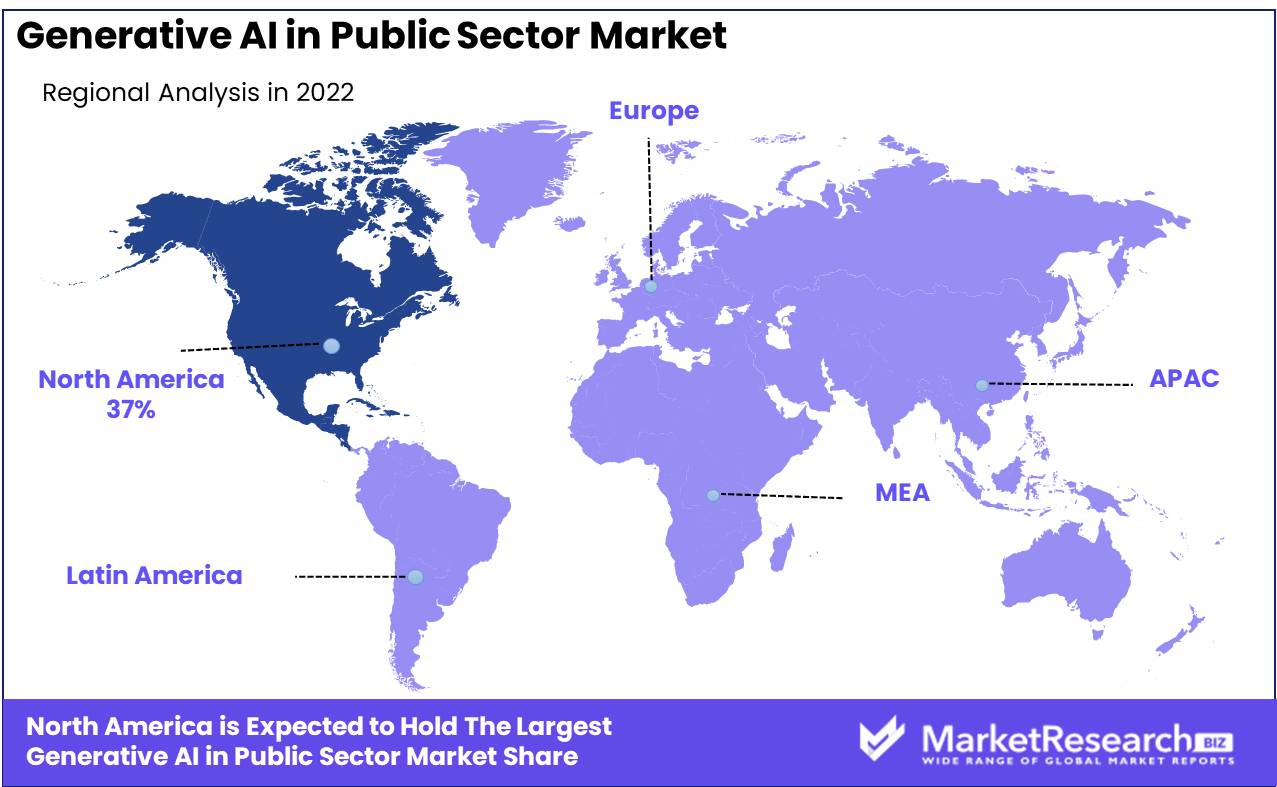
North America Accounted for the Largest Revenue Share in Generative AI in Public Sector Market in 2022.
North America is the leading region in the global Generative AI in public sector market. Owing to One key factor is the region's strong presence of leading AI technology companies, research institutions, and innovation hubs. The United States, in particular, has been at the forefront of AI development, with Silicon Valley serving as a global hub for AI innovation. This concentration of expertise and resources has propelled the adoption and advancement of generative AI technologies in the public sector.
Moreover, North America boasts advanced technological infrastructure and a favorable investment environment, attracting significant investments in AI research and development. Government initiatives, such as the National AI Research Resource Task Force in the United States, foster collaboration between academia, industry, and government entities to drive AI innovation in the public sector. Another contributing factor is the region's supportive policies and regulatory frameworks that encourage AI adoption and development.
The United States government has demonstrated a keen interest in utilizing AI technologies, including generative AI, in various public sector domains. Initiatives like the White House's American AI Initiative and the National Artificial Intelligence Research Institutes program have accelerated the integration of AI in government agencies and departments.
Key Regions and Countries
North America
- US
- Canada
- Mexico
Western Europe
- Germany
- France
- The UK
- Spain
- Italy
- Portugal
- Ireland
- Austria
- Switzerland
- Benelux
- Nordic
- Rest of Western Europe
Eastern Europe
- Russia
- Poland
- The Czech Republic
- Greece
- Rest of Eastern Europe
APAC
- China
- Japan
- South Korea
- India
- Australia & New Zealand
- Indonesia
- Malaysia
- Philippines
- Singapore
- Thailand
- Vietnam
- Rest of APAC
Latin America
- Brazil
- Colombia
- Chile
- Argentina
- Costa Rica
- Rest of Latin America
Middle East & Africa
- Algeria
- Egypt
- Israel
- Kuwait
- Nigeria
- Saudi Arabia
- South Africa
- Turkey
- United Arab Emirates
- Rest of MEA
Market Share & Key Players Analysis
Market share and key player analysis in the generative AI market in the public sector highlight the competitive landscape and major contributors to the industry. While specific market share figures can vary based on the latest data, several key players have made significant advancements and established themselves as leaders in the field. Leading technology companies such as IBM Corporation, Microsoft Corporation, and Google (Alphabet Inc.) are prominent players in the generative AI market.
These companies have invested heavily in AI research and development, offering comprehensive AI platforms and solutions that encompass generative AI capabilities. Their extensive resources, technical expertise, and strong industry presence have positioned them as key players in driving innovation and adoption of generative AI in the public sector.
Top Key Players in Generative AI in Public Sector Market
- OpenAI
- IBM
- Microsoft
- Amazon Web Services (AWS)
- NVIDIA
- Intel
- Salesforce
- Oracle
- Accenture
- Deloitte
- Other Key Players
Recent Development
- In 2021, OpenAI introduced DALL-E, a generative model capable of creating images from textual descriptions. This model generated significant interest and showcased the potential of generative AI in creative applications.
- In February 2021, NVIDIA released NVIDIA Canvas, an AI-powered application that enables artists to create complex digital paintings using generative AI techniques quickly.
Report Scope:
Report Features Description Market Value (2022) USD 152 Mn Forecast Revenue (2032) USD 4,873 Mn CAGR (2023-2032) 42.7% Base Year for Estimation 2022 Historic Period 2016-2022 Forecast Period 2023-2032 Report Coverage Revenue Forecast, Market Dynamics, COVID-19 Impact, Competitive Landscape, Recent Developments Segments Covered By Deployment Mode-Cloud-based, On-premises, and Edge; By Technology-Generative Adversarial Networks, Recurrent Neural Networks, Reinforcement Learning, Variational Autoencoders, and Transformer models; By End-User- Government Agencies & departments, Public Service Providers, Law Enforcement & Security Agencies, Research & Policy Institutions, Citizen Engagement Platforms, and Other End-Users Regional Analysis North America – The US, Canada, & Mexico; Western Europe – Germany, France, The UK, Spain, Italy, Portugal, Ireland, Austria, Switzerland, Benelux, Nordic, & Rest of Western Europe; Eastern Europe – Russia, Poland, The Czech Republic, Greece, & Rest of Eastern Europe; APAC – China, Japan, South Korea, India, Australia & New Zealand, Indonesia, Malaysia, Philippines, Singapore, Thailand, Vietnam, & Rest of APAC; Latin America – Brazil, Colombia, Chile, Argentina, Costa Rica, & Rest of Latin America; Middle East & Africa – Algeria, Egypt, Israel, Kuwait, Nigeria, Saudi Arabia, South Africa, Turkey, United Arab Emirates, & Rest of MEA Competitive Landscape OpenAI, IBM, Microsoft, Amazon Web Services (AWS), NVIDIA, Intel, Salesforce, Oracle, Accenture, Deloitte, and Other Key Players Customization Scope Customization for segments, region/country-level will be provided. Moreover, additional customization can be done based on the requirements. Purchase Options We have three licenses to opt for: Single User License, Multi-User License (Up to 5 Users), Corporate Use License (Unlimited User and Printable PDF) - OpenAI
- IBM
- Microsoft
- Amazon Web Services (AWS)
- NVIDIA
- Intel
- Salesforce
- Oracle
- Accenture
- Deloitte
- Other Key Players
- 1. Executive Summary
- 1.1. Definition
- 1.2. Taxonomy
- 1.3. Research Scope
- 1.4. Key Analysis
- 1.5. Key Findings by Major Segments
- 1.6. Top strategies by Major Players
- 2. Global Generative AI in the Public Sector Market Overview
- 2.1. Generative AI in the Public Sector Market Dynamics
- 2.1.1. Drivers
- 2.1.2. Opportunities
- 2.1.3. Restraints
- 2.1.4. Challenges
- 2.2. Macro-economic Factors
- 2.3. Regulatory Framework
- 2.4. Market Investment Feasibility Index
- 2.5. PEST Analysis
- 2.6. PORTER’S Five Force Analysis
- 2.7. Drivers & Restraints Impact Analysis
- 2.8. Industry Chain Analysis
- 2.9. Cost Structure Analysis
- 2.10. Marketing Strategy
- 2.11. Russia-Ukraine War Impact Analysis
- 2.12. Opportunity Map Analysis
- 2.13. Market Competition Scenario Analysis
- 2.14. Product Life Cycle Analysis
- 2.15. Opportunity Orbits
- 2.16. Manufacturer Intensity Map
- 2.17. Major Companies sales by Value & Volume
- 2.1. Generative AI in the Public Sector Market Dynamics
- 3. Global Generative AI in the Public Sector Market Analysis, Opportunity and Forecast, 2016-2032
- 3.1. Global Generative AI in the Public Sector Market Analysis, 2016-2021
- 3.2. Global Generative AI in the Public Sector Market Opportunity and Forecast, 2023-2032
- 3.3. Global Generative AI in the Public Sector Market Analysis, Opportunity and Forecast, By Deployment Mode, 2016-2032
- 3.3.1. Global Generative AI in the Public Sector Market Analysis by Deployment Mode: Introduction
- 3.3.2. Market Size Absolute $ Opportunity Analysis and Forecast, By Deployment Mode, 2016-2032
- 3.3.3. Cloud-based
- 3.3.4. On-premises
- 3.3.5. Edge
- 3.4. Global Generative AI in the Public Sector Market Analysis, Opportunity and Forecast, By Technology, 2016-2032
- 3.4.1. Global Generative AI in the Public Sector Market Analysis by Technology: Introduction
- 3.4.2. Market Size Absolute $ Opportunity Analysis and Forecast, By Technology, 2016-2032
- 3.4.4. Generative Adversarial Networks
- 3.4.5. Recurrent Neural Networks
- 3.4.6. Reinforcement Learning
- 3.4.7. Variational Autoencoders
- 3.4.8. Transformer models
- 3.5. Global Generative AI in the Public Sector Market Analysis, Opportunity and Forecast, By End-User, 2016-2032
- 3.5.1. Global Generative AI in the Public Sector Market Analysis by End-User: Introduction
- 3.5.2. Market Size Absolute $ Opportunity Analysis and Forecast, By End-User, 2016-2032
- 3.5.3. Government Agencies & Departments
- 3.5.4. Public Service Providers
- 3.5.5. Law Enforcement & Security Agencies
- 3.5.6. Research & Policy Institutions
- 3.5.7. Citizen Engagement Platforms
- 3.5.8. Other End-Users
- 4. North America Generative AI in the Public Sector Market Analysis, Opportunity and Forecast, 2016-2032
- 4.1. North America Generative AI in the Public Sector Market Analysis, 2016-2021
- 4.2. North America Generative AI in the Public Sector Market Opportunity and Forecast, 2023-2032
- 4.3. North America Generative AI in the Public Sector Market Analysis, Opportunity and Forecast, By Deployment Mode, 2016-2032
- 4.3.1. North America Generative AI in the Public Sector Market Analysis by Deployment Mode: Introduction
- 4.3.2. Market Size Absolute $ Opportunity Analysis and Forecast, By Deployment Mode, 2016-2032
- 4.3.3. Cloud-based
- 4.3.4. On-premises
- 4.3.5. Edge
- 4.4. North America Generative AI in the Public Sector Market Analysis, Opportunity and Forecast, By Technology, 2016-2032
- 4.4.1. North America Generative AI in the Public Sector Market Analysis by Technology: Introduction
- 4.4.2. Market Size Absolute $ Opportunity Analysis and Forecast, By Technology, 2016-2032
- 4.4.4. Generative Adversarial Networks
- 4.4.5. Recurrent Neural Networks
- 4.4.6. Reinforcement Learning
- 4.4.7. Variational Autoencoders
- 4.4.8. Transformer models
- 4.5. North America Generative AI in the Public Sector Market Analysis, Opportunity and Forecast, By End-User, 2016-2032
- 4.5.1. North America Generative AI in the Public Sector Market Analysis by End-User: Introduction
- 4.5.2. Market Size Absolute $ Opportunity Analysis and Forecast, By End-User, 2016-2032
- 4.5.3. Government Agencies & Departments
- 4.5.4. Public Service Providers
- 4.5.5. Law Enforcement & Security Agencies
- 4.5.6. Research & Policy Institutions
- 4.5.7. Citizen Engagement Platforms
- 4.5.8. Other End-Users
- 4.6. North America Generative AI in the Public Sector Market Analysis, Opportunity and Forecast, By Country , 2016-2032
- 4.6.1. North America Generative AI in the Public Sector Market Analysis by Country : Introduction
- 4.6.2. Market Size Absolute $ Opportunity Analysis and Forecast, Country , 2016-2032
- 4.6.2.1. The US
- 4.6.2.2. Canada
- 4.6.2.3. Mexico
- 5. Western Europe Generative AI in the Public Sector Market Analysis, Opportunity and Forecast, 2016-2032
- 5.1. Western Europe Generative AI in the Public Sector Market Analysis, 2016-2021
- 5.2. Western Europe Generative AI in the Public Sector Market Opportunity and Forecast, 2023-2032
- 5.3. Western Europe Generative AI in the Public Sector Market Analysis, Opportunity and Forecast, By Deployment Mode, 2016-2032
- 5.3.1. Western Europe Generative AI in the Public Sector Market Analysis by Deployment Mode: Introduction
- 5.3.2. Market Size Absolute $ Opportunity Analysis and Forecast, By Deployment Mode, 2016-2032
- 5.3.3. Cloud-based
- 5.3.4. On-premises
- 5.3.5. Edge
- 5.4. Western Europe Generative AI in the Public Sector Market Analysis, Opportunity and Forecast, By Technology, 2016-2032
- 5.4.1. Western Europe Generative AI in the Public Sector Market Analysis by Technology: Introduction
- 5.4.2. Market Size Absolute $ Opportunity Analysis and Forecast, By Technology, 2016-2032
- 5.4.4. Generative Adversarial Networks
- 5.4.5. Recurrent Neural Networks
- 5.4.6. Reinforcement Learning
- 5.4.7. Variational Autoencoders
- 5.4.8. Transformer models
- 5.5. Western Europe Generative AI in the Public Sector Market Analysis, Opportunity and Forecast, By End-User, 2016-2032
- 5.5.1. Western Europe Generative AI in the Public Sector Market Analysis by End-User: Introduction
- 5.5.2. Market Size Absolute $ Opportunity Analysis and Forecast, By End-User, 2016-2032
- 5.5.3. Government Agencies & Departments
- 5.5.4. Public Service Providers
- 5.5.5. Law Enforcement & Security Agencies
- 5.5.6. Research & Policy Institutions
- 5.5.7. Citizen Engagement Platforms
- 5.5.8. Other End-Users
- 5.6. Western Europe Generative AI in the Public Sector Market Analysis, Opportunity and Forecast, By Country , 2016-2032
- 5.6.1. Western Europe Generative AI in the Public Sector Market Analysis by Country : Introduction
- 5.6.2. Market Size Absolute $ Opportunity Analysis and Forecast, Country , 2016-2032
- 5.6.2.1. Germany
- 5.6.2.2. France
- 5.6.2.3. The UK
- 5.6.2.4. Spain
- 5.6.2.5. Italy
- 5.6.2.6. Portugal
- 5.6.2.7. Ireland
- 5.6.2.8. Austria
- 5.6.2.9. Switzerland
- 5.6.2.10. Benelux
- 5.6.2.11. Nordic
- 5.6.2.12. Rest of Western Europe
- 6. Eastern Europe Generative AI in the Public Sector Market Analysis, Opportunity and Forecast, 2016-2032
- 6.1. Eastern Europe Generative AI in the Public Sector Market Analysis, 2016-2021
- 6.2. Eastern Europe Generative AI in the Public Sector Market Opportunity and Forecast, 2023-2032
- 6.3. Eastern Europe Generative AI in the Public Sector Market Analysis, Opportunity and Forecast, By Deployment Mode, 2016-2032
- 6.3.1. Eastern Europe Generative AI in the Public Sector Market Analysis by Deployment Mode: Introduction
- 6.3.2. Market Size Absolute $ Opportunity Analysis and Forecast, By Deployment Mode, 2016-2032
- 6.3.3. Cloud-based
- 6.3.4. On-premises
- 6.3.5. Edge
- 6.4. Eastern Europe Generative AI in the Public Sector Market Analysis, Opportunity and Forecast, By Technology, 2016-2032
- 6.4.1. Eastern Europe Generative AI in the Public Sector Market Analysis by Technology: Introduction
- 6.4.2. Market Size Absolute $ Opportunity Analysis and Forecast, By Technology, 2016-2032
- 6.4.4. Generative Adversarial Networks
- 6.4.5. Recurrent Neural Networks
- 6.4.6. Reinforcement Learning
- 6.4.7. Variational Autoencoders
- 6.4.8. Transformer models
- 6.5. Eastern Europe Generative AI in the Public Sector Market Analysis, Opportunity and Forecast, By End-User, 2016-2032
- 6.5.1. Eastern Europe Generative AI in the Public Sector Market Analysis by End-User: Introduction
- 6.5.2. Market Size Absolute $ Opportunity Analysis and Forecast, By End-User, 2016-2032
- 6.5.3. Government Agencies & Departments
- 6.5.4. Public Service Providers
- 6.5.5. Law Enforcement & Security Agencies
- 6.5.6. Research & Policy Institutions
- 6.5.7. Citizen Engagement Platforms
- 6.5.8. Other End-Users
- 6.6. Eastern Europe Generative AI in the Public Sector Market Analysis, Opportunity and Forecast, By Country , 2016-2032
- 6.6.1. Eastern Europe Generative AI in the Public Sector Market Analysis by Country : Introduction
- 6.6.2. Market Size Absolute $ Opportunity Analysis and Forecast, Country , 2016-2032
- 6.6.2.1. Russia
- 6.6.2.2. Poland
- 6.6.2.3. The Czech Republic
- 6.6.2.4. Greece
- 6.6.2.5. Rest of Eastern Europe
- 7. APAC Generative AI in the Public Sector Market Analysis, Opportunity and Forecast, 2016-2032
- 7.1. APAC Generative AI in the Public Sector Market Analysis, 2016-2021
- 7.2. APAC Generative AI in the Public Sector Market Opportunity and Forecast, 2023-2032
- 7.3. APAC Generative AI in the Public Sector Market Analysis, Opportunity and Forecast, By Deployment Mode, 2016-2032
- 7.3.1. APAC Generative AI in the Public Sector Market Analysis by Deployment Mode: Introduction
- 7.3.2. Market Size Absolute $ Opportunity Analysis and Forecast, By Deployment Mode, 2016-2032
- 7.3.3. Cloud-based
- 7.3.4. On-premises
- 7.3.5. Edge
- 7.4. APAC Generative AI in the Public Sector Market Analysis, Opportunity and Forecast, By Technology, 2016-2032
- 7.4.1. APAC Generative AI in the Public Sector Market Analysis by Technology: Introduction
- 7.4.2. Market Size Absolute $ Opportunity Analysis and Forecast, By Technology, 2016-2032
- 7.4.4. Generative Adversarial Networks
- 7.4.5. Recurrent Neural Networks
- 7.4.6. Reinforcement Learning
- 7.4.7. Variational Autoencoders
- 7.4.8. Transformer models
- 7.5. APAC Generative AI in the Public Sector Market Analysis, Opportunity and Forecast, By End-User, 2016-2032
- 7.5.1. APAC Generative AI in the Public Sector Market Analysis by End-User: Introduction
- 7.5.2. Market Size Absolute $ Opportunity Analysis and Forecast, By End-User, 2016-2032
- 7.5.3. Government Agencies & Departments
- 7.5.4. Public Service Providers
- 7.5.5. Law Enforcement & Security Agencies
- 7.5.6. Research & Policy Institutions
- 7.5.7. Citizen Engagement Platforms
- 7.5.8. Other End-Users
- 7.6. APAC Generative AI in the Public Sector Market Analysis, Opportunity and Forecast, By Country , 2016-2032
- 7.6.1. APAC Generative AI in the Public Sector Market Analysis by Country : Introduction
- 7.6.2. Market Size Absolute $ Opportunity Analysis and Forecast, Country , 2016-2032
- 7.6.2.1. China
- 7.6.2.2. Japan
- 7.6.2.3. South Korea
- 7.6.2.4. India
- 7.6.2.5. Australia & New Zeland
- 7.6.2.6. Indonesia
- 7.6.2.7. Malaysia
- 7.6.2.8. Philippines
- 7.6.2.9. Singapore
- 7.6.2.10. Thailand
- 7.6.2.11. Vietnam
- 7.6.2.12. Rest of APAC
- 8. Latin America Generative AI in the Public Sector Market Analysis, Opportunity and Forecast, 2016-2032
- 8.1. Latin America Generative AI in the Public Sector Market Analysis, 2016-2021
- 8.2. Latin America Generative AI in the Public Sector Market Opportunity and Forecast, 2023-2032
- 8.3. Latin America Generative AI in the Public Sector Market Analysis, Opportunity and Forecast, By Deployment Mode, 2016-2032
- 8.3.1. Latin America Generative AI in the Public Sector Market Analysis by Deployment Mode: Introduction
- 8.3.2. Market Size Absolute $ Opportunity Analysis and Forecast, By Deployment Mode, 2016-2032
- 8.3.3. Cloud-based
- 8.3.4. On-premises
- 8.3.5. Edge
- 8.4. Latin America Generative AI in the Public Sector Market Analysis, Opportunity and Forecast, By Technology, 2016-2032
- 8.4.1. Latin America Generative AI in the Public Sector Market Analysis by Technology: Introduction
- 8.4.2. Market Size Absolute $ Opportunity Analysis and Forecast, By Technology, 2016-2032
- 8.4.4. Generative Adversarial Networks
- 8.4.5. Recurrent Neural Networks
- 8.4.6. Reinforcement Learning
- 8.4.7. Variational Autoencoders
- 8.4.8. Transformer models
- 8.5. Latin America Generative AI in the Public Sector Market Analysis, Opportunity and Forecast, By End-User, 2016-2032
- 8.5.1. Latin America Generative AI in the Public Sector Market Analysis by End-User: Introduction
- 8.5.2. Market Size Absolute $ Opportunity Analysis and Forecast, By End-User, 2016-2032
- 8.5.3. Government Agencies & Departments
- 8.5.4. Public Service Providers
- 8.5.5. Law Enforcement & Security Agencies
- 8.5.6. Research & Policy Institutions
- 8.5.7. Citizen Engagement Platforms
- 8.5.8. Other End-Users
- 8.6. Latin America Generative AI in the Public Sector Market Analysis, Opportunity and Forecast, By Country , 2016-2032
- 8.6.1. Latin America Generative AI in the Public Sector Market Analysis by Country : Introduction
- 8.6.2. Market Size Absolute $ Opportunity Analysis and Forecast, Country , 2016-2032
- 8.6.2.1. Brazil
- 8.6.2.2. Colombia
- 8.6.2.3. Chile
- 8.6.2.4. Argentina
- 8.6.2.5. Costa Rica
- 8.6.2.6. Rest of Latin America
- 9. Middle East & Africa Generative AI in the Public Sector Market Analysis, Opportunity and Forecast, 2016-2032
- 9.1. Middle East & Africa Generative AI in the Public Sector Market Analysis, 2016-2021
- 9.2. Middle East & Africa Generative AI in the Public Sector Market Opportunity and Forecast, 2023-2032
- 9.3. Middle East & Africa Generative AI in the Public Sector Market Analysis, Opportunity and Forecast, By Deployment Mode, 2016-2032
- 9.3.1. Middle East & Africa Generative AI in the Public Sector Market Analysis by Deployment Mode: Introduction
- 9.3.2. Market Size Absolute $ Opportunity Analysis and Forecast, By Deployment Mode, 2016-2032
- 9.3.3. Cloud-based
- 9.3.4. On-premises
- 9.3.5. Edge
- 9.4. Middle East & Africa Generative AI in the Public Sector Market Analysis, Opportunity and Forecast, By Technology, 2016-2032
- 9.4.1. Middle East & Africa Generative AI in the Public Sector Market Analysis by Technology: Introduction
- 9.4.2. Market Size Absolute $ Opportunity Analysis and Forecast, By Technology, 2016-2032
- 9.4.4. Generative Adversarial Networks
- 9.4.5. Recurrent Neural Networks
- 9.4.6. Reinforcement Learning
- 9.4.7. Variational Autoencoders
- 9.4.8. Transformer models
- 9.5. Middle East & Africa Generative AI in the Public Sector Market Analysis, Opportunity and Forecast, By End-User, 2016-2032
- 9.5.1. Middle East & Africa Generative AI in the Public Sector Market Analysis by End-User: Introduction
- 9.5.2. Market Size Absolute $ Opportunity Analysis and Forecast, By End-User, 2016-2032
- 9.5.3. Government Agencies & Departments
- 9.5.4. Public Service Providers
- 9.5.5. Law Enforcement & Security Agencies
- 9.5.6. Research & Policy Institutions
- 9.5.7. Citizen Engagement Platforms
- 9.5.8. Other End-Users
- 9.6. Middle East & Africa Generative AI in the Public Sector Market Analysis, Opportunity and Forecast, By Country , 2016-2032
- 9.6.1. Middle East & Africa Generative AI in the Public Sector Market Analysis by Country : Introduction
- 9.6.2. Market Size Absolute $ Opportunity Analysis and Forecast, Country , 2016-2032
- 9.6.2.1. Algeria
- 9.6.2.2. Egypt
- 9.6.2.3. Israel
- 9.6.2.4. Kuwait
- 9.6.2.5. Nigeria
- 9.6.2.6. Saudi Arabia
- 9.6.2.7. South Africa
- 9.6.2.8. Turkey
- 9.6.2.9. The UAE
- 9.6.2.10. Rest of MEA
- 10. Global Generative AI in the Public Sector Market Analysis, Opportunity and Forecast, By Region , 2016-2032
- 10.1. Global Generative AI in the Public Sector Market Analysis by Region : Introduction
- 10.2. Market Size Absolute $ Opportunity Analysis and Forecast, By Region , 2016-2032
- 10.2.1. North America
- 10.2.2. Western Europe
- 10.2.3. Eastern Europe
- 10.2.4. APAC
- 10.2.5. Latin America
- 10.2.6. Middle East & Africa
- 11. Global Generative AI in the Public Sector Market Competitive Landscape, Market Share Analysis, and Company Profiles
- 11.1. Market Share Analysis
- 11.2. Company Profiles
- 11.3. OpenAI
- 11.3.1. Company Overview
- 11.3.2. Financial Highlights
- 11.3.3. Product Portfolio
- 11.3.4. SWOT Analysis
- 11.3.5. Key Strategies and Developments
- 11.4. IBM
- 11.4.1. Company Overview
- 11.4.2. Financial Highlights
- 11.4.3. Product Portfolio
- 11.4.4. SWOT Analysis
- 11.4.5. Key Strategies and Developments
- 11.5. Microsoft
- 11.5.1. Company Overview
- 11.5.2. Financial Highlights
- 11.5.3. Product Portfolio
- 11.5.4. SWOT Analysis
- 11.5.5. Key Strategies and Developments
- 11.6. Amazon Web Services (AWS)
- 11.6.1. Company Overview
- 11.6.2. Financial Highlights
- 11.6.3. Product Portfolio
- 11.6.4. SWOT Analysis
- 11.6.5. Key Strategies and Developments
- 11.7. NVIDIA
- 11.7.1. Company Overview
- 11.7.2. Financial Highlights
- 11.7.3. Product Portfolio
- 11.7.4. SWOT Analysis
- 11.7.5. Key Strategies and Developments
- 11.8. Intel
- 11.8.1. Company Overview
- 11.8.2. Financial Highlights
- 11.8.3. Product Portfolio
- 11.8.4. SWOT Analysis
- 11.8.5. Key Strategies and Developments
- 11.9. Salesforce
- 11.9.1. Company Overview
- 11.9.2. Financial Highlights
- 11.9.3. Product Portfolio
- 11.9.4. SWOT Analysis
- 11.9.5. Key Strategies and Developments
- 11.10. Oracle
- 11.10.1. Company Overview
- 11.10.2. Financial Highlights
- 11.10.3. Product Portfolio
- 11.10.4. SWOT Analysis
- 11.10.5. Key Strategies and Developments
- 11.11. Accenture
- 11.11.1. Company Overview
- 11.11.2. Financial Highlights
- 11.11.3. Product Portfolio
- 11.11.4. SWOT Analysis
- 11.11.5. Key Strategies and Developments
- 11.12. Deloitte
- 11.12.1. Company Overview
- 11.12.2. Financial Highlights
- 11.12.3. Product Portfolio
- 11.12.4. SWOT Analysis
- 11.12.5. Key Strategies and Developments
- 11.13. Other Key Players
- 11.13.1. Company Overview
- 11.13.2. Financial Highlights
- 11.13.3. Product Portfolio
- 11.13.4. SWOT Analysis
- 11.13.5. Key Strategies and Developments
- 12. Assumptions and Acronyms
- 13. Research Methodology
- 14. Contact
- List of Figures
- Figure 1: Global Generative AI in the Public Sector Market Revenue (US$ Mn) Market Share by Deployment Mode in 2022
- Figure 2: Global Generative AI in the Public Sector Market Attractiveness Analysis by Deployment Mode, 2016-2032
- Figure 3: Global Generative AI in the Public Sector Market Revenue (US$ Mn) Market Share by Technologyin 2022
- Figure 4: Global Generative AI in the Public Sector Market Attractiveness Analysis by Technology, 2016-2032
- Figure 5: Global Generative AI in the Public Sector Market Revenue (US$ Mn) Market Share by End-Userin 2022
- Figure 6: Global Generative AI in the Public Sector Market Attractiveness Analysis by End-User, 2016-2032
- Figure 7: Global Generative AI in the Public Sector Market Revenue (US$ Mn) Market Share by Region in 2022
- Figure 8: Global Generative AI in the Public Sector Market Attractiveness Analysis by Region, 2016-2032
- Figure 9: Global Generative AI in the Public Sector Market Revenue (US$ Mn) (2016-2032)
- Figure 10: Global Generative AI in the Public Sector Market Revenue (US$ Mn) Comparison by Region (2016-2032)
- Figure 11: Global Generative AI in the Public Sector Market Revenue (US$ Mn) Comparison by Deployment Mode (2016-2032)
- Figure 12: Global Generative AI in the Public Sector Market Revenue (US$ Mn) Comparison by Technology (2016-2032)
- Figure 13: Global Generative AI in the Public Sector Market Revenue (US$ Mn) Comparison by End-User (2016-2032)
- Figure 14: Global Generative AI in the Public Sector Market Y-o-Y Growth Rate Comparison by Region (2016-2032)
- Figure 15: Global Generative AI in the Public Sector Market Y-o-Y Growth Rate Comparison by Deployment Mode (2016-2032)
- Figure 16: Global Generative AI in the Public Sector Market Y-o-Y Growth Rate Comparison by Technology (2016-2032)
- Figure 17: Global Generative AI in the Public Sector Market Y-o-Y Growth Rate Comparison by End-User (2016-2032)
- Figure 18: Global Generative AI in the Public Sector Market Share Comparison by Region (2016-2032)
- Figure 19: Global Generative AI in the Public Sector Market Share Comparison by Deployment Mode (2016-2032)
- Figure 20: Global Generative AI in the Public Sector Market Share Comparison by Technology (2016-2032)
- Figure 21: Global Generative AI in the Public Sector Market Share Comparison by End-User (2016-2032)
- Figure 22: North America Generative AI in the Public Sector Market Revenue (US$ Mn) Market Share by Deployment Modein 2022
- Figure 23: North America Generative AI in the Public Sector Market Attractiveness Analysis by Deployment Mode, 2016-2032
- Figure 24: North America Generative AI in the Public Sector Market Revenue (US$ Mn) Market Share by Technologyin 2022
- Figure 25: North America Generative AI in the Public Sector Market Attractiveness Analysis by Technology, 2016-2032
- Figure 26: North America Generative AI in the Public Sector Market Revenue (US$ Mn) Market Share by End-Userin 2022
- Figure 27: North America Generative AI in the Public Sector Market Attractiveness Analysis by End-User, 2016-2032
- Figure 28: North America Generative AI in the Public Sector Market Revenue (US$ Mn) Market Share by Country in 2022
- Figure 29: North America Generative AI in the Public Sector Market Attractiveness Analysis by Country, 2016-2032
- Figure 30: North America Generative AI in the Public Sector Market Revenue (US$ Mn) (2016-2032)
- Figure 31: North America Generative AI in the Public Sector Market Revenue (US$ Mn) Comparison by Country (2016-2032)
- Figure 32: North America Generative AI in the Public Sector Market Revenue (US$ Mn) Comparison by Deployment Mode (2016-2032)
- Figure 33: North America Generative AI in the Public Sector Market Revenue (US$ Mn) Comparison by Technology (2016-2032)
- Figure 34: North America Generative AI in the Public Sector Market Revenue (US$ Mn) Comparison by End-User (2016-2032)
- Figure 35: North America Generative AI in the Public Sector Market Y-o-Y Growth Rate Comparison by Country (2016-2032)
- Figure 36: North America Generative AI in the Public Sector Market Y-o-Y Growth Rate Comparison by Deployment Mode (2016-2032)
- Figure 37: North America Generative AI in the Public Sector Market Y-o-Y Growth Rate Comparison by Technology (2016-2032)
- Figure 38: North America Generative AI in the Public Sector Market Y-o-Y Growth Rate Comparison by End-User (2016-2032)
- Figure 39: North America Generative AI in the Public Sector Market Share Comparison by Country (2016-2032)
- Figure 40: North America Generative AI in the Public Sector Market Share Comparison by Deployment Mode (2016-2032)
- Figure 41: North America Generative AI in the Public Sector Market Share Comparison by Technology (2016-2032)
- Figure 42: North America Generative AI in the Public Sector Market Share Comparison by End-User (2016-2032)
- Figure 43: Western Europe Generative AI in the Public Sector Market Revenue (US$ Mn) Market Share by Deployment Modein 2022
- Figure 44: Western Europe Generative AI in the Public Sector Market Attractiveness Analysis by Deployment Mode, 2016-2032
- Figure 45: Western Europe Generative AI in the Public Sector Market Revenue (US$ Mn) Market Share by Technologyin 2022
- Figure 46: Western Europe Generative AI in the Public Sector Market Attractiveness Analysis by Technology, 2016-2032
- Figure 47: Western Europe Generative AI in the Public Sector Market Revenue (US$ Mn) Market Share by End-Userin 2022
- Figure 48: Western Europe Generative AI in the Public Sector Market Attractiveness Analysis by End-User, 2016-2032
- Figure 49: Western Europe Generative AI in the Public Sector Market Revenue (US$ Mn) Market Share by Country in 2022
- Figure 50: Western Europe Generative AI in the Public Sector Market Attractiveness Analysis by Country, 2016-2032
- Figure 51: Western Europe Generative AI in the Public Sector Market Revenue (US$ Mn) (2016-2032)
- Figure 52: Western Europe Generative AI in the Public Sector Market Revenue (US$ Mn) Comparison by Country (2016-2032)
- Figure 53: Western Europe Generative AI in the Public Sector Market Revenue (US$ Mn) Comparison by Deployment Mode (2016-2032)
- Figure 54: Western Europe Generative AI in the Public Sector Market Revenue (US$ Mn) Comparison by Technology (2016-2032)
- Figure 55: Western Europe Generative AI in the Public Sector Market Revenue (US$ Mn) Comparison by End-User (2016-2032)
- Figure 56: Western Europe Generative AI in the Public Sector Market Y-o-Y Growth Rate Comparison by Country (2016-2032)
- Figure 57: Western Europe Generative AI in the Public Sector Market Y-o-Y Growth Rate Comparison by Deployment Mode (2016-2032)
- Figure 58: Western Europe Generative AI in the Public Sector Market Y-o-Y Growth Rate Comparison by Technology (2016-2032)
- Figure 59: Western Europe Generative AI in the Public Sector Market Y-o-Y Growth Rate Comparison by End-User (2016-2032)
- Figure 60: Western Europe Generative AI in the Public Sector Market Share Comparison by Country (2016-2032)
- Figure 61: Western Europe Generative AI in the Public Sector Market Share Comparison by Deployment Mode (2016-2032)
- Figure 62: Western Europe Generative AI in the Public Sector Market Share Comparison by Technology (2016-2032)
- Figure 63: Western Europe Generative AI in the Public Sector Market Share Comparison by End-User (2016-2032)
- Figure 64: Eastern Europe Generative AI in the Public Sector Market Revenue (US$ Mn) Market Share by Deployment Modein 2022
- Figure 65: Eastern Europe Generative AI in the Public Sector Market Attractiveness Analysis by Deployment Mode, 2016-2032
- Figure 66: Eastern Europe Generative AI in the Public Sector Market Revenue (US$ Mn) Market Share by Technologyin 2022
- Figure 67: Eastern Europe Generative AI in the Public Sector Market Attractiveness Analysis by Technology, 2016-2032
- Figure 68: Eastern Europe Generative AI in the Public Sector Market Revenue (US$ Mn) Market Share by End-Userin 2022
- Figure 69: Eastern Europe Generative AI in the Public Sector Market Attractiveness Analysis by End-User, 2016-2032
- Figure 70: Eastern Europe Generative AI in the Public Sector Market Revenue (US$ Mn) Market Share by Country in 2022
- Figure 71: Eastern Europe Generative AI in the Public Sector Market Attractiveness Analysis by Country, 2016-2032
- Figure 72: Eastern Europe Generative AI in the Public Sector Market Revenue (US$ Mn) (2016-2032)
- Figure 73: Eastern Europe Generative AI in the Public Sector Market Revenue (US$ Mn) Comparison by Country (2016-2032)
- Figure 74: Eastern Europe Generative AI in the Public Sector Market Revenue (US$ Mn) Comparison by Deployment Mode (2016-2032)
- Figure 75: Eastern Europe Generative AI in the Public Sector Market Revenue (US$ Mn) Comparison by Technology (2016-2032)
- Figure 76: Eastern Europe Generative AI in the Public Sector Market Revenue (US$ Mn) Comparison by End-User (2016-2032)
- Figure 77: Eastern Europe Generative AI in the Public Sector Market Y-o-Y Growth Rate Comparison by Country (2016-2032)
- Figure 78: Eastern Europe Generative AI in the Public Sector Market Y-o-Y Growth Rate Comparison by Deployment Mode (2016-2032)
- Figure 79: Eastern Europe Generative AI in the Public Sector Market Y-o-Y Growth Rate Comparison by Technology (2016-2032)
- Figure 80: Eastern Europe Generative AI in the Public Sector Market Y-o-Y Growth Rate Comparison by End-User (2016-2032)
- Figure 81: Eastern Europe Generative AI in the Public Sector Market Share Comparison by Country (2016-2032)
- Figure 82: Eastern Europe Generative AI in the Public Sector Market Share Comparison by Deployment Mode (2016-2032)
- Figure 83: Eastern Europe Generative AI in the Public Sector Market Share Comparison by Technology (2016-2032)
- Figure 84: Eastern Europe Generative AI in the Public Sector Market Share Comparison by End-User (2016-2032)
- Figure 85: APAC Generative AI in the Public Sector Market Revenue (US$ Mn) Market Share by Deployment Modein 2022
- Figure 86: APAC Generative AI in the Public Sector Market Attractiveness Analysis by Deployment Mode, 2016-2032
- Figure 87: APAC Generative AI in the Public Sector Market Revenue (US$ Mn) Market Share by Technologyin 2022
- Figure 88: APAC Generative AI in the Public Sector Market Attractiveness Analysis by Technology, 2016-2032
- Figure 89: APAC Generative AI in the Public Sector Market Revenue (US$ Mn) Market Share by End-Userin 2022
- Figure 90: APAC Generative AI in the Public Sector Market Attractiveness Analysis by End-User, 2016-2032
- Figure 91: APAC Generative AI in the Public Sector Market Revenue (US$ Mn) Market Share by Country in 2022
- Figure 92: APAC Generative AI in the Public Sector Market Attractiveness Analysis by Country, 2016-2032
- Figure 93: APAC Generative AI in the Public Sector Market Revenue (US$ Mn) (2016-2032)
- Figure 94: APAC Generative AI in the Public Sector Market Revenue (US$ Mn) Comparison by Country (2016-2032)
- Figure 95: APAC Generative AI in the Public Sector Market Revenue (US$ Mn) Comparison by Deployment Mode (2016-2032)
- Figure 96: APAC Generative AI in the Public Sector Market Revenue (US$ Mn) Comparison by Technology (2016-2032)
- Figure 97: APAC Generative AI in the Public Sector Market Revenue (US$ Mn) Comparison by End-User (2016-2032)
- Figure 98: APAC Generative AI in the Public Sector Market Y-o-Y Growth Rate Comparison by Country (2016-2032)
- Figure 99: APAC Generative AI in the Public Sector Market Y-o-Y Growth Rate Comparison by Deployment Mode (2016-2032)
- Figure 100: APAC Generative AI in the Public Sector Market Y-o-Y Growth Rate Comparison by Technology (2016-2032)
- Figure 101: APAC Generative AI in the Public Sector Market Y-o-Y Growth Rate Comparison by End-User (2016-2032)
- Figure 102: APAC Generative AI in the Public Sector Market Share Comparison by Country (2016-2032)
- Figure 103: APAC Generative AI in the Public Sector Market Share Comparison by Deployment Mode (2016-2032)
- Figure 104: APAC Generative AI in the Public Sector Market Share Comparison by Technology (2016-2032)
- Figure 105: APAC Generative AI in the Public Sector Market Share Comparison by End-User (2016-2032)
- Figure 106: Latin America Generative AI in the Public Sector Market Revenue (US$ Mn) Market Share by Deployment Modein 2022
- Figure 107: Latin America Generative AI in the Public Sector Market Attractiveness Analysis by Deployment Mode, 2016-2032
- Figure 108: Latin America Generative AI in the Public Sector Market Revenue (US$ Mn) Market Share by Technologyin 2022
- Figure 109: Latin America Generative AI in the Public Sector Market Attractiveness Analysis by Technology, 2016-2032
- Figure 110: Latin America Generative AI in the Public Sector Market Revenue (US$ Mn) Market Share by End-Userin 2022
- Figure 111: Latin America Generative AI in the Public Sector Market Attractiveness Analysis by End-User, 2016-2032
- Figure 112: Latin America Generative AI in the Public Sector Market Revenue (US$ Mn) Market Share by Country in 2022
- Figure 113: Latin America Generative AI in the Public Sector Market Attractiveness Analysis by Country, 2016-2032
- Figure 114: Latin America Generative AI in the Public Sector Market Revenue (US$ Mn) (2016-2032)
- Figure 115: Latin America Generative AI in the Public Sector Market Revenue (US$ Mn) Comparison by Country (2016-2032)
- Figure 116: Latin America Generative AI in the Public Sector Market Revenue (US$ Mn) Comparison by Deployment Mode (2016-2032)
- Figure 117: Latin America Generative AI in the Public Sector Market Revenue (US$ Mn) Comparison by Technology (2016-2032)
- Figure 118: Latin America Generative AI in the Public Sector Market Revenue (US$ Mn) Comparison by End-User (2016-2032)
- Figure 119: Latin America Generative AI in the Public Sector Market Y-o-Y Growth Rate Comparison by Country (2016-2032)
- Figure 120: Latin America Generative AI in the Public Sector Market Y-o-Y Growth Rate Comparison by Deployment Mode (2016-2032)
- Figure 121: Latin America Generative AI in the Public Sector Market Y-o-Y Growth Rate Comparison by Technology (2016-2032)
- Figure 122: Latin America Generative AI in the Public Sector Market Y-o-Y Growth Rate Comparison by End-User (2016-2032)
- Figure 123: Latin America Generative AI in the Public Sector Market Share Comparison by Country (2016-2032)
- Figure 124: Latin America Generative AI in the Public Sector Market Share Comparison by Deployment Mode (2016-2032)
- Figure 125: Latin America Generative AI in the Public Sector Market Share Comparison by Technology (2016-2032)
- Figure 126: Latin America Generative AI in the Public Sector Market Share Comparison by End-User (2016-2032)
- Figure 127: Middle East & Africa Generative AI in the Public Sector Market Revenue (US$ Mn) Market Share by Deployment Modein 2022
- Figure 128: Middle East & Africa Generative AI in the Public Sector Market Attractiveness Analysis by Deployment Mode, 2016-2032
- Figure 129: Middle East & Africa Generative AI in the Public Sector Market Revenue (US$ Mn) Market Share by Technologyin 2022
- Figure 130: Middle East & Africa Generative AI in the Public Sector Market Attractiveness Analysis by Technology, 2016-2032
- Figure 131: Middle East & Africa Generative AI in the Public Sector Market Revenue (US$ Mn) Market Share by End-Userin 2022
- Figure 132: Middle East & Africa Generative AI in the Public Sector Market Attractiveness Analysis by End-User, 2016-2032
- Figure 133: Middle East & Africa Generative AI in the Public Sector Market Revenue (US$ Mn) Market Share by Country in 2022
- Figure 134: Middle East & Africa Generative AI in the Public Sector Market Attractiveness Analysis by Country, 2016-2032
- Figure 135: Middle East & Africa Generative AI in the Public Sector Market Revenue (US$ Mn) (2016-2032)
- Figure 136: Middle East & Africa Generative AI in the Public Sector Market Revenue (US$ Mn) Comparison by Country (2016-2032)
- Figure 137: Middle East & Africa Generative AI in the Public Sector Market Revenue (US$ Mn) Comparison by Deployment Mode (2016-2032)
- Figure 138: Middle East & Africa Generative AI in the Public Sector Market Revenue (US$ Mn) Comparison by Technology (2016-2032)
- Figure 139: Middle East & Africa Generative AI in the Public Sector Market Revenue (US$ Mn) Comparison by End-User (2016-2032)
- Figure 140: Middle East & Africa Generative AI in the Public Sector Market Y-o-Y Growth Rate Comparison by Country (2016-2032)
- Figure 141: Middle East & Africa Generative AI in the Public Sector Market Y-o-Y Growth Rate Comparison by Deployment Mode (2016-2032)
- Figure 142: Middle East & Africa Generative AI in the Public Sector Market Y-o-Y Growth Rate Comparison by Technology (2016-2032)
- Figure 143: Middle East & Africa Generative AI in the Public Sector Market Y-o-Y Growth Rate Comparison by End-User (2016-2032)
- Figure 144: Middle East & Africa Generative AI in the Public Sector Market Share Comparison by Country (2016-2032)
- Figure 145: Middle East & Africa Generative AI in the Public Sector Market Share Comparison by Deployment Mode (2016-2032)
- Figure 146: Middle East & Africa Generative AI in the Public Sector Market Share Comparison by Technology (2016-2032)
- Figure 147: Middle East & Africa Generative AI in the Public Sector Market Share Comparison by End-User (2016-2032)
- List of Tables
- Table 1: Global Generative AI in the Public Sector Market Comparison by Deployment Mode (2016-2032)
- Table 2: Global Generative AI in the Public Sector Market Comparison by Technology (2016-2032)
- Table 3: Global Generative AI in the Public Sector Market Comparison by End-User (2016-2032)
- Table 4: Global Generative AI in the Public Sector Market Revenue (US$ Mn) Comparison by Region (2016-2032)
- Table 5: Global Generative AI in the Public Sector Market Revenue (US$ Mn) (2016-2032)
- Table 6: Global Generative AI in the Public Sector Market Revenue (US$ Mn) Comparison by Region (2016-2032)
- Table 7: Global Generative AI in the Public Sector Market Revenue (US$ Mn) Comparison by Deployment Mode (2016-2032)
- Figure 8: Global Generative AI in the Public Sector Market Attractiveness Analysis by Region, 2016-2032
- Table 9: Global Generative AI in the Public Sector Market Revenue (US$ Mn) Comparison by End-User (2016-2032)
- Table 10: Global Generative AI in the Public Sector Market Y-o-Y Growth Rate Comparison by Region (2016-2032)
- Table 11: Global Generative AI in the Public Sector Market Y-o-Y Growth Rate Comparison by Deployment Mode (2016-2032)
- Table 12: Global Generative AI in the Public Sector Market Y-o-Y Growth Rate Comparison by Technology (2016-2032)
- Table 13: Global Generative AI in the Public Sector Market Y-o-Y Growth Rate Comparison by End-User (2016-2032)
- Table 14: Global Generative AI in the Public Sector Market Share Comparison by Region (2016-2032)
- Table 15: Global Generative AI in the Public Sector Market Share Comparison by Deployment Mode (2016-2032)
- Table 16: Global Generative AI in the Public Sector Market Share Comparison by Technology (2016-2032)
- Table 17: Global Generative AI in the Public Sector Market Share Comparison by End-User (2016-2032)
- Table 18: North America Generative AI in the Public Sector Market Comparison by Technology (2016-2032)
- Table 19: North America Generative AI in the Public Sector Market Comparison by End-User (2016-2032)
- Table 20: North America Generative AI in the Public Sector Market Revenue (US$ Mn) Comparison by Country (2016-2032)
- Table 21: North America Generative AI in the Public Sector Market Revenue (US$ Mn) (2016-2032)
- Table 22: North America Generative AI in the Public Sector Market Revenue (US$ Mn) Comparison by Country (2016-2032)
- Table 23: North America Generative AI in the Public Sector Market Revenue (US$ Mn) Comparison by Deployment Mode (2016-2032)
- Table 24: North America Generative AI in the Public Sector Market Revenue (US$ Mn) Comparison by Technology (2016-2032)
- Table 25: North America Generative AI in the Public Sector Market Revenue (US$ Mn) Comparison by End-User (2016-2032)
- Table 26: North America Generative AI in the Public Sector Market Y-o-Y Growth Rate Comparison by Country (2016-2032)
- Table 27: North America Generative AI in the Public Sector Market Y-o-Y Growth Rate Comparison by Deployment Mode (2016-2032)
- Table 28: North America Generative AI in the Public Sector Market Y-o-Y Growth Rate Comparison by Technology (2016-2032)
- Table 29: North America Generative AI in the Public Sector Market Y-o-Y Growth Rate Comparison by End-User (2016-2032)
- Table 30: North America Generative AI in the Public Sector Market Share Comparison by Country (2016-2032)
- Table 31: North America Generative AI in the Public Sector Market Share Comparison by Deployment Mode (2016-2032)
- Table 32: North America Generative AI in the Public Sector Market Share Comparison by Technology (2016-2032)
- Table 33: North America Generative AI in the Public Sector Market Share Comparison by End-User (2016-2032)
- Table 34: Western Europe Generative AI in the Public Sector Market Comparison by Deployment Mode (2016-2032)
- Table 35: Western Europe Generative AI in the Public Sector Market Comparison by Technology (2016-2032)
- Table 36: Western Europe Generative AI in the Public Sector Market Comparison by End-User (2016-2032)
- Table 37: Western Europe Generative AI in the Public Sector Market Revenue (US$ Mn) Comparison by Country (2016-2032)
- Table 38: Western Europe Generative AI in the Public Sector Market Revenue (US$ Mn) (2016-2032)
- Table 39: Western Europe Generative AI in the Public Sector Market Revenue (US$ Mn) Comparison by Country (2016-2032)
- Table 40: Western Europe Generative AI in the Public Sector Market Revenue (US$ Mn) Comparison by Deployment Mode (2016-2032)
- Table 41: Western Europe Generative AI in the Public Sector Market Revenue (US$ Mn) Comparison by Technology (2016-2032)
- Table 42: Western Europe Generative AI in the Public Sector Market Revenue (US$ Mn) Comparison by End-User (2016-2032)
- Table 43: Western Europe Generative AI in the Public Sector Market Y-o-Y Growth Rate Comparison by Country (2016-2032)
- Table 44: Western Europe Generative AI in the Public Sector Market Y-o-Y Growth Rate Comparison by Deployment Mode (2016-2032)
- Table 45: Western Europe Generative AI in the Public Sector Market Y-o-Y Growth Rate Comparison by Technology (2016-2032)
- Table 46: Western Europe Generative AI in the Public Sector Market Y-o-Y Growth Rate Comparison by End-User (2016-2032)
- Table 47: Western Europe Generative AI in the Public Sector Market Share Comparison by Country (2016-2032)
- Table 48: Western Europe Generative AI in the Public Sector Market Share Comparison by Deployment Mode (2016-2032)
- Table 49: Western Europe Generative AI in the Public Sector Market Share Comparison by Technology (2016-2032)
- Table 50: Western Europe Generative AI in the Public Sector Market Share Comparison by End-User (2016-2032)
- Table 51: Eastern Europe Generative AI in the Public Sector Market Comparison by Deployment Mode (2016-2032)
- Table 52: Eastern Europe Generative AI in the Public Sector Market Comparison by Technology (2016-2032)
- Table 53: Eastern Europe Generative AI in the Public Sector Market Comparison by End-User (2016-2032)
- Table 54: Eastern Europe Generative AI in the Public Sector Market Revenue (US$ Mn) Comparison by Country (2016-2032)
- Table 55: Eastern Europe Generative AI in the Public Sector Market Revenue (US$ Mn) (2016-2032)
- Table 56: Eastern Europe Generative AI in the Public Sector Market Revenue (US$ Mn) Comparison by Country (2016-2032)
- Table 57: Eastern Europe Generative AI in the Public Sector Market Revenue (US$ Mn) Comparison by Deployment Mode (2016-2032)
- Table 58: Eastern Europe Generative AI in the Public Sector Market Revenue (US$ Mn) Comparison by Technology (2016-2032)
- Table 59: Eastern Europe Generative AI in the Public Sector Market Revenue (US$ Mn) Comparison by End-User (2016-2032)
- Table 60: Eastern Europe Generative AI in the Public Sector Market Y-o-Y Growth Rate Comparison by Country (2016-2032)
- Table 61: Eastern Europe Generative AI in the Public Sector Market Y-o-Y Growth Rate Comparison by Deployment Mode (2016-2032)
- Table 62: Eastern Europe Generative AI in the Public Sector Market Y-o-Y Growth Rate Comparison by Technology (2016-2032)
- Table 63: Eastern Europe Generative AI in the Public Sector Market Y-o-Y Growth Rate Comparison by End-User (2016-2032)
- Table 64: Eastern Europe Generative AI in the Public Sector Market Share Comparison by Country (2016-2032)
- Table 65: Eastern Europe Generative AI in the Public Sector Market Share Comparison by Deployment Mode (2016-2032)
- Table 66: Eastern Europe Generative AI in the Public Sector Market Share Comparison by Technology (2016-2032)
- Table 67: Eastern Europe Generative AI in the Public Sector Market Share Comparison by End-User (2016-2032)
- Table 68: APAC Generative AI in the Public Sector Market Comparison by Deployment Mode (2016-2032)
- Table 69: APAC Generative AI in the Public Sector Market Comparison by Technology (2016-2032)
- Table 70: APAC Generative AI in the Public Sector Market Comparison by End-User (2016-2032)
- Table 71: APAC Generative AI in the Public Sector Market Revenue (US$ Mn) Comparison by Country (2016-2032)
- Table 72: APAC Generative AI in the Public Sector Market Revenue (US$ Mn) (2016-2032)
- Table 73: APAC Generative AI in the Public Sector Market Revenue (US$ Mn) Comparison by Country (2016-2032)
- Table 74: APAC Generative AI in the Public Sector Market Revenue (US$ Mn) Comparison by Deployment Mode (2016-2032)
- Table 75: APAC Generative AI in the Public Sector Market Revenue (US$ Mn) Comparison by Technology (2016-2032)
- Table 76: APAC Generative AI in the Public Sector Market Revenue (US$ Mn) Comparison by End-User (2016-2032)
- Table 77: APAC Generative AI in the Public Sector Market Y-o-Y Growth Rate Comparison by Country (2016-2032)
- Table 78: APAC Generative AI in the Public Sector Market Y-o-Y Growth Rate Comparison by Deployment Mode (2016-2032)
- Table 79: APAC Generative AI in the Public Sector Market Y-o-Y Growth Rate Comparison by Technology (2016-2032)
- Table 80: APAC Generative AI in the Public Sector Market Y-o-Y Growth Rate Comparison by End-User (2016-2032)
- Table 81: APAC Generative AI in the Public Sector Market Share Comparison by Country (2016-2032)
- Table 82: APAC Generative AI in the Public Sector Market Share Comparison by Deployment Mode (2016-2032)
- Table 83: APAC Generative AI in the Public Sector Market Share Comparison by Technology (2016-2032)
- Table 84: APAC Generative AI in the Public Sector Market Share Comparison by End-User (2016-2032)
- Table 85: Latin America Generative AI in the Public Sector Market Comparison by Deployment Mode (2016-2032)
- Table 86: Latin America Generative AI in the Public Sector Market Comparison by Technology (2016-2032)
- Table 87: Latin America Generative AI in the Public Sector Market Comparison by End-User (2016-2032)
- Table 88: Latin America Generative AI in the Public Sector Market Revenue (US$ Mn) Comparison by Country (2016-2032)
- Table 89: Latin America Generative AI in the Public Sector Market Revenue (US$ Mn) (2016-2032)
- Table 90: Latin America Generative AI in the Public Sector Market Revenue (US$ Mn) Comparison by Country (2016-2032)
- Table 91: Latin America Generative AI in the Public Sector Market Revenue (US$ Mn) Comparison by Deployment Mode (2016-2032)
- Table 92: Latin America Generative AI in the Public Sector Market Revenue (US$ Mn) Comparison by Technology (2016-2032)
- Table 93: Latin America Generative AI in the Public Sector Market Revenue (US$ Mn) Comparison by End-User (2016-2032)
- Table 94: Latin America Generative AI in the Public Sector Market Y-o-Y Growth Rate Comparison by Country (2016-2032)
- Table 95: Latin America Generative AI in the Public Sector Market Y-o-Y Growth Rate Comparison by Deployment Mode (2016-2032)
- Table 96: Latin America Generative AI in the Public Sector Market Y-o-Y Growth Rate Comparison by Technology (2016-2032)
- Table 97: Latin America Generative AI in the Public Sector Market Y-o-Y Growth Rate Comparison by End-User (2016-2032)
- Table 98: Latin America Generative AI in the Public Sector Market Share Comparison by Country (2016-2032)
- Table 99: Latin America Generative AI in the Public Sector Market Share Comparison by Deployment Mode (2016-2032)
- Table 100: Latin America Generative AI in the Public Sector Market Share Comparison by Technology (2016-2032)
- Table 101: Latin America Generative AI in the Public Sector Market Share Comparison by End-User (2016-2032)
- Table 102: Middle East & Africa Generative AI in the Public Sector Market Comparison by Deployment Mode (2016-2032)
- Table 103: Middle East & Africa Generative AI in the Public Sector Market Comparison by Technology (2016-2032)
- Table 104: Middle East & Africa Generative AI in the Public Sector Market Comparison by End-User (2016-2032)
- Table 105: Middle East & Africa Generative AI in the Public Sector Market Revenue (US$ Mn) Comparison by Country (2016-2032)
- Table 106: Middle East & Africa Generative AI in the Public Sector Market Revenue (US$ Mn) (2016-2032)
- Table 107: Middle East & Africa Generative AI in the Public Sector Market Revenue (US$ Mn) Comparison by Country (2016-2032)
- Table 108: Middle East & Africa Generative AI in the Public Sector Market Revenue (US$ Mn) Comparison by Deployment Mode (2016-2032)
- Table 109: Middle East & Africa Generative AI in the Public Sector Market Revenue (US$ Mn) Comparison by Technology (2016-2032)
- Table 110: Middle East & Africa Generative AI in the Public Sector Market Revenue (US$ Mn) Comparison by End-User (2016-2032)
- Table 111: Middle East & Africa Generative AI in the Public Sector Market Y-o-Y Growth Rate Comparison by Country (2016-2032)
- Table 112: Middle East & Africa Generative AI in the Public Sector Market Y-o-Y Growth Rate Comparison by Deployment Mode (2016-2032)
- Table 113: Middle East & Africa Generative AI in the Public Sector Market Y-o-Y Growth Rate Comparison by Technology (2016-2032)
- Table 114: Middle East & Africa Generative AI in the Public Sector Market Y-o-Y Growth Rate Comparison by End-User (2016-2032)
- Table 115: Middle East & Africa Generative AI in the Public Sector Market Share Comparison by Country (2016-2032)
- Table 116: Middle East & Africa Generative AI in the Public Sector Market Share Comparison by Deployment Mode (2016-2032)
- Table 117: Middle East & Africa Generative AI in the Public Sector Market Share Comparison by Technology (2016-2032)
- Table 118: Middle East & Africa Generative AI in the Public Sector Market Share Comparison by End-User (2016-2032)
- 1. Executive Summary
Inquiry Form
Why Choose Us
- 360 Degree Approach
- Growth Consulting
- 24/7 Research Support
- Comprehensive-Level of Customization
- Competitive Intelligence
- Single-Country/ Region Intelligence
- Post-Sale Service Assistance
- Access to Lead Analysts
- Available in PDF, Excel, Word/ PPT
Request for Customization
OUR CLIENTS
Don't just take our word. We are trusted by these great companies!